Abstract
How to select the transmitting path in MPTCP scheduling is an important but open problem. This paper proposes an intelligent data scheduling algorithm using spatiotemporal synchronous graph attention neural networks to improve MPTCP scheduling. By exploiting the spatiotemporal correlations in the data transmission process and incorporating graph self-attention mechanisms, the algorithm can quickly select the optimal transmission path and ensure fairness among similar links. Through simulations in NS3, the algorithm achieves a throughput gain of 7.9% compared to the PDAA3C algorithm and demonstrates improved packet transmission performance.
1. Introduction
Given the rapid development of communication and networking technologies, it has become customary for mobile devices to be equipped with multiple network interfaces, which cater to a wide range of network access technologies. Furthermore, in light of emerging technologies such as virtual reality and real-time streaming, there is a growing need among users for enhanced network bandwidth and minimized end-to-end transmission latency. To achieve multi-link transmission, the Internet Engineering Task Force (IETF) has introduced the Multipath TCP (MPTCP) protocol [1,2]. As an extension of the traditional transmission control protocol (TCP), the MPTCP protocol is compatible with existing network architectures and protocols. It provides the ability to aggregate capacity across multiple links and maintain connectivity in the event of a single path failure.
Data scheduling plays a fundamental role in the Multipath TCP protocol [3,4], as it governs the packet transmission flow and guarantees equitable treatment across various links. In order to enhance both subflow throughput and fairness within the Multipath TCP framework, several conventional scheduling algorithms have been introduced, such as round-robin [5], Fastest-RTT, and Average-RTT [6]. The round-robin algorithm divides the incoming data at the application layer into individual packets and assigns them to available subflows in a round-robin fashion for transmission. The Fastest-RTT algorithm is an extension of the round-robin approach, wherein packet allocation is determined by the ordering of round-trip time (RTT) values associated with each available subflow. This algorithm prioritizes assigning packets to the subflow with the minimum RTT until its congestion window reaches capacity. Subsequently, it continues to allocate packets to the subflow with the next lowest RTT value. Average-RTT, an improvement over Fastest-RTT, assigns packets based on the order of the average RTT of each available subflow, making the packet allocation more intelligent. These packet scheduling strategies frequently exhibit throughput fluctuations in networks with high packet loss rates, thereby leading to a notable escalation in end-to-end latency, even in scenarios characterized by low loss rates.
Indeed, in certain heterogeneous multi-link network environments, there are significant differences among various service metrics such as bandwidth, round-trip time (RTT), packet loss rate, and throughput between different links. Each link may have different transmission efficiencies. If MPTCP scheduling strategies do not consider the influence of these complex factors in heterogeneous networks and continue to schedule based on ideal conditions, It can give rise to substantial performance concerns. For instance, in a heterogeneous network environment where packets undergo multiplexing across multiple paths, exhibiting notable latency discrepancies (e.g., WiFi and LTE), improper packet scheduling can give rise to the issue of head-of-line (HOL) blocking [7]. Another example occurs when packets allocated to low-latency paths encounter delays due to the necessity of waiting for packets transmitted over high-latency paths, thereby ensuring ordered delivery. Therefore, it is crucial in the field of network communication to develop appropriate scheduling strategies for MPTCP packets that enhance bandwidth, reduce end-to-end latency, and maximize network resource utilization.
Researchers have employed heuristic algorithms to design data scheduling algorithms for heterogeneous network environments. One such algorithm is SB-FPS (subflow-based fair packet scheduling) [8]. SB-FPS allocates data based on the window size variations of each subflow, enabling more accurate scheduling of data in shared bottleneck scenarios. Simulation results and real network tests have demonstrated that SB-FPS outperforms the default MPTCP algorithm, achieving a 6% increase in throughput. Additionally, it has validated the correctness of allocating data packets based on channel conditions.
With the development of artificial intelligence, there has been an increasing number of studies applying deep reinforcement learning techniques to computer network optimization research. Luo et al. [9,10] utilized the DQN framework to enhance the performance of MPTCP by analyzing path information and using the transmission results as parameters for the reward function.
However, these deep reinforcement learning methods overlook the spatiotemporal correlation during the MPTCP transmission process. The link contains valuable channel data information at each moment, and the channel data exhibit temporal correlation along the time axis. From a vertical perspective, there are differences between the subflow states at each moment. We can abstract each subflow as a node on the graph and extract the spatial correlation between subflows based on their abstract relationships. For example, when a data packet arrives at a certain moment, the relationship between subflows can serve as the basis for selecting the link for the packet. The correlation between links can optimize the network environment as a whole and improve overall transmission efficiency. Graph neural networks are well-suited for this task requirement.
Therefore, within the scope of this research article, we introduce a novel multipath scheduling algorithm, namely PDASTSGAT (path diversity-aware spatial–temporal graph attention network), which leverages spatial–temporal synchronous graph convolutional networks [11]. It addresses the network scenario where packets of different sizes traverse the links by using a graph convolutional neural network to analyze the current state of the links in real time and allocate different-sized packets. This improves the utilization of link resources and enhances the throughput and stability of MPTCP links. The design objectives of PDASTSGAT are as follows: (1) Utilize graph attention neural networks to analyze packet sizes and link states and allocate transmission resources to the corresponding links, thereby enhancing link throughput. (2) Address fairness issues in link performance by distributing transmission resources appropriately and balancing the throughput of each link. We evaluated the proposed PDASTSGAT algorithm through simulations. The results demonstrate that when there are significant performance differences among links, PDASTSGAT outperforms scheduling algorithms such as round-robin, Average-RTT, Fast-RTT, and PDAA3C [12] in terms of transmission performance. It achieves throughput improvements ranging from 8% to 14% compared to PDAA3C. One of the characteristics of STSGAT is its ability to ensure subflow fairness by selecting the optimal subflow based on the current subflow quality and the learned experiences of the model when data packets need to be transmitted.
2. System Model
Figure 1 illustrates the structure of the PDASTSGAT-MPTCP algorithm, which consists of an MPTCP server, a link splitting mechanism, an MPTCP client, N links, and their corresponding link states. To select the optimal subflow, the packet-splitting mechanism utilizes the link states of the individual subflows and determines the best link choice for the current data packet. The notations for this article are shown in Table 1.
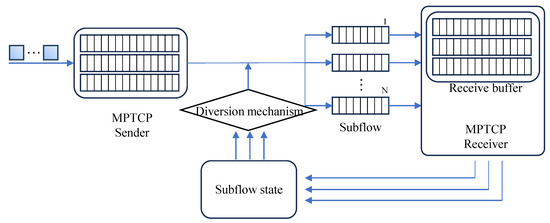
Figure 1.
System model.

Table 1.
Notations.
The primary objective of the overall system design is to determine the optimal transmission path from a set of multiple subflows. The exposition pertaining to the management and scheduling of multiple paths is as follows:
- 1.
- Obtaining the subflow state: The MPTCP server concurrently distributes packets to established subflows and transmits them to the MPTCP client [10]. At the MPTCP client, we can retrieve the current state matrix for each individual subflow.
- 2.
- The mechanism for packet-splitting: The current state matrix, obtained for each subflow, combined with the localized spatiotemporal graph, , representing the local spatial–temporal graph and the transmitted packet information, forms the input at the current time step. By utilizing the learned link graph spatial–temporal features through the packet-splitting mechanism, the optimal link selection for the current packet is determined.
- 3.
- Updating the subflow state: The packets are distributed to the optimal subflow, and the MPTCP client updates the current state of each subflow and the subsequent subflow state matrix for the next time step.
3. PDASTSGAT
In response to the problem described in Section 2, we propose a diversion mechanism called the spatiotemporal synchronous graph attention neural network (STSGAT). STSGAT is based on spatiotemporal graph neural networks and leverages the spatiotemporal correlations during data transmission. By incorporating graph self-attention mechanisms, STSGAT selects the optimal transmission path. We summarize the core ideas of PDASTSGAT (Figure 2) as follows:
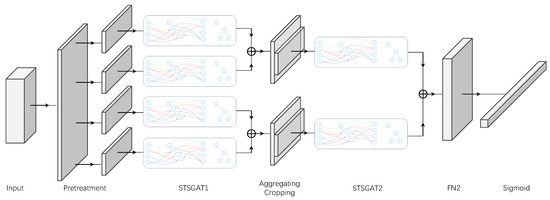
Figure 2.
PDASTSGAT architecture. Our PDASTSGAT consists of an input layer, an output layer, and multiple spatiotemporal synchronous graph attention neural networks (STSGATs) with aggregating and cropping layers.
- In the previous and following steps, we connect each node to itself, constructing a localized spatiotemporal graph.
- We employ the spatiotemporal synchronized graph attention module to capture local spatiotemporal correlations.
- We deploy multiple modules to model the heterogeneity of the spatiotemporal network sequence.
3.1. Pre-Treatment
We initialize spatiotemporal embeddings to connect nodes at different time steps into a single graph, which can blur the temporal attributes of each node. In this localized spatiotemporal graph representation, nodes originating from various time steps are situated within a shared context, devoid of any temporal differentiation. Through the utilization of ConvS2S [13], we incorporate a spatiotemporal self-attention matrix into the spatiotemporal link state sequence, thereby equipping the model with the ability to simultaneously consider spatial and temporal information. This augmentation significantly enhances the model’s capacity to capture and model spatiotemporal correlations. For the spatiotemporal network sequence, , we introduce a learnable time embedding matrix, , and a learnable spatial embedding matrix, . We incorporate these two embedding matrices into the spatial–temporal network series through a broadcast operation, yielding updated representations of the network series, as follows:
where N denotes the number of nodes, C represents the number of features, and T indicates the length of time slots.
3.2. Spatiotemporal Synchronous Graph Attention Neural Networks
Assuming the MPTCP subflows are feature-rich nodes, we establish a model capable of directly capturing the influence exerted by each node on its neighbors, including those in the current time step as well as adjacent time steps. The most straightforward approach to accomplish this is to establish connections between each node and its counterparts in the neighboring time steps. By establishing connections between each node and its corresponding self in the preceding and subsequent time steps, a localized spatiotemporal graph can be formed. Leveraging the topology of this localized spatiotemporal graph, we can directly extract the correlations between each node and its spatially and temporally adjacent neighbors [14].
The adjacency matrix of the spatial graph is denoted as . Meanwhile, the adjacency matrix of the localized spatiotemporal graph, which is constructed by considering three consecutive spatial graphs, is represented as . For a given node, i, within the spatial domain graph, its updated representation in the localized spatiotemporal graph can be computed using , where denotes the time step within the localized spatiotemporal graph. If there exists a substantial correlation between two nodes within the localized spatiotemporal graph, the corresponding entry in the adjacency matrix tends to approach a value of 1, .
The adjacency matrix, comprises 3N nodes. The diagonal elements of the adjacency matrix represent the adjacency matrices of the spatial networks encompassing three consecutive time steps. Additionally, the off-diagonal regions of the matrix depict the connectivity between each node and itself across the neighboring time steps.
Compared to previous spatial–temporal synchronous graph convolutional networks, directly analyzing features using a mask matrix [11] consumes significant computational resources, especially when the number of nodes reaches a certain level and the spatial structure becomes complex. This results in increased training time and a higher number of iterations. To optimize spatial feature analysis, we introduce a graph attention network to model spatial features. The attention mechanism is formulated as follows [15]:
where represents the correlation between node j and node i, represents the result of normalization. denotes the weight vector utilized within the identical self-attention mechanism to calculate the attention coefficients pertaining to neighboring nodes with respect to a specific node, . W corresponds to the trainable parameter matrix within the neural network, and it performs a linear transformation on all inputs (node feature matrix), . represents the node feature matrix with a consistent dimension after the linear transformation. is the node feature matrix of one node in the STSGAT network, . is the feature matrix of the neighbor nodes of the node, . F denotes the initial dimension of the node features and represents the matrix concatenation operation.
In order to calculate the attention coefficients of neighboring nodes with respect to the central node, the attention obtained from the self-attention mechanism is subjected to nonlinearity through the application of the LeakyReLU function. To ensure comparability among the attention coefficients of neighboring nodes with regard to the central node, we employ the softmax function to normalize these coefficients. The output features of each node are computed using the normalized attention coefficients, as follows:
where is the ELU nonlinear activation function, and is the output feature of the ith node in the STSGAT.
To enhance the stability of the self-attention mechanism, we incorporate the multi-head attention mechanism [16] for spatial feature extraction. This integration serves to mitigate any potential loss in the spatial information captured by the graph attention network (GAT), ensuring a more robust and reliable performance. The output features acquired from the K attention heads are concatenated according to the following expression:
where denotes the output feature of node i in the multi-head attention mechanism of the STSGAT network. K represents the number of self-attention mechanisms, signifies the correlation between node j and node i under the kth self-attention mechanism, and denotes the weight matrix corresponding to the kth self-attention mechanism.
3.3. Aggregating and Cropping
Max pooling is employed as the aggregation operation, which involves applying a max pooling operation to the outputs of all graph convolutions in STSGAT. To ensure compatibility with max pooling, it is necessary for all outputs to possess the same size. Consequently, in a module’s graph convolution operation, the number of kernels should be equal. The max pooling aggregation operation can be expressed as follows:
The cropping operation selectively preserves nodes from the intermediate time step. It discards features associated with nodes from the preceding and succeeding time steps. This approach is adopted due to the inherent capacity of the graph convolution operation to assimilate information from both preceding and subsequent time steps.
Even with the cropping of two time steps, each node still retains local spatiotemporal correlations. If multiple layers of STSGAT are sequentially stacked, while retaining features from all neighboring time steps, it would lead to a substantial redundancy in the model, thereby significantly jeopardizing its overall performance.
The complete details of the PDASTSGAT-MPTCP algorithm design are presented in Algorithm 1. The training process for the data is as follows:
- 1.
- For the spatiotemporal network sequence, we first incorporate packet-level features to obtain . We create a learnable time embedding matrix, , and a learnable spatial embedding matrix, . We then incorporate these two embedding matrices into the spatiotemporal network sequence through matrix operations, updating .
- 2.
- By applying a fully connected neural network, we transform the feature dimension of , resulting in .
- 3.
- We construct the weight matrix, , to represent the localized spatiotemporal graph, where is the adjacency matrix A of the spatial network from three consecutive time steps. The regions adjacent to the diagonal illustrate the connectivity of each node over neighboring time steps, including its connection with itself, .
- 4.
- The convolution operation between the spatial weight matrix A and the feature vector yields the output, which is stored in .
- 5.
- The maximum pooling aggregation operation is applied to the outputs of all graph convolutions in STSGAT. The maximum pooling aggregation can be represented as .... To isolate the nodes at the intermediate time step, the features corresponding to the preceding and subsequent time steps are excluded. Finally, the result is passed through a fully connected layer, and the training result is activated using the sigmoid function to obtain the sub-flow selection sequence.
| Algorithm 1 Path dynamics assessment with the spatial–temporal synchronous graph convolutional network algorithm. |
|
4. Evaluation
4.1. Simulation Environment
The performance evaluation was carried out using NS3.29 and PyCharm 2020.3.5 x64 as the development environment. The NS3 implementation encompasses the fundamental MPTCP module along with the round-robin algorithm, Average-RTT, Fastest-RTT, and PDAA3C scheduling algorithms. The PyCharm implementation involves a deep learning packet scheduler based on a spatiotemporal graph convolutional neural network algorithm. The simulated topology consists of a client and a server. The client and server are connected through four asymmetric and independent paths. Path 1, Path 2, and Path 4 are configured with a bandwidth of 2 Mbps and a delay of 10 ms, while Path 3 is configured with a bandwidth of 4 Mbps and a delay of 10 ms. The remaining configurations of the links are provided in Table 2.
Table 2.
Link performance parameters.
To reflect the reliability of addressing the low link resource utilization issue in an asymmetric path environment in this experiment, a pointer was set in the MPTCP module of NS3 to capture the link status and ensure data integrity. Additionally, the congestion control algorithm used in the experiment was the MPTCP-BBR algorithm, which prevents data unreliability caused by severe congestion on the paths.
4.2. Simulation Results
Figure 3 presents the simulation results of subflow throughput, wherein a comparison is made among the MPTCP-RLDS, MPTCP-round-robin, MPTCP-Fastest-RTT, MPTCP-PDAA3C, and MPTCP-PDASTSGAT algorithms. In the figure, the subflow throughput of the MPTCP-PDASTSGAT algorithm outperforms the MPTCP-PDAA3C algorithm by 8.6%, outperforms the MPTCP-RLDS algorithm by 8.9%, surpasses the MPTCP-round-robin algorithm by 49.6%, exceeds the MPTCP-Fastest-RTT algorithm by 52.6%, and approaches the theoretically optimal value of throughput. In the multipath transmission simulation experiment, PDASTSGAT selects the optimal path by combining packet information and the overall spatiotemporal characteristics of the links when transmitting data packets. Therefore, MPTCP-PDASTSGAT achieves higher throughput. We utilize the Jain fairness index to compare the fairness of the links [12]. Figure 4 presents a comparison of subflow fairness values among MPTCP-RLDS, MPTCP-round-robin, MPTCP-Fastest-RTT, MPTCP-PDAA3C, and MPTCP-PDASTSGAT. Due to the consideration of spatiotemporal data relationships during data transmission, MPTCP-PDASTSGAT exhibits slightly better subflow fairness compared to the other approaches.
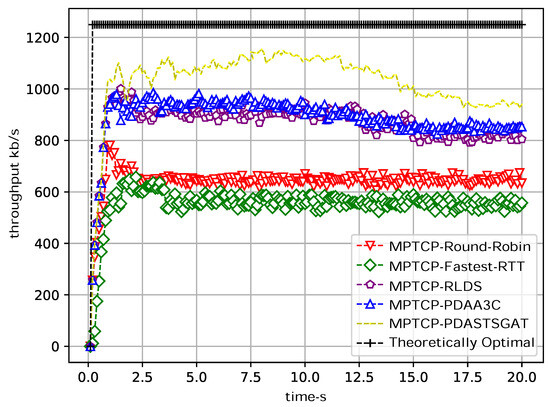
Figure 3.
Comparison of the subflow throughput results of the five algorithms. In our simulation setup, the throughput is sampled at regular intervals of 100 ms, resulting in a subflow selection process occurring at both the sender and receiver sides every 100 ms. The specific interval for capturing subflow throughput can be flexibly configured within the NS3 framework.
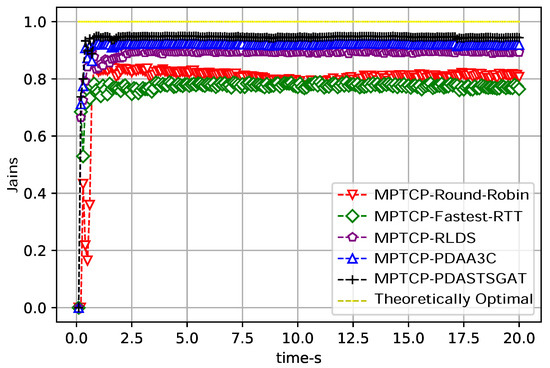
Figure 4.
Subflow fairness simulation results of the five algorithms. The value range of Jain’s fairness index is . When the value is 1, it indicates absolute fairness. When the value is , the entire system is completely unfair. n denotes the number of subflow.
4.3. Model Complexity Comparison
This article constructs a graph neural network model based on PyTorch. The cross-entropy loss function is used for loss calculation, and the Adam optimizer is employed to update the parameter matrices of the network. The learning rate is set at 0.003. The following figure presents a comparison of different approaches for model training. Graph WaveNet [17] incorporates two distinct modules to effectively capture spatial dependencies and temporal correlations in a separate manner, resulting in inferior training performance compared to STSGCN and PDASTSGAT. By introducing graph attention mechanisms, our model can achieve faster convergence.
As shown in Figure 5, it can be observed that the loss value stabilizes when the number of iterations reaches 48. This indicates that the graph neural network architecture we constructed performs well in classifying feature subgraphs, with fast convergence speed and high training efficiency.
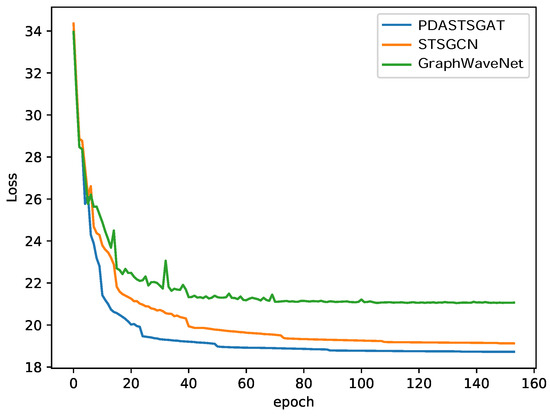
Figure 5.
Loss value—iteration number curve. In our study, we employ the cross-entropy loss function to compute the discrepancy between the predicted subflow and the optimal subflow. A smaller value of the loss function indicates a reduced disparity between the predicted results and the ground truth values, thereby indicating the superior performance of the model.
In summary, PDASTSGAT outperforms round-robin, Average-RTT, FastRTT, RLDS and PDAA3C scheduling algorithms in MPTCP transmission simulations, achieving better transmission performance. It exhibits significant improvements in throughput and ensures a relatively fair allocation of transmission resources among links. In model training experiments, PDASTSGAT outperforms Graph WaveNet and STSGCN in the classification of feature subgraphs, thanks to its incorporation of a multi-head attention mechanism. Furthermore, PDASTSGAT exhibits fast convergence speed and high training efficiency.
5. Conclusions
This study integrates graph neural networks with the MPTCP protocol and conducts simulations to implement it. A novel multipath scheduling algorithm, namely PDASTSGAT, is proposed, leveraging the graph neural network algorithm. The algorithm focuses on augmenting the throughput of multipath transmission while ensuring fairness among links. Compared to MPTCP, MPTCP-PDASTSGAT incorporates a packet scheduler called PDASTSGAT based on a graph convolutional neural network algorithm, which utilizes the spatiotemporal characteristics of links to distribute and send packets to the optimal subflow path within the link. It optimizes the spatial structural relationships to facilitate the selection of the optimal subflow path. Simulation results demonstrate that under asymmetric path conditions, MPTCP-PDASTSGAT outperforms other traditional methods in terms of transmission performance. However, it is worth noting that PDASTSGAT has certain limitations. For instance, its performance may be influenced by specific network topologies or traffic patterns, and further investigation is needed to assess its effectiveness in such scenarios. Despite these limitations, PDASTSGAT has shown promising results in extracting spatiotemporal feature directions. These findings will contribute to the improvement and expansion of MPTCP data scheduling in the future.
Author Contributions
Conceptualization, S.X., C.W. and A.Z.; Methodology, S.X.; Software, S.X.; Validation, C.W.; Formal analysis, S.X.; Investigation, J.H.; Data curation, J.H.; Writing—original draft, S.X.; Writing—review & editing, C.W. and A.Z.; Visualization, J.H.; Supervision, A.Z.; Project administration, A.Z.; Funding acquisition, C.W. and J.H. All authors have read and agreed to the published version of the manuscript.
Funding
This research was funded by the Open Fund of the Key Laboratory of Big Data Intelligent Computing, Chongqing University of Posts and Telecommunications, under grant no. BDIC-2023-B-002.
Data Availability Statement
Data available on request from the authors.
Conflicts of Interest
Author Jing Han was employed by the company Hangzhou Mergex Technology Co., Ltd. The remaining authors declare that the research was conducted in the absence of any commercial or financial relationships that could be construed as a potential conflict of interest.
References
- Li, M.; Lukyanenko, A.; Ou, Z.; Ylä-Jääski, A.; Tarkoma, S.; Coudron, M.; Secci, S. Multipath Transmission for the Internet: A Survey. IEEE Commun. Surv. Tutorials 2016, 18, 2887–2925. [Google Scholar] [CrossRef]
- Raiciu, C.; Barre, S.; Pluntke, C.; Greenhalgh, A.; Wischik, D.; Handley, M. Improving datacenter performance and robustness with multipath TCP. In Proceedings of the ACM SIGCOMM 2011, Toronto, ON, Canada, 15–19 August 2011; pp. 266–277. [Google Scholar] [CrossRef]
- Kimura, B.Y.; Lima, D.C.; Loureiro, A.A. Packet scheduling in multipath TCP: Fundamentals, lessons, and opportunities. IEEE Syst. J. 2020, 15, 1445–1457. [Google Scholar] [CrossRef]
- Asiri, M.Y. A survey of multipath TCP scheduling schemes: Open challenges and potential enablers. TechRxiv 2023. [Google Scholar] [CrossRef]
- Paasch, C.; Ferlin, S.; Alay, O.; Bonaventure, O. Experimental evaluation of multipath TCP schedulers. In Proceedings of the 2014 ACM SIGCOMM Workshop on Capacity Sharing Workshop, Chicago, IL, USA, 18 August 2014; pp. 27–32. [Google Scholar] [CrossRef]
- Lübben, R.; Morgenroth, J. An Odd Couple: Loss-Based Congestion Control and Minimum RTT Scheduling in MPTCP. In Proceedings of the 2019 IEEE 44th Conference on Local Computer Networks (LCN), Osnabrueck, Germany, 14–17 October 2019; pp. 300–307. [Google Scholar] [CrossRef]
- Lim, Y.s.; Nahum, E.M.; Towsley, D.; Gibbens, R.J. ECF: An MPTCP Path Scheduler to Manage Heterogeneous Paths. In Proceedings of the 13th International Conference on Emerging Networking EXperiments and Technologies, Incheon, Republic of Korea, 12–15 December 2017. [Google Scholar] [CrossRef]
- Wei, W.; Xue, K.; Han, J.; Xing, Y.; Wei, D.S.L.; Hong, P. BBR-Based Congestion Control and Packet Scheduling for Bottleneck Fairness Considered Multipath TCP in Heterogeneous Wireless Networks. IEEE Trans. Veh. Technol. 2021, 70, 914–927. [Google Scholar] [CrossRef]
- Luo, J.; Su, X.; Liu, B. A Reinforcement Learning Approach for Multipath TCP Data Scheduling. In Proceedings of the 2019 IEEE 9th Annual Computing and Communication Workshop and Conference (CCWC), Las Vegas, NV, USA, 7–9 January 2019; pp. 0276–0280. [Google Scholar] [CrossRef]
- Wu, H.; Alay, Ö.; Brunstrom, A.; Ferlin, S.; Caso, G. Peekaboo: Learning-based multipath scheduling for dynamic heterogeneous environments. IEEE J. Sel. Areas Commun. 2020, 38, 2295–2310. [Google Scholar] [CrossRef]
- Song, C.; Lin, Y.; Guo, S.; Wan, H. Spatial-Temporal Synchronous Graph Convolutional Networks: A New Framework for Spatial-Temporal Network Data Forecasting. Proc. Aaai Conf. Artif. Intell. 2020, 34, 914–921. [Google Scholar] [CrossRef]
- Liang, T.; Zhan, A.; Wu, C.; Wang, Z. PDAA3C: An A3C-Based Multi-Path Data Scheduling Algorithm. IEICE Trans. Inform. 2022, E105-D, 2127–2130. [Google Scholar] [CrossRef]
- Kameoka, H.; Tanaka, K.; Kwaśny, D.; Kaneko, T.; Hojo, N. ConvS2S-VC: Fully Convolutional Sequence-to-Sequence Voice Conversion. IEEE/ACM Trans. Audio Speech Lang. Process. 2020, 28, 1849–1863. [Google Scholar] [CrossRef]
- Yan, S.; Xiong, Y.; Lin, D. Spatial temporal graph convolutional networks for skeleton-based action recognition. In Proceedings of the AAAI conference on artificial intelligence, New Orleans, LA, USA, 2–7 February 2018. [Google Scholar]
- Veličković, P.; Cucurull, G.; Casanova, A.; Romero, A.; Lio, P.; Bengio, Y. Graph Attention Networks. Stat 2017, 1050, 10-48550. [Google Scholar]
- Zhang, Q.; Li, C.; Su, F.; Li, Y. Spatiotemporal Residual Graph Attention Network for Traffic Flow Forecasting. IEEE Internet Things J. 2023, 10, 11518–11532. [Google Scholar] [CrossRef]
- Wu, Z.; Pan, S.; Long, G.; Jiang, J.; Zhang, C. Graph WaveNet for Deep Spatial-Temporal Graph Modeling. arXiv 2019, arXiv:1906.00121. [Google Scholar]
Disclaimer/Publisher’s Note: The statements, opinions and data contained in all publications are solely those of the individual author(s) and contributor(s) and not of MDPI and/or the editor(s). MDPI and/or the editor(s) disclaim responsibility for any injury to people or property resulting from any ideas, methods, instructions or products referred to in the content. |
© 2024 by the authors. Licensee MDPI, Basel, Switzerland. This article is an open access article distributed under the terms and conditions of the Creative Commons Attribution (CC BY) license (https://creativecommons.org/licenses/by/4.0/).