Abstract
This work discusses the electric vehicle (EV) ordered charging planning (OCP) optimization problem. To address this issue, an improved dual-population genetic moth–flame optimization (IDPGMFO) is proposed. Specifically, to obtain an appreciative solution of EV OCP, the design for a dual-population genetic mechanism integrated into moth–flame optimization is provided. To enhance the global optimization performance, the adaptive nonlinear decreasing strategies with selection, crossover and mutation probability, as well as the weight coefficient, are also designed. Additionally, opposition-based learning (OBL) is also introduced simultaneously. The simulation results show that the proposed improvement strategies can effectively improve the global optimization performance. Obviously, more ideal optimization solution of the EV OCP optimization problem can be obtained by using IDPGMFO.
1. Introduction
Electric vehicles are widely used in people’s daily travel, and are not only conducive to environmental protection, but also can save energy effectively [1]. In large cities, electric vehicles (EVs) will become more important in future economic life [2,3].
There is a lack of effective precise EVs charging forecast algorithms, so the disordered charging of electric vehicle cluster is currently popular; however, this method of charging is not conducive to meeting high-quality practical demands [4]. Currently, the EV OCP optimization issue has become a significant and difficult topic for the developing of Chinese economic and technological development zones, and an effective resolution is urgently needed [5]. Thus far, various novel methods and strategies for EV OCP have been proposed. Real data from commercial area charging stations were analyzed, and a tiered dynamic time-of-day pricing strategy using an improved non-dominated sorting genetic algorithm 2 (NSGA2) was also proposed [6]. A credibility-based distributed frequency estimation scheme was proposed to detect and isolate compromised plug-in electric vehicles (PEVs) participating in the frequency regulation [7]. A credibility-based secure DLFC strategy was proposed to sustain the stable operation of the power system under false data injection attacks [8]. To tackle this challenge, a new distributed economic model predictive control (DEMPC) strategy was proposed for the load frequency control (LFC) with the large-scale plug-in electric vehicle (PEV) participation [9]. An improved alternating direction multiplier strategy of multipliers for EV OCP optimization was proposed [10]. These traditional algorithms can solve the EV OCP optimization. However, it may be difficult to obtain an ideal EV OCP optimization by using traditional algorithms.
Therefore, intelligent optimization algorithms have received significant attention from researchers in the EV OCP field, and various improved intelligent optimization algorithms have been proposed. An improved particle swarm optimization (PSO) algorithm was proposed to model the orderly charging strategy; however, the effectiveness verification of large-scale example was lacking [11]. An improved honey-badger algorithm (IHBA) was proposed to compose the elite OBL, spiral update, and wild dog survival strategies to enhance the order of the charging of electric vehicles; however, the design is relatively complex, and it is far too dependent on the parameters [12]. An improved PSO was proposed to obtain an excellent planning solution of electric vehicle charging station layout (EVCSL), and a dynamic adjustment strategy for weight and integration into the two-population genetic mode was proposed to improve the optimization performance for PSO. However, the specific EV OCP optimization design was missing, and the precision of the EV OCP optimization solution could not be obtained [13]. To sum up, most of the previous improved intelligent optimization algorithms have improved optimization performance significantly. However, for solving the EV OCP optimization problem, they have not yet achieved sufficient optimization efficiency.
In China, the development of tourist attractions is a critical issue for the national economy and for people’s livelihood. With the rapid development of the tourist industry, people’s requirements for the quality of the tourism experience are also increasing day by day. However, because of the limited tourism technology and services, the management of tourist attractions is becoming more and more difficult [13]. Compared with existing studies about EV OCP optimization for Chinese economic and technological development zones, the main contributions of this work are as follows:
- The EV OCP optimization analyses for Chinese economic and technological development zones: based on an in-depth analysis of background of EV OCP optimization for Chinese economic and technological development zones, objective functions for EV OCP optimization are provided, and it is more reasonable to study the actual EV OCP optimization problem for Chinese economic and technological development zones.
- Effective improved strategies for the moth–flame algorithm: this work presents an improved novel moth–flame version with a dual-population genetic mechanism (IDPGMFO), and to enhance the global optimization ability of the improved version, adaptive nonlinear decreasing strategies for selection, crossover, and mutation and weight coefficient are introduced, as well as the OBL.
The paper is organized as follows. Section 2 introduces the EV OCP optimization analyses for Chinese economic and technological development zones. Section 3 illustrates the design of IDPGMFO. Section 4 provides the simulation verification of an EV OCP optimization example for Chinese economic and technological development zones. Section 5 concludes this article.
2. EV OCP Optimization Analyses for Chinese Economic and Technological Development Zones
2.1. Background of EV OCP Optimization for Chinese Economic and Technological Development Zones
Chinese economic and technological development zones are usually located in remote areas of cities, and they can be classified into four types: economy primary zones; new and high-technology primary zones; tourist attractions; and mixed-form zones involving the economy, technology industry or tourism. In fact, the proportion of permanent residents and long-term residents is not high, and most of the residents are out-of-town business staff or tourists, who will not inhabit these spaces permanently. So, local tourism cannot be ignored.
The low construction cost of EV traffic networks is a key benefit. Due to funding limitations and the advantages of EVs, EVs are a significant means of transport for many Chinese economic and technological development zones, and only an EV traffic network is constructed. In Chinese economic and technological development zones, there are a large number of electric vehicles of various types that offer economic benefits and greater convenience for the public. These include large electric buses, electric sanitation vehicles, other public EVs, electric taxis, and private EVs. Large electric buses and electric taxis are extremely important and indispensable. Each has advantages and disadvantages: the travel costs for electric buses are cheap; however, the waiting time and travel time for electric buses are longer than those of electric taxis, and the comfort of electric buses is also poor. Many Chinese tourist attractions are located in economic and technological development zones far from the downtown area, so local tourism is paid much more attention. For increasing local tourism revenue, there are a high proportion of electric vehicles employed directly and indirectly in the local area, electric taxis in particular, and they provide a guarantee of profitability for local tourism [13].
The ordered charging framework of EVCs is composed of a distribution network control center, a charging station control center, and intelligent charging piles. The specific ordered charging framework of EVCs is shown in Figure 1:
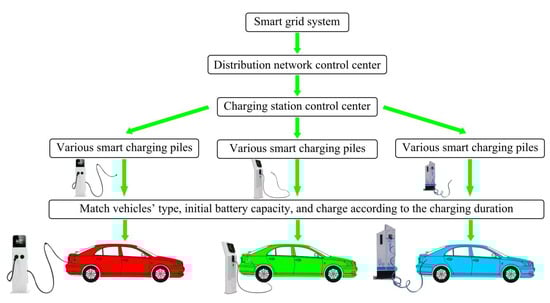
Figure 1.
Schematic diagram of ordered charging framework for EVCs.
As shown in Figure 1, the specific ordered charging process of EVCs includes the following parts. (1) The distribution network control center transmits the power load to each smart charging pile through the charging station control center. (2) Each intelligent charging pile matches the charging transmission power according to the model of the required charging car and its initial power. (3) The intelligent charging pile guides the electric vehicle to charge in an orderly manner according to the charging time set by the owner of the charging car.
Generally, for out-of-town business staff or tourists, saving time during their trip is their first consideration; for permanent residents and long-term residents, time saving should be considered, but the charging fee (including charging fee) is the first consideration. In China, with the fast development of tourism, people have a small amount of money and free time in which to take trips, and group tours with economic value and high intensity are popular. In order to fully exploit limited resources (EVs, money, staffs and so on), 24 h preferred charging plans according to intraday time division charging electricity price and local tourism schedules should be obtained in advance, and this is an important basis for EV OCP optimization. In terms of EV OCP optimization for Chinese economic and technological development zones, the grid safety and stable operation evaluation methods for the EV traffic network must be considered, and the time consumption and electric charging cost for the operating company of local area should also be considered. In addition, various constraint conditions of EV OCP optimization are among the factors considered. For Chinese economic and technological development zones, EV OCP is a significant issue which cannot be avoided. If an efficient and appropriate EV OCP optimization method is proposed, electric charging costs will have obvious reductions, and local tourism revenue will have obvious increases, too; electric charging costs will have obvious increases, which will be beneficial to tourism brand effectiveness maintenance.
2.2. EV OCP Optimization Model for Chinese Economic and Technological Development Zones
From the perspective of grid safety and stable operation, the grid side aims to minimize the fluctuation of charging load and grid load and realize “peak clipping and valley filling”. Furthermore, it aims to improve the quality of the power supply and reduce the loss of distribution network lines. In addition, to increase local tourism revenue and the average satisfaction of tourists, it needs to reduce charging costs as much as possible, but it also needs to fully meet the charging demands of tourists. The charging plan preference matching degree is the ratio of the cumulative sum of charging power matched by the 24 h charging plan and the 24 h preferred charging plan to the cumulative sum of charging power of the 24 h charging plan, which can quantitatively describe the charging convenience of tourists. If sufficient charging convenience is provided for tourists, time saving for tourists will be guaranteed. The specific objective function of comprehensive evaluation of charging user preference is as follows:
where Z is the comprehensive evaluation, is the charging cost, is the charging price of the tth hour, is the charging power of the tth hour in the charging plan, is the preference matching degree of the charging plan, is the charging power of the tth hour in the preferred charging plan, is the set upper limit of the charging fee, and , are the corresponding importance weights of charging cost and charging plan preference matching degree, respectively; is the load of the power grid at the tth hour, is the daily load curve variance, is the variance of the array , is the resistance between the ith and jth node in the power grid, is the current between the ith and jth node at tth hour in the power grid, is the set upper limit of resistance, is the network loss, is the set upper limit of network loss, and , are the daily load curve variance and the corresponding importance weights of the network loss, respectively. Here, , ,,,.
Taking the actual situation into account, the EV OCP optimization needs to consider the line node voltage constraint, line node voltage constraint, vehicle battery capacity constraint and vehicle charging time constraint, which are detailed as follows:
where is the charging state of the pth vehicle at tth hour (1 represents that the vehicle is in the charging state, otherwise, it is 0), is the voltage of ith node at tth hour in the power grid, and are the minimum and maximum voltage of ith node in the power grid, respectively, is the charging time of pth vehicle, is the maximum charging time of pth vehicle, is the battery capacity of p th vehicle in t th hour, and , are the minimum and maximum battery capacity of pth vehicle, respectively.
As can been seen from EV OCP optimization model analyses for Chinese economic and technological development zones, the evaluation indexes are charging cost, preference matching degree of charging plan, daily load curve variance and network loss, the decision variable of the EV OCP optimization model is the EV OCP scheme, and the purpose of EV OCP optimization is obtaining the ideal EV OCP scheme, so as to achieve satisfactory charging costs, preference matching degree of the charging plan, daily load curve variance and network loss.
3. Design of IDPGMFO
The MFO has a shortcoming in accuracy and other aspects when it is used to solve some optimization problems [14]. Thus, some improvements are usually carried out when the algorithm is applied in practice. Certainly, for the different problems, it is necessary to implement the different improvements using diverse methods [15].
3.1. Basic Principle of MFO
MFO is an effective optimization method on the basis of the behavior of moths searching for a light source. M can be defined as the moth population, and it can be expressed as
where n is the population size and d is the dimension of the solution.
Let be the fitness value vector of moth population. One can get
Let F be the flame set. One can get
Let be the fitness value vector of flame set, which can be expressed as
The optimization process of MFO can be abstracted as a triple
Here, I is the behavior of initializing moth populations and flame sets, which are generated randomly. And then its fitness value is calculated, which can be expressed as
T is the individual updated behavior of the moth based on the logarithmic spiral function. Based on the current situation of itself and the flame set, the moth individual updates itself with the help of the logarithmic spiral function. It can be expressed as
where is the ith individual moth, is the jth flame, is the straight-line distance between the ith individual moth and the jth flame, is the logarithmic spiral morphological constant, l is a random number between −1 and 1, and is the logarithmic spiral function.
In Equation (17), P is the behavior of moth populations when updating their trajectory. If the fitness value of the moth after updating is better than the fitness value of the flame, the flame will be updated, which can be expressed as
The number of flames will be reduced gradually during the iteration. The specific updating formula of the number of flames is as follows.
where, t is the current iteration number; is the maximum number of iterations, and represents rounding x to the nearest integer [16].
3.2. Improved MFO Based on Dual-Population Genetic Mechanism
Compared with the traditional optimal technology, MFO has attracted the attention of many scholars due to its good algorithm convergence, simple parameter setting and computational form, and it can be effectively applied to the research field of optimization problems [17]. However, during the calculation process, when a certain flame position has obvious advantages, a large number of moths in the moth population will quickly move closer to it. If the flame position is in the local optimum at this time, the moth population will struggle to search for a new better solution, and thus it will be easy to make the algorithm fall into premature convergence.
To improve the issue that the MFO easily falls into local convergence, this work integrates the dual-population genetic mechanism, and the purpose of this is to improve the global optimization performance of MFO with the help of a dual population. In the iterative process, the MFO quickly draws each moth closer to the current optimal flame, which provides direction guidance for the evolution of the genetic moth–flame population and is conducive to accelerating convergence and global optimization. Meanwhile, due to the existence of a dual genetic mechanism, the moth population will not immediately stop searching for optimization when it falls into local extremum. The three operators of crossover, selection and mutation cause a certain degree of evolutionary disturbance in the evolution process of the moth population, which will help it escape the dilemma of local convergence and enhance its global optimization performance [18]. Conventional genetics cannot compare with dual population in global optimization performance. In the long iterative phase of the conventional genetic mechanism, the optimal individual has a certain degree of “domination” over the population, which makes it difficult for the algorithm to realize the global convergence. However, under the dual population scheme, the optimal individuals of two populations can carry out the action of exchange, and owing to the changes in the population environment, the optimal individual of original populations easily loses the long-established “dominant” position.
3.3. Adaptive Nonlinear Decreasing Strategy for Weight Coefficient
The weight coefficient is a significant parameter for MFO. The moth position update formula with the weight coefficient is detailed as follows.
where is the inertia weight.
An effective decreasing strategy for the weight coefficient should be proposed, so as to make the algorithm search range smaller, which will make the optimization ability for the whole optimization process more obvious [19]. The whole optimization process for MFO is nonlinear, and an adaptive nonlinear decreasing strategy for the weight coefficient should be adopted, so as to really reflect the real situation effectively. This paper presents a nonlinear decreasing strategy for weight coefficient with strong plasticity based on the cosine form decreasing. The specific calculation formula of weight coefficient is as follows.
where is the decreasing amount of the weight coefficient, , and are the minimum and maximum value for the weight coefficient, respectively; is the iteration progress, ; is the optimization factor [20].
The weight coefficient is nonlinearly decreasing, and the weight coefficient will continue nonlinearly decreasing with the evolution generation throughout the whole iterative calculation process. The relation curves of specific weight coefficients and evolution generations are shown in Figure 2.
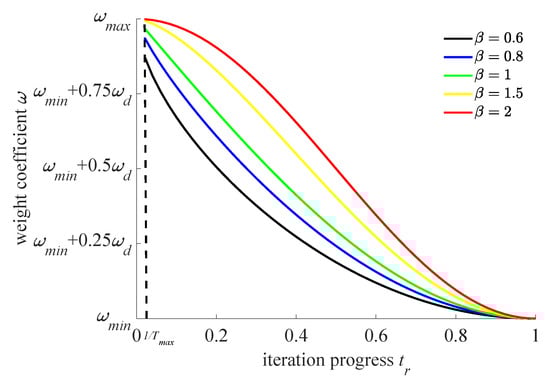
Figure 2.
The relationship between weight coefficient and evolutionary algebra.
As can be seen from Figure 2, the above nonlinear decline strategy in the form of cosine can optimize and adjust the nonlinear decline trend by selecting the most suitable optimization factor . This strategy is characterized by strong plasticity and strong adjustment ability. This strategy can adjust the decline rate of the weight coefficient in real time during the iterative process, which is conducive to the improvement of the balance effect between global exploration and local development, so as to improve the global optimization ability of the algorithm. In addition, the decline speed related to the weight coefficient in the final stage [0.8, 1] of the optimization process is very slow in this paper, so as to retain the global exploration ability to a certain extent.
3.4. Adaptive Nonlinear Decreasing Strategy for Selection, Crossover, Mutation Probability
The smaller the selection probability is, the stronger the algorithm’s ability to retain effective information will be, but it needs to lose the self-updating ability of the population [21]. In this work, an adaptive nonlinear decreasing strategy of selection, crossover and mutation probabilities is proposed, and the formula for calculating the selection, crossover and mutation probabilities is described as follows.
where , and are the selection, crossover and mutation probabilities, respectively; , and are the adaptive nonlinear decline rate of selection, crossover and mutation probabilities, respectively, making a significant difference in the decline rate during the whole iteration process; , and are the maximum probability of selection, crossover and mutation; , and are the decreasing probability of selection, crossover, and mutation.
3.5. Opposition-Based Learning Strategy
By generating a large number of opposite solutions far from the local optimum, OBL guides the population away from the local optimum area, thus widening the search range and improving the global optimization performance.
If the ith individual is out of bounds in the tth iteration, the OBL strategy will be involved. The specific OBL solution can be obtained according to the following equations.
Here, is the individual out of bounds, and are the minimum boundary and maximum boundary of the solution space, respectively; is the coefficient used to avoid excessive individual escape. If the OBL solution is still out of bounds, a random value within the allowed range is invoked.
3.6. IDPGMFO Calculating Process
In the design of IDPGMFO, the dual-population genetic mechanism and OBL strategy are integrated into the MFO, and the adaptive nonlinear decreasing strategy of weight coefficient and selection crossover and mutation is given, so as to effectively improve the global optimization ability of IMFO. The specific IDPGMFO calculating process is shown in Figure 3.
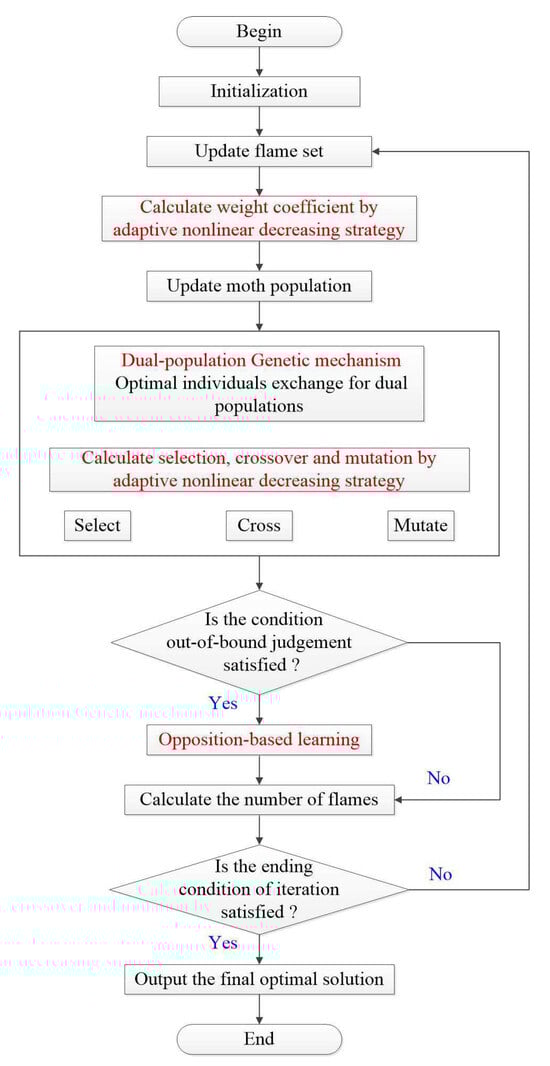
Figure 3.
Schematic diagram of IDPGMFO calculating process.
4. Simulation Verification of an EV OCP Optimization Example for Chinese Economic and Technological Development Zones
On the basis of taking into account user preferences and comprehensive evaluation indicators on the grid side, the proposed IDPGMFO, the traditional MFO, the improved PSO (IPSO) proposed in reference [11] and the improved Honey-badger algorithm (IHBA) proposed in reference [12] are used as optimization algorithms for the practical EV OCP optimization example for Chinese economic and technological development zones.
4.1. Data Sources for an EV OCP Optimization Example
In this work, the EV OCP optimization example about the Dalian bonded area scenic spot is taken as the research object. The Dalian bonded area scenic spot is one of the Chinese economic and technological development zones. The EV OCP optimization simulation environment is built with real data sources for the Dalian bonded area scenic spot. IEEE-33 network is a standard IEEE network, and IEEE-33 network topology with security and steadiness is popularly used in electric vehicle traffic network construction [11]. In this paper, IEEE-33 network topology is selected. There are 33 nodes in the smart grid of this district, and the type, applicable voltage range and voltage phase of each node have been identified, and the resistance between each node is known. The specific load data of the IEEE-33 smart grid system are shown in Table 1, and the specific the IEEE-33 smart grid system diagram is shown in Figure 4.

Table 1.
Load data of the IEEE-33 smart grid system.
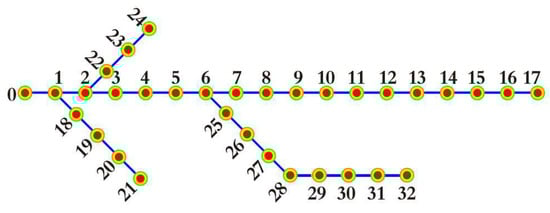
Figure 4.
Schematic diagram of the IEEE-33 smart grid system.
In Table 1, the head node and end node, active resistance and active resistance, active power and active power of the end node for a specific branch have been listed.
In the smart grid of the community, the charging station control center is set up at the 15th, 18th and 32th nodes, which supply electric energy to the smart charging piles in the area under their jurisdiction for charging electric vehicles.
In actuality, to implement simulation verification of EV OCP optimization for Chinese economic and technological development zones, the data sources for EVs charging must be forecast in advance. However, precise forecast results are very difficult to forecast, and next to impossible to achieve. So, in this paper, the real history results of EVs charging for the Dalian bonded area scenic spot collected from EVs monitoring system made in Liaoning Northeast Asia Travel Group Co., Ltd., Dalian, China (a company that partially manages the electric vehicle traffic network for the Dalian bonded area scenic spot) have been chosen for simulation verification; the specific date is 26 February 2022. On 26 February 2022, there were 1400 Dalian bonded area registration EVs and 241 unregistered EVs (EVs that came from other areas or were newly purchased and unregistered in the Dalian bonded area) were charged in this scenic spot. The charging types are divided into “only once/day”, “twice/day” and “three times/day”; the corresponding number of vehicles is 866, 437 and 198, respectively; the total number is 1501; and the other 140 EVs were charged more than three times. The real data come from the EVC data sensing and management system for the Dalian bonded area scenic spot, and we selected only the 1501 EVs with a charging frequency less than or equal to “three times/day” for research in this paper. Their battery capacity was determined before and after charging. There are four types of smart charging piles in the district, which are the slow charging mode suitable for households and the , and modes suitable for parking lots and shopping malls. Their charging powers are 3.5 kW, 7 kW, 12 kW and 24 kW, respectively, and the charging power factor is 0.9. All of them can charge any type of vehicle in the district car group and charge truth-telling.
4.2. Parameters Setting for the Specific EV OCP Optimization Example and IDPGMFO
The parameters settings of the specific EV OCP optimization example are taken as follows. The corresponding weights , , and of daily load curve variance, network loss, charging cost and charging plan preference matching degree are set to 0.15, 0.1, 0.375 and 0.375, respectively. The upper limits of daily load curve variance and network loss and are set to and kW, respectively.
The parameters setting of the specific IDPGMFO are taken as follows. The moth population size n is 90, the number of iterations is 50, the logarithmic spiral waveform state is 1, the maximum weight coefficient is 0.95, the inertia weight decreasing quantity is 0.3, and the optimization factor of nonlinear decreasing weight coefficient is 1.30. The maximum selection of , crossover and mutation probability are 0.6, 0.85 and 0.09, respectively. , , are set as 0.2, 0.15 and 0.03, respectively. The nonlinear decreasing , , are 1.25, 1.53, and 0.85, respectively.
4.3. Configuration of Simulation Platform
The specific detailed configuration of the simulation platform is shown below: the Matlab/Simulink revision for computation and figures drawn is “Matlab GUI 2016b”; the major computer configuration is “Core i7-7700K @ 4.2GHZ” and “Windows 10”; the display software revision is “Internet Explorer 11”; and the data storage software is “office2019 excel”.
4.4. Simulation and Verification of EV OCP Optimization for Chinese Economic and Technological Development Zones
Aiming at the practical EV OCP optimization, both charging user preferences and grid quality should be taken into account. To verify the effectiveness of the algorithm proposed in this work, the simulation experiment is implemented, which takes the preferences of charging users and the power grid quality into account. The proposed IMFO in this paper is used for optimization verification, while the traditional MFO, the IPSO and the IHBA are used for optimization comparison and evaluation. The specific optimization results are shown in Figure 5, Figure 6, Figure 7, Figure 8, Figure 9, Figure 10 and Figure 11.
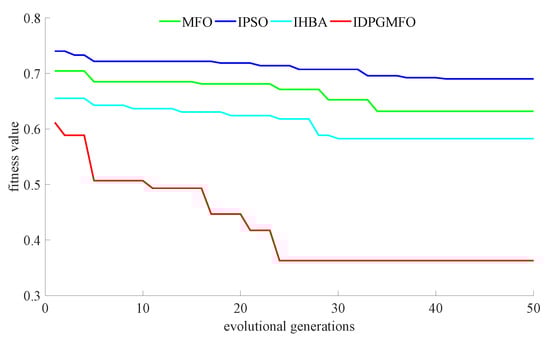
Figure 5.
Iterative convergence curves of each algorithm considering charging user preferences and power grid quality.
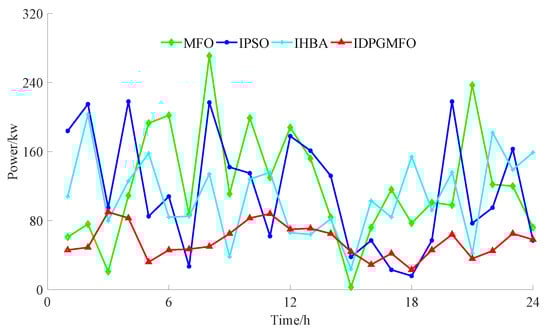
Figure 6.
Schematic diagram of the operation plan curves of charging station 1 considering both charging user preferences and grid quality.
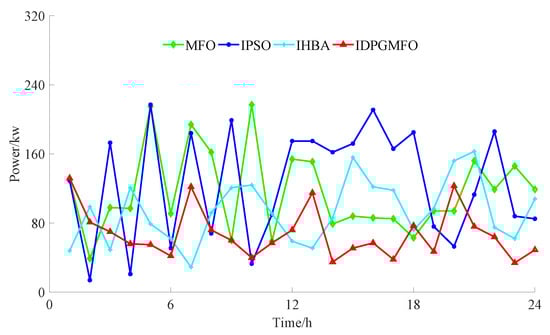
Figure 7.
Schematic diagram of the operation plan curves of charging station 2 considering both charging user preferences and grid quality.
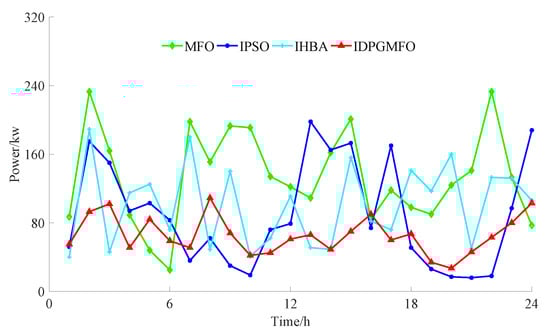
Figure 8.
Schematic diagram of the operation plan curves of charging station 3 considering both charging user preferences and grid quality.
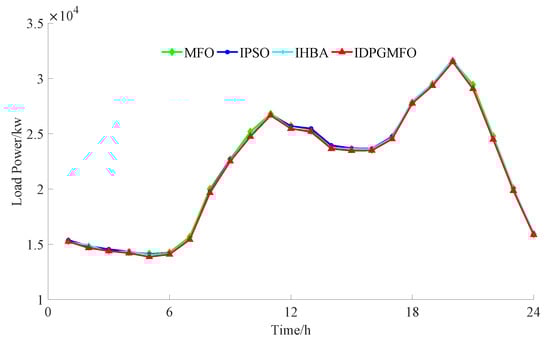
Figure 9.
The overall grid load variation curves considering both charging user preferences and grid quality.
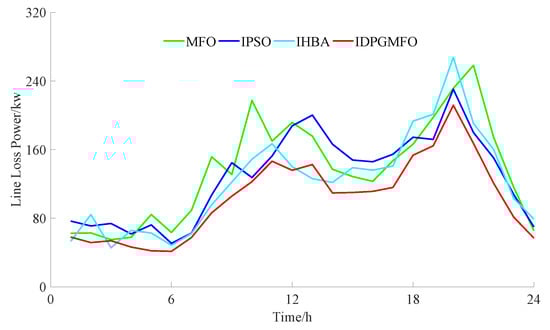
Figure 10.
Line loss power curves considering both charging user preferences and grid quality.
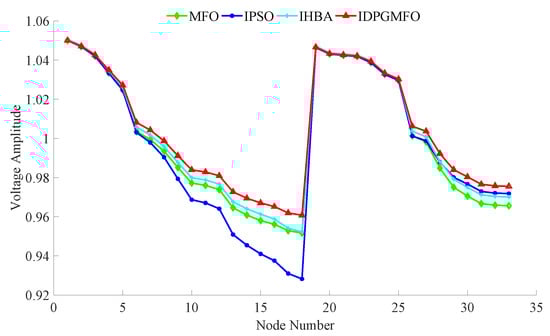
Figure 11.
Node voltage amplitude curves considering both charging user preferences and grid quality.
Figure 5 is used for evaluating the optimization algorithm ability throughout the whole process. The evolutional generations and fitness values are pure numerical values without units. Figure 6, Figure 7 and Figure 8 are used to show the final ordered charging planning of charging stations 1–3 obtained by proposed IDPGMFO and comparison optimization algorithms. The unit of power is kW, the unit of time is h, of course, the time total number is 24. Figure 9, Figure 10 and Figure 11 are used to show the grid side comprehensive performance for the final ordered charging planning obtained by the proposed IDPGMFO and comparison optimization algorithms. The unit of load power and line loss power is kW, while the node number and voltage amplitude are pure numerical values without units.
As can be seen from Figure 5, compared with comparison optimization algorithms, the IDPGMFO has a faster global convergence speed and better global convergence accuracy under the condition of taking into account the preferences of charging users and the quality of the power grid. As can be seen from Figure 6, Figure 7 and Figure 8, compared with comparison optimization algorithms, the improved PSO and the improved honey-badger algorithm used for comparison, the operation plan curves of charging stations 1–3 obtained by the IMFO are more straight, and it is beneficial to reduce line loss power. It can be seen from Figure 9 and Figure 10 that when considering the preferences of charging users and the quality of the power grid, compared with comparison optimization algorithms, the IMFO can better realize “peak and valley filling” to effectively ensure the load stability of the power grid and reduce the network loss more significantly. As can be seen from Figure 11, when considering the preferences of charging users and the quality of the power grid, compared with comparison optimization algorithms, the node voltage amplitude of 33 nodes for the planning scheme obtained by the proposed IDPGMFO in this paper belongs to the range of 0.96–1.05, and its fluctuation is small.
The specific performance evaluation results for the EV OCP obtained by proposed IDPGMFO and comparison optimization algorithms are listed in Table 2 below.
Table 2.
The specific objective function results.
Table 2 is used to show the preference matching degree, network loss and dual optimization objective function values for the final ordered charging plan obtained using the proposed IDPGMFO and comparison optimization algorithms. The unit of network loss power and line loss power is kW, while the preference matching degree and dual optimization objective function values are pure numerical values without units.
As shown in Table 2, compared with comparison optimization algorithms, the proposed IDPGMFO exhibits significantly better preference matching degree, network loss, and dual optimization objective function values. This confirms the high optimization quality of IDPGMFO.
In summary, compared with the comparison optimization algorithms used, the IDPGMFO proposed in this paper not only better meets the preferences of charging users, but also improves the quality of the power grid.
5. Conclusions
Designing an effective EV OCP optimization method for Chinese economic and technological development zones is extremely important for China’s tourism industry, and has tremendous value for improving the current operation situation of the Chinese tourism industry. This paper proposes an IDPGMFO that integrates a dual-population genetic mechanism, an opposition-based learning strategy, and adaptive nonlinear decreasing strategies of selection, crossover, mutation probability and weight coefficient. Compared with other effective optimization algorithms, IDPGMFO has significantly more powerful optimization performance. Simulation results for an actual example of EV OCP optimization for Chinese economic and technological development zones reveal two key contributions of the proposed moth–flame algorithm:
(I) The iterative convergence curve illustrates the strong optimization quality of our algorithm, obtaining improved optimization solutions.
(II) The iterative convergence curve shows that the improved moth–flame algorithm proposed has a fast global convergence speed.
The main innovative points of the paper are as follows:
(I) Innovations of EV OCP optimization model design for Chinese economic and technological development zones: as for Chinese economic and technological development zones, we design an optimization model considering both time consumption, electric charging cost for the tourism operating and the quality of the power supply for EV traffic network.
(II) Innovations of the MFO algorithm: this paper introduces an improved moth–flame optimization algorithm with three specific novel strategies: (I) integrating a genetic mechanism in the iterative process to enhance optimization quality; (II) incorporating adaptive nonlinear decreasing strategies for selection, crossover, mutation probability, and weight coefficient; and (III) introducing the OBL mechanism to further improve the optimization quality.
In summary, the IDPGMFO proposed in this paper is effective. To validate its effectiveness, a simulation comparison of an EV OCP optimization example for Chinese economic and technological development zones is conducted, demonstrating the efficacy of the proposed algorithm.
However, there are several shortcomings in this research:
(I) There is a gap between the actual scenario and the designed EV OCP optimization model for Chinese economic and technological development zones.
(II) The effectiveness of the adaptive nonlinear decreasing strategies of selection, crossover, mutation probability and weight coefficient are limited.
(III) The effectiveness of the introduced genetic mechanism is finite.
(IV) The simulation comparison of EV OCP optimization for Chinese economic and technological development zones still lacks an effective precise EVs charging forecast algorithm.
The future areas for improvement in the context of EV OCP optimization for Chinese economic and technological development zones based on the improved moth-flame optimization are as follows:
(I) Further studies should focus on specific optimization model design and adjusting several objective functions and constraint conditions to align with reality.
(II) Further studies such as Gaussian mutation, cosine or sine decreasing modes, segmented adaptive nonlinear decreasing modes, etc., should be focused on. These strategies can be introduced to strengthen optimization abilities.
(III) Combining the improved MFO with other algorithms, such as differential evolution (DE), memetic algorithms, etc., could enhance the potential for optimization performance improvement.
(IV) To enhance the effectiveness of the specific simulation comparison, it is necessary to conduct further research on a precise EVs charging forecast algorithm.
(V) To guarantee the effective implementation of EV OCP, it is necessary to conduct further research on feasible implementation measures of EV OCP.
Author Contributions
Conceptualization, investigation, resources, S.C. and Y.C.; writing—original draft preparation, writing—review, S.C., Y.C. and L.W.; editing, supervision, language polishing, S.C., L.W. and C.X. All authors have read and agreed to the published version of the manuscript.
Funding
This research was funded by the Liaoning Provincial Department of Transportation Scientific Research Project under Grants of 202318, 202344, the Liaoning Provincial Department of Education Scientific Research Project of JYTMS20230038.
Data Availability Statement
No new data were created or analyzed in this study. Data sharing is not applicable to this article.
Conflicts of Interest
Author Shuang Che was employed by the company Liaoning Northeast Asia Travel Group Co., Ltd., Dalian 116021, China. The remaining authors declare that the research was conducted in the absence of any commercial or financial relationships that could be construed as a potential conflict of interest.
Abbreviations
The following abbreviations are used in this manuscript:
| EV | Electric vehicle. |
| EVs | Electric vehicles. |
| OCP | Ordered charging planning. |
| IDPGMFO | Improved dual-population genetic immune moth flame optimization. |
| MFO | Moth flame optimization. |
| PEVs | Plug-in electric vehicles. |
| DEMPC | Distributed economic model predictive control. |
| LFC | Load frequency control. |
| PSO | Particle swarm optimization. |
| IHBA | Improved honey-badger algorithm. |
| IIMFO | Improved immune moth flame optimization. |
| OBL | Opposition-based learning. |
| DOL | Dynamic opposite learning. |
References
- Mushfiqur, R.S.; Hrvoje, P.; Kaiwen, S.; Miguel, A. Ortega-vazquez optimal operation of aggregated electric vehicle charging stations coupled with energy storage. IET Gener. Transm. Distrib. 2017, 12, 1127–1136. [Google Scholar]
- Tao, Y.; Huang, M.; Chen, Y.; Yang, L. Orderly charging strategy of battery electric vehicle driven by real-world driving data. Energy 2020, 193, 116806. [Google Scholar] [CrossRef]
- Wang, N.; Li, B.; Duan, Y.; Jia, S. A multi-energy scheduling strategy for orderly charging and discharging of electric vehicles based on multi-objective particle swarm optimization. Sustain. Energy Technol. Assess. 2021, 44, 101037. [Google Scholar] [CrossRef]
- Yin, W.; Ji, J.; Wen, T.; Zhang, C. Study on orderly charging strategy of EV with load forecasting. Energy 2023, 278, 127818. [Google Scholar] [CrossRef]
- Lai, S.; Qiu, J.; Tao, Y.; Zhao, J. Pricing for electric vehicle charging stations based on the responsiveness of demand. IEEE Trans. Smart Grid 2023, 14, 530–544. [Google Scholar] [CrossRef]
- Zhang, Z.; Lv, L.; Wang, X. Researh on dynamic time-sharing tariff orderly charging strategy based on NSGA2 in PV-Storage-Charging stations. Electr. Power Syst. Res. 2023, 225, 109784. [Google Scholar]
- Hu, Z.; Liu, S.; Wu, L. Credibility-based distributed frequency estimation for plug-in electric vehicles participating in load frequency control. Int. J. Electr. Power Energy Syst. 2021, 130, 106997. [Google Scholar] [CrossRef]
- Hu, Z.; Liu, S.; Luo, W.; Wu, L. Credibility-based secure distributed load frequency control for power systems under false data injection attacks. IET Gener. Transm. Distrib. 2020, 14, 3498–3507. [Google Scholar] [CrossRef]
- Hu, Z.; Liu, S.; Luo, W.; Wu, L. Intrusion-Detector-Dependent Distributed Economic Model Predictive Control for Load Frequency Regulation With PEVs Under Cyber Attacks. IEEE Trans. Circuits Syst. Regul. Pap. Publ. IEEE Circuits Syst. Soc. 2021, 68, 3857–3868. [Google Scholar] [CrossRef]
- Hu, Y.; Zhang, M.; Wang, K.; Wang, D. Optimization of orderly charging strategy of electric vehicle based onimproved alternating direction method of multipliers. J. Energy Storage 2022, 55, 105483. [Google Scholar] [CrossRef]
- Du, W.; Ma, J.; Yin, W. Orderly charging strategy of electric vehicle based on improved PSO algorithm. Energy 2023, 271, 127088. [Google Scholar] [CrossRef]
- Chen, R.; Luo, H.; Huang, K.; Nguyen, T.; Pan, J. An Improved honey badger algorithm for electric vehicle charge orderly planning. J. Netw. Intell. 2022, 7, 332–346. [Google Scholar]
- Che, S.; Chen, Y.; Wang, L. Electric vehicle charging station layout for tourist attractions based on improved two-population genetic PSO. Energies 2023, 16, 983. [Google Scholar] [CrossRef]
- Mirjalili, S. Moth-flame optimization algorithm: A novel nature-inspired heuristic paradigm. Knowl.-Based Syst. 2015, 89, 228–249. [Google Scholar] [CrossRef]
- Mirjalili, S. A discrete Moth-Flame Optimization Algorithm for Community Detection. Algorithms 2021, 14, 314. [Google Scholar]
- Mirjalili, S. A binary Moth-Flame Optimization for Feature Selection from Medical Datasets. Computers 2021, 10, 136. [Google Scholar]
- Sahoo, S.K.; Saha, A.K.; Nama, S.; Masdari, M. An improved moth flame optimization algorithm based on modified dynamic opposite learning strategy. Artif. Intell. Rev. 2023, 56, 2811–2869. [Google Scholar] [CrossRef]
- Islam, S.M.; Das, S.; Ghosh, S.; Roy, S.; Suganthan, P.N. An Adaptive Differential Evolution Algorithm With Novel Mutation and Crossover Strategies for Global Numerical Optimization. IEEE Trans. Syst. Man Cybern. Part B-Cybern. 2012, 42, 482–500. [Google Scholar] [CrossRef] [PubMed]
- Ebenezer, D. Optimum Wavelet-Based Homomorphic Medical Image Fusion Using Hybrid Genetic-Grey Wolf Optimization Algorithm. IEEE Sensors J. 2018, 18, 6804–6811. [Google Scholar]
- Li, C.; Li, S.; Liu, Y. A least squares support vector machine model optimized by moth-flame optimization algorithm for annual power load forecasting. Appl. Intell. 2016, 45, 1166–1178. [Google Scholar] [CrossRef]
- Liu, G.; Xu, C.; Wang, L. Modified ADRC design of permanent magnet synchronous motor based on improved memetic algorithm. Sensors 2023, 23, 3621. [Google Scholar] [CrossRef] [PubMed]
Disclaimer/Publisher’s Note: The statements, opinions and data contained in all publications are solely those of the individual author(s) and contributor(s) and not of MDPI and/or the editor(s). MDPI and/or the editor(s) disclaim responsibility for any injury to people or property resulting from any ideas, methods, instructions or products referred to in the content. |
© 2024 by the authors. Licensee MDPI, Basel, Switzerland. This article is an open access article distributed under the terms and conditions of the Creative Commons Attribution (CC BY) license (https://creativecommons.org/licenses/by/4.0/).