Article

Measuring Student Engagement through Behavioral and Emotional Features Using Deep-Learning Models

1
Department of Computer Science, Superior University, Lahore 54000, Pakistan
2
Department of Computer Science, National Textile University, Faisalabad 37610, Pakistan
3
School of Computing, Skyline University College, Sharjah 1797, United Arab Emirates
*
Author to whom correspondence should be addressed.
Algorithms 2024, 17(10), 458; https://doi.org/10.3390/a17100458
Submission received: 7 July 2024 / Revised: 16 September 2024 / Accepted: 29 September 2024 / Published: 16 October 2024
(This article belongs to the Special Issue Algorithms for Feature Selection (2nd Edition))

Abstract

:
Students’ behavioral and emotional engagement in the classroom environment may reflect the students’ learning experience and subsequent educational outcomes. The existing research has overlooked the measurement of behavioral and emotional engagement in an offline classroom environment with more students, and it has not measured the student engagement level in an objective sense. This work aims to address the limitations of the existing research and presents an effective approach to measure students’ behavioral and emotional engagement and the student engagement level in an offline classroom environment during a lecture. More precisely, video data of 100 students during lectures in different offline classes were recorded and pre-processed to extract frames with individual students. For classification, convolutional-neural-network- and transfer-learning-based models including ResNet50, VGG16, and Inception V3 were trained, validated, and tested. First, behavioral engagement was computed using salient features, for which the self-trained CNN classifier outperformed with a 97%, 91%, and 83% training, validation, and testing accuracy, respectively. Subsequently, the emotional engagement of the behaviorally engaged students was computed, for which the ResNet50 model surpassed the others with a 95%, 90%, and 82% training, validation, and testing accuracy, respectively. Finally, a novel student engagement level metric is proposed that incorporates behavioral and emotional engagement. The proposed approach may provide support for improving students’ learning in an offline classroom environment and devising effective pedagogical policies.

1. Introduction

Student engagement in the classroom environment refers to a student’s involvement, interest, and participation during a lecture. Student engagement may be further categorized in terms of cognitive, emotional, and behavioral contexts [1]. More precisely, cognitive engagement relates to the mental efforts that students make in the learning process in class. Emotional engagement refers to students’ emotional responses toward learning, whereas behavioral engagement is inferred from the student’s actions such as paying attention, completing tasks, and following instructions. Since behavioral and emotional engagements are interrelated, and behavioral engagement influences cognitive engagement positively, behavioral engagement should be precisely assessed to improve the learning experience of students [2].
To improve learning and the subsequent academic progress, students’ engagement in the classroom environment is necessary. However, students may lose interest in the content delivered during a lecture due to a lack of relevance, a lack of interaction, a lack of variety, the teaching style, distractions, personal reasons, the lack of a challenge, and complex or overloaded information. Such issues are mostly observed during lectures in a traditional offline classroom environment (OCE) [3]. However, measuring students’ engagement in comparatively large classes (more than 30 students) becomes difficult [4]. Moreover, the limited teaching resources, the limited time, the difficulty in observing non-verbal cues, and the limited training of an instructor may also be other challenges in measuring student engagement. Thus, alternative methods may be incorporated for the measurement of student engagement in an OCE.
Thus, a computer-vision-based solution may be suggested as a more feasible solution for measuring student engagement. More precisely, non-verbal clues such as affective states, including being focused, feeling sleepy, yawning, and a skewed head pose (right or left), may be incorporated to monitor student engagement. When the students are found to be engaged, the level of focus through facial expressions may be used to measure the level of student engagement. It has been statistically proven in the prevalent work that students’ facial expressions may reveal their behavioral engagement [5]. Most researchers have incorporated computer vision for student engagement monitoring in e-learning environments [6,7,8,9,10,11,12,13,14,15,16,17,18]. However, these proposals monitor engagement in a controlled environment with few students [19,20,21]. Moreover, e-learning or an online learning environment differs from an OCE. Some works have also been proposed for student engagement monitoring in an OCE or in similar settings [2,22,23,24,25,26,27]. However, these proposals utilize dedicated physical devices or sensors [6,22,24], incorporate only behavioral features [7,23,25], test on limited data [8,27], are prone to efficiency issues [26], or use only emotional features [2]. Moreover, some of these proposals utilize a single pretrained transfer-learning (TL) model [8,25,28] or train a machine-learning or convolutional neural network model [2,6,8,22,23,24,26,27]. These limitations show that more pretrained and self-trained models may be incorporated for measuring student engagement in order to compare the performance of the underlying models. Moreover, behavioral and emotional features may be simultaneously incorporated for measuring student engagement. Furthermore, the level of engagement may be revealed instead of only classifying the affective states.
The proposed work utilizes pretrained and self-trained models along with behavioral and emotional features to measure student engagement in an OCE. More precisely, along with other contributions, the underlying work aims to find the answers to the following research questions: Can TL be effectively used for measuring student engagement in an OCE? Which TL model surpasses the others for measuring student engagement in an OCE? Does a self-trained model outperform the TL-based model for measuring student engagement in an OCE? How can a student’s engagement level be measured instead of just being classified into engaged or not-engaged states? The explicit contributions of the underlying work are listed as follows:
  • To generate behavioral- and emotional-feature-based student datasets in the offline classroom environment;
  • To compare the performance of TL algorithms in terms of the computation of student engagement in the offline classroom environment;
  • To propose an effective model for computing student engagement based on behavioral features and revealing the level of engagement based on emotional features in the offline classroom environment.
The remainder of this work proceeds as follows: Section 2 briefly presents the prevalent works related to student engagement, their limitations, and the gaps to be filled. Section 3 details the materials and methods from dataset acquisition to the experimental setup. Section 4 highlights the obtained results, while Section 5 discusses the outcomes, comparisons with earlier works, the implications of this work, and the limitations and future directions. Finaly, the conclusions are provided in Section 6.

2. Related Work

Intelligent systems have thrived with the rise of artificial intelligence (AI) [29]. AI-based robust solutions are now widely applied across various domains, including education [2,30], healthcare [31], agriculture [32], security [33], online social media [34,35], sports [36], and many others. In particular, AI has been increasingly adopted to provide more precise and effective solutions in the education sector. For instance, AI is used in decision-making processes for higher education [37], predicting student performance [38], developing computer-vision-based attendance systems [39], generating multiple-choice questions [30], and monitoring student engagement [2,6,7,8,9,22,23,24,25,26,27]. Such smart solutions not only enhance student engagement and learning experiences but also assist teachers in ensuring positive learning outcomes.
Student engagement is a multifaceted concept, typically classified into cognitive, behavioral, and emotional engagement [1]. However, the constructs within these categories often overlap [40]. To measure student engagement, researchers estimate the cognitive, behavioral, and emotional aspects through various modalities, such as affective cues, including speech, head movements, facial expressions, or body language. Similarly, emotional engagement is often assessed based on Ekman’s model of emotions (e.g., surprise, happiness, fear, anger, sadness, disgust, or contempt) or Russell’s model (e.g., astonishment, embarrassment, perplexity, contentment, relaxation, boredom, or unresponsiveness).
Other modalities used to estimate engagement include physiological signals (e.g., heart rate, blood pressure, respiration, electroencephalograms (EEG), facial electromyograms (EMG), functional magnetic resonance imaging (fMRI), galvanic skin responses, or body temperature) and log files (e.g., number of logins, content views, forum reads and posts, number of clicks, access duration, or scores).
Several publicly available datasets, such as NVIE [41], DAISEE [42], and EmotiW [43], have been instrumental in the study of student engagement. However, these datasets are often affected by challenges such as occlusion, background noise, and poor illumination. As a result, many researchers prefer to create customized datasets to address these issues. For example, studies [44,45,46] have utilized self-generated datasets, although the number of participants was limited to 61, 50, and 21, respectively. Given the advantages of self-generated datasets, our study is motivated to use a larger dataset involving more students compared to prior work.
Incorporating multiple engagement constructs can improve the accuracy of student engagement estimation. In this regard, Goldberg et al. estimated cognitive engagement using knowledge tests and behavioral engagement using facial features in an offline classroom setting [47]. The authors extracted facial features using OpenFace [48], measured the intraclass correlation to assign final labels, and used regression models to estimate engagement. Other studies [2,13,44,49] have also incorporated behavioral and emotional features, but with smaller datasets and limited accuracy. Additionally, most of these works do not propose methods for determining the level of engagement. To address these limitations, our work integrates both behavioral and emotional features, aiming to not only detect student engagement but also assess its level.
To compute student engagement, researchers have employed variants of convolutional neural network (CNN) and fine-tuning-based transfer learning (TL) techniques to detect behavioral and emotional features from image frames [40]. For example, Ashwin et al. used hybrid CNN models to detect students’ affective states, achieving a 76% accuracy [45]. Similarly, Pabba and Kumar used CNNs to classify engagement levels as low, medium, or high, with a 76.9% testing accuracy [2]. Mehta et al. later proposed a 3D DenseNet self-attention model for computing student engagement, achieving a 63.59% accuracy on the DAISEE dataset [50]. Furthermore, Thomas et al. incorporated the VGG16 model and temporal convolutional network to compute student engagement, reaching a 76% accuracy at the segment level [51]. However, these studies primarily relied on limited e-learning or publicly available datasets, resulting in constrained accuracy, as shown in Table 1.
In our work, we apply self-trained CNN and TL models, including ResNet50, VGG16, and Inception V3, to compute student engagement in a real offline classroom environment.

3. Materials and Methods

This section outlines the proposed methodology for processing video frames to analyze student engagement by assessing their behavioral features and, subsequently, calculating engagement levels based on their emotional states. First, video data are collected from OCE during the lecture sessions. Frames containing behavioral features (e.g., being focused, looking away, having closed eyes, and yawning) and emotional features (e.g., happy, sad, neutral, and angry) are extracted from the videos. Next, four models are trained to classify behavioral engagement, and the best-performing model is selected to compute behavioral engagement for the remaining data. Once the behaviorally engaged students are identified, emotional engagement is modeled using the same four algorithms, and the best-performing model is chosen. Finally, a student engagement level metric is calculated by combining the models’ confidence scores for both behavioral and emotional classification, along with survey scores. The following sections provide a detailed explanation of each step. Figure 1 illustrates the proposed methodology.

3.1. Dataset Acquisition

Previous research suggests using self-generated datasets to compute student engagement levels by analyzing their behavior and expressions in the OCE environment [40]. In line with this approach, a dataset comprising 100 undergraduate and postgraduate students was recorded over various sessions, each lasting approximately 30 min. Two high-definition 1080p cameras, operating at 30 frames per second, were used for video recording. These cameras were strategically placed on the right and left sides of the lecture hall to capture the students’ engagement in the OCE setting. Over the course of one month, a total of 40 videos were recorded in the OCE environment. The volunteer participants, both male and female, were between the ages of 19 and 25. All participants were informed about the study’s objectives, and their consent was obtained for using their facial expressions in the experiment.

3.2. Pre-Processing

In the pre-processing phase, frames are extracted from the recorded videos and then augmented for training and testing purposes.

3.2.1. Frame Extraction and Augmentation

Frames were extracted from the videos using Python’s OpenCV and face-recognition libraries. Since each frame contained multiple students, it was necessary to isolate individual students from the entire frame. To achieve this, the Haar Cascade Frontal Face module from the OpenCV library was used to extract a 100 × 100 pixel frame of each student’s face. In total, 10,000 frames were extracted, with blurred frames automatically rejected by the same module.
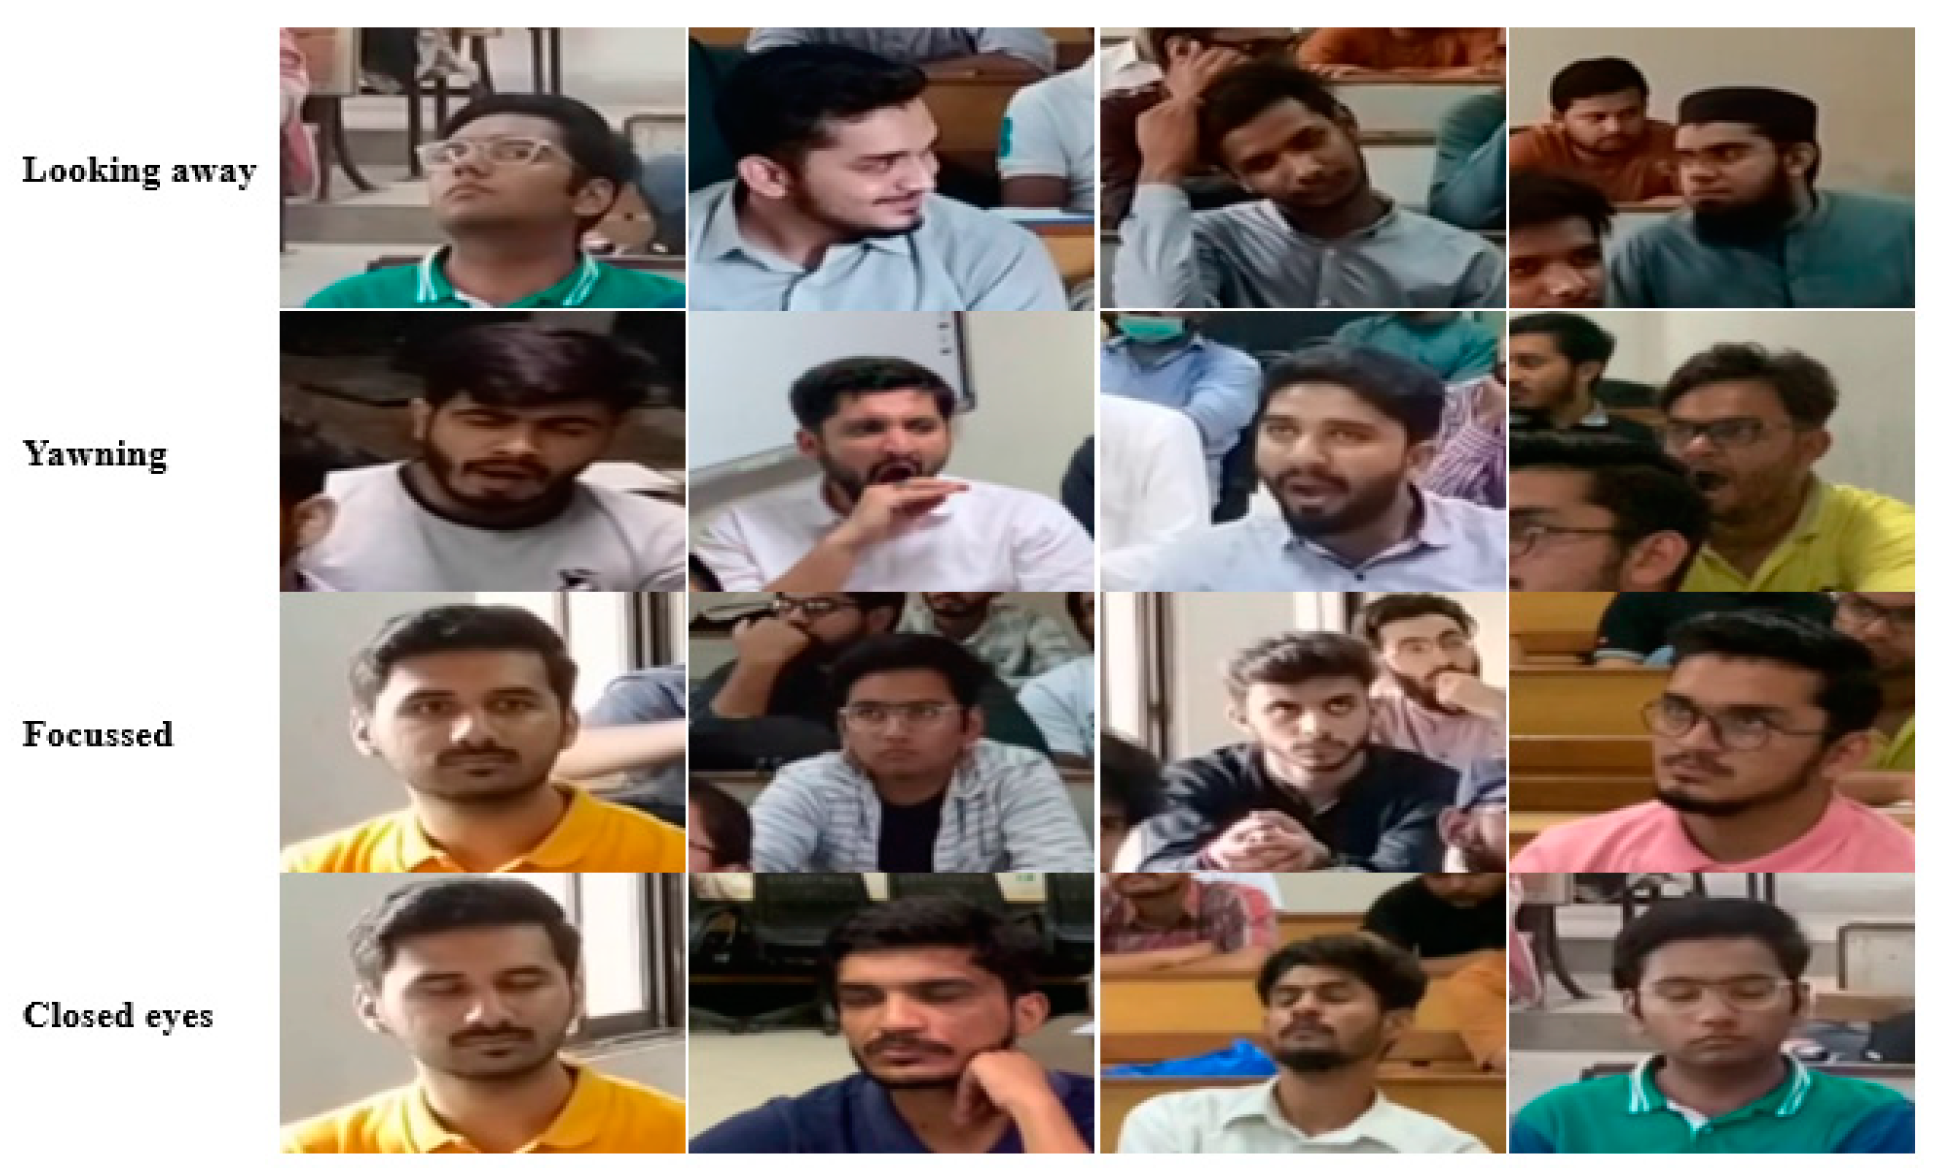
The extracted frames were then divided into two groups. While analyzing frames that reflected student behavior, various actions were observed, including looking/asking the teacher questions, talking with peers, using mobile phones, laughing, yawning, resting their heads, and sleeping. Due to the limited instances of some actions, these behaviors were grouped into four dominant categories: closed eyes (e.g., sleeping or using a mobile phone), focused (e.g., looking forward or asking the teacher questions), looking away (e.g., talking with a peer or looking away from the teacher/board), and yawning, as illustrated in Figure 2.
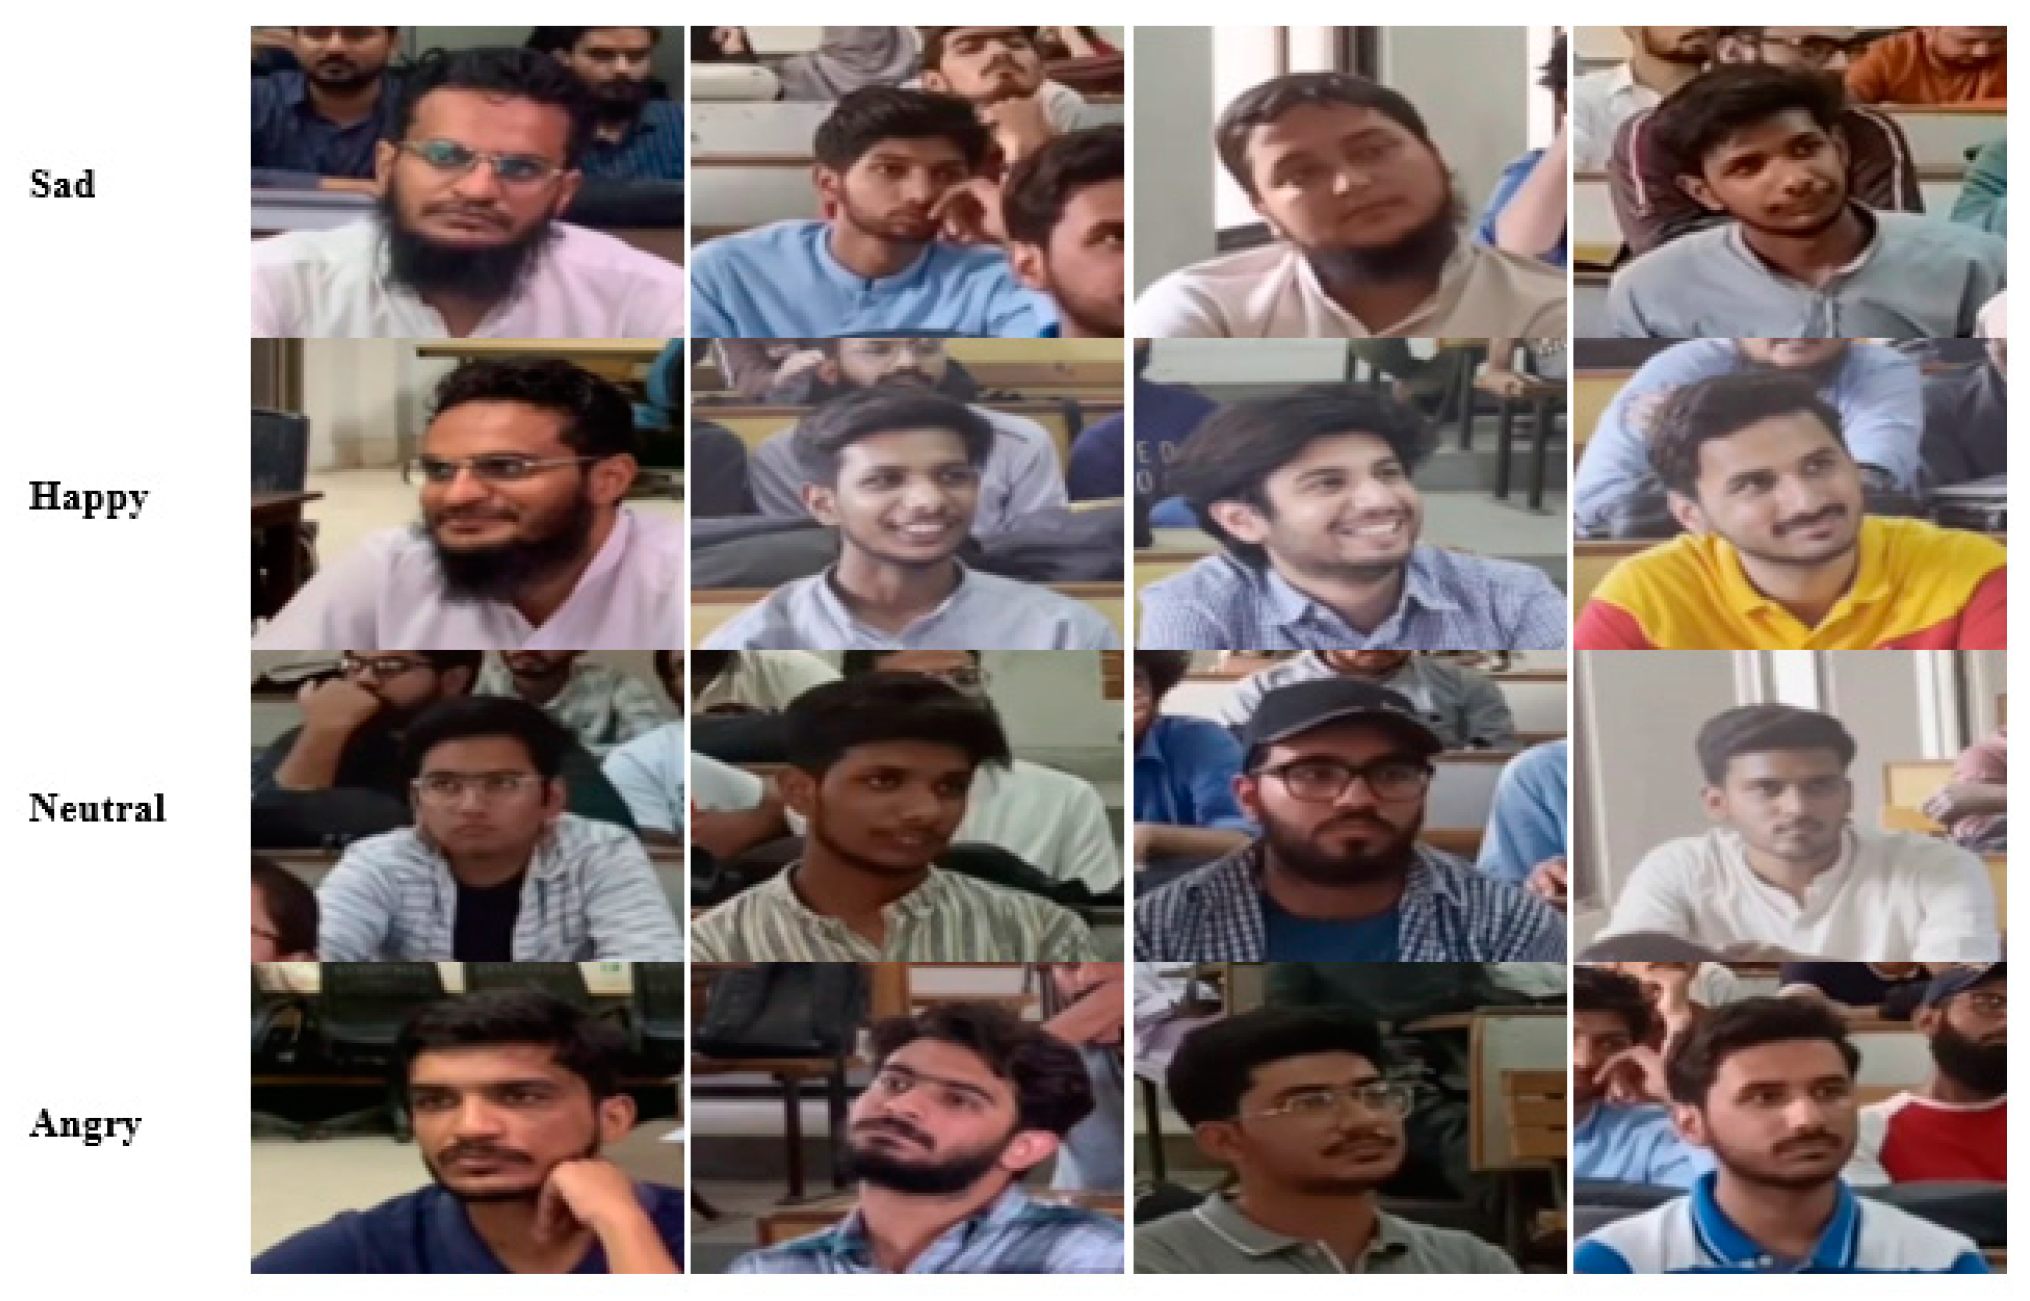
The second group of extracted frames was categorized based on emotions using the DeepFace Python library. Several emotions were observed in the frames, including sadness, neutrality, frustration, fear, happiness, and anger. However, for analysis, the emotions selected were sadness, neutrality, happiness, and anger, as these were the most dominant. The emotion-reflecting frames are shown in Figure 3. Both datasets were split into 70% for training, 20% for validation, and 10% for testing. Each model was trained for 200 epochs following the same training steps. For model validation, the metrics used included Precision, Recall, F-measure, and Accuracy. Additionally, a survey was conducted to further validate the models.

3.2.2. Data Augmentation

Data augmentation is a pre-processing step that is used to extend the dataset for generating new set of frames. More precisely, the scaling parameter was set to 0.8 to 1.2 for both X and Y axes. The translation parameter was set to −0.2 to 0.2 for both X and Y axes. Rotation was set to −25 for X axis and 25 for the Y axis. Shear was set to −8 for the X axis and 8 for the Y axis. After data augmentation, the frame count of the training dataset for behavioral and emotion-based experiments is detailed in Table 2.

3.3. Survey Analysis

A survey was conducted to gather responses from students regarding frames depicting engagement and non-engagement. Additionally, the level of engagement was assessed by 196 respondents (students and teachers) who were shown different frames. The survey consisted of 22 questions, each comprising three parts: (1) an image of a feature, (2) a question, and (3) a selection of either “engaged” or “non-engaged”. Respondents were asked to determine whether the student in the image appeared engaged or not. After selecting “engaged” or “non-engaged”, they were required to rate the level of engagement or non-engagement on a scale of 1 to 10. The results revealed that only students who appeared focused were categorized as engaged, while all other actions were rated as non-engaged. This survey was conducted for all seven emotions: angry, fearful, happy, sad, surprised, disgusted, and neutral. Table 3 presents the percentage of engaged and non-engaged responses across the engagement scale (1–10).

3.4. Experimental Setup

The following models were trained on the pre-processed dataset, with all key training parameters detailed in Table 4.
The customized CNN model starts with an input layer, followed by several convolutional layers combined with batch normalization layers, which help stabilize and accelerate the training process. Max pooling layers are also included to reduce the spatial dimensions of the feature maps, improving model efficiency. To mitigate overfitting, dropout layers are incorporated, randomly deactivating units during training. The model includes four stages, each comprising a combination of the aforementioned layers. Finally, fully connected (dense) layers are used to connect all neurons from one layer to the next, leading to the output layer for classification.
ResNet50 is a deep convolutional neural network with 50 layers, utilizing residual learning to address the vanishing gradient issue, allowing for effective training of very deep networks. For fine-tuning, after freezing the top layers, we added four stages with combinations of dense and dropout layers. Various hyperparameters were tested to select the optimal configuration.
VGG16 consists of 16 layers in total, with 13 convolutional layers and 3 fully connected layers. It employs small 3 × 3 filters throughout the network. After freezing the top layers, we added six stages of dense and dropout layers. Multiple hyperparameters were explored to determine the best performing setup.
InceptionV3, developed by Google, is a deep convolutional neural network specifically designed for image analysis and object detection. It uses Inception modules, which apply convolutional filters of varying sizes simultaneously, helping to capture different levels of detail in images. The model incorporates techniques like factorized convolutions and label smoothing. We modified the network by adding four stages of dense and dropout layers. Various hyperparameters were evaluated, and the optimal ones were selected.

3.4.1. Deep-Learning Models for Behavioral-Based Students’ Engagement Level

In this work, transfer-learning (TL) models—VGG16, InceptionV3, and ResNet50—were customized by adding extra layers for binary classification. The performance of these models was then compared, and the best-performing model was selected for engagement computation. During training, all the pre-trained layers were frozen, and a flatten layer was added. Subsequently, six dense and dropout layers were introduced, followed by an output layer with a ReLU activation function. Additionally, a self-trained CNN model was proposed, incorporating extra layers to process the behavioral-reflecting dataset. Figure 4 illustrates the architecture of the proposed CNN model. An image of a student in the offline classroom environment (OCE) was provided as input to the customized CNN model, which processed the frame and detected the student’s facial actions. If the model labeled the student as “focused”, they were considered engaged; otherwise, they were classified as non-engaged. Among all the models tested, the customized CNN model demonstrated superior performance on the behavioral-reflecting dataset, outperforming VGG16, InceptionV3, and ResNet50.

3.4.2. Deep-Learning Models for Measuring Emotion-Based Engagement Level

For the detection of emotion-based features from the dataset, VGG16, Inception V3, and ResNet50 transfer-learning (TL) models were employed. These models were used with their basic architectures, enhanced by the addition of extra layers for multi-class classification. During training, all pre-trained layers were frozen, and a flatten layer was added, followed by six dense and dropout layers. Finally, an output layer with the ReLU activation function was included. Figure 5 illustrates the enhanced layer structure incorporated into the basic ResNet50 architecture. Additionally, a self-trained CNN model was developed by adding extra layers, specifically designed to compute behavior-based features.

4. Results

The evaluation results of the models are detailed as follows:

4.1. Evaluation of Behavior Detection Models

For detecting behavior-reflecting features, the customized CNN model outperformed the transfer-learning (TL) models. As shown in Table 5, the proposed CNN achieved a 97%, 91%, and 83% accuracy for training, validation, and testing, respectively, on the behavior-based dataset. Among the TL models, Inception V3 achieved the second-best performance for training, followed by VGG16 in third place and ResNet50 in fourth place. Notably, all models achieved a training accuracy of 90% or higher. For validation accuracy, VGG16 ranked second, followed by ResNet50 in third place and Inception V3 in fourth place, with all models achieving at least an 80% accuracy. During the testing phase, VGG16 again performed second-best, followed by ResNet50 in third place and Inception V3 in fourth place. Overall, all models attained a minimum of 69% accuracy during testing.

4.1.1. Intra-Model Evaluations’ Comparison of Behavior Detection Models

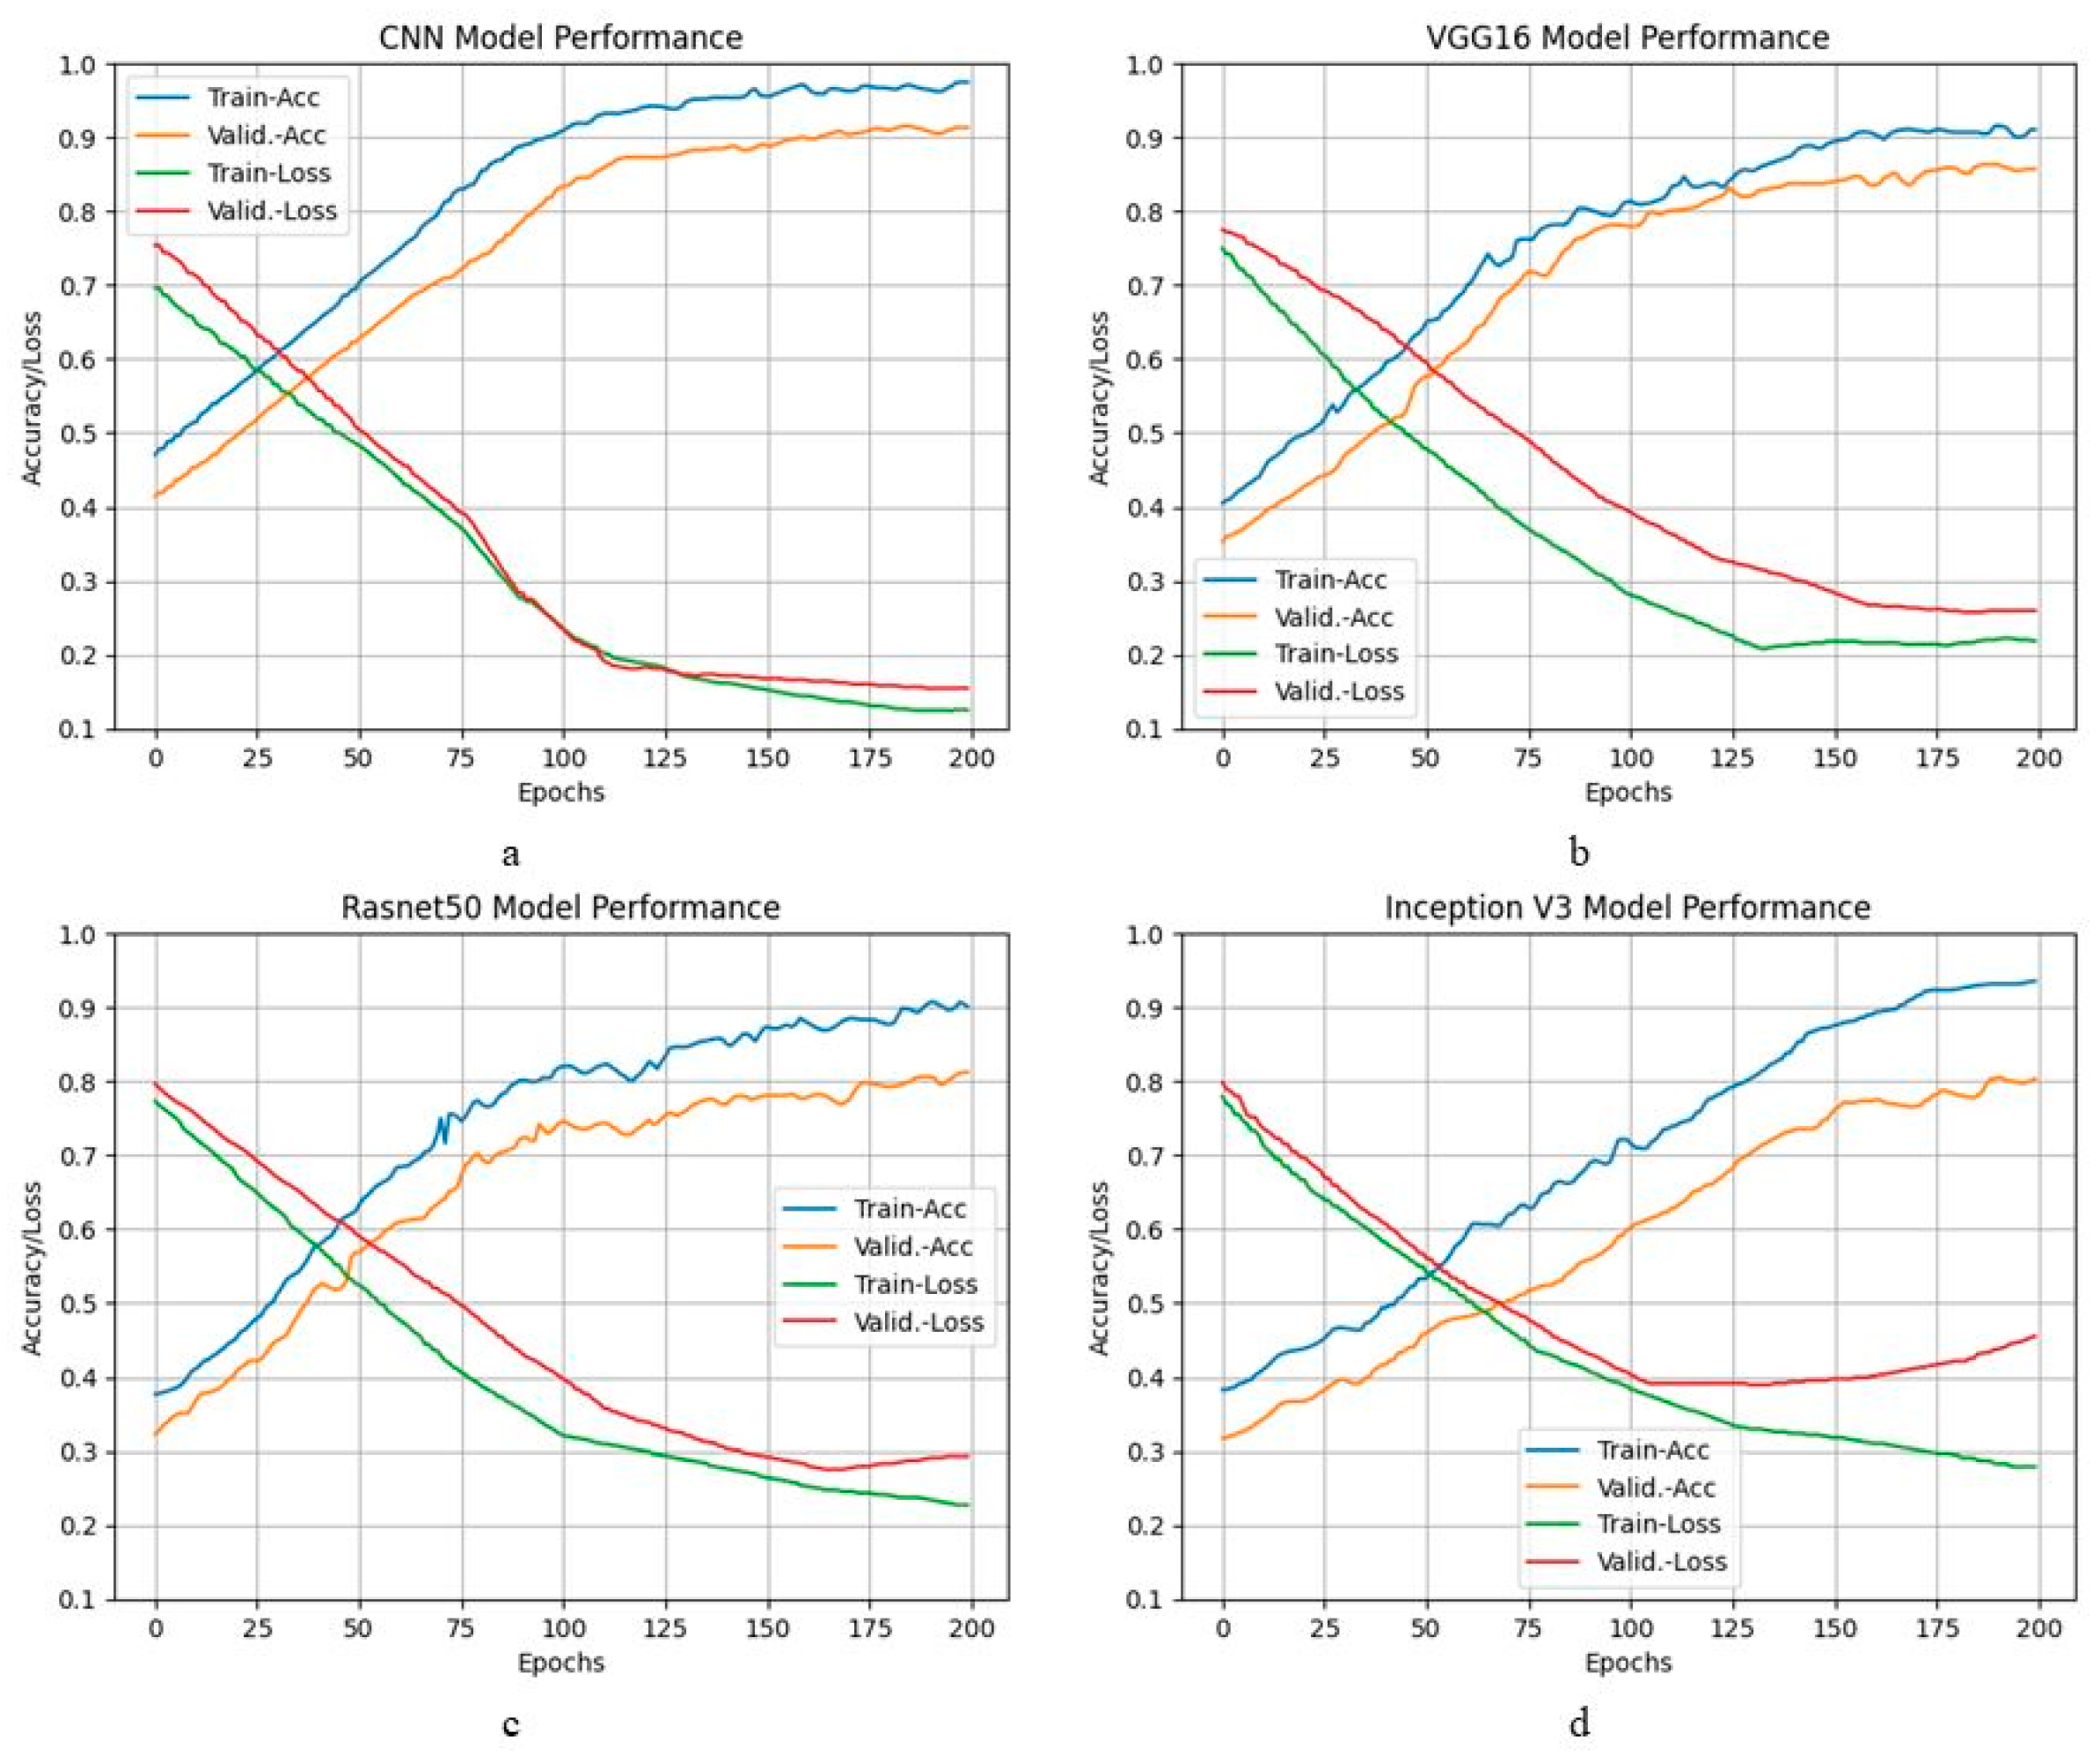
The detailed evaluation metrics for the behavior detection models are illustrated in Figure 6. It is evident that all models demonstrate promising results in terms of training and validation accuracies, as well as training and validation losses. Furthermore, there is an absence of underfitting and overfitting trends for all models throughout the 200 epochs, except for the Inception V3 model, which exhibits some variation after 125 epochs.

4.1.2. Inter-Model Evaluations’ Comparison of Behavior Detection Models

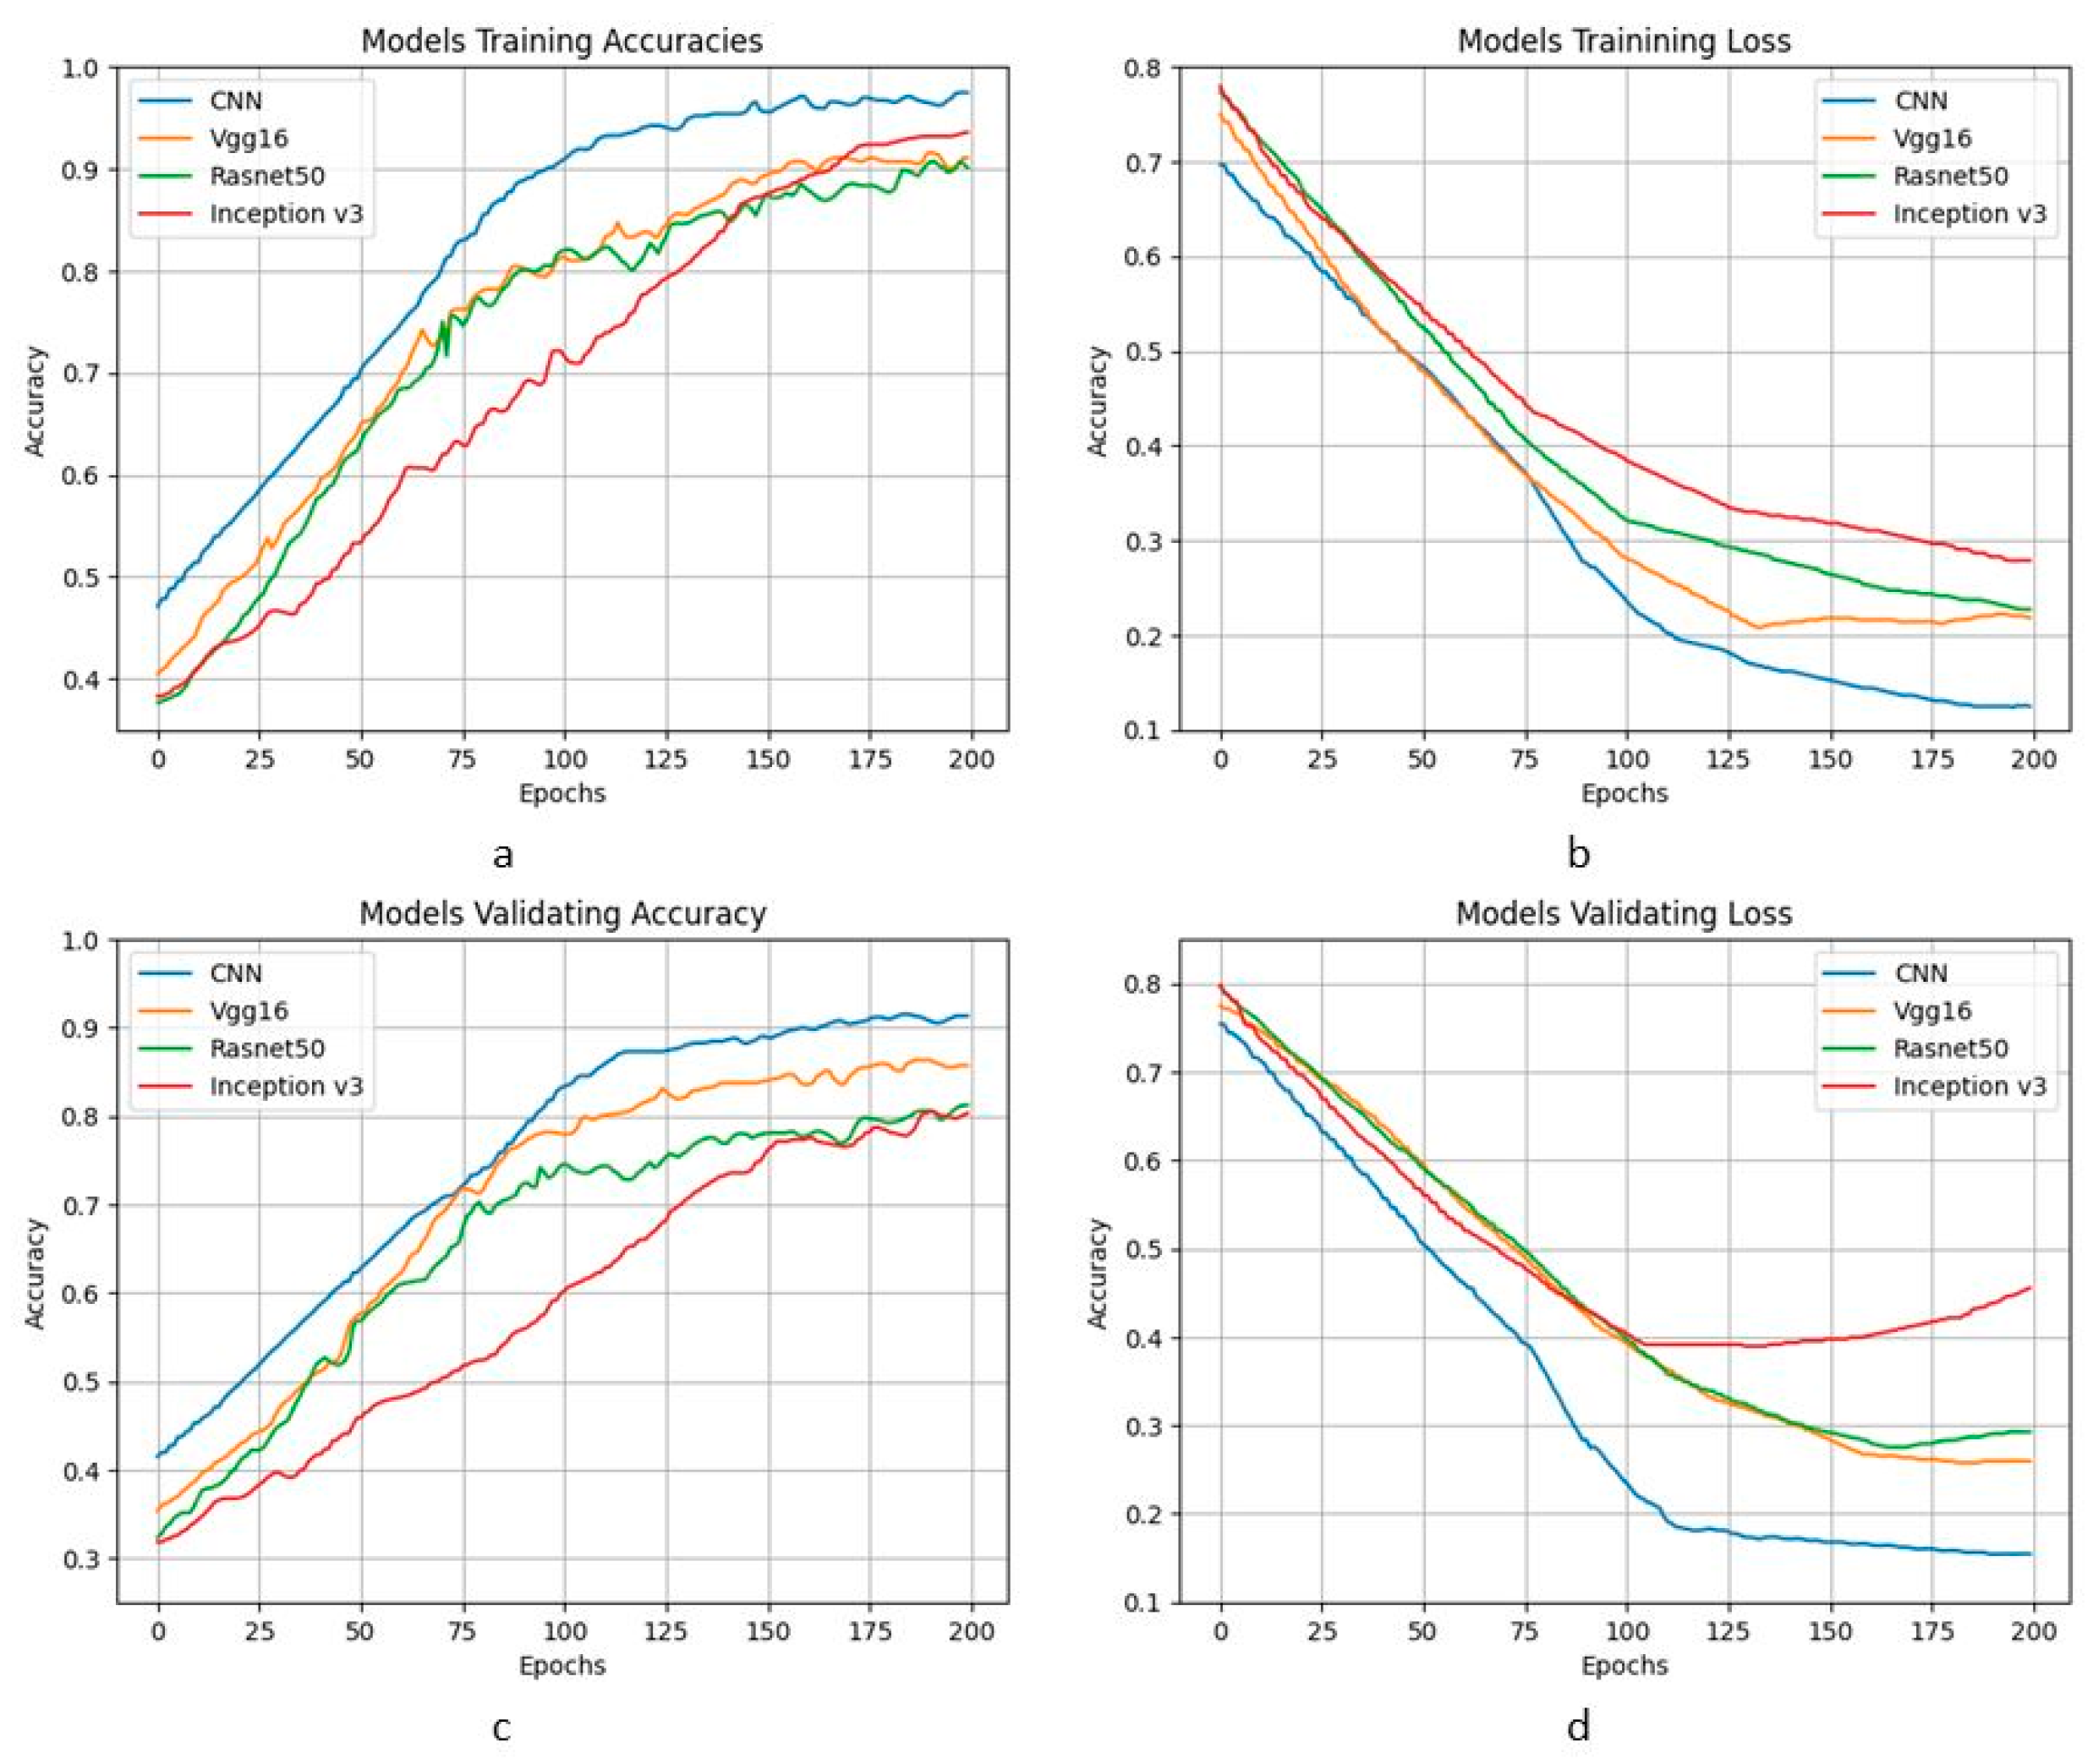
Figure 7 presents a comparative evaluation of the behavior detection models based on the respective dataset. It is clear that all models exhibit promising results; however, the proposed CNN model outperforms the others in terms of both training and validation accuracy, as well as loss.

4.2. Evaluation of Emotion Detection Models

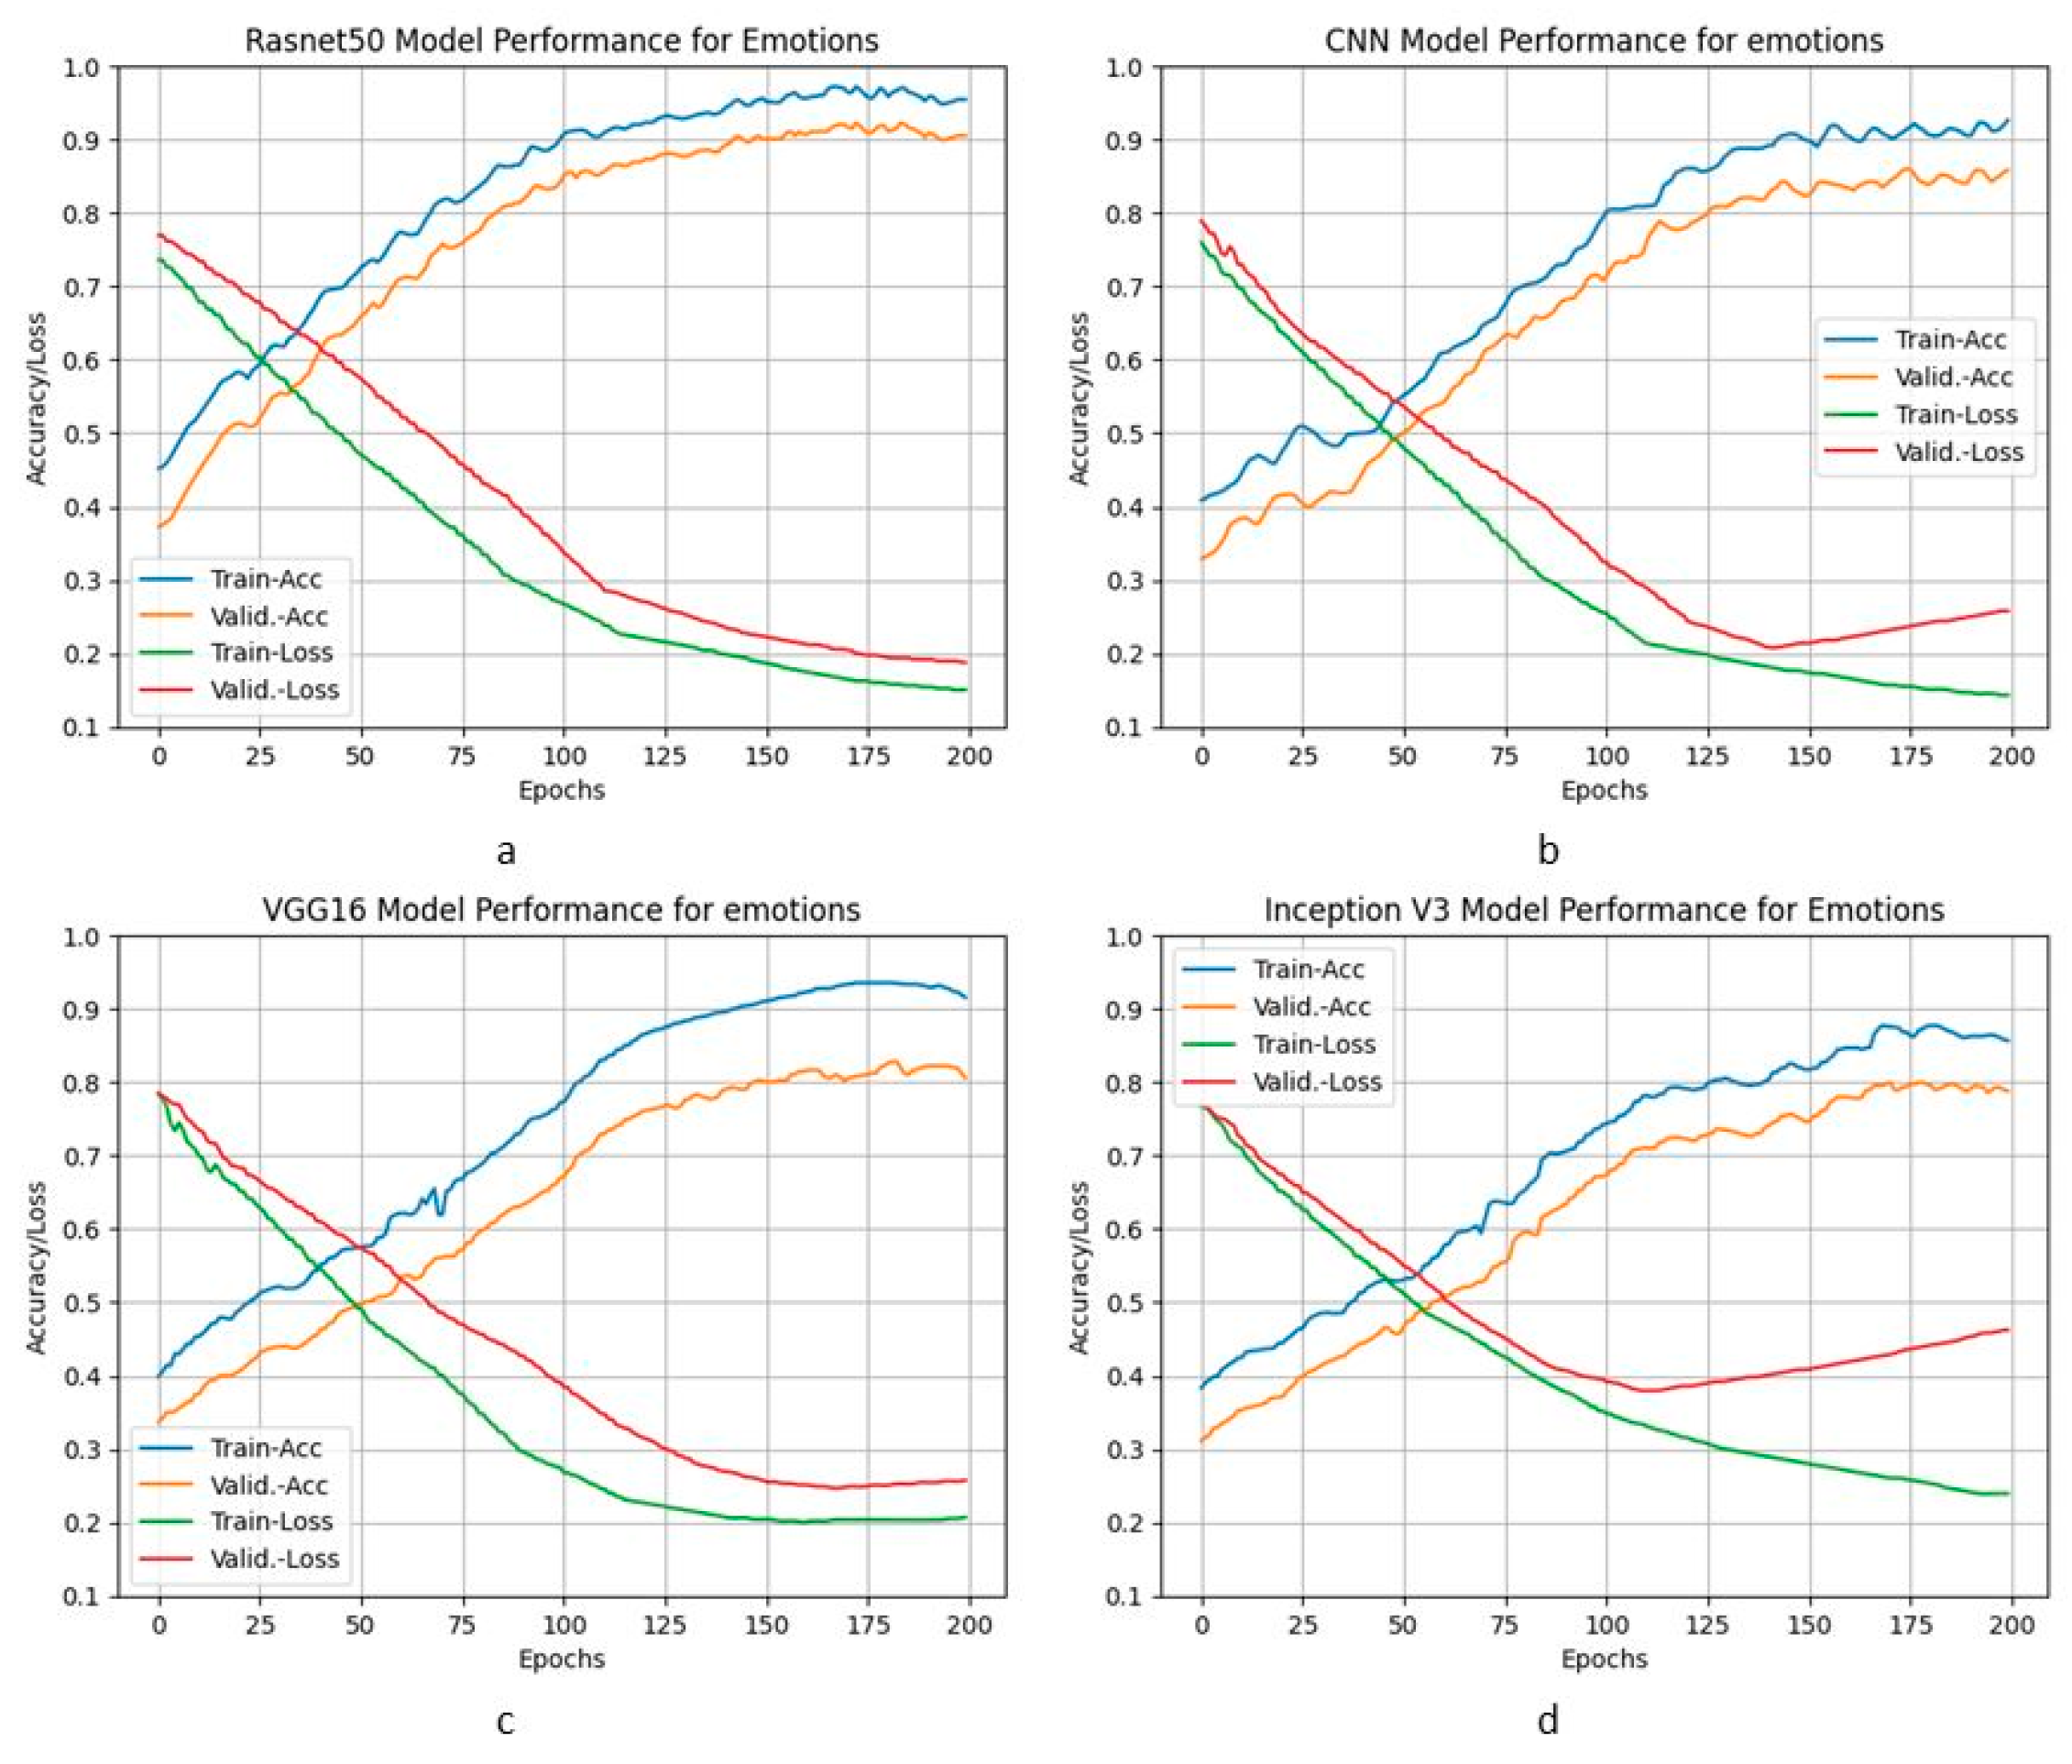
For the detection of emotion-reflecting features, ResNet50 outperformed the other models. As shown in Table 6, the ResNet50 achieved training, validation, and testing accuracies of 95%, 90%, and 82%, respectively, on the emotion-based dataset. Among the other models, the proposed CNN ranked second, followed by VGG16 in third place and Inception V3 in fourth during training. Overall, all models attained an accuracy of 85% or higher in the training phase. In terms of validation accuracy, the proposed CNN was in second place, with VGG16 in third and Inception V3 in fourth. All models achieved validation accuracies of 79% or greater. In the testing phase, the proposed CNN again performed second, followed by VGG16 in third place and Inception V3 in fourth place, with all models attaining at least a 58% accuracy. Notably, the testing accuracy for the emotion-based dataset is lower than that for the behavior-based dataset. This discrepancy arises because the behavior-based dataset addresses a binary classification problem, whereas the emotion-based dataset involves multiclass classification. Typically, binary classification problems yield better performance than multiclass classification problems.

4.2.1. Intra-Model Evaluations’ Comparison of Behavior Detection Models

The detailed evaluation metrics for the emotion detection models are illustrated in Figure 8. It is evident that all models demonstrate satisfactory results in terms of training and validation accuracies, as well as training and validation losses. Additionally, there are no signs of underfitting or overfitting trends for any of the models over the 200 epochs, with the exception of the Inception V3 model, which exhibits some variation after 100 epochs.

4.2.2. Inter-Model Evaluations’ Comparison of Emotion Detection Models

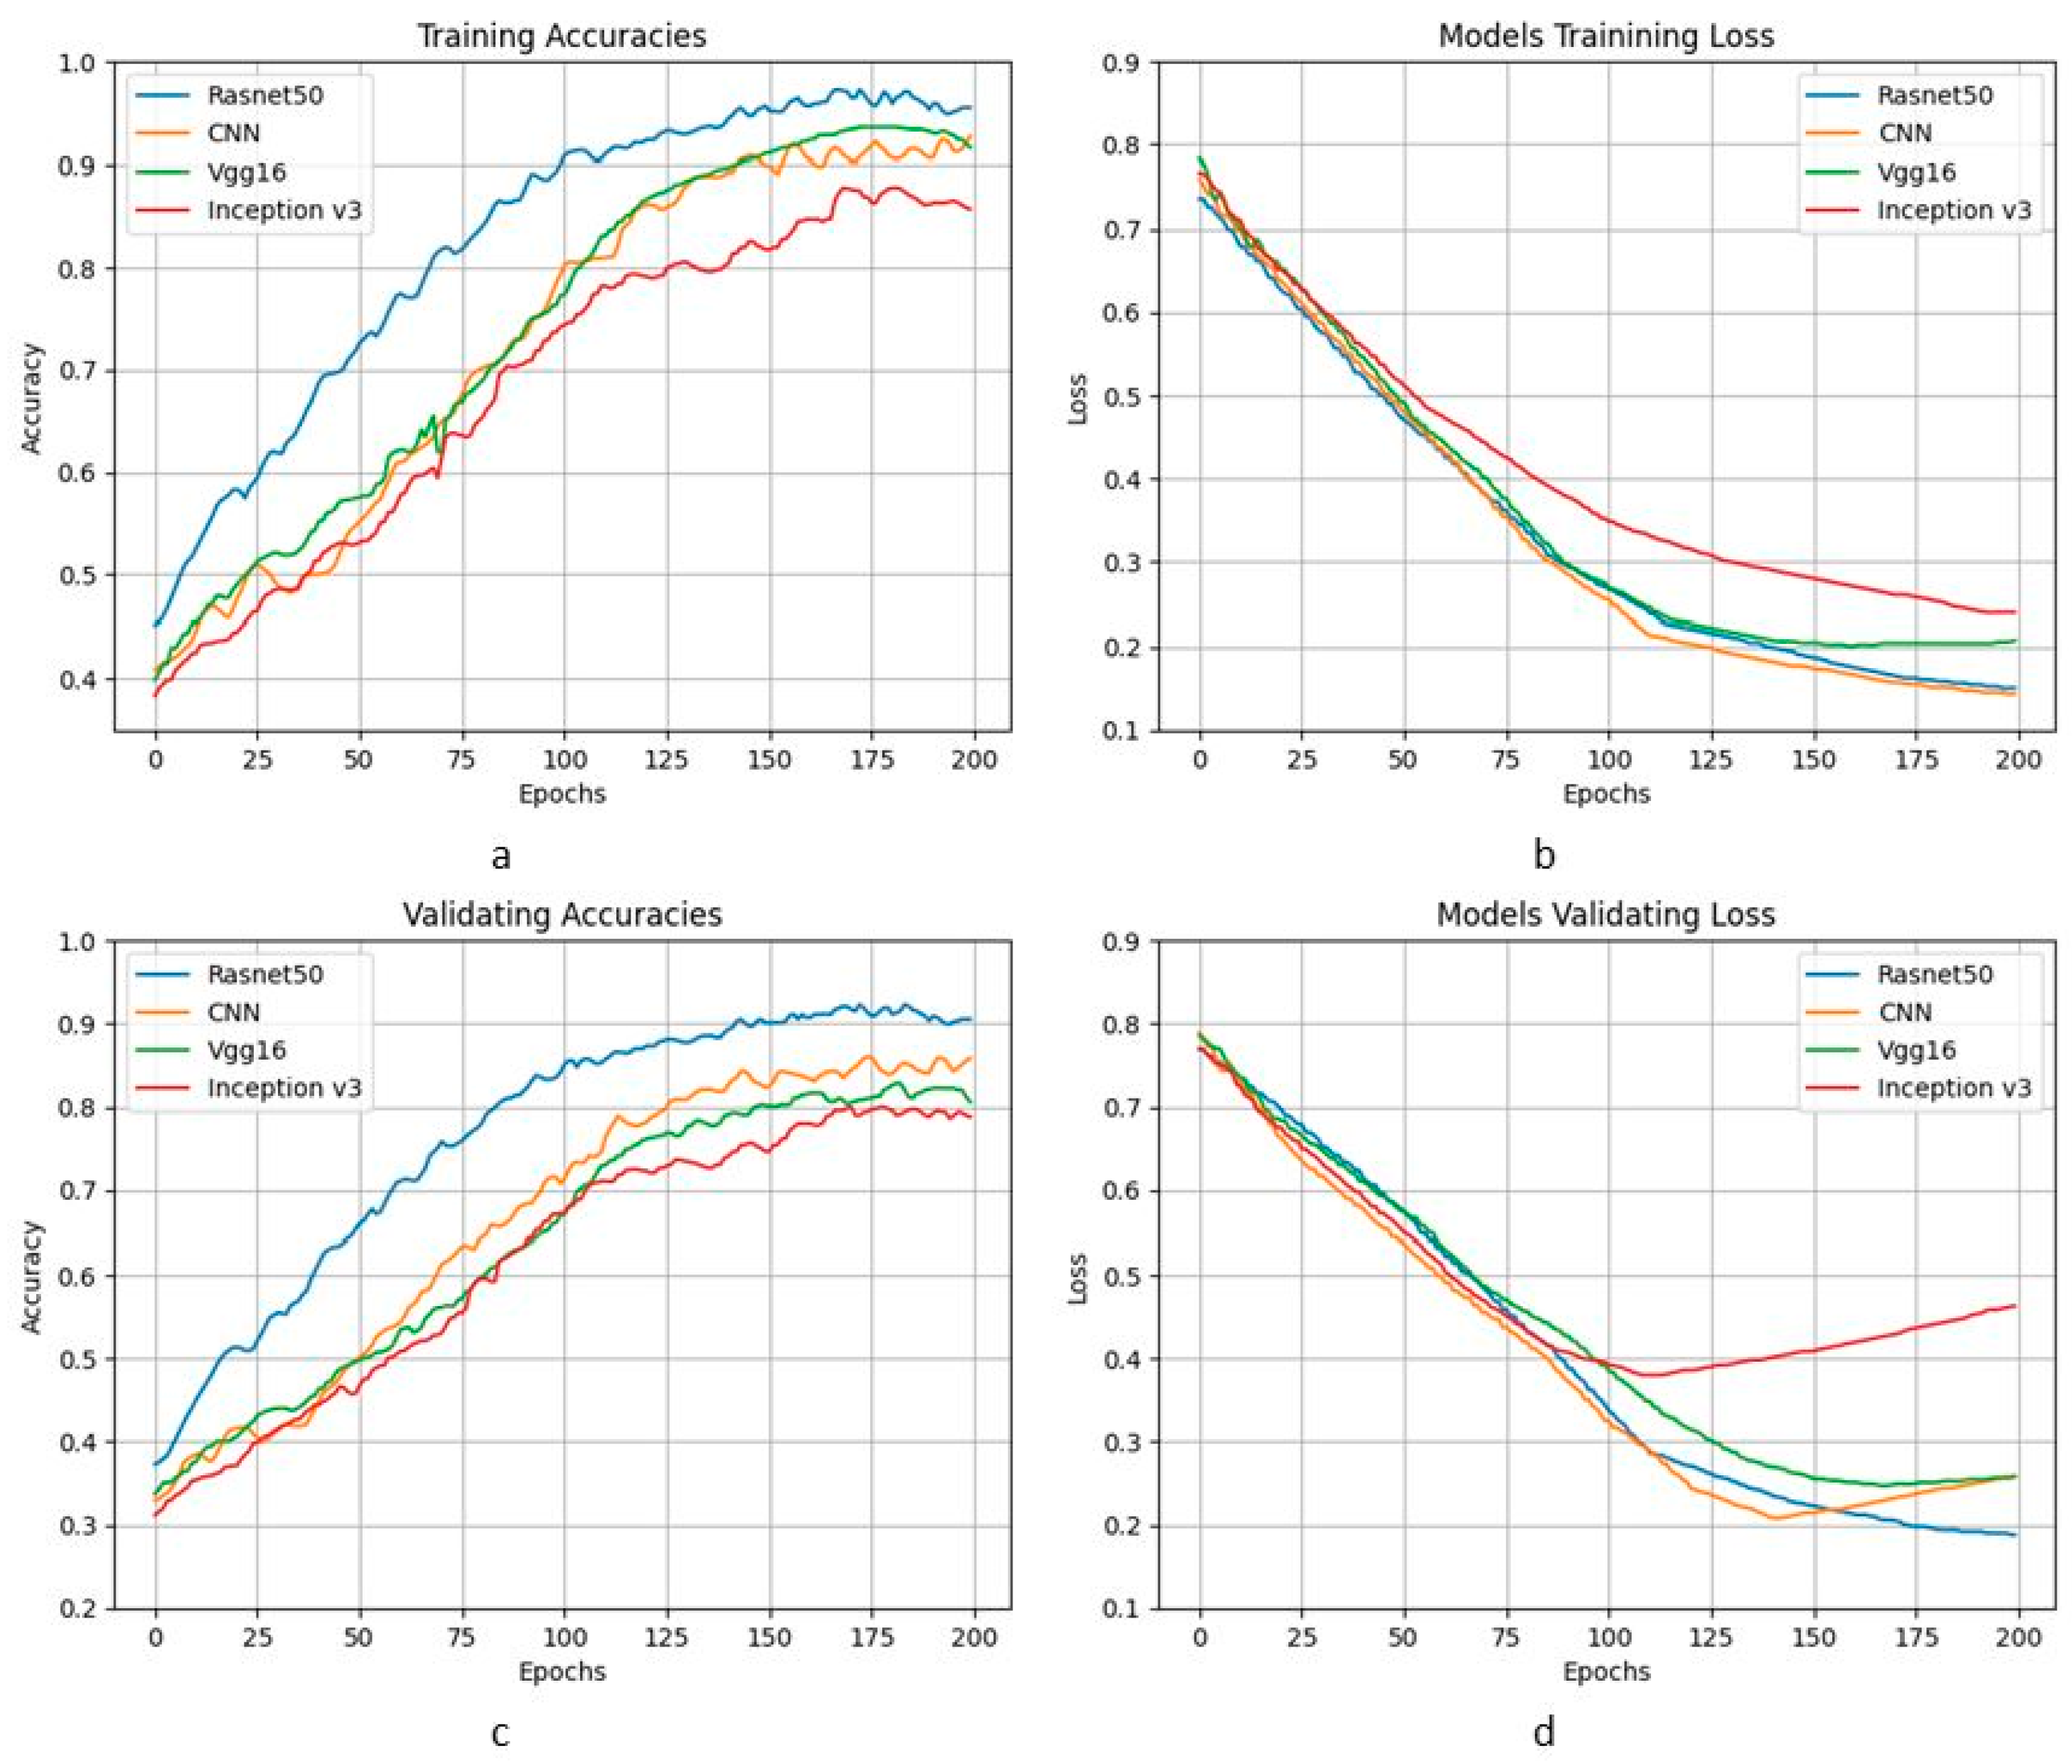
Figure 9 presents a comparative evaluation of the emotion detection models based on the respective dataset. It is clear that all models demonstrate satisfactory results; however, the ResNet50 model outperforms the others in terms of both training and validation accuracy, as well as loss.

4.3. Behavior and Emotion Detection Using Optimal Models

The experimental results indicate that the proposed CNN model outperforms the other employed models in behavior detection. Similarly, ResNet50 excels in emotion detection, making these two models the preferred choices for detecting the respective underlying features from the testing data. Table 7 presents the evaluation results for behavior and emotion detection from the corresponding testing datasets, measured in terms of Precision, Recall, and F-measure. Behavior is classified as engaged or non-engaged using the binary CNN classifier, while emotions are classified as Happy, Sad, Angry, and Neutral using the multiclass ResNet50 classifier. The testing results reveal that the CNN achieves an F-measure of 83% for both categories of behavior detection. In the case of the four emotion categories, ResNet50 provides varying F-measure results: it achieves the highest F-measure of 86% for detecting the Neutral category, followed by the Sad category at 83%, the Angry category at 81%, and the Happy category at the lowest, at 79%.

4.4. Computation of Student Engagement Level

After classifying the behavior and emotion, the Student Engagement Level (SEL) in the Online Classroom Environment (OCE) is computed. To achieve this, the confidence scores from the classification models, along with the survey scores for each engagement state, are integrated. Figure 10 illustrates the process of computing the SEL from the given input image frame.
First, the CNN model classifies the student as engaged or non-engaged. In the case of engagement, the model’s confidence score for the corresponding image frame is recorded. The same image is then sent to the ResNet50 model for emotional state classification, and the model’s confidence score for the detected emotional state is also captured.
Next, the average survey score for the detected emotional state is obtained. Finally, the Student Engagement Level (SEL) is computed using the formulation provided in Equation (1):
S E L i = ( M C S i ) B + ( M C S i ) E + ( S A S ) E S 3
where ( M C S i ) B refers to the model’s confidence score for the classification of the behavior of the student in image i, ( M C S i ) E presents the model’s confidence score for the classification of the emotion of the student in image i, and ( S A S ) E S denotes the student’s average survey score for that particular emotional state. Table 8 depicts some sample image frames and their corresponding SEL.

5. Discussion

The underlying work presents a novel approach for computing students’ engagement and the level of engagement in offline classroom environments (OCEs). While earlier studies have proposed methods for measuring students’ engagement in an OCE or similar settings [2,22,23,24,25,26,27], these approaches often relied on dedicated physical devices or sensors [6,22,24], focused solely on behavioral features [7,23,25], tested limited datasets [8,27], encountered efficiency issues [26], or considered only emotional features [2].
To address these limitations, this study first generated data in the form of facial frames extracted from recorded videos during lectures in an OCE. A self-generated dataset comprising 100 students was utilized, as publicly available datasets [41,42,43] exhibited noise, occlusion, or illumination issues. Additionally, existing self-generated datasets [44,45,46] had a limited number of participants. Furthermore, using publicly available datasets to train models could introduce facial bias when measuring local students’ engagement levels [52,53]. Following data generation, pre-processing was conducted, and four models—CNN, ResNet50, VGG16, and Inception V3—were trained, validated, and tested. Although some proposals have employed machine-learning or convolutional neural network models [2,6,8,22,23,24,26,27], or individual pre-trained transfer-learning models [8,25,28], these works often relied on limited e-learning datasets and achieved constrained accuracy compared to the results presented in this study.
To effectively measure students’ engagement, behavior-reflecting feature frames were incorporated, including having closed eyes (indicating sleeping or using a mobile phone), being focused (looking forward or asking the teacher), looking away (talking to peers or diverting attention from the teacher/board), and yawning. These features were classified into the engaged and non-engaged categories, as seen in similar works [2,7,23,25,54]. The self-trained CNN demonstrated superior performance in the binary classification task, likely due to its inherent ability to learn hierarchical features, encompassing both low-level and high-level details [13]. Once engaged students were identified, their facial emotions—sad, neutral, happy, and angry—were classified, following methodologies established in previous studies [2,13,44,49,55]. Among the employed models, ResNet50 outperformed VGG16 and Inception V3 in this multiclassification task. ResNet50’s effectiveness in multiclassification tasks can be attributed to its residual connections, which facilitate deeper networks in learning identity mappings more effectively, thus handling complex problems [56]. The model confidence scores from both binary and multiclass classification, alongside the average survey scores for the detected emotions, were utilized to compute the Student Engagement Level (SEL) in an OCE. This novel and practical metric holds potential for measuring individual students’ engagement scores in real time during lectures.
Explicit Comparison: Existing works primarily measure students’ engagement in online contexts or controlled offline environments with limited participant numbers and constrained accuracy. Moreover, the exploration of students’ engagement levels remains underdeveloped. Thus, the proposed work offers a more practical solution by being implemented in a real OCE, incorporating 100 participants, achieving a higher accuracy, and computing students’ engagement levels effectively.
Implications: The findings from this research may serve as valuable feedback for novice teachers, enhancing the teaching–learning process. Additionally, the proposed method can personalize education by providing affective content as feedback to both students and teachers. Furthermore, it may facilitate the exploration of the correlation between students’ engagement levels and their performance assessments.
Limitations and Future Directions: While this work incorporates both behavioral and emotional features for measuring student engagement, cognitive features remain unexplored and should be investigated in future studies. Additionally, the introduction of an embedded system for the continuous monitoring of student engagement in real OCE settings could be beneficial. The data collected through this monitoring could provide insights for analytics and support data-driven decision-making in educational policy development.

6. Conclusions

This study presents an effective method for monitoring student engagement in real-time online classroom environments (OCEs). Specifically, it incorporates both behavioral and emotional features to compute student engagement using a self-trained convolutional neural network (CNN)- and transfer-learning models. In terms of behavioral indicators, students who are focused (looking forward or asking the teacher questions) are classified as engaged, which is supported by a 92% survey consensus. Conversely, behaviors such as looking away (talking to peers or avoiding the teacher/board) and yawning are categorized as non-engaged. Regarding emotional features, the survey shows that happiness, neutrality, sadness, and anger are associated with engagement at rates of 88%, 77%, 75%, and 69%, respectively. For detecting behavior-related features, the self-trained CNN classifier outperformed transfer-learning models, achieving training, validation, and testing accuracies of 97%, 91%, and 83%, respectively. On the other hand, for emotion-based feature detection, the ResNet50 model outperformed both the transfer learning-based models and the self-trained CNN, achieving training, validation, and testing accuracies of 95%, 90%, and 82%, respectively. In conclusion, both self-trained and transfer-learning-based models demonstrate efficacy in monitoring student engagement. The overall engagement level is computed using the models’ confidence scores for behavior and emotion classification, combined with survey data.

Author Contributions

Conceptualization, N.M., S.M.B. and H.A.; methodology, N.M. and H.D.; software, N.M.; validation, S.M.B., H.A. and M.R.P.; formal analysis, H.A.; investigation, N.M.; resources, M.R.P.; data curation, N.M.; writing—original draft preparation, N.M., S.M.B. and H.A.; writing—review and editing, N.M.; visualization, N.M.; supervision, S.M.B.; project administration, H.D. All authors have read and agreed to the published version of the manuscript.

Funding

This research received no external funding.

Data Availability Statement

The data presented in this study are available upon request from the corresponding author by request of the volunteer participants (they requested only to share the data if demanded).

Conflicts of Interest

The authors declare no conflicts of interest.

References

  1. Fredricks, J.A.; Blumenfeld, P.C.; Paris, A.H. School engagement: Potential of the concept, state of the evidence. Rev. Educ. Res. 2004, 74, 59–109. [Google Scholar] [CrossRef]
  2. Pabba, C.; Kumar, P. An intelligent system for monitoring students’ engagement in large classroom teaching through facial expression recognition. Expert Syst. 2022, 39, e12839. [Google Scholar] [CrossRef]
  3. Bradbury, N.A. Attention span during lectures: 8 seconds, 10 minutes, or more? Adv. Physiol. Educ. 2016, 40, 509–513. [Google Scholar] [CrossRef] [PubMed]
  4. Exeter, D.J.; Ameratunga, S.; Ratima, M.; Morton, S.; Dickson, M.; Hsu, D.; Jackson, R. Student engagement in very large classes: The teachers’ perspective. Stud. High. Educ. 2010, 35, 761–775. [Google Scholar] [CrossRef]
  5. Sathik, M.; Jonathan, S.G. Effect of facial expressions on student’s comprehension recognition in virtual educational environments. SpringerPlus 2013, 2, 455. [Google Scholar] [CrossRef]
  6. Zaletelj, J.; Košir, A. Predicting students’ attention in the classroom from Kinect facial and body features. EURASIP J. Image Video Process. 2017, 2017, 80. [Google Scholar] [CrossRef]
  7. Klein, R.; Celik, T. The Wits Intelligent Teaching System: Detecting student engagement during lectures using convolutional neural networks. In Proceedings of the 2017 IEEE International Conference on Image Processing (ICIP), Beijing, China, 17–20 September 2017; IEEE: Piscataway, NJ, USA, 2017; pp. 2856–2860. [Google Scholar]
  8. Thomas, C.; Jayagopi, D.B. Predicting student engagement in classrooms using facial behavioralal cues. In Proceedings of the 1st ACM SIGCHI International Workshop on Multimodal Interaction for Education, Glasgow, UK, 13 November 2017; pp. 33–40. [Google Scholar]
  9. Hu, M.; Wei, Y.; Li, M.; Yao, H.; Deng, W.; Tong, M.; Liu, Q. Bimodal Learning Engagement Recognition from Videos in the Classroom. Sensors 2022, 22, 5932. [Google Scholar] [CrossRef] [PubMed]
  10. Fredricks, J.A. The measurement of student engagement: Methodological advances and comparison of new self-report instruments. In Handbook of Research on Student Engagement; Springer International Publishing: Cham, Germany, 2022; pp. 597–616. [Google Scholar]
  11. Dirican, A.C.; Göktürk, M. Psychophysiological measures of human cognitive states applied in human computer interaction. Procedia Comput. Sci. 2011, 3, 1361–1367. [Google Scholar] [CrossRef]
  12. Murshed, M.; Dewan, M.A.A.; Lin, F.; Wen, D. Engagement detection in e-learning environments using convolutional neural networks. In Proceedings of the 2019 IEEE Intl Conf on Dependable, Autonomic and Secure Computing, Intl Conf on Pervasive Intelligence and Computing, Intl Conf on Cloud and Big Data Computing, Intl Conf on Cyber Science and Technology Congress (DASC/PiCom/CBDCom/CyberSciTech), Fukuoka, Japan, 5–8 August 2019; IEEE: Piscataway, NJ, USA, 2019; pp. 80–86. [Google Scholar]
  13. Ma, X.; Xu, M.; Dong, Y.; Sun, Z. Automatic student engagement in online learning environment based on neural turing machine. Int. J. Inf. Educ. Technol. 2021, 11, 107–111. [Google Scholar] [CrossRef]
  14. Bosch, N.; D’mello, S.K.; Ocumpaugh, J.; Baker, R.S.; Shute, V. Using video to automatically detect learner affect in computer-enabled classrooms. ACM Trans. Interact. Intell. Syst. (TiiS) 2016, 6, 1–26. [Google Scholar] [CrossRef]
  15. Zhang, H.; Xiao, X.; Huang, T.; Liu, S.; Xia, Y.; Li, J. A novel end-to-end network for automatic student engagement recognition. In Proceedings of the 2019 IEEE 9th International Conference on Electronics Information and Emergency Communication (ICEIEC), Beijing, China, 12–14 July 2019; IEEE: Piscataway, NJ, USA; pp. 342–345. [Google Scholar]
  16. Mukhopadhyay, M.; Pal, S.; Nayyar, A.; Pramanik, P.K.; Dasgupta, N.; Choudhury, P. Facial emotion detection to assess Learner’s State of mind in an online learning system. In Proceedings of the 2020 5th International Conference on Intelligent Information Technology, Hanoi, Vietnam, 19–22 February 2020; pp. 107–115. [Google Scholar]
  17. Bhardwaj, P.; Gupta, P.K.; Panwar, H.; Siddiqui, M.K.; Morales-Menendez, R.; Bhaik, A. Application of deep learning on student engagement in e-learning environments. Comput. Electr. Eng. 2021, 93, 107277. [Google Scholar] [CrossRef] [PubMed]
  18. Yulina, S.; Elviyenti, M. An Exploratory Data Analysis for Synchronous Online Learning Based on AFEA Digital Images. J. Nas. Tek. Elektro Dan Teknol. Inf. 2022, 11, 114–120. [Google Scholar]
  19. Altuwairqi, K.; Jarraya, S.K.; Allinjawi, A.; Hammami, M. Student behavior analysis to measure engagement levels in online learning environments. Signal Image Video Process. 2021, 15, 1387–1395. [Google Scholar] [CrossRef]
  20. Kim, H.; Küster, D.; Girard, J.M.; Krumhuber, E.G. Human and machine recognition of dynamic and static facial expressions: Prototypicality, ambiguity, and complexity. Front. Psychol. 2023, 14, 1221081. [Google Scholar] [CrossRef] [PubMed]
  21. Mastorogianni, M.E.; Konstanti, S.; Dratsiou, I.; Bamidis, P.D. Masked emotions: Does children’s affective state influence emotion recognition? Front. Psychol. 2024, 15, 1329070. [Google Scholar] [CrossRef]
  22. Peng, S.; Nagao, K. Recognition of students’ mental states in discussion based on multimodal data and its application to educational support. IEEE Access 2021, 9, 18235–18250. [Google Scholar] [CrossRef]
  23. Vanneste, P.; Oramas, J.; Verelst, T.; Tuytelaars, T.; Raes, A.; Depaepe, F.; Van den Noortgate, W. Computer vision and human behaviour, emotion and cognition detection: A use case on student engagement. Mathematics 2021, 9, 287. [Google Scholar] [CrossRef]
  24. Luo, Z.; Chen, J.; Wang, G.; Liao, M. A three-dimensional model of student interest during learning using multimodal fusion with natural sensing technology. Interact. Learn. Environ. 2022, 30, 1117–1130. [Google Scholar] [CrossRef]
  25. Zheng, R.; Jiang, F.; Shen, R. Intelligent student behavioral analysis system for real classrooms. In Proceedings of the ICASSP 2020–2020 IEEE International Conference on Acoustics, Speech, and Signal Processing (ICASSP), Barcelona, Spain, 4–8 May 2020; IEEE: Piscataway, NJ, USA, 2020; pp. 9244–9248. [Google Scholar]
  26. Ashwin, T.S.; Guddeti, R.M. Unobtrusive behavioralal analysis of students in classroom environment using non-verbal cues. IEEE Access 2019, 7, 150693–150709. [Google Scholar] [CrossRef]
  27. Soloviev, V. Machine learning approach for student engagement automatic recognition from facial expressions. Sci. Publ. State Univ. Novi Pazar Ser. A Appl. Math. Inform. Mech. 2018, 10, 79–86. [Google Scholar] [CrossRef]
  28. Zhang, Z.; Fort, J.M.; Mateu, L.G. Facial expression recognition in virtual reality environments: Challenges and opportunities. Front. Psychol. 2023, 14, 1280136. [Google Scholar] [CrossRef]
  29. Muarraf, A.; Ahmad, H.; Ahmad, W.; Faisal, N.; Ahmad, M. Research Trend Analysis of Artificial Intelligence. In Proceedings of the 2020 30th International Conference on Computer Theory and Applications (ICCTA), Alexandria, Egypt, 12–14 December 2020; IEEE: Piscataway, NJ, USA, 2020; pp. 49–53. [Google Scholar]
  30. Maheen, F.; Asif, M.; Ahmad, H.; Ahmad, S.; Alturise, F.; Asiry, O.; Ghadi, Y.Y. Automatic computer science domain multiple-choice questions generation based on informative sentences. PeerJ Comput. Sci. 2022, 8, e1010. [Google Scholar] [CrossRef]
  31. Rashid, H.U.; Ibrikci, T.; Paydaş, S.; Binokay, F.; Çevik, U. Analysis of breast cancer classification robustness with radiomics feature extraction and deep learning techniques. Expert Syst. 2022, 39, e13018. [Google Scholar] [CrossRef]
  32. Thakur, A.; Aggarwal, P.; Dubey, A.K.; Abdelgawad, A.; Rocha, A. Design of decision model for sensitive crop irrigation system. Expert Syst. 2022, 40, e13119. [Google Scholar] [CrossRef]
  33. Nyangaresi, V.O.; Ahmad, M.; Alkhayyat, A.; Feng, W. Artificial Neural Network and Symmetric Key Cryptography Based Verification Protocol for 5G Enabled Internet of Things. Expert Syst. 2022, 39, e13126. [Google Scholar] [CrossRef]
  34. Asif, M.; Ishtiaq, A.; Ahmad, H.; Aljuaid, H.; Shah, J. Sentiment analysis of extremism in social media from textual information. Telemat. Inform. 2020, 48, 101345. [Google Scholar] [CrossRef]
  35. Ahmad, H.; Nasir, F.; Faisal, C.M.N.; Ahmad, S. Depression Detection in Online Social Media Users Using Natural Language Processing Techniques. In Handbook of Research on Opinion Mining and Text Analytics on Literary Works and Social Media; IGI Global: Hershey, PA, USA, 2022; pp. 323–347. [Google Scholar]
  36. Ahmad, H.; Ahmad, S.; Asif, M.; Rehman, M.; Alharbi, A.; Ullah, Z. Evolution-based performance prediction of star cricketers. Comput. Mater. Contin. 2021, 69, 1215–1232. [Google Scholar] [CrossRef]
  37. Teng, Y.; Zhang, J.; Sun, T. Data-driven decision-making model based on artificial intelligence in higher education system of colleges and universities. Expert Syst. 2022, 40, e12820. [Google Scholar] [CrossRef]
  38. Gamulin, J.; Gamulin, O.; Kermek, D. Using Fourier coefficients in time series analysis for student performance prediction in blended learning environments. Expert Syst. 2016, 33, 189–200. [Google Scholar] [CrossRef]
  39. Sunaryono, D.; Siswantoro, J.; Anggoro, R. An android based course attendance system using face recognition. J. King Saud Univ.-Comput. Inf. Sci. 2021, 33, 304–312. [Google Scholar] [CrossRef]
  40. Karimah, S.N.; Hasegawa, S. Automatic engagement estimation in smart education/learning settings: A systematic review of engagement definitions, datasets, and methods. Smart Learn. Environ. 2022, 9, 31. [Google Scholar] [CrossRef]
  41. Wang, S.; Liu, Z.; Lv, S.; Lv, Y.; Wu, G.; Peng, P.; Chen, F.; Wang, X. A natural visible and infrared facial expression database for expression recognition and emotion inference. IEEE Trans. Multimed. 2010, 12, 682–691. [Google Scholar] [CrossRef]
  42. Gupta, A.; D’Cunha, A.; Awasthi, K.; Balasubramanian, V. Daisee: Towards user engagement recognition in the wild. arXiv 2016, arXiv:1609.01885. [Google Scholar]
  43. Dhall, A.; Sharma, G.; Goecke, R.; Gedeon, T. Emotiw 2020: Driver gaze, group emotion, student engagement and physiological signal-based challenges. In Proceedings of the 2020 International Conference on Multimodal Interaction, Utrecht, The Netherlands, 25–29 October 2020; pp. 784–789. [Google Scholar]
  44. Dubovi, I. Cognitive and emotional engagement while learning with VR: The perspective of multimodal methodology. Comput. Educ. 2022, 183, 104495. [Google Scholar] [CrossRef]
  45. Ashwin, T.S.; Guddeti, R.M.R. Automatic detection of students’ affective states in classroom environment using hybrid convolutional neural networks. Educ. Inf. Technol. 2020, 25, 1387–1415. [Google Scholar]
  46. Apicella, A.; Arpaia, P.; Frosolone, M.; Improta, G.; Moccaldi, N.; Pollastro, A. EEG-based measurement system for monitoring student engagement in learning 4.0. Sci. Rep. 2022, 12, 5857. [Google Scholar] [CrossRef]
  47. Goldberg, P.; Sümer, Ö.; Stürmer, K.; Wagner, W.; Göllner, R.; Gerjets, P.; Kasneci, E.; Trautwein, U. Attentive or not? Toward a machine learning approach to assessing students’ visible engagement in classroom instruction. Educ. Psychol. Rev. 2021, 33, 27–49. [Google Scholar] [CrossRef]
  48. Baltrušaitis, T.; Robinson, P.; Morency, L.-P. Openface: An open-source facial behavioural analysis toolkit. In Proceedings of the 2016 IEEE Winter Conference on Applications of Computer Vision (WACV), Lake Placid, NY, USA, 7–10 March 2016; IEEE: Piscataway, NJ, USA, 2016; pp. 1–10. [Google Scholar]
  49. Abedi, A.; Khan, S. Affect-driven engagement measurement from videos. Computer 2021, 11, 12. [Google Scholar] [CrossRef]
  50. Mehta, N.K.; Prasad, S.S.; Saurav, S.; Saini, R.; Singh, S. Three-dimensional DenseNet self-attention neural network for automatic detection of student’s engagement. Appl. Intell. 2022, 52, 13803–13823. [Google Scholar] [CrossRef]
  51. Thomas, C.; Sarma, K.A.P.; Gajula, S.S.; Jayagopi, D.B. Automatic prediction of presentation style and student engagement from videos. Comput. Educ. Artif. Intell. 2022, 3, 100079. [Google Scholar] [CrossRef]
  52. Acharya, S.; Reza, M. Real-time emotion engagement tracking of students using human biometric emotion intensities. In Machine Learning for Biometrics; Academic Press: Cambridge, MA, USA, 2022; pp. 143–153. [Google Scholar]
  53. Li, Y.-T.; Yeh, S.-L.; Huang, T.-R. The cross-race effect in automatic facial expression recognition violates measurement invariance. Front. Psychol. 2023, 14, 1201145. [Google Scholar] [CrossRef]
  54. Ikram, S.; Ahmad, H.; Mahmood, N.; Faisal, C.M.N.; Abbas, Q.; Qureshi, I.; Hussain, A. Recognition of student engagement state in a classroom environment using deep and efficient transfer learning algorithm. Appl. Sci. 2023, 13, 8637. [Google Scholar] [CrossRef]
  55. Pan, M.; Wang, J.; Luo, Z. Modelling study on learning affects for classroom teaching/learning auto-evaluation. Sci. J. Educ. 2018, 6, 81–86. [Google Scholar] [CrossRef]
  56. Abedi, A.; Khan, S.S. Improving state-of-the-art in detecting student engagement with resnet and tcn hybrid network. In Proceedings of the 2021 18th Conference on Robots and Vision (CRV), Burnaby, BC, Canada, 26–28 May 2021; IEEE: Piscataway, NJ, USA, 2021; pp. 151–157. [Google Scholar]
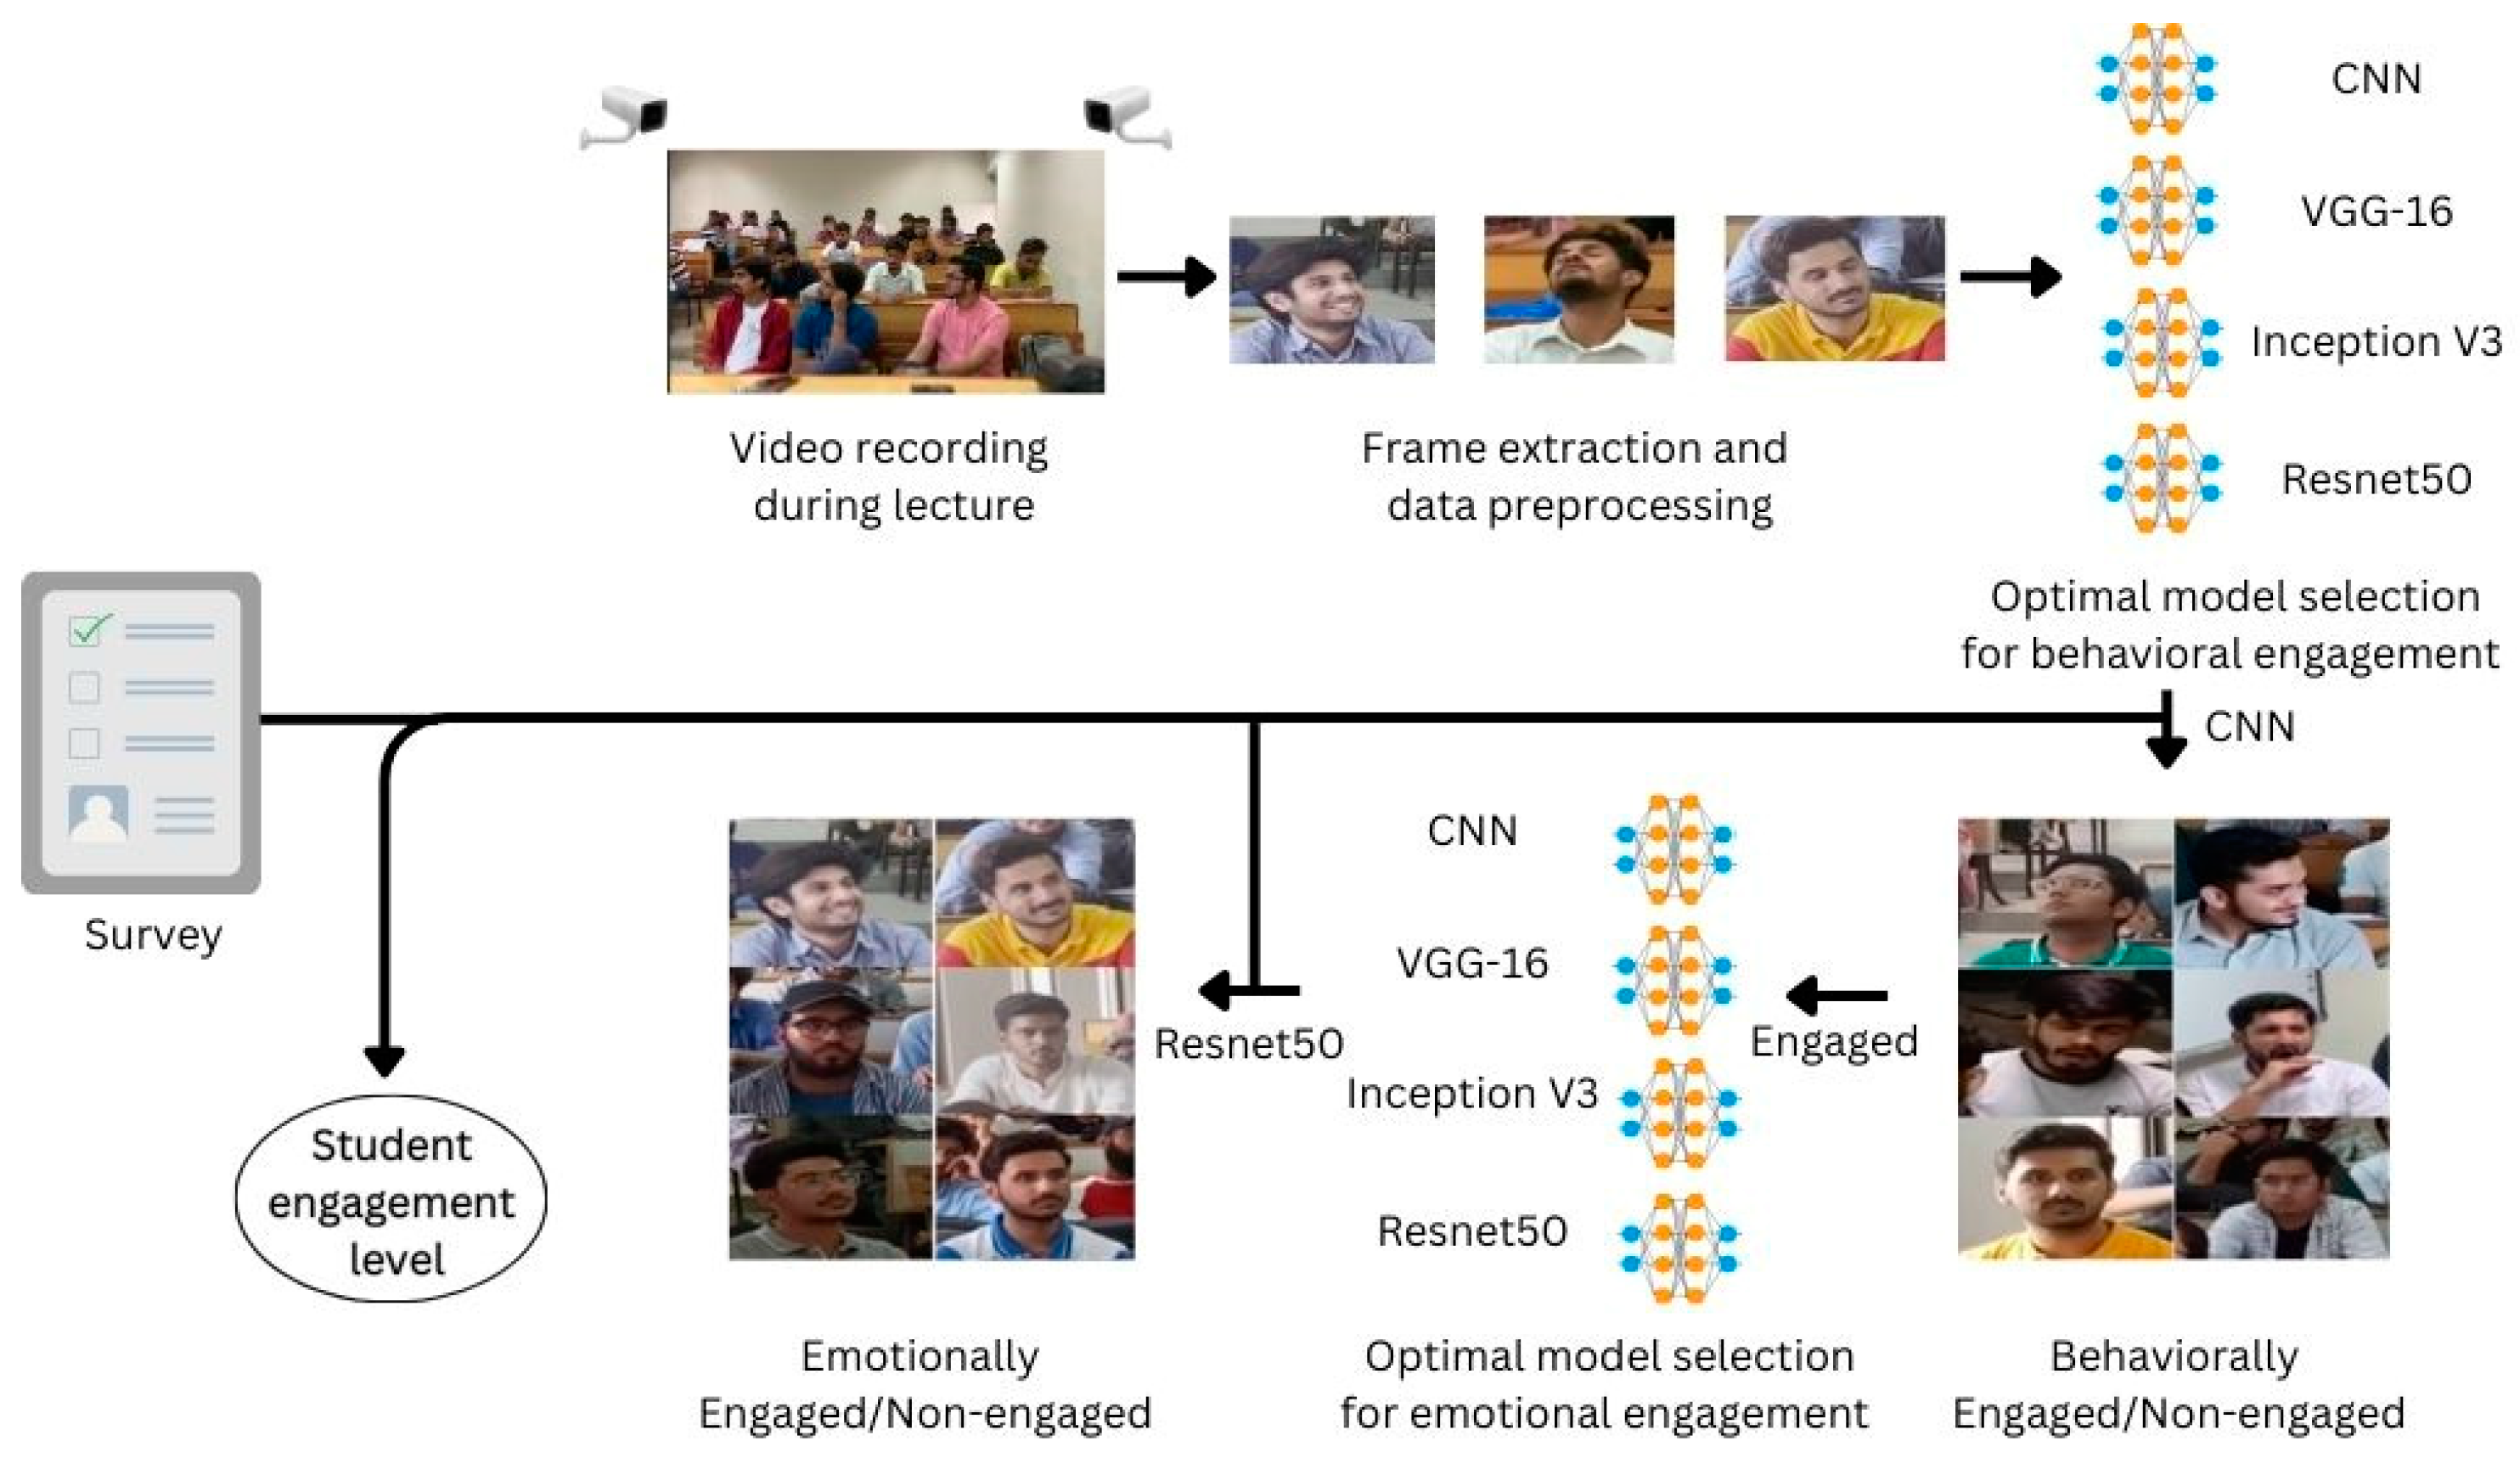
Figure 1. Proposed methodology.
Algorithms 17 00458 g001
Figure 2. Behavioral reflecting frames.
Algorithms 17 00458 g002
Figure 3. Emotion-reflecting frames.
Algorithms 17 00458 g003
Figure 4. Proposed CNN architecture for measuring behavior level.
Algorithms 17 00458 g004
Figure 5. Proposed ResNet50 architecture for measuring emotion level.
Algorithms 17 00458 g005
Figure 6. Intra-comparison of behavior detection models’ training and validation accuracies and training and validation losses: (a) CNN; (b) VGG16; (c) ResNet50; and (d) Inception V3.
Algorithms 17 00458 g006
Figure 7. Inter-comparison of behavior detection models: (a) training accuracy; (b) training loss; (c) validation accuracy; and (d) validation loss.
Algorithms 17 00458 g007
Figure 8. Intra-comparison of emotion detection models’ training and validation accuracies and training and validation losses: (a) ResNet50; (b) CNN; (c) VGG16; and (d) Inception V3.
Algorithms 17 00458 g008
Figure 9. Inter-comparison of emotion detection models: (a) training accuracy; (b) training loss; (c) validation accuracy; and (d) validation loss.
Algorithms 17 00458 g009
Figure 10. Student engagement level computation.
Algorithms 17 00458 g010
Table 1. Comparison with earlier works.
ReferencesDatasetNo. of ParticipantsFeaturesInputClassificationMethodologyStudent Engagement LevelTest Accuracy
[2]Self-generated61Facial expression, eye-tracking, EDA dataDedicated sensorsEmotional engagement, cognitive engagementLinear mixed-effects model
for facial, ANOVA for eye tracking
No51%
[13]Self-generated, BAUM-1, DAiSEE, and YawDD50Bored, confused, focused, frustrated, yawning, sleepyImagesLow, medium, and high engagementCNNNo76.9%
[44]DAiSEE112Eye-gaze, FAU, head pose, body poseImagesCompletely disengaged, barely engaged, engaged, and highly engagedNeural Turing machineNo61%
[45]Self-generated50Facial expressions, body posturesImagesEngaged, non-engaged, and neutralInception V3No86%
[46]DAiSEE and EmotiW112Gaze direction and head poseImagesLow- and high-level engagementLSTM and TCNNo63%
[49]Self-generated21EEG signals and performance testsEEG SignalEmotion level, cognitive levelSVMNo76.7%
76.9%
Table 2. Behavioral and emotional features’ frame count.
DatasetFeaturesNo. of Frames
Closed eyes648
Focused723
BehavioralLooking away650
Yawning600
Happy710
EmotionalSad708
Angry500
Neutral550
Table 3. Summary of the survey.
FeaturesEngagedNon-EngagedScale (1–10)
Average Score
Behavior reflecting featuresLooking away--69%5.5
Yawning--71%5.5
Focused92%--7.7
Closed eyes--98%6.2
Sad69%--6.6
Emotion reflecting featureHappy88%--8
Angry75%--6.2
Neutral77%--6.8
Table 4. Training parameters.
ParametersValues
Epochs200
Batch size16
Activation functionReLU
Learning rate0.0001
Image size155 × 155 × 3
OptimizerAdam
Binary-class loss functionBinary cross-entropy
Multi-class loss function Categorical cross-entropy
Table 5. Evaluation results for behavior detection.
ModelTraining
Accuracy (%)
Validation
Accuracy (%)
Training
Loss
Validation
Loss
Testing
Accuracy (%)
Optimal
Solution
CNN97910.120.1583Yes
VGG1691850.220.2676No
Inception V393800.280.4669No
ResNet5090810.230.2971No
Table 6. Evaluation results for emotion detection.
ModelTraining
Accuracy (%)
Validation Accuracy (%)Training LossValidation LossTesting
Accuracy (%)
Optimal
Solution
CNN92860.140.2670No
VGG1691800.210.2662No
Inception V385790.240.4658No
ResNet5095900.150.1982Yes
Table 7. Evaluation metrics for behavior and emotion detection from testing dataset.
Detection TypeTesting AccuracyModPrecisionRecallF-Measure
Behavior detection using CNN0.83Engaged0.840.820.83
Non-Engaged0.820.840.83
Emotion detection using ResNet500.82Happy0.800.780.79
Sad0.850.820.83
Angry0.820.800.81
Neutral0.820.890.86
Table 8. Student engagement level.
Sample Image Frame(MCSi)BDetected Emotional State(MCSi)E(SAS)ESSEL
Algorithms 17 00458 i0017.5Happy8.17.17.5
Algorithms 17 00458 i002NANANANANot engaged
Algorithms 17 00458 i0036.5Angry7.076.8
Algorithms 17 00458 i0048.5Sad666.5
Algorithms 17 00458 i0057Neutral866.9
Disclaimer/Publisher’s Note: The statements, opinions and data contained in all publications are solely those of the individual author(s) and contributor(s) and not of MDPI and/or the editor(s). MDPI and/or the editor(s) disclaim responsibility for any injury to people or property resulting from any ideas, methods, instructions or products referred to in the content.