

Ensemble Heuristic–Metaheuristic Feature Fusion Learning for Heart Disease Diagnosis Using Tabular Data


Abstract
1. Introduction
- The introduction of an advanced ensemble heuristic–metaheuristic feature fusion learning (EHMFFL) algorithm as a robust model in predicting heart diseases;
- The construction of a heterogeneous ensemble learning model for heart disease diagnosis comprising seven base learners: support vector machine (SVM), K-nearest neighbors (KNNs), logistic regression (LR), random forest (RF), naive bayes (NB), decision tree (DT), and eXtreme Gradient Boosting (XGBoost) techniques;
- The presentation of a combined heuristic–metaheuristic algorithm (called PCC–GWO) to select an optimal feature subset for each machine learning model, separately. In the PCC–GWO model, at first, the PCC is used to calculate an importance score for each feature. Then, these scores are used as heuristic knowledge to guide the search process of the GWO for obtaining the best achievable feature subset;
- The analysis of the relationships between different variables within the cardiovascular datasets using a correlation heat map (CHM), and the evaluation of the performance of the EHMFFL algorithm using different measures: accuracy, precision, recall, F1 score, specificity, and the receiver operating characteristic (ROC);
- The successful development of the EHMFFL algorithm in MATLAB R2022b for heart disease prediction using the Cleveland and Statlog datasets, respectively.
2. Literature Review
2.1. Machine Learning Approaches
2.2. Ensemble Learning Approaches
2.3. Feature Selection Algorithms
2.4. Our Contributions Compared with the Literature
3. Data Gathering
4. Proposed EHMFFL Algorithm
4.1. Feature Selection Using PCC–GWO
| Algorithm 1. Feature selection using PCC–GWO algorithm. |
| Input: |
| Full heart disease dataset |
| Output: |
| Optimal Feature Subset for Machine Learning Model |
| Heuristic Feature Selection: Calculation of Importance Scores using PCC: |
|
| Metaheuristic Feature Selection: Final Feature Subset Selection using GWO: |
|
4.1.1. Calculating the Importance Score of Features Using PCC
- (1)
- The correlation coefficient of each feature i with the class is computed as CCi;
- (2)
- The correlation coefficient of each feature i in relation to the other features is calculated as CFi;
- (3)
- The importance score of each feature i can be calculated as ISi = CCi/CFi.
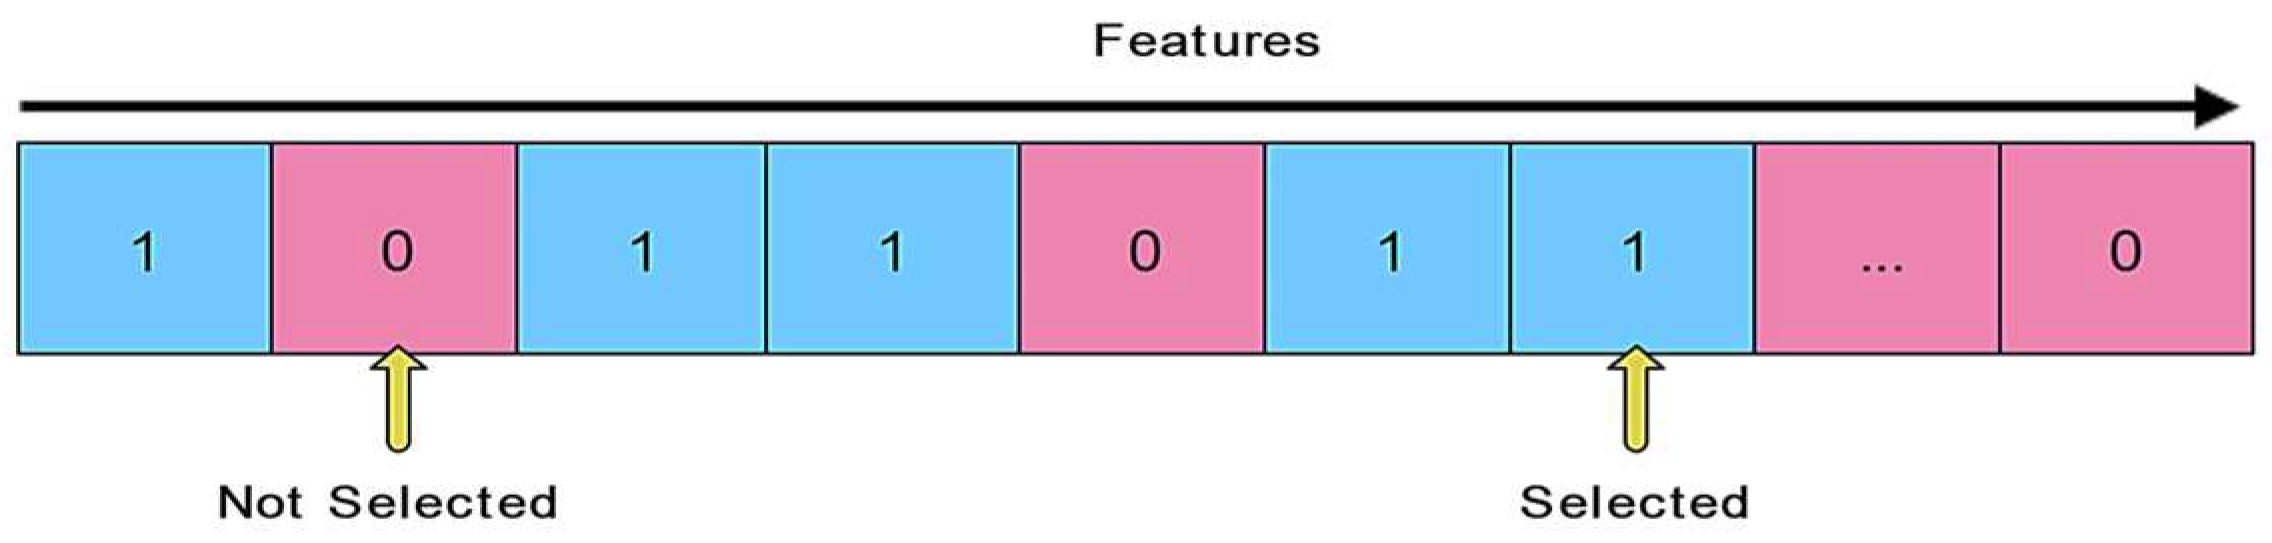
4.1.2. Feature Subset Selection Using GWO
- Alpha (α): the finest solution;
- Beta (β): the second best solution;
- Delta (δ): the third best solution;
- Omega (ω): the rest of the grey wolves.
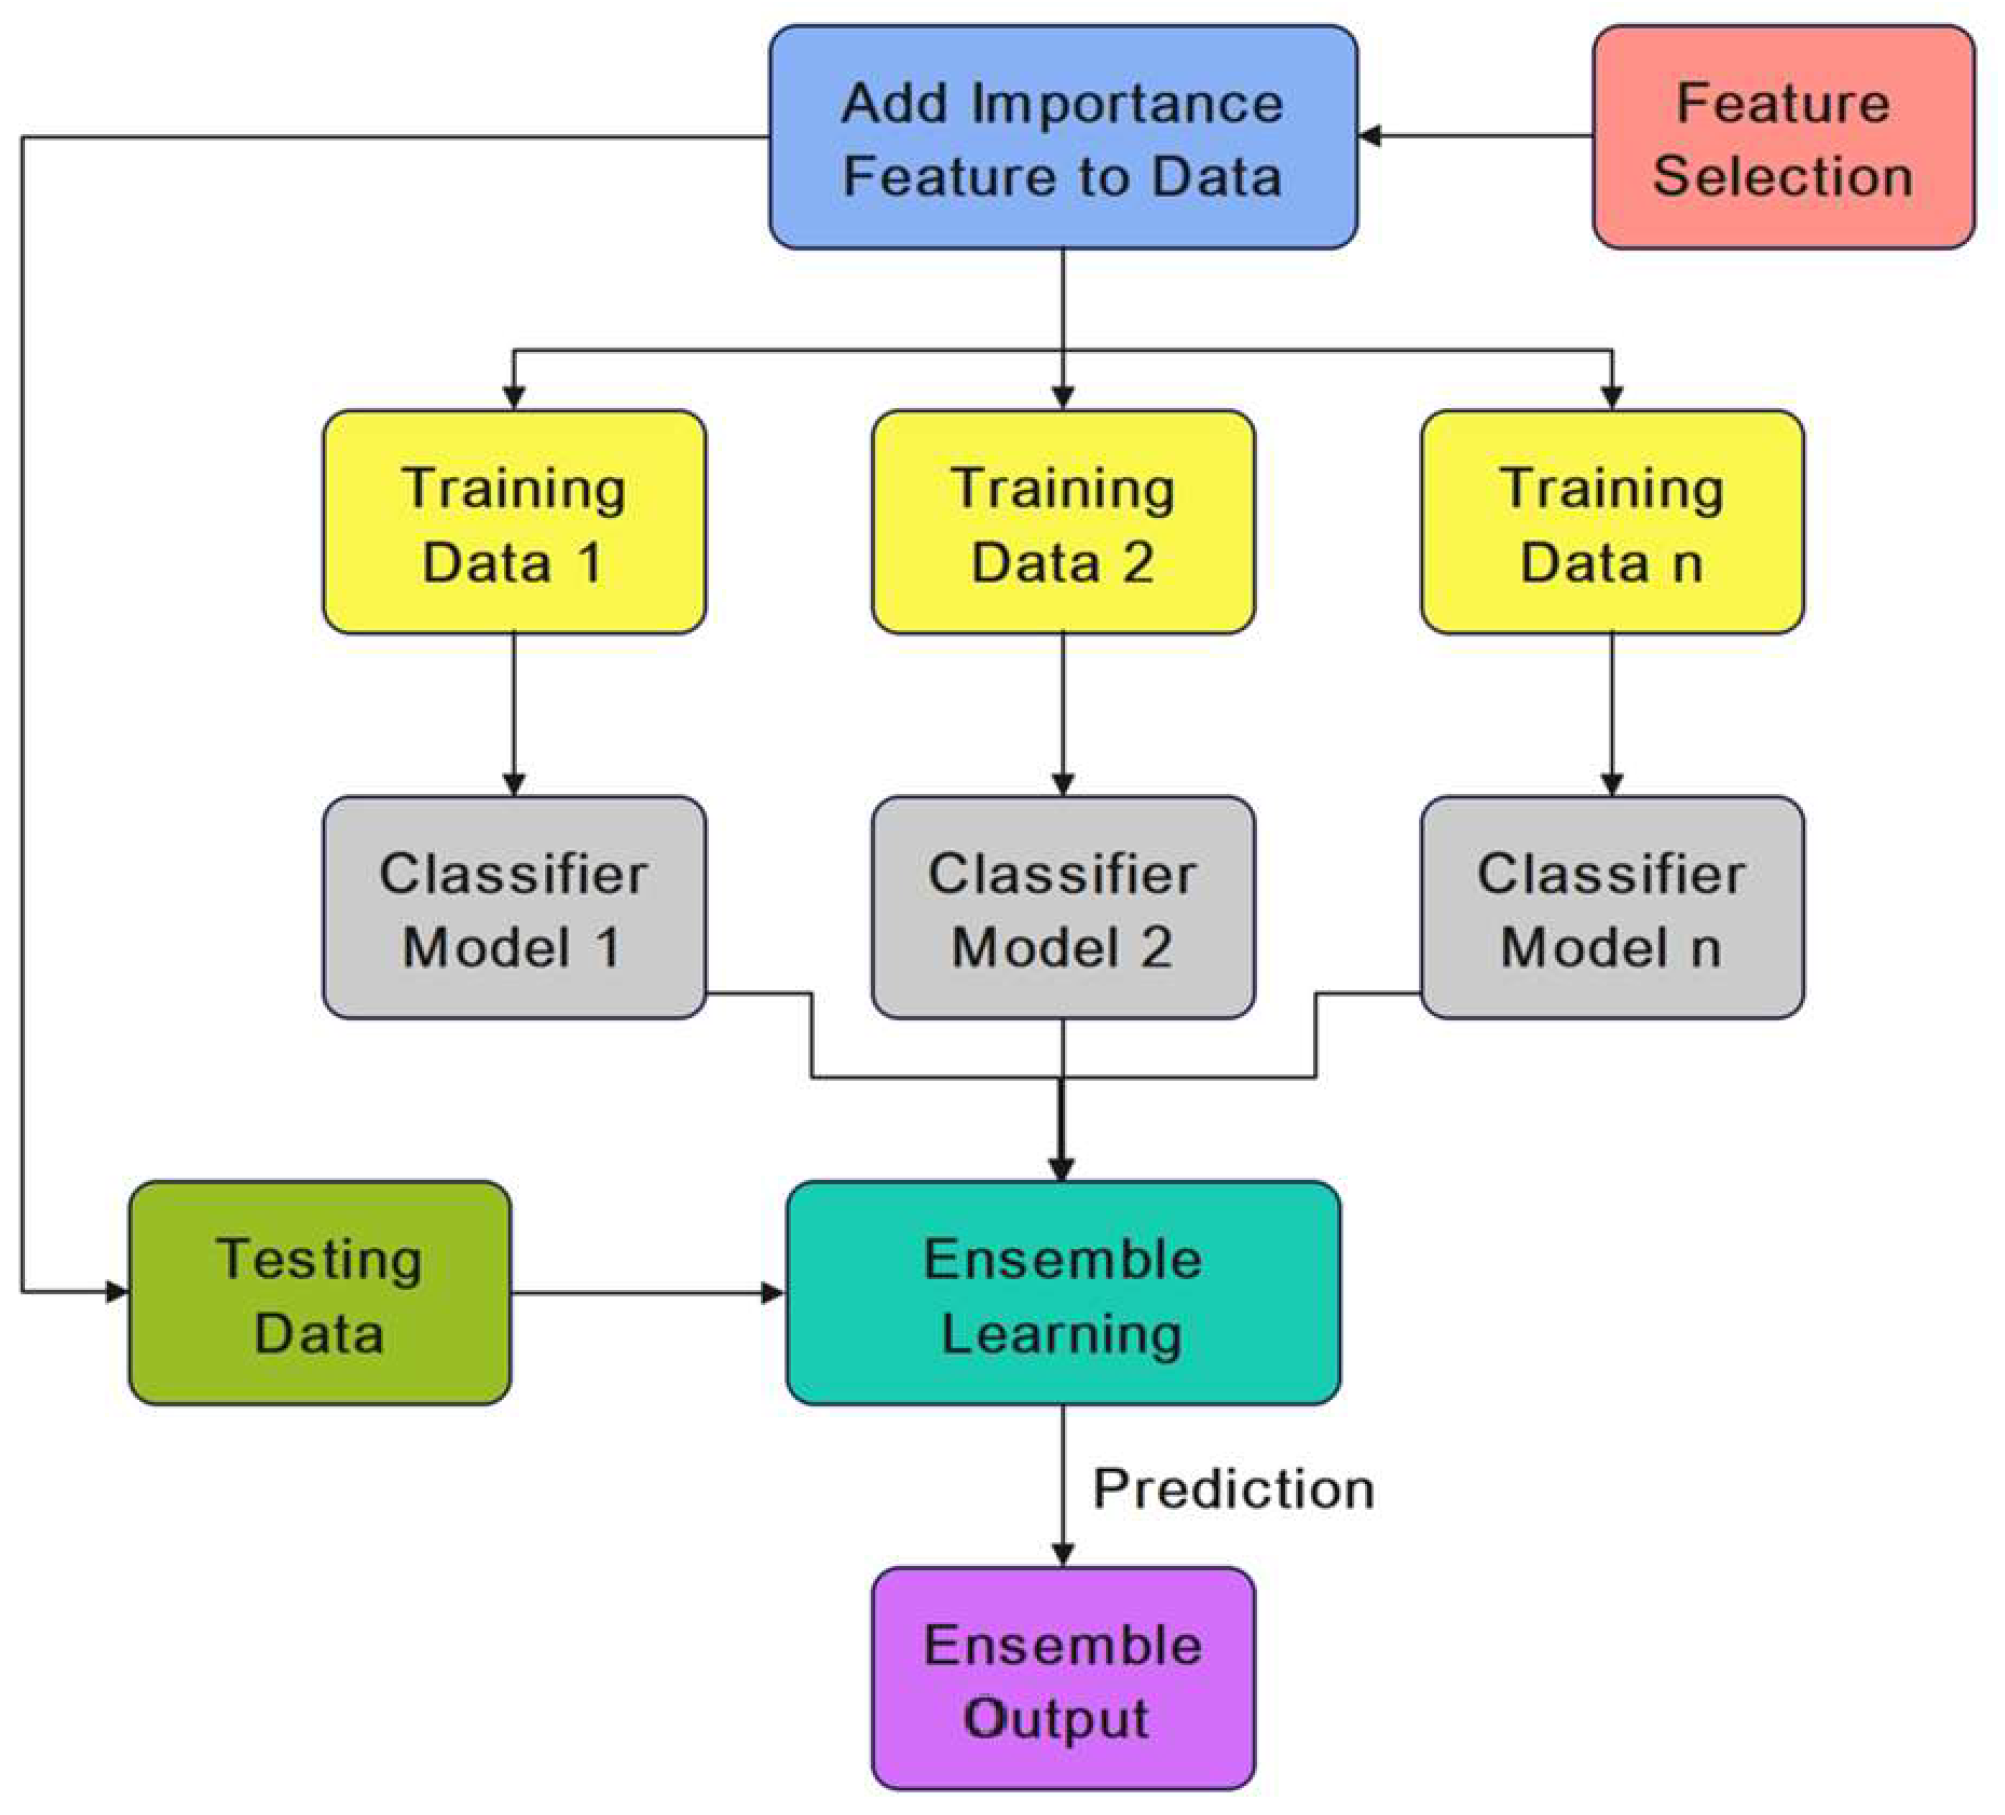
4.2. Ensemble Learning Model
5. Evaluation and Findings
5.1. Performance Metrics
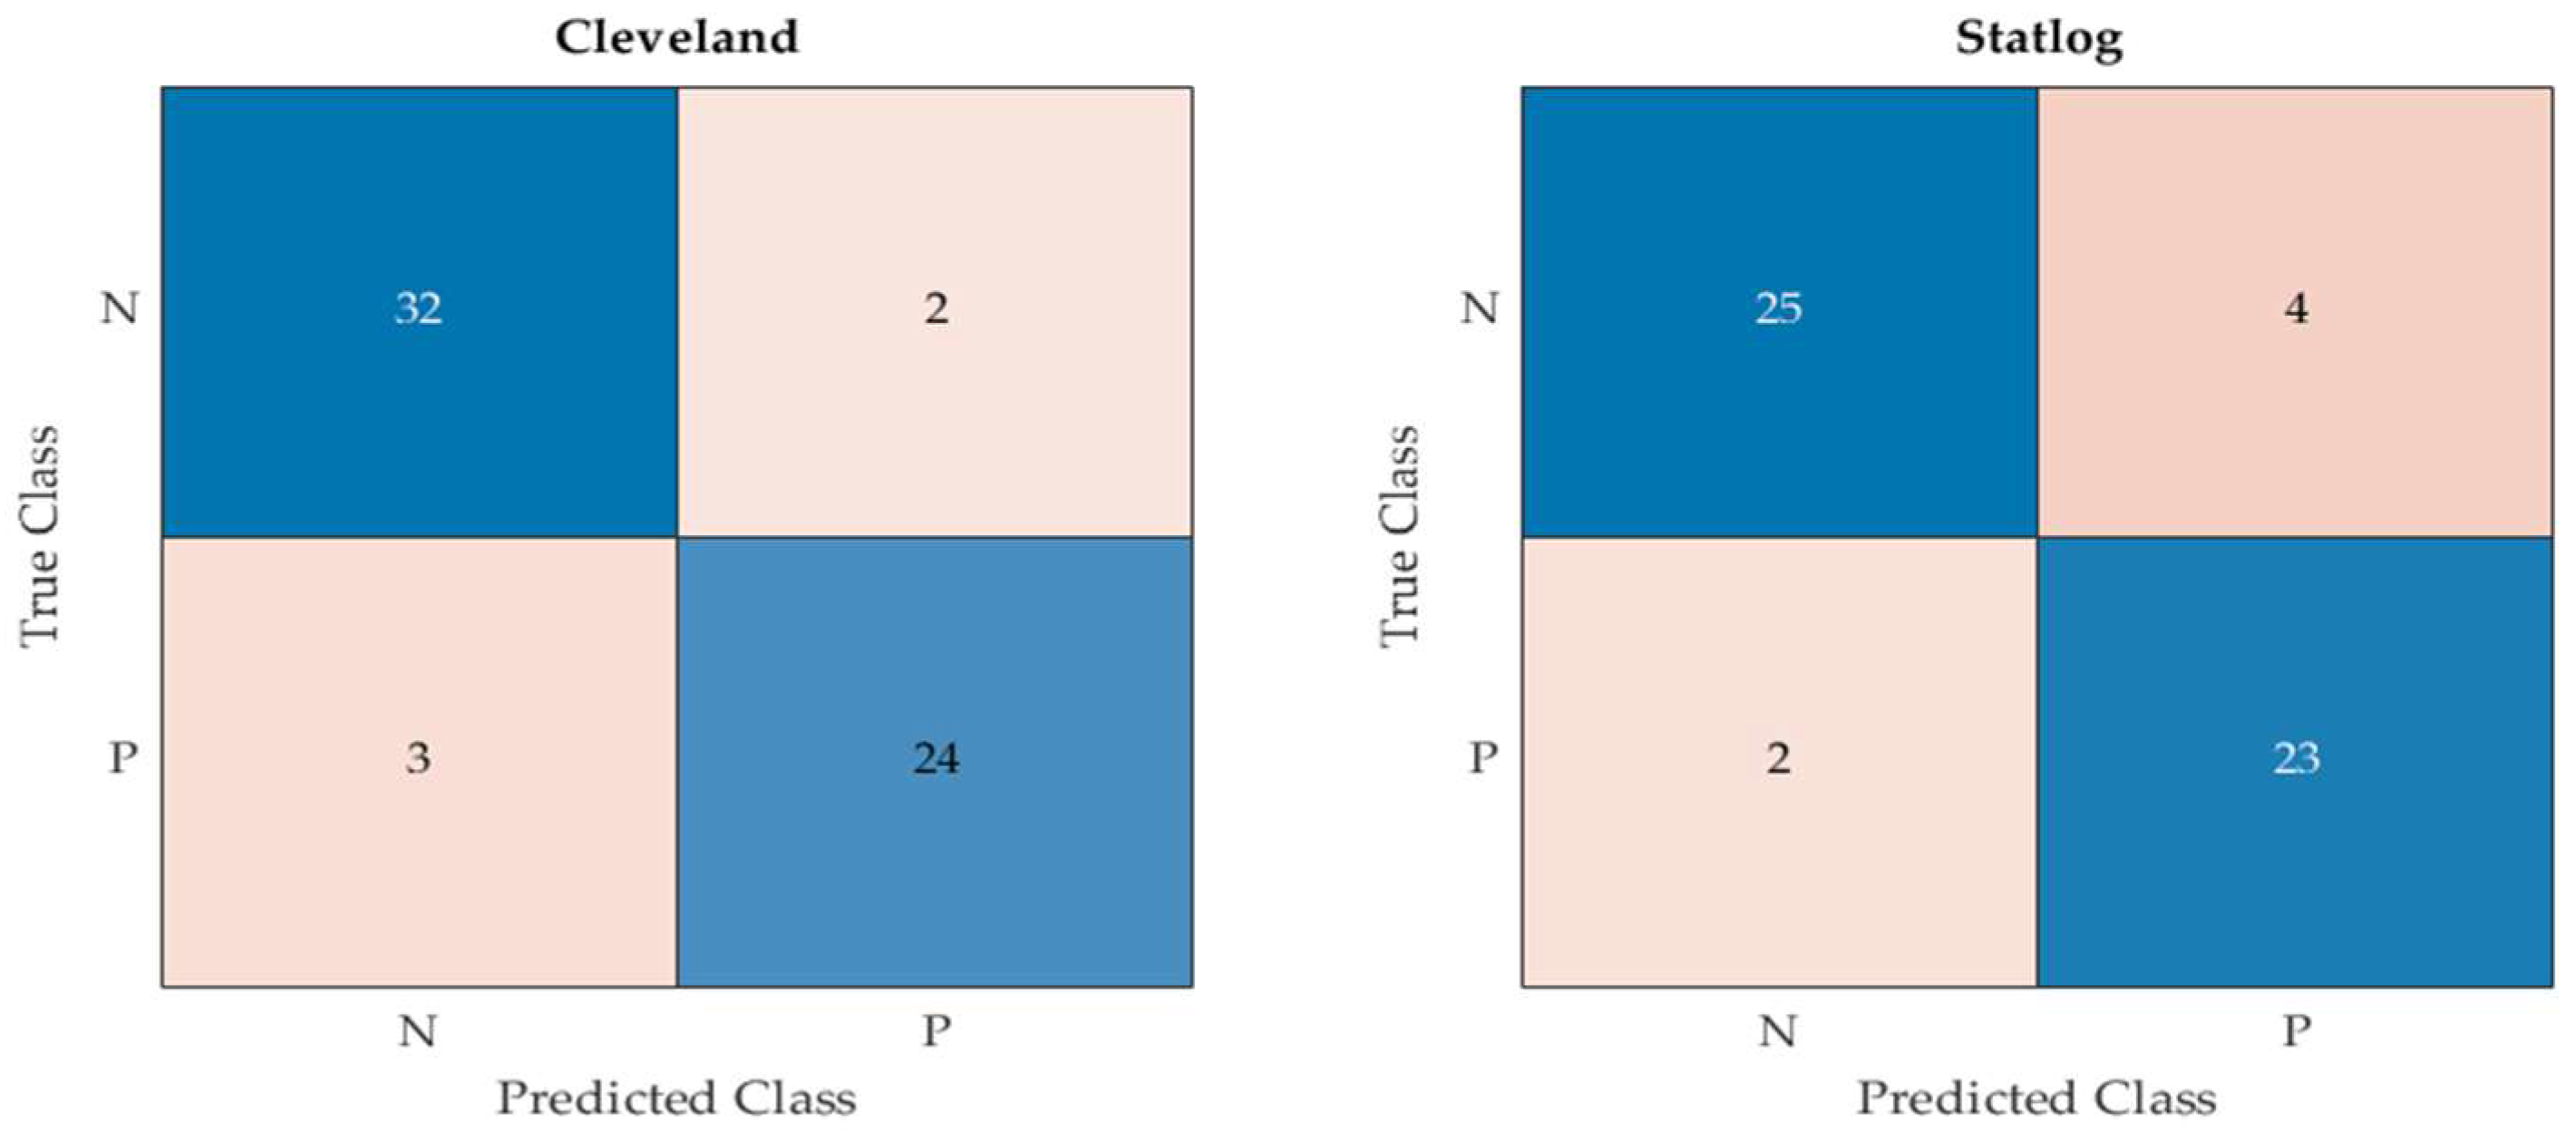
- True positive (TP): the number of correctly identified positive instances inside the desired class;
- True negative (TN): the number of correctly identified negative instances outside the desired class;
- False positive (FP): the number of incorrectly predicted positive samples when the actual target was negative;
- False negative (FN): the number of incorrectly predicted negative samples when the actual target was positive.
5.2. Experimental Findings
5.2.1. Running Time Analysis
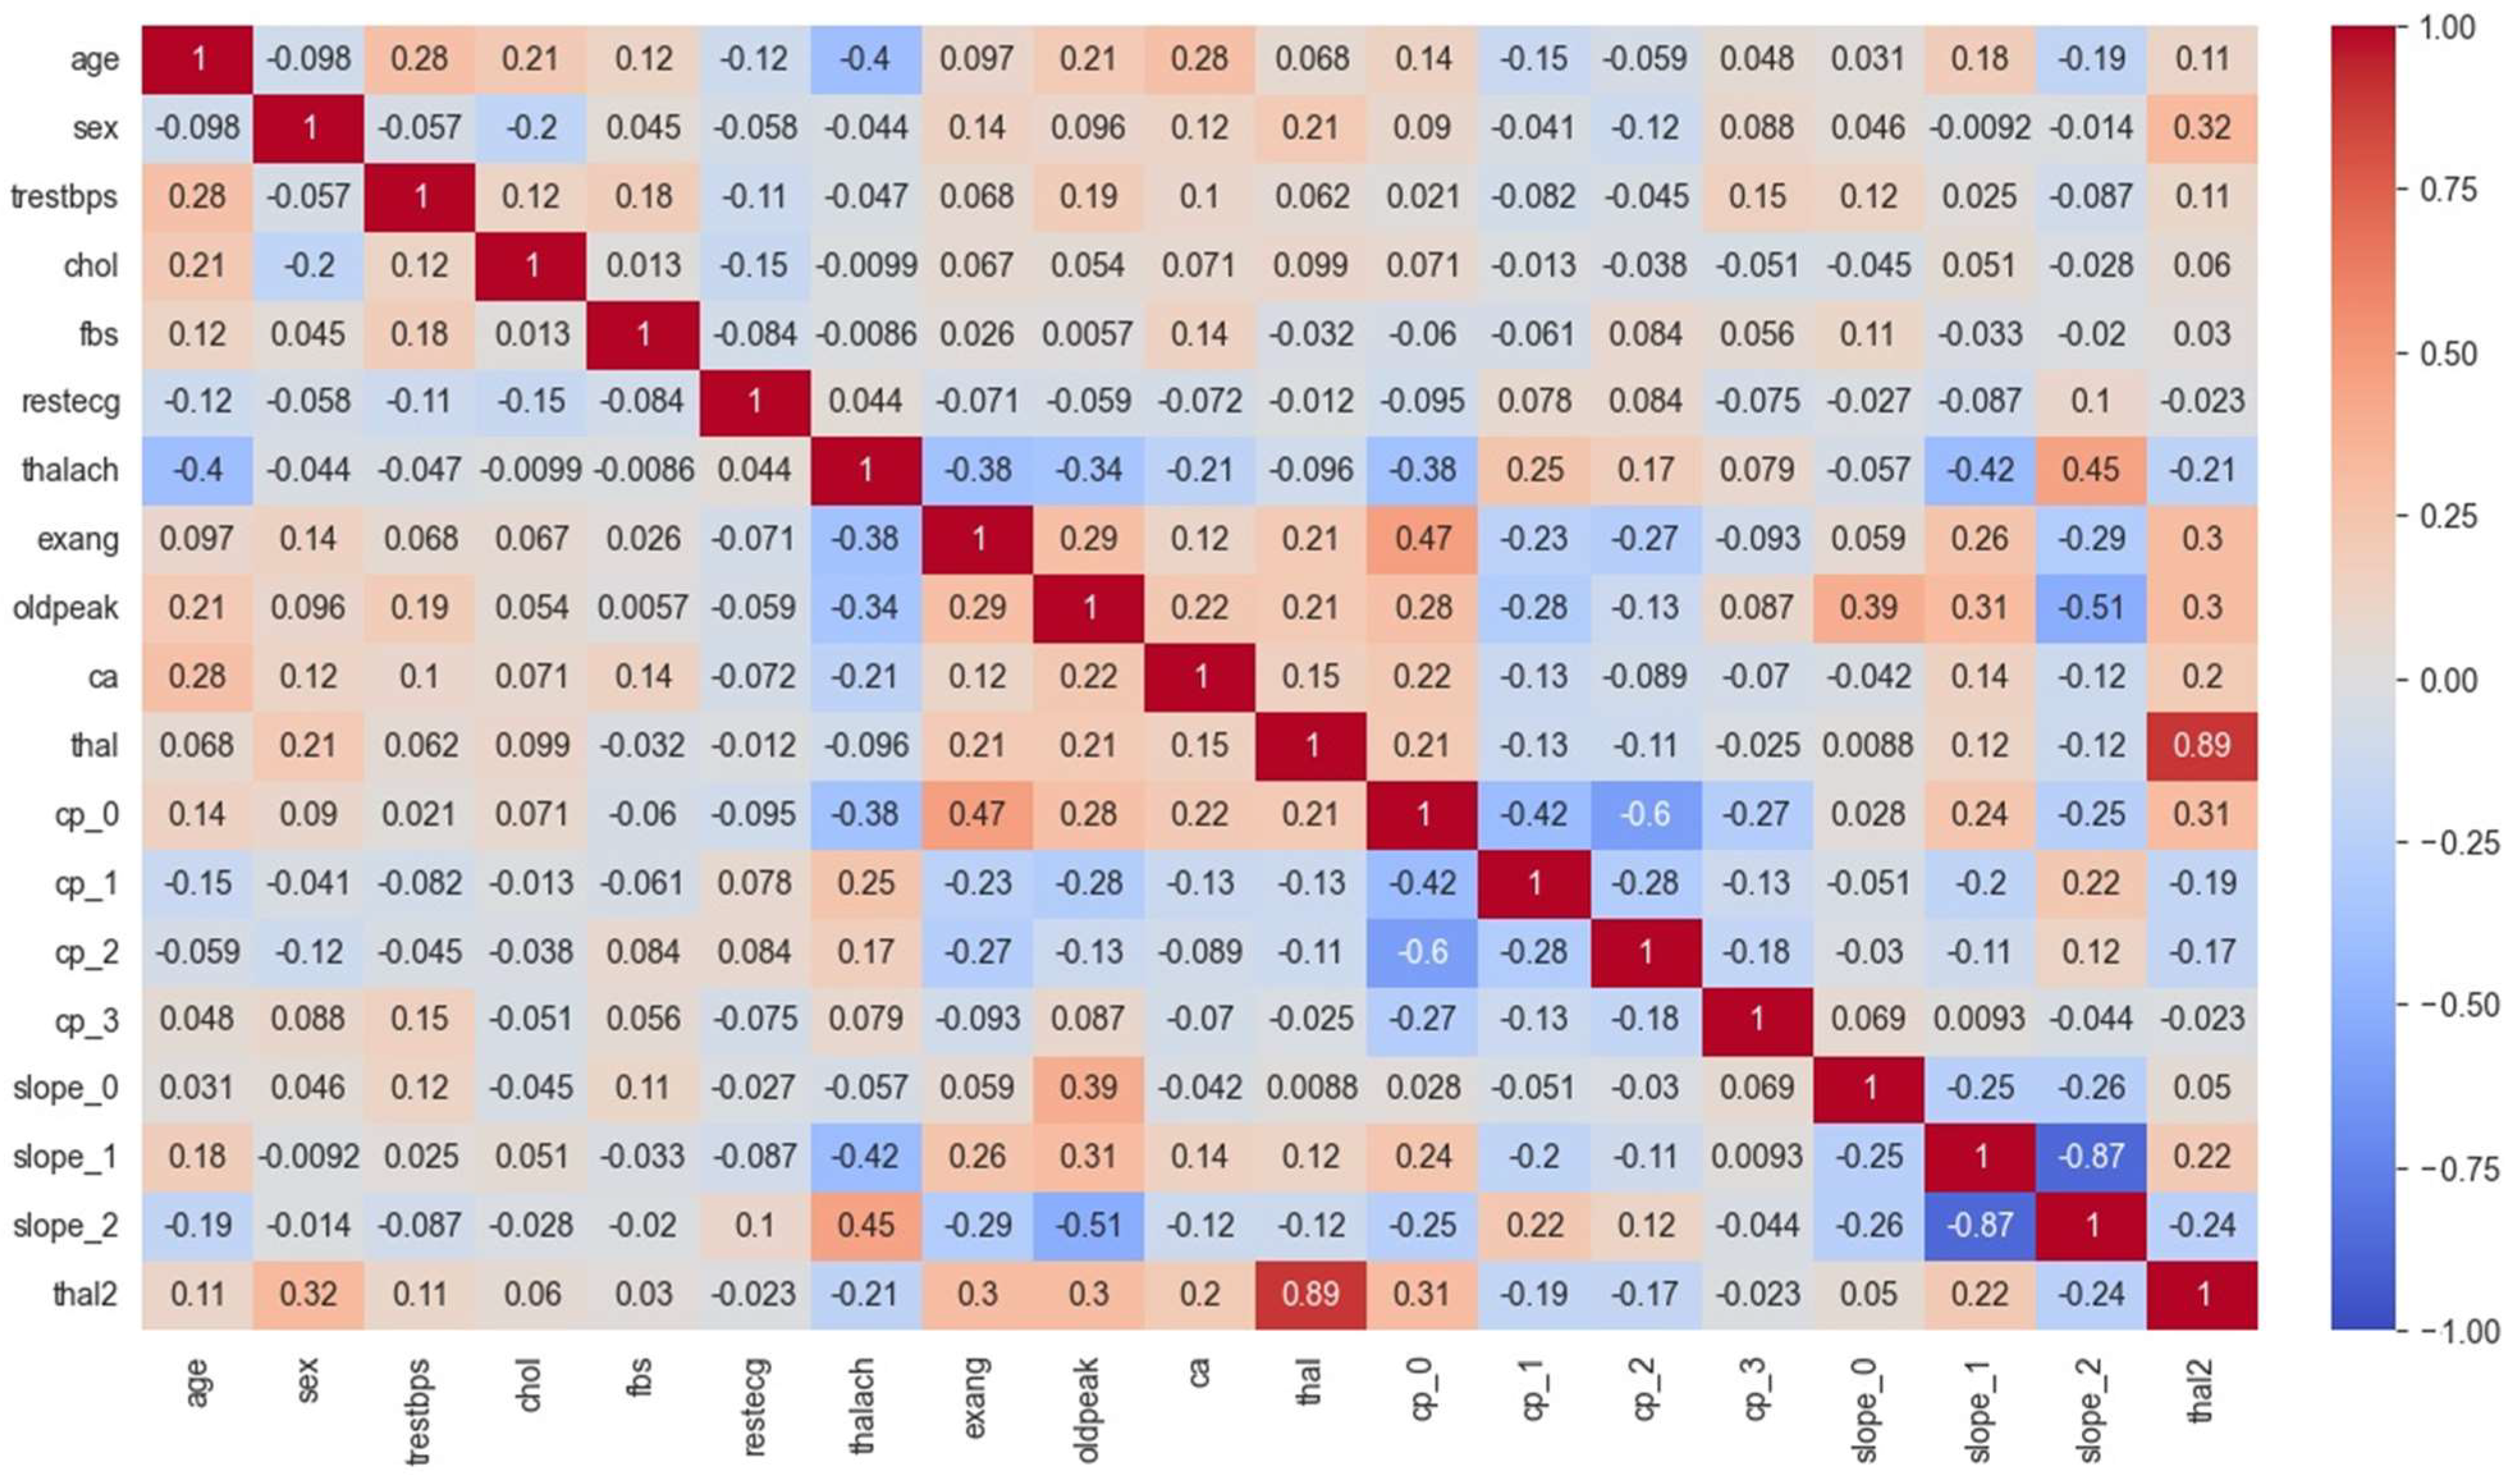
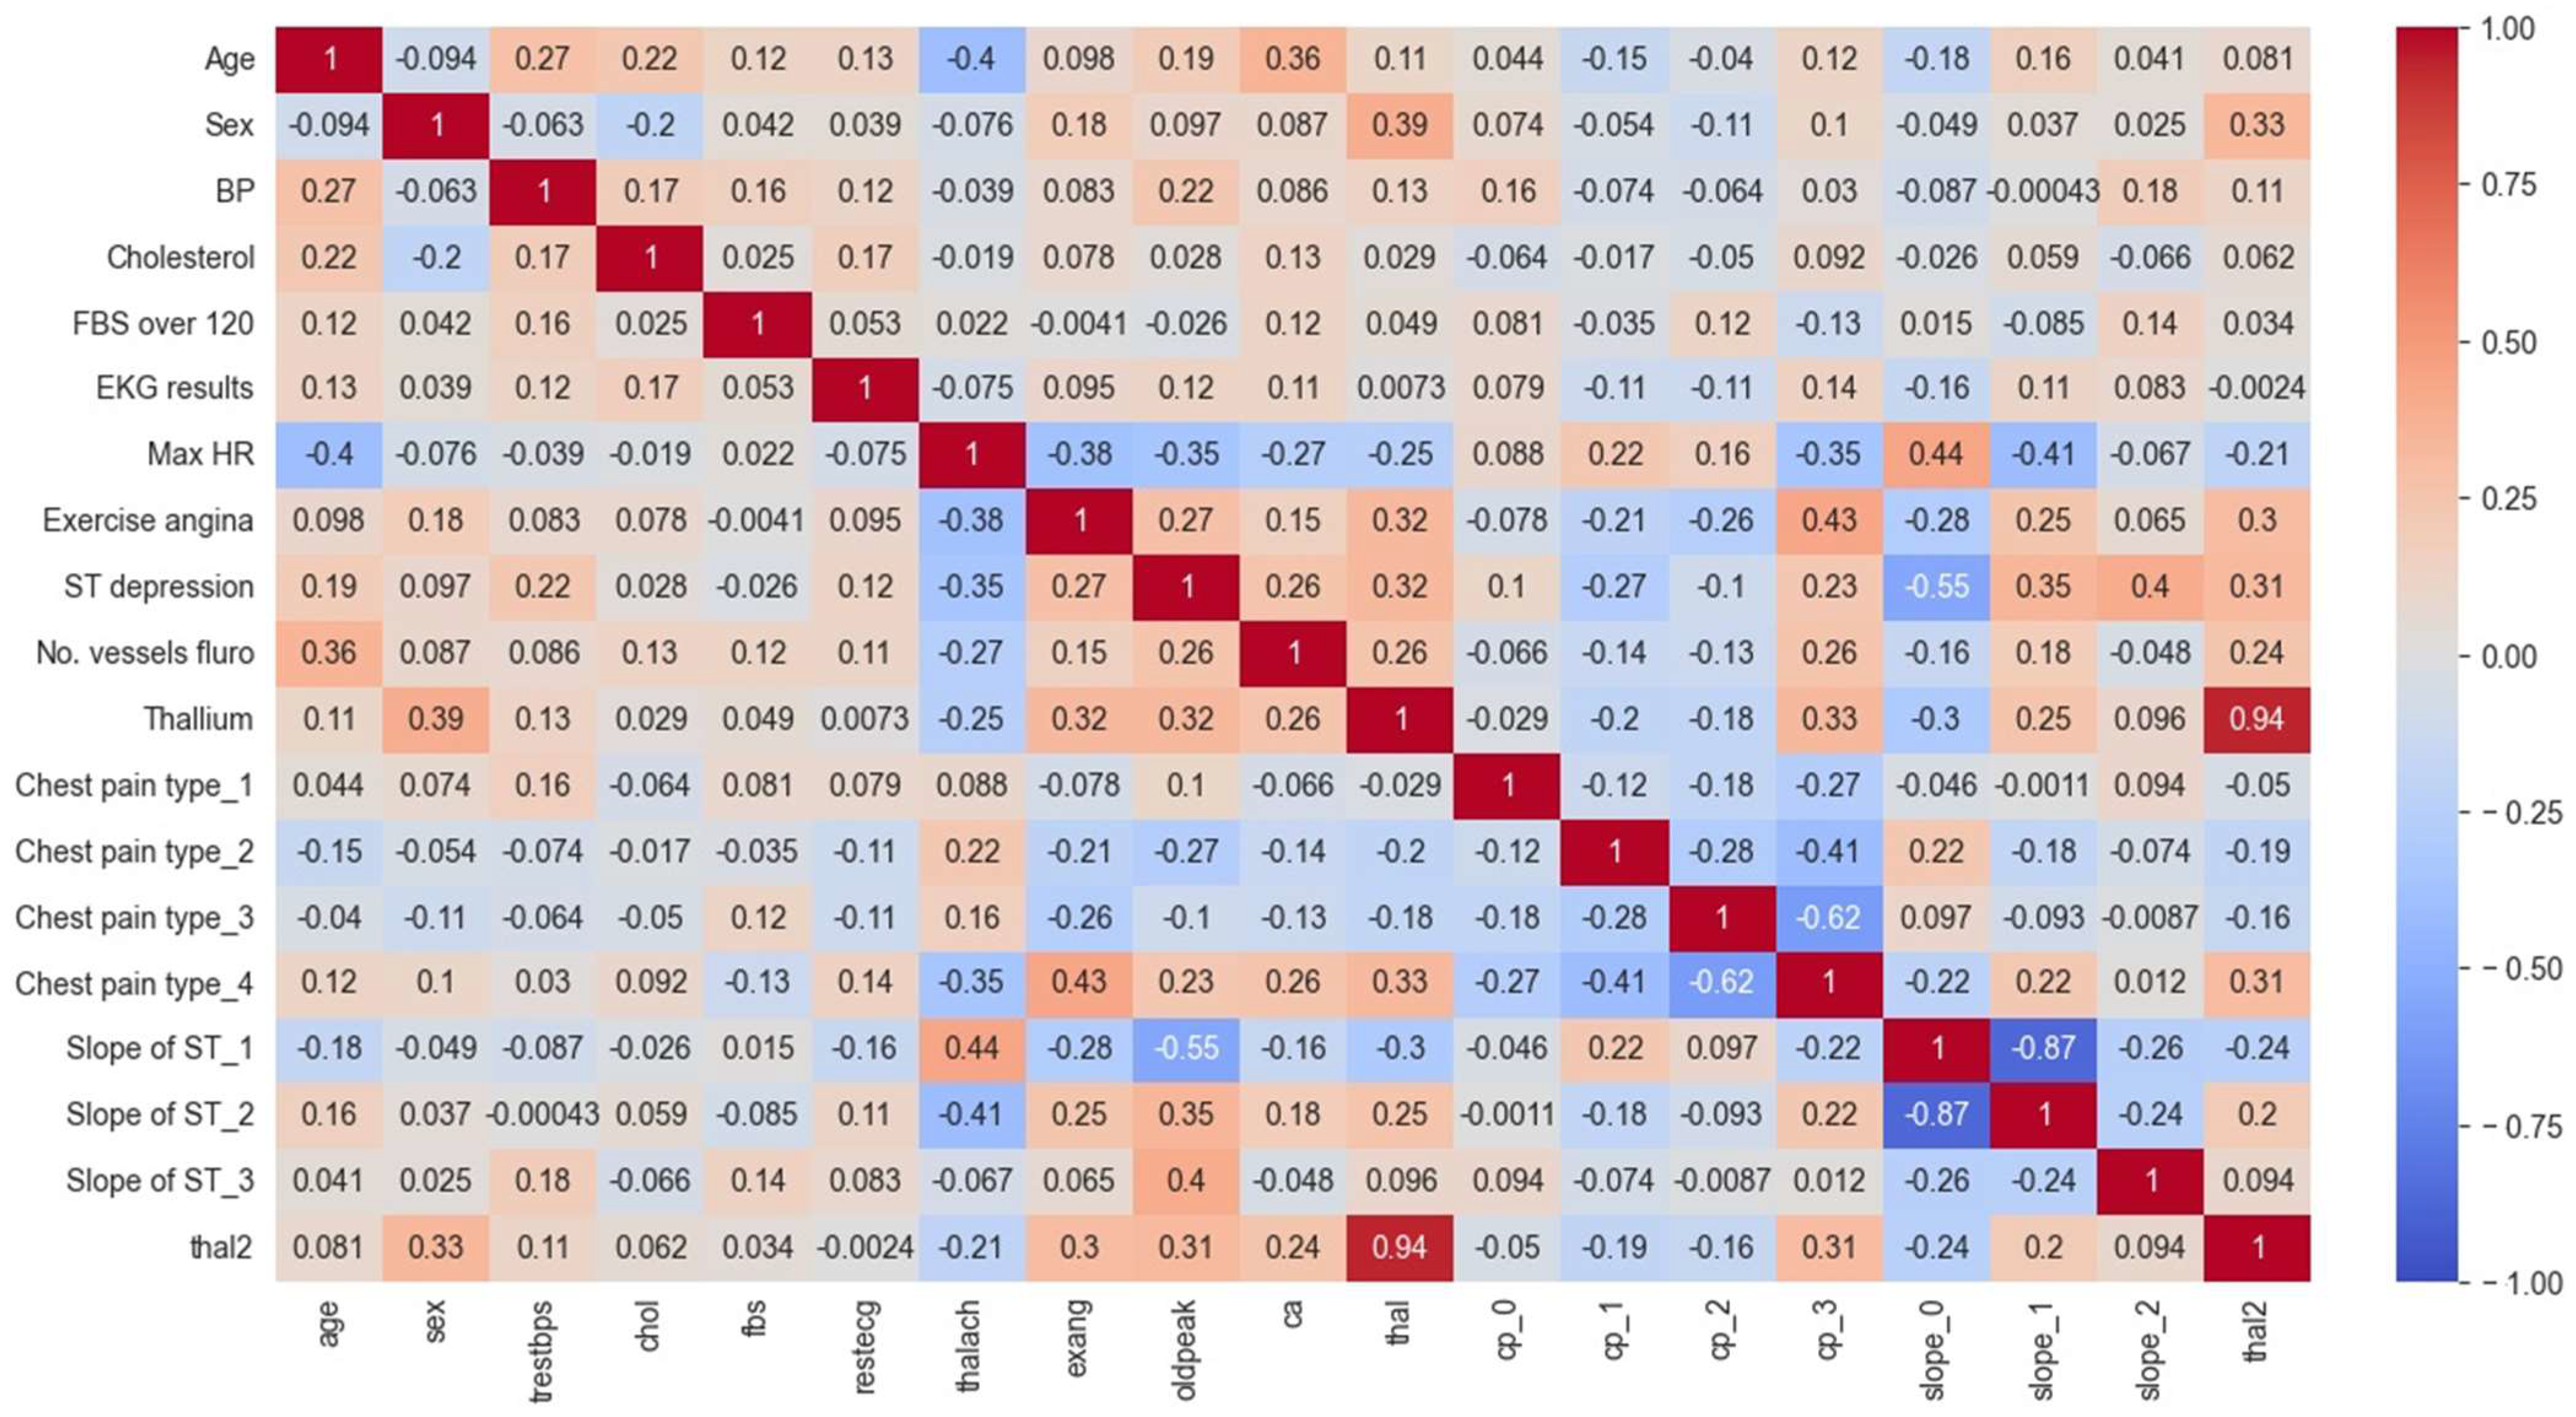
5.2.2. Analysis of the Correlation Heat Map (CHM)
- The first section of the matrix compares age, sex, and blood pressure. The correlation between age and blood pressure is weakly positive (0.28), while the correlation between sex and blood pressure is weakly negative (−0.098);
- The second section compares cholesterol and blood sugar. Cholesterol and blood sugar have a weakly negative correlation (−0.057);
- The third section compares restecg, thalach, exang, and oldpeak. The resting electrocardiogram results (restecg) and exercise-induced angina (exang) have a weakly positive correlation (0.14), while the maximum heart rate achieved during exercise (thalach) has a weakly negative correlation (−0.044) with ST depression induced by exercise relative to rest (oldpeak);
- The fourth section compares the number of major vessels colored by fluoroscopy (ca) with the other variables. There is a weakly positive correlation between ca and age (0.12), and a weakly positive correlation between ca and cholesterol (0.097);
- The fifth section compares the different types of chest pain (cp) and their correlations with the other variables. Chest pain type 0 (cp_0) has a weakly positive correlation with ca (0.14), while chest pain type 1 (cp_1) has a weakly negative correlation with thal2 (−0.15). Chest pain type 2 (cp_2) has a weakly positive correlation with fbs (0.084), and chest pain type 3 (cp_3) has a weakly positive correlation with age (0.048);
- The final section of the matrix compares the slope of the peak exercise ST segment (slope) and the two types of thalassemia (thal and thal2). There is a weakly positive correlation between slope and thal2 (0.18), and a weakly negative correlation between slope and thal (−0.42).
- The values in the matrix represent the correlations between each pair of variables. A positive value indicates a positive correlation (as one variable increases, so does the other), while a negative value indicates a negative correlation (as one variable increases, the other decreases);
- For example, we can see that age is highly negatively correlated with itself (correlation coefficient of −1.00), since it is impossible for someone’s age to be negatively correlated with their own age. Sex is negatively correlated with BP and positively correlated with cholesterol levels. We can also see that the ST depression is positively correlated with exercise-induced angina, thallium stress test results, and chest pain types 3 and 4;
- Some notable correlations include a positive correlation between age and BP (r = 0.27), a negative correlation between age and max HR (r = −0.4), and a positive correlation between chest pain type 3 and ST depression (r = 0.35). There also appear to be some negative correlations between certain variables, such as sex and chest pain type 3 (r = −0.26) and slope of ST 3 and thal2 (r = −0.24).
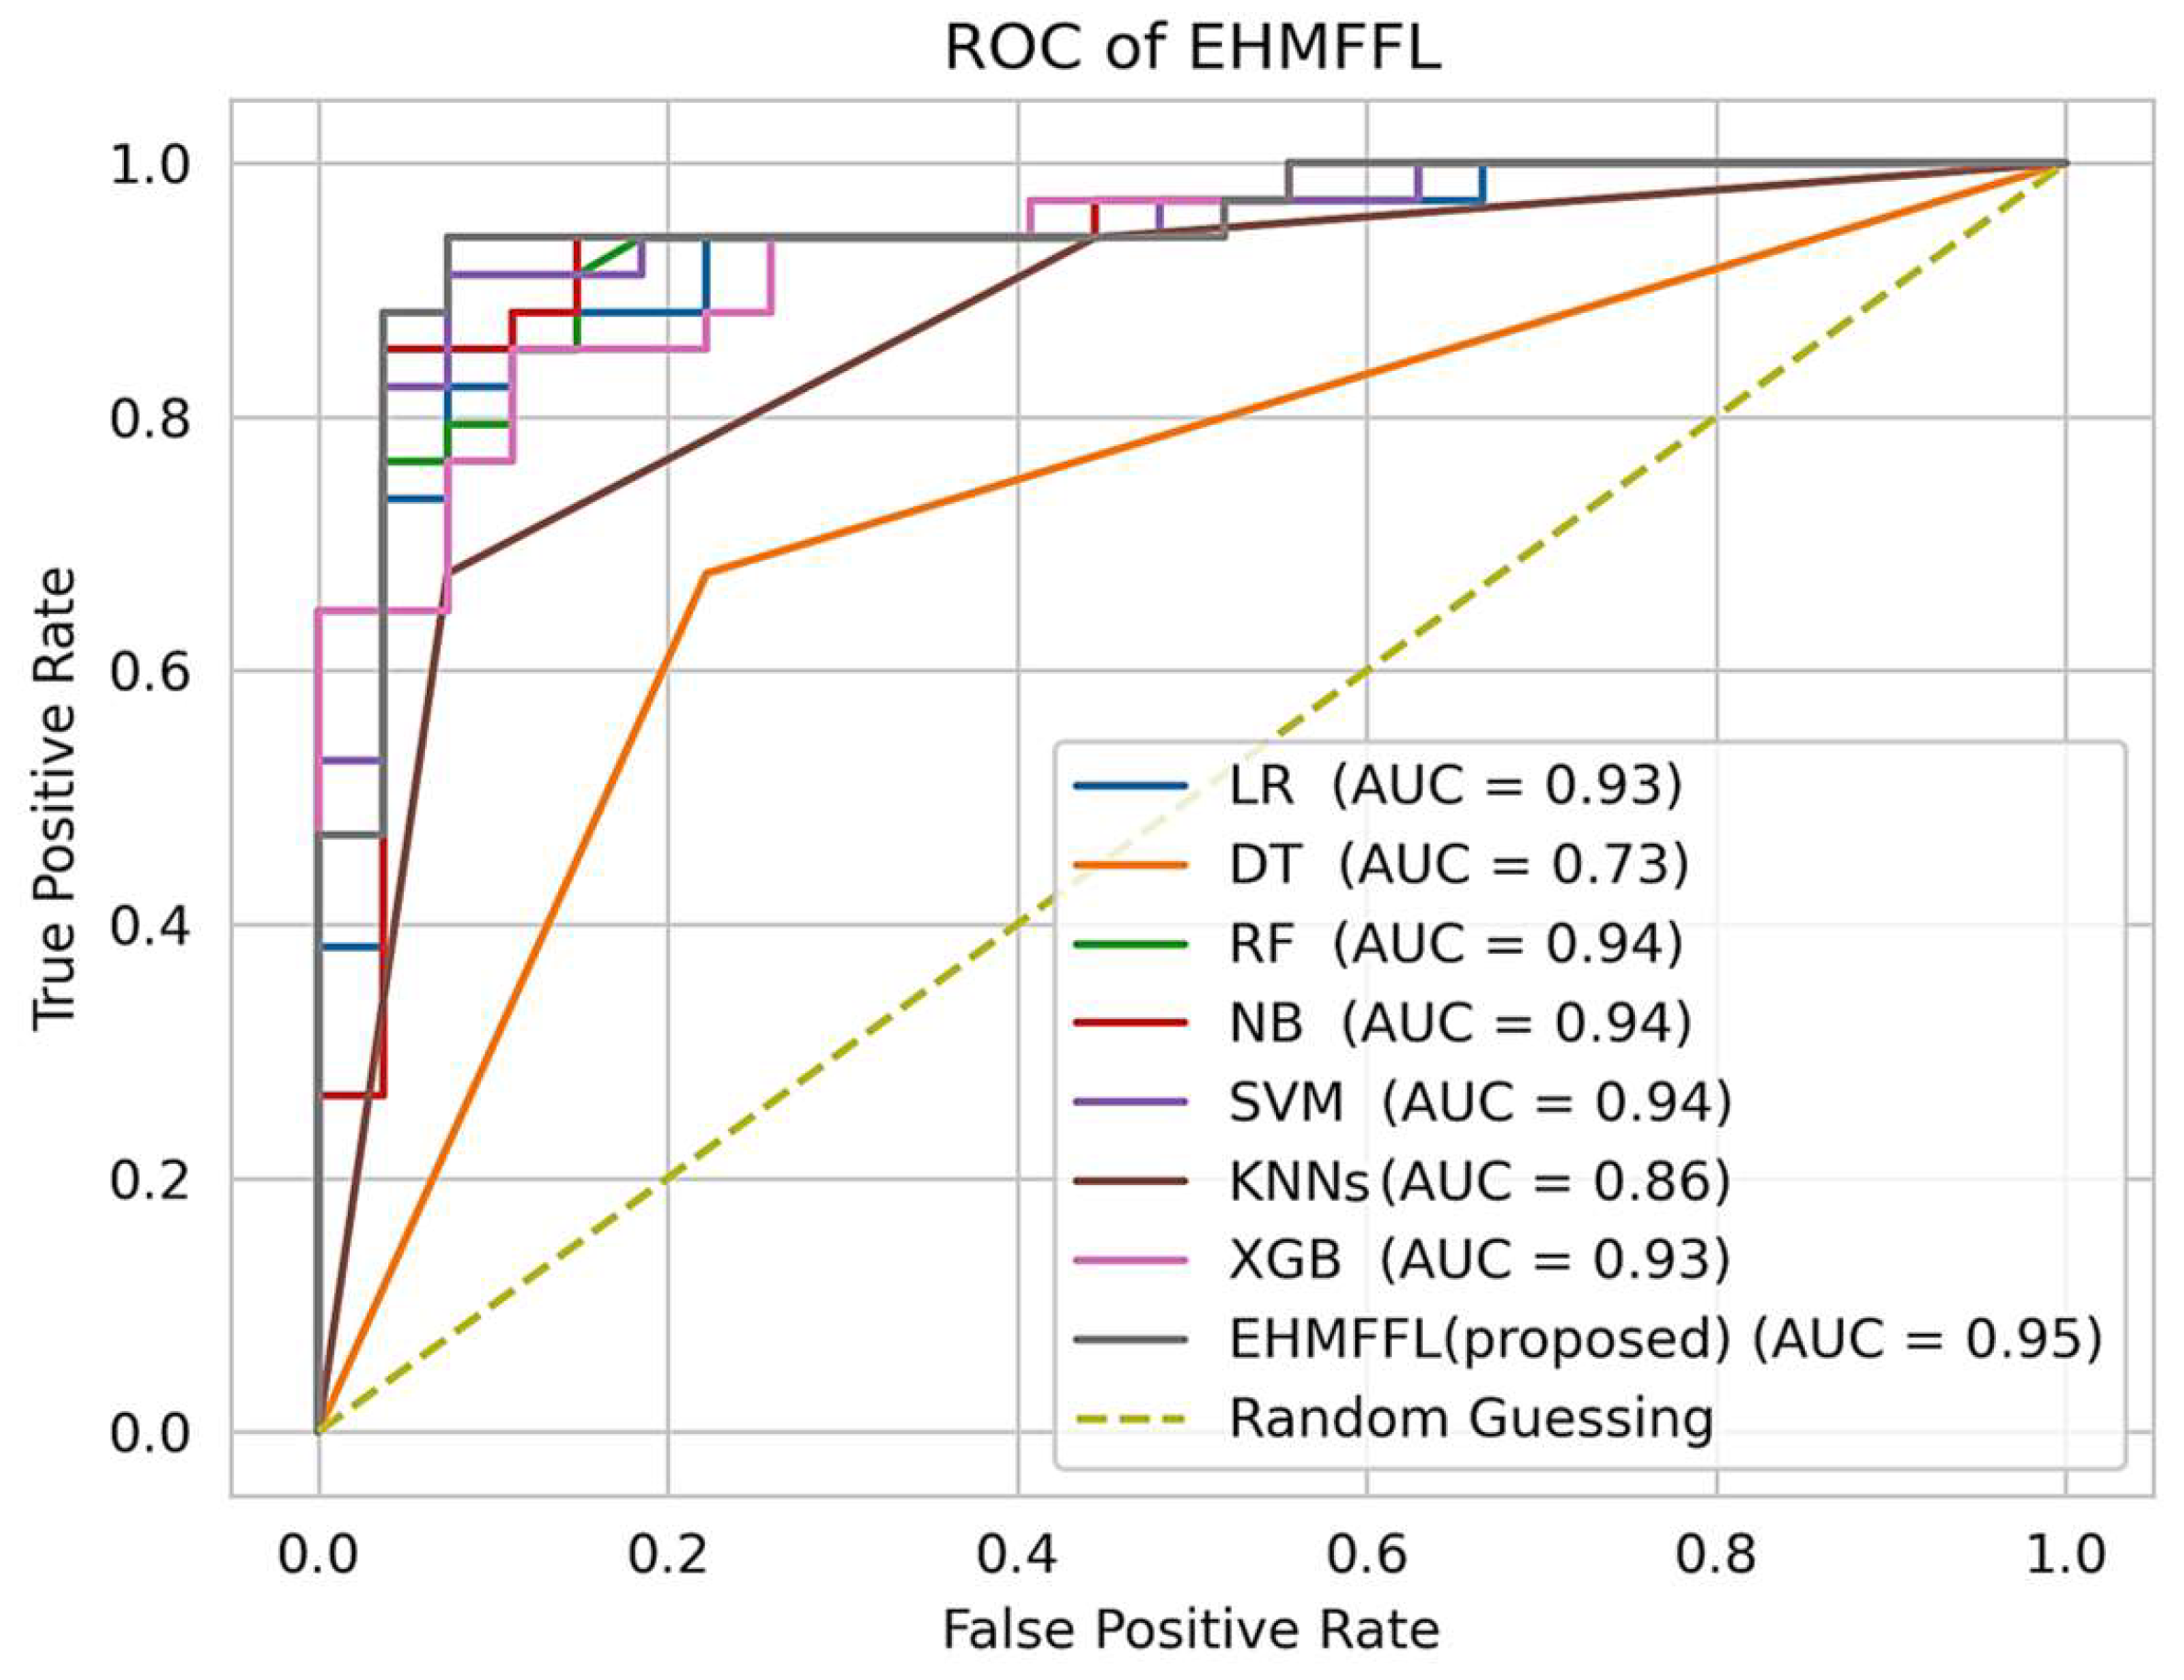
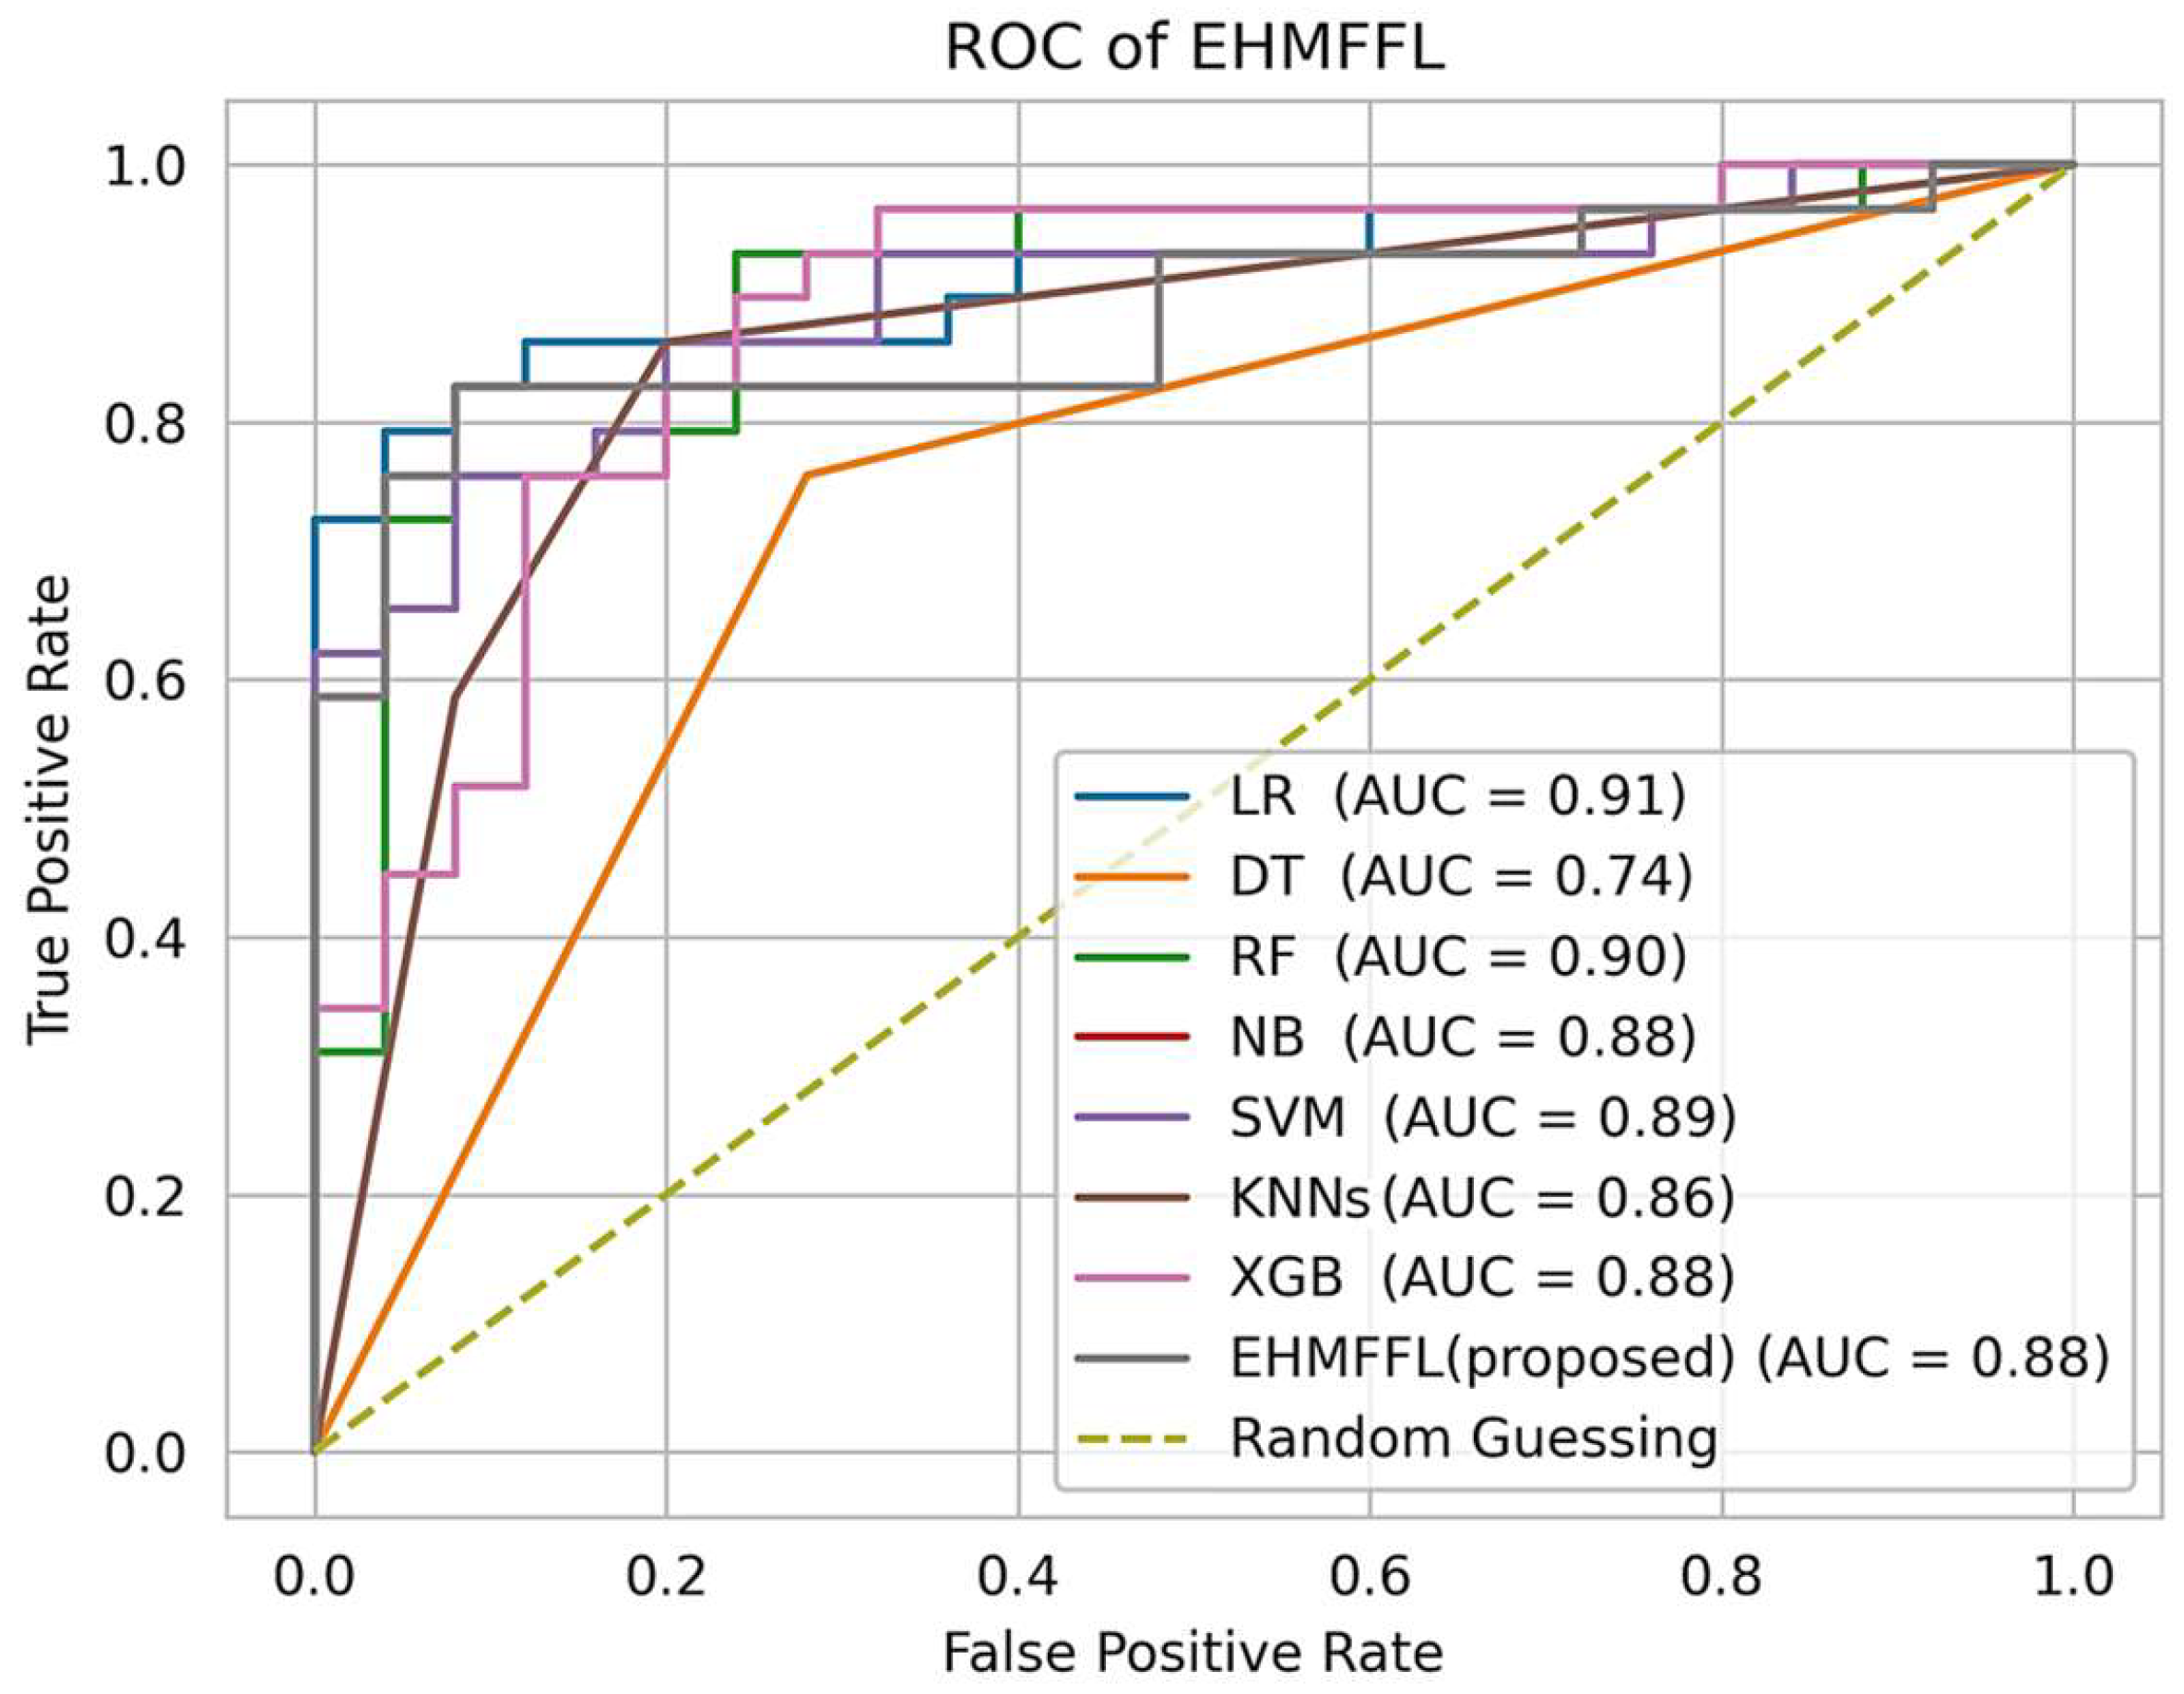
5.2.3. Analysis of the Receiver Operating Characteristic (ROC)
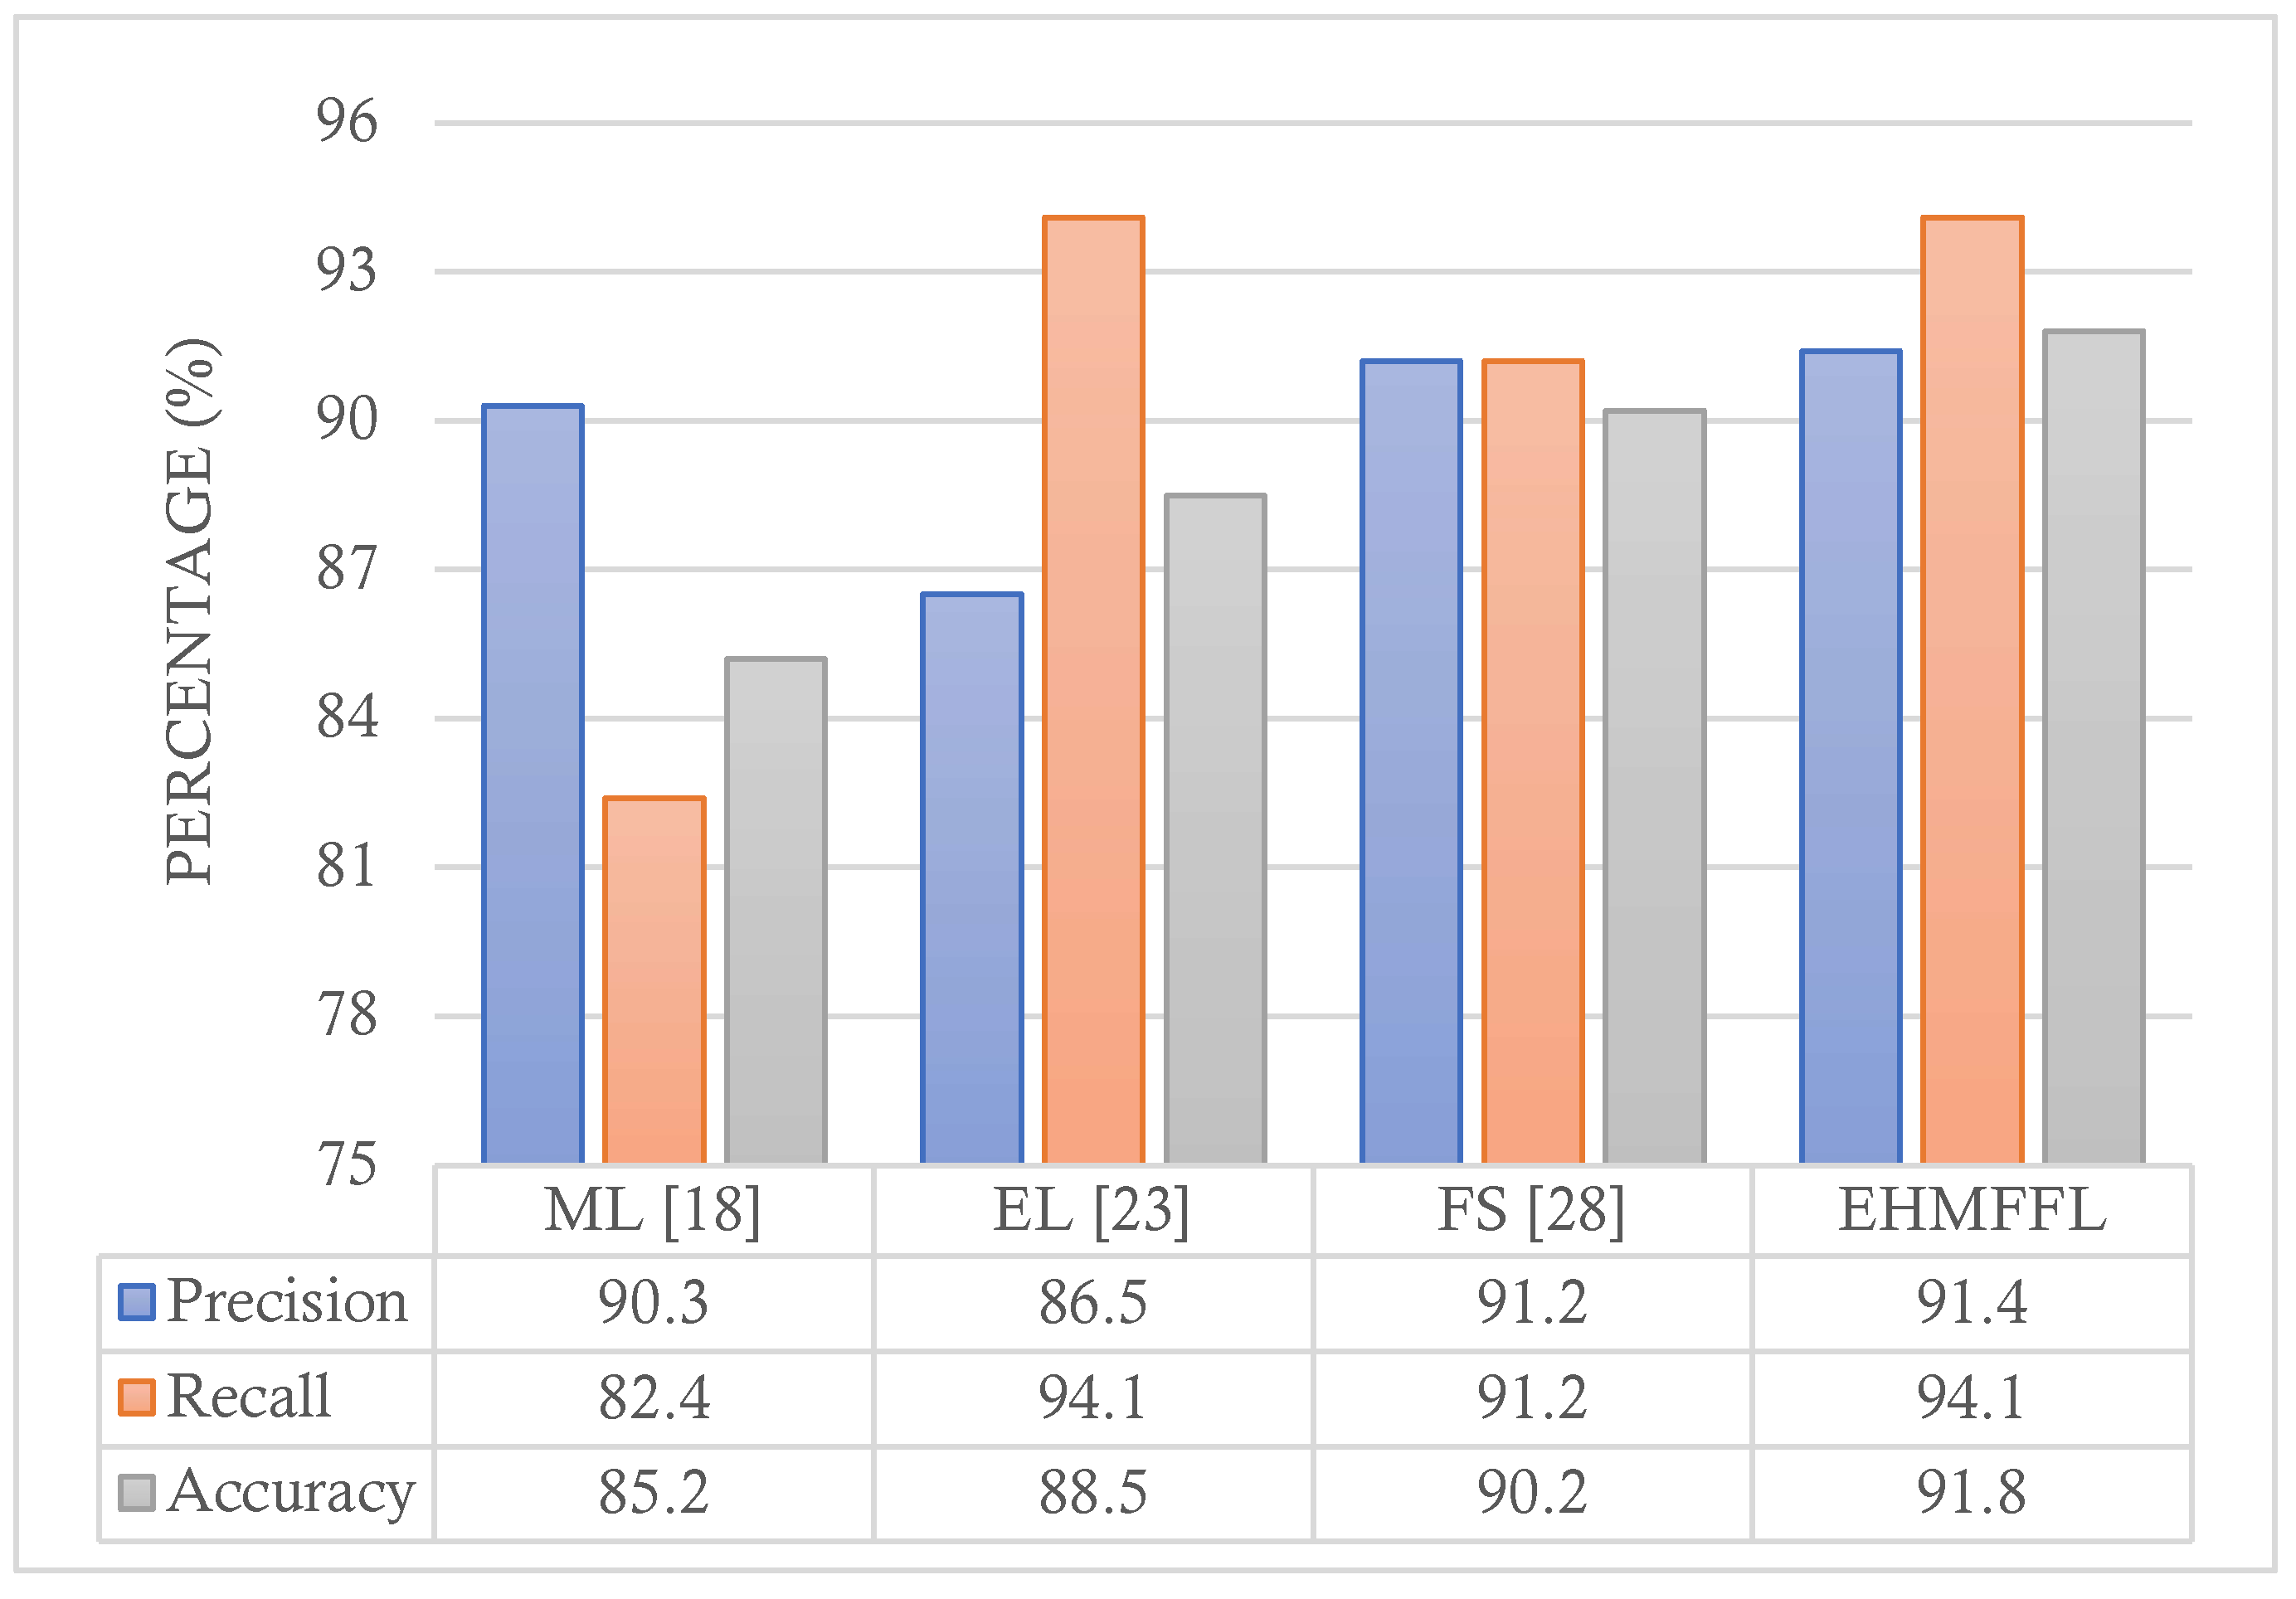
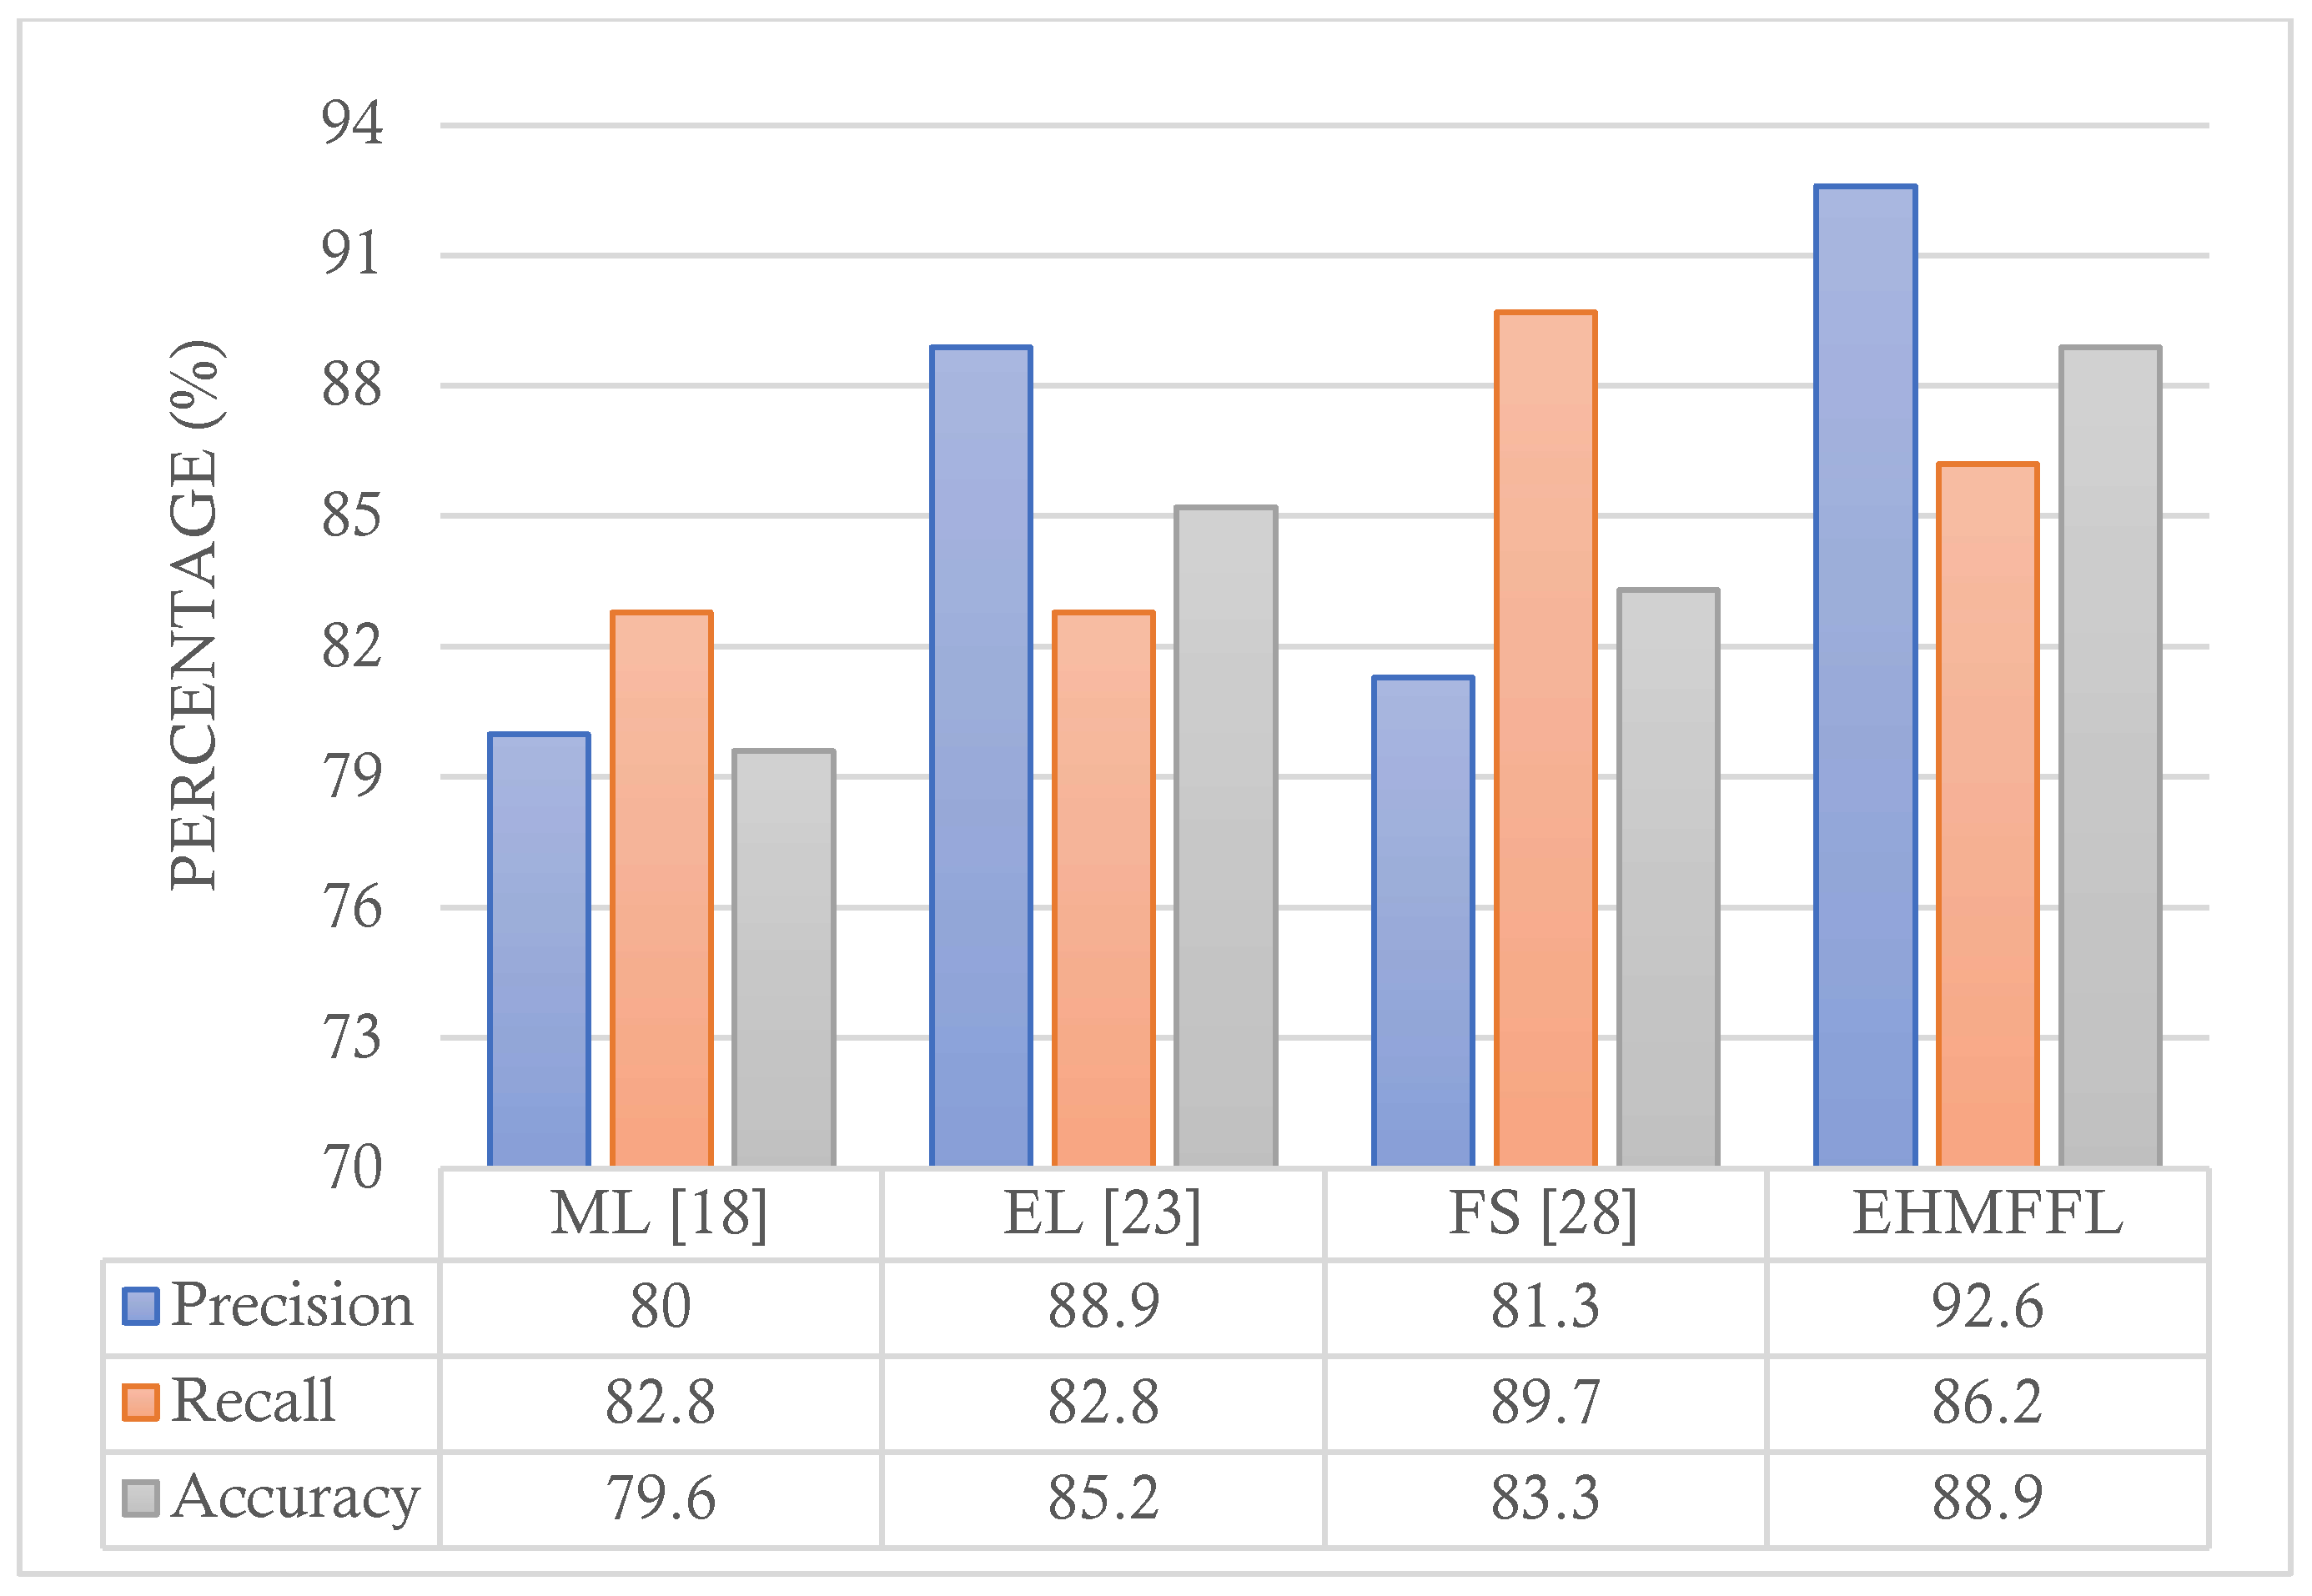
5.3. Comparison with Existing Techniques
6. Conclusions
Author Contributions
Funding
Data Availability Statement
Conflicts of Interest
References
- Das, S.; Sharma, R.; Gourisaria, M.K.; Rautaray, S.S.; Pandey, M. Heart disease detection using core machine learning and deep learning techniques: A comparative study. Int. J. Emerg. Technol. 2020, 11, 531–538. [Google Scholar]
- Hasan, T.T.; Jasim, M.H.; Hashim, I.A. FPGA design and hardware implementation of heart disease diagnosis system based on NVG-RAM classifier. In Proceedings of the 2018 3rd Scientific Conference of Electrical Engineering (SCEE), Baghdad, Iraq, 19–20 December 2018; IEEE: Piscataway, NJ, USA, 2018; pp. 33–38. [Google Scholar]
- Rahman, A.U.; Saeed, M.; Mohammed, M.A.; Jaber, M.M.; Garcia-Zapirain, B. A novel fuzzy parameterized fuzzy hypersoft set and riesz summability approach based decision support system for diagnosis of heart diseases. Diagnostics 2022, 12, 1546. [Google Scholar] [CrossRef] [PubMed]
- Javid, I.; Alsaedi AK, Z.; Ghazali, R. Enhanced accuracy of heart disease prediction using machine learning and recurrent neural networks ensemble majority voting method. Int. J. Adv. Comput. Sci. Appl. 2020, 11. [Google Scholar] [CrossRef]
- Muhsen, D.K.; Khairi TW, A.; Alhamza NI, A. Machine learning system using modified random forest algorithm. In Proceedings of the Intelligent Systems and Networks (ICISN 2021), Hanoi, Vietnam, 19 March 2021; Springer: Singapore; pp. 508–515. [Google Scholar]
- Mastoi QU, A.; Wah, T.Y.; Mohammed, M.A.; Iqbal, U.; Kadry, S.; Majumdar, A.; Thinnukool, O. Novel DERMA fusion technique for ECG heartbeat classification. Life 2022, 12, 842. [Google Scholar] [CrossRef] [PubMed]
- Nahar, J.; Imam, T.; Tickle, K.S.; Chen YP, P. Computational intelligence for heart disease diagnosis: A medical knowledge driven approach. Expert Syst. Appl. 2013, 40, 96–104. [Google Scholar] [CrossRef]
- Lee, H.G.; Noh, K.Y.; Ryu, K.H. Mining biosignal data: Coronary artery disease diagnosis using linear and nonlinear features of HRV. In Proceedings of the Emerging Technologies in Knowledge Discovery and Data Mining: PAKDD 2007 International Workshops, Nanjing, China, 22–25 May 2007; Revised Selected Papers 11. Springer: Berlin/Heidelberg, Germany, 2007; pp. 218–228. [Google Scholar]
- Sudhakar, K.; Manimekalai, D.M. Study of heart disease prediction using data mining. Int. J. Adv. Res. Comput. Sci. Softw. Eng. 2014, 4, 1157–1160. [Google Scholar]
- Khazaee, A. Heart beat classification using particle swarm optimization. Int. J. Intell. Syst. Appl. 2013, 5, 25. [Google Scholar] [CrossRef]
- Xing, Y.; Wang, J.; Zhao, Z. Combination data mining methods with new medical data to predicting outcome of coronary heart disease. In Proceedings of the 2007 International Conference on Convergence Information Technology (ICCIT 2007), Gwangju, Republic of Korea, 21–23 November 2007; IEEE: Piscataway, NJ, USA, 2007; pp. 868–872. [Google Scholar]
- Breiman, L. Bagging predictors. Mach. Learn. 1996, 24, 123–140. [Google Scholar] [CrossRef]
- Schapire, R.E.; Singer, Y. Improved boosting algorithms using confidence-rated predictions. In Proceedings of the 11th Annual Conference on Computational Learning Theory, Madison, WI, USA, 24–26 July 1998; pp. 80–91. [Google Scholar]
- Miao, K.H.; Miao, J.H. Coronary heart disease diagnosis using deep neural networks. Int. J. Adv. Comput. Sci. Appl. 2018, 9, 1–8. [Google Scholar] [CrossRef]
- Vijayashree, J.; Sultana, H.P. A machine learning framework for feature selection in heart disease classification using improved particle swarm optimization with support vector machine classifier. Program. Comput. Softw. 2018, 44, 388–397. [Google Scholar] [CrossRef]
- Waigi, D.; Choudhary, D.S.; Fulzele, D.P.; Mishra, D. Predicting the risk of heart disease using advanced machine learning approach. Eur. J. Mol. Clin. Med 2020, 7, 1638–1645. [Google Scholar]
- Tuli, S.; Basumatary, N.; Gill, S.S.; Kahani, M.; Arya, R.C.; Wander, G.S.; Buyya, R. HealthFog: An ensemble deep learning based Smart Healthcare System for Automatic Diagnosis of Heart Diseases in integrated IoT and fog computing environments. Future Gener. Comput. Syst. 2020, 104, 187–200. [Google Scholar] [CrossRef]
- Jindal, H.; Agrawal, S.; Khera, R.; Jain, R.; Nagrath, P. Heart disease prediction using machine learning algorithms. IOP Conf. Ser. Mater. Sci. Eng. 2021, 1022, 012072. [Google Scholar] [CrossRef]
- Sarra, R.R.; Dinar, A.M.; Mohammed, M.A.; Abdulkareem, K.H. Enhanced heart disease prediction based on machine learning and χ2 statistical optimal feature selection model. Designs 2022, 6, 87. [Google Scholar] [CrossRef]
- Aliyar Vellameeran, F.; Brindha, T. A new variant of deep belief network assisted with optimal feature selection for heart disease diagnosis using IoT wearable medical devices. Comput. Methods Biomech. Biomed. Eng. 2022, 25, 387–411. [Google Scholar] [CrossRef] [PubMed]
- Latha CB, C.; Jeeva, S.C. Improving the accuracy of prediction of heart disease risk based on ensemble classification techniques. Inform. Med. Unlocked 2019, 16, 100203. [Google Scholar] [CrossRef]
- Ali, F.; El-Sappagh, S.; Islam, S.R.; Kwak, D.; Ali, A.; Imran, M.; Kwak, K.S. A smart healthcare monitoring system for heart disease prediction based on ensemble deep learning and feature fusion. Inf. Fusion 2020, 63, 208–222. [Google Scholar] [CrossRef]
- Shorewala, V. Early detection of coronary heart disease using ensemble techniques. Inform. Med. Unlocked 2021, 26, 100655. [Google Scholar] [CrossRef]
- Ghasemi Darehnaei, Z.; Shokouhifar, M.; Yazdanjouei, H.; Rastegar Fatemi SM, J. SI-EDTL: Swarm intelligence ensemble deep transfer learning for multiple vehicle detection in UAV images. Concurr. Comput. Pract. Exp. 2022, 34, e6726. [Google Scholar] [CrossRef]
- Shokouhifar, A.; Shokouhifar, M.; Sabbaghian, M.; Soltanian-Zadeh, H. Swarm intelligence empowered three-stage ensemble deep learning for arm volume measurement in patients with lymphedema. Biomed. Signal Process. Control. 2023, 85, 105027. [Google Scholar] [CrossRef]
- Nagarajan, S.M.; Muthukumaran, V.; Murugesan, R.; Joseph, R.B.; Meram, M.; Prathik, A. Innovative feature selection and classification model for heart disease prediction. J. Reliab. Intell. Environ. 2022, 8, 333–343. [Google Scholar] [CrossRef]
- Al-Yarimi FA, M.; Munassar NM, A.; Bamashmos MH, M.; Ali MY, S. Feature optimization by discrete weights for heart disease prediction using supervised learning. Soft Comput. 2021, 25, 1821–1831. [Google Scholar] [CrossRef]
- Ahmad, G.N.; Ullah, S.; Algethami, A.; Fatima, H.; Akhter SM, H. Comparative study of optimum medical diagnosis of human heart disease using machine learning technique with and without sequential feature selection. IEEE Access 2022, 10, 23808–23828. [Google Scholar] [CrossRef]
- Pathan, M.S.; Nag, A.; Pathan, M.M.; Dev, S. Analyzing the impact of feature selection on the accuracy of heart disease prediction. Healthc. Anal. 2022, 2, 100060. [Google Scholar] [CrossRef]
- Zhang, D.; Chen, Y.; Chen, Y.; Ye, S.; Cai, W.; Jiang, J.; Xu, Y.; Zheng, G.; Chen, M. Heart disease prediction based on the embedded feature selection method and deep neural network. J. Healthc. Eng. 2021, 2021, 6260022. [Google Scholar] [CrossRef] [PubMed]
- Heart Disease. UCI Machine Learning Repository. Available online: https://doi.org/10.24432/C52P4X (accessed on 1 August 1989).
- Statlog (Heart). UCI Machine Learning Repository. Available online: https://doi.org/10.24432/C57303 (accessed on 13 February 1993).
- Jensen, R. Combining Rough and Fuzzy Sets for Feature Selection. Ph.D. Thesis, University of Edinburgh, Edinburgh, UK, 2005. [Google Scholar]
- Seyyedabbasi, A. Binary Sand Cat Swarm Optimization Algorithm for Wrapper Feature Selection on Biological Data. Biomimetics 2023, 8, 310. [Google Scholar] [CrossRef] [PubMed]
- Shokouhifar, M.; Sohrabi, M.; Rabbani, M.; Molana SM, H.; Werner, F. Sustainable Phosphorus Fertilizer Supply Chain Management to Improve Crop Yield and P Use Efficiency Using an Ensemble Heuristic–Metaheuristic Optimization Algorithm. Agronomy 2023, 13, 565. [Google Scholar] [CrossRef]
- Sohrabi, M.; Zandieh, M.; Shokouhifar, M. Sustainable inventory management in blood banks considering health equity using a combined metaheuristic-based robust fuzzy stochastic programming. Socio-Econ. Plan. Sci. 2023, 86, 101462. [Google Scholar] [CrossRef]
- Xie, W.; Li, W.; Zhang, S.; Wang, L.; Yang, J.; Zhao, D. A novel biomarker selection method combining graph neural network and gene relationships applied to microarray data. BMC Bioinform. 2022, 23, 303. [Google Scholar] [CrossRef]
- Pearson, K. Contributions to the mathematical theory of evolution. Philos. Trans. R. Soc. Lond. A 1894, 185, 71–110. [Google Scholar]
- Mirjalili, S.; Mirjalili, S.M.; Lewis, A. Grey wolf optimizer. Adv. Eng. Softw. 2014, 69, 46–61. [Google Scholar] [CrossRef]
- Grover, P.; Chaturvedi, K.; Zi, X.; Saxena, A.; Prakash, S.; Jan, T.; Prasad, M. Ensemble Transfer Learning for Distinguishing Cognitively Normal and Mild Cognitive Impairment Patients Using MRI. Algorithms 2023, 16, 377. [Google Scholar] [CrossRef]


| Feature | Description | Type | Values |
|---|---|---|---|
| Age | Age of the patients | Numeric | Years |
| Sex | Gender of the patients | Categorial | M, F |
| Ca | Number of major vessels | Categorial | 0–4 |
| Chol | Serum cholesterol | Numeric | mg/dL |
| Exang | Exercise induced angina | Categorial | Yes = 1, No = 0 |
| Cp | Chest pain type | Categorial | Male = 1, Female = 0 |
| Oldpeak | ST depression induced by exercise relative to rest | Numeric | 0–6.2 |
| Fbs | Fasting blood sugar | Categorial | mg/dL |
| Restecg | Resting electrocardiographic | Categorial | 0, 1, 2 |
| Thal | Normal; Fixed defect; Reversible defect | Categorial | 0, 1, 2, 3 |
| Thalach | Maximum heart rate achieved | Numeric | 71–202 |
| Slope | Slope of the peak exercise ST segment | Categorial | 0, 1, 2 |
| Trestbps | Resting blood pressure | Numeric | 94–200 |
| Num | Heart disease status | Categorial | Yes/No |
| Parameter | Value |
|---|---|
| Number of grey wolves (PopSize) | 30 |
| Number of iterations (MaxIter) | 100 |
| Search domain | {0, 1} |
| Solution dimension | No. Features |
| Algorithms | Accuracy | Precision | Recall | Specificity | F1 Score |
|---|---|---|---|---|---|
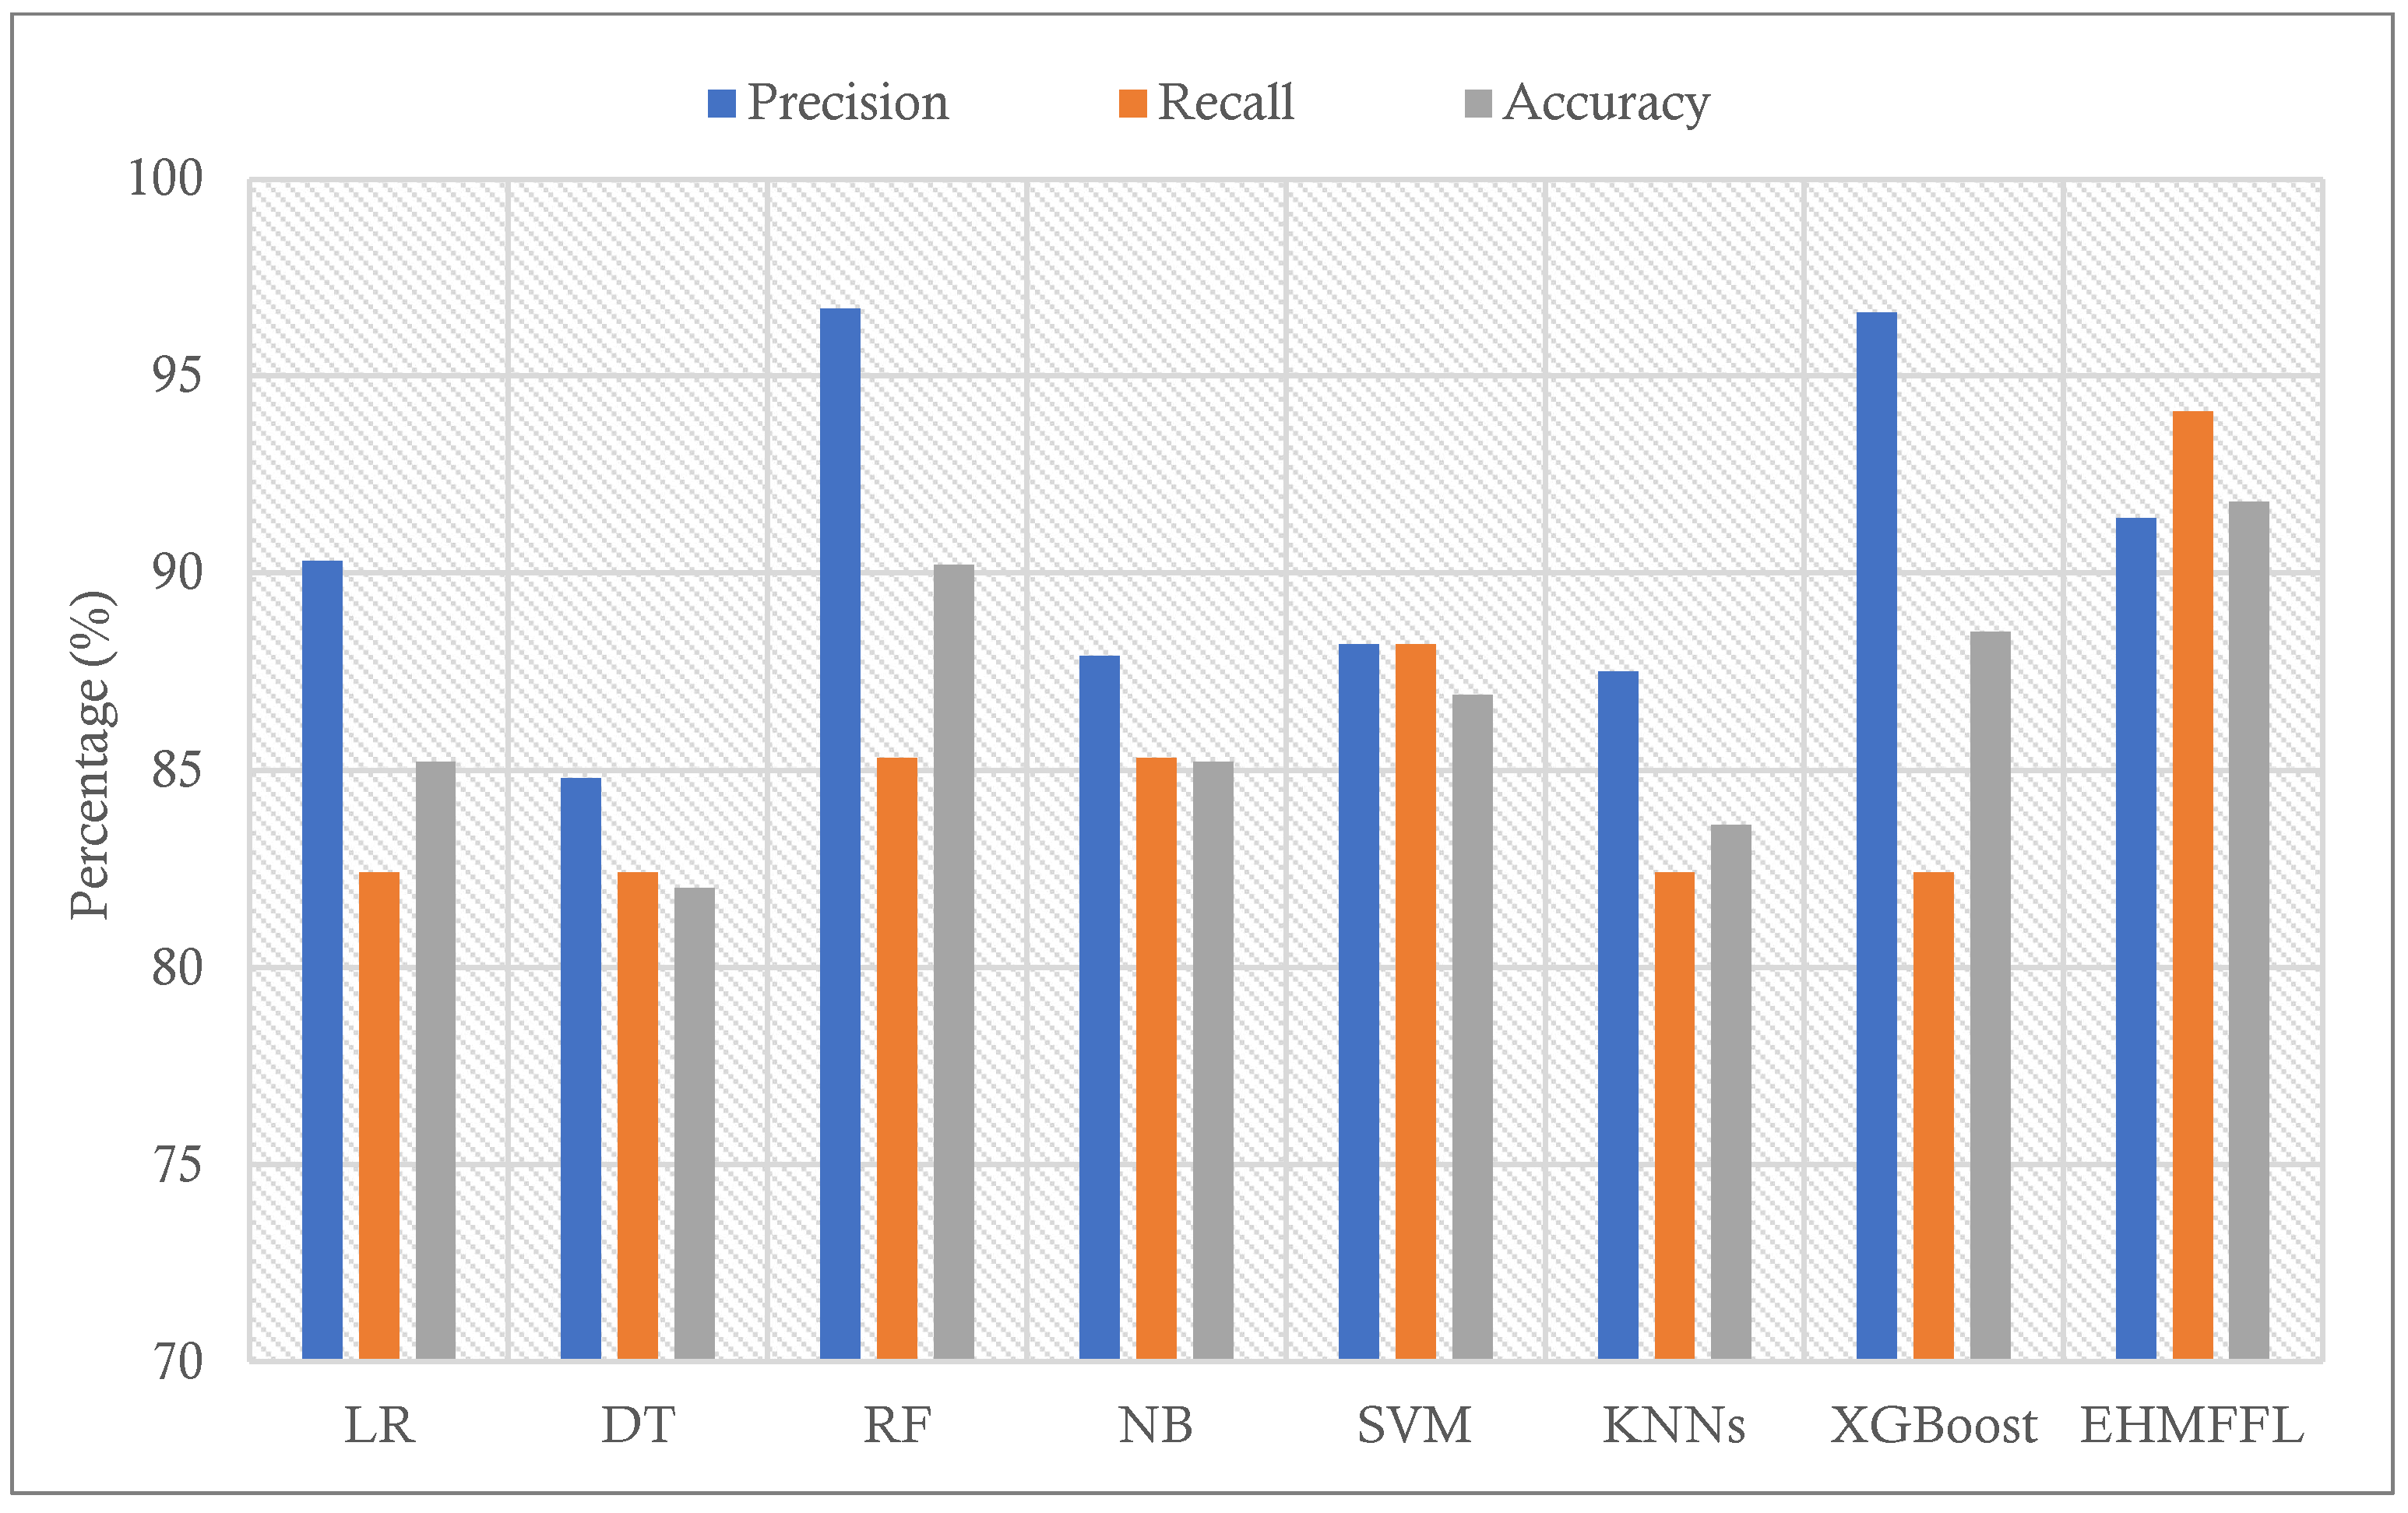
| LR | 85.2 | 90.3 | 82.4 | 88.9 | 86.2 |
| DT | 82 | 84.8 | 82.4 | 81.5 | 83.6 |
| RF | 90.2 | 96.7 | 85.3 | 96.3 | 90.6 |
| NB | 85.2 | 87.9 | 85.3 | 85.2 | 86.6 |
| SVM | 86.9 | 88.2 | 88.2 | 85.2 | 88.2 |
| KNNs | 83.6 | 87.5 | 82.4 | 85.2 | 84.8 |
| XGBoost | 88.5 | 96.6 | 82.4 | 96.3 | 88.9 |
| EHMFFL (Proposed) | 91.8 | 91.4 | 94.1 | 88.9 | 92.8 |
| Algorithms | Accuracy | Precision | Recall | Specificity | F1 Score |
|---|---|---|---|---|---|
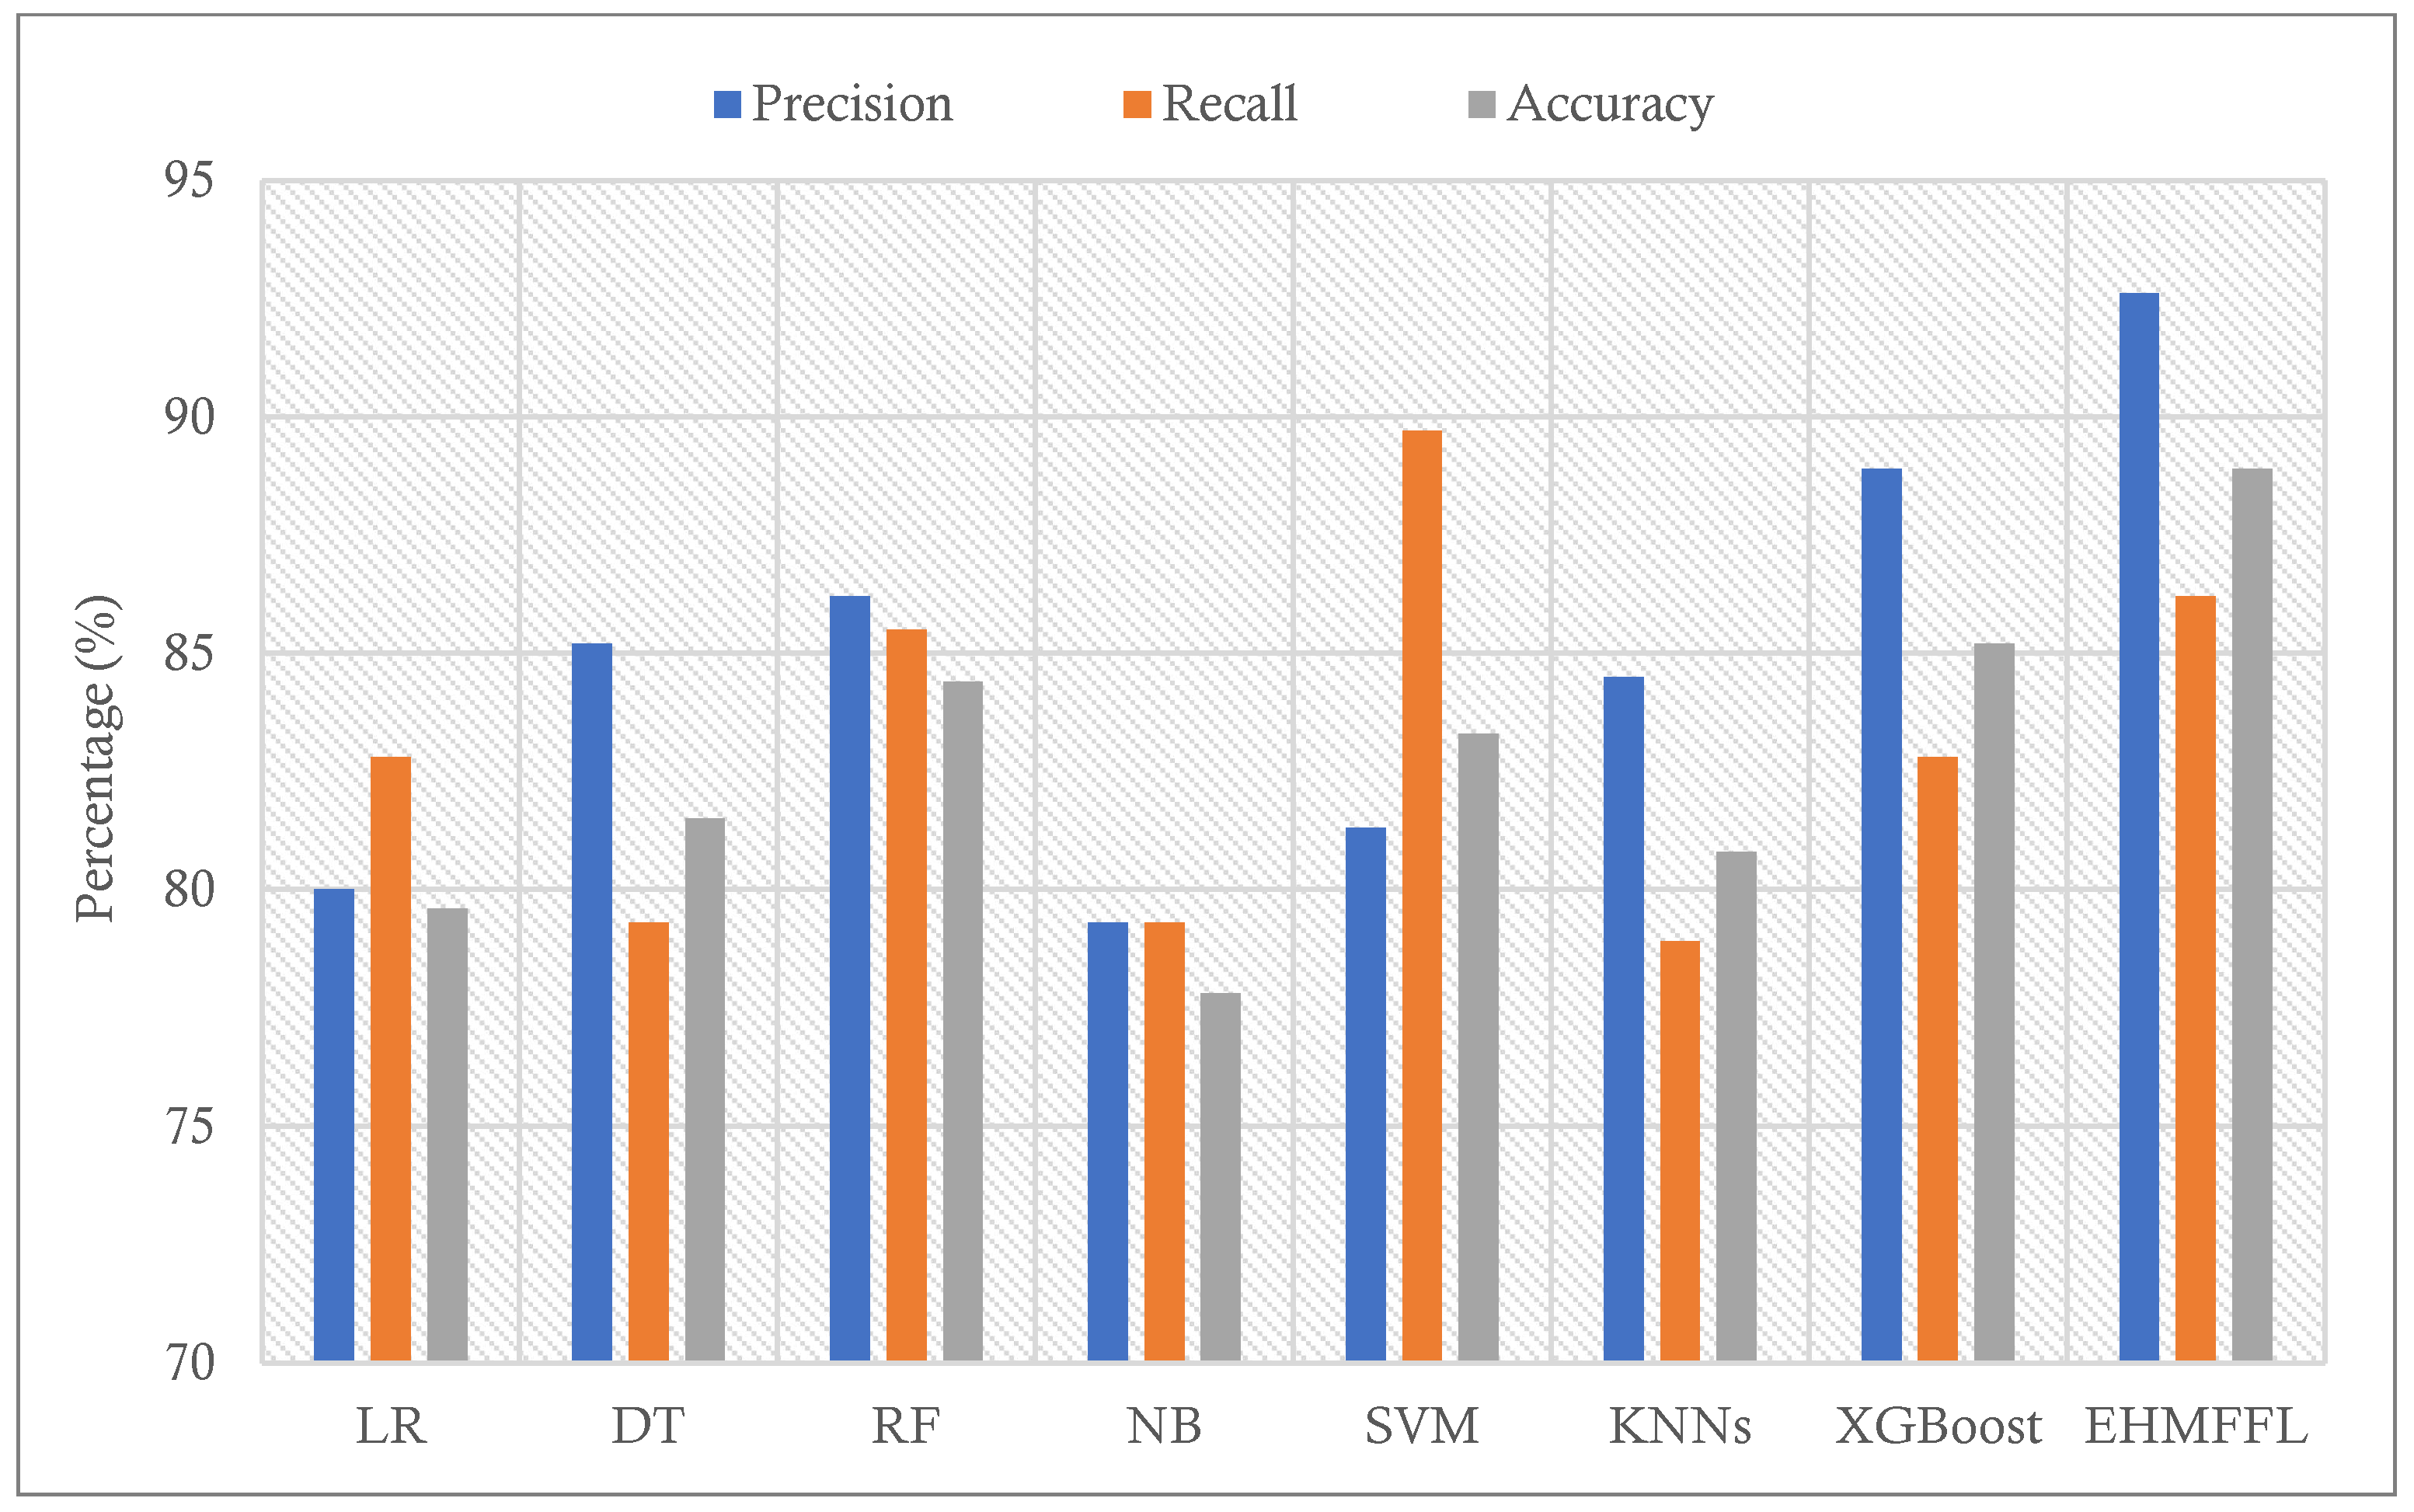
| LR | 79.6 | 80 | 82.8 | 76 | 81.4 |
| DT | 81.5 | 85.2 | 79.3 | 84 | 82.1 |
| RF | 84.4 | 86.2 | 85.5 | 76 | 87.4 |
| NB | 77.8 | 79.3 | 79.3 | 76 | 79.3 |
| SVM | 83.3 | 81.3 | 89.7 | 76 | 85.2 |
| KNNs | 80.8 | 84.5 | 78.9 | 83 | 81.6 |
| XGBoost | 85.2 | 88.9 | 82.8 | 88 | 85.7 |
| EHMFFL (Proposed) | 88.9 | 92.6 | 86.2 | 92 | 89.3 |
| Algorithms | Offline Training/Tuning Phase | Online Test Phase | ||
|---|---|---|---|---|
| Cleveland Dataset | Statlog Dataset | Cleveland Dataset | Statlog Dataset | |
| LR | 0.01 | 0.01 | 0.02 | 0.02 |
| DT | 0.13 | 0.12 | 0.03 | 0.03 |
| RF | 0.74 | 0.7 | 0.08 | 0.07 |
| NB | 0.12 | 0.14 | 0.04 | 0.04 |
| SVM | 0.21 | 0.23 | 0.06 | 0.07 |
| KNNs | 0.08 | 0.07 | 0.03 | 0.02 |
| XGBoost | 0.86 | 0.83 | 0.1 | 0.09 |
| Ensemble | 2.3 | 2.2 | 0.17 | 0.16 |
| EHMFFL (Proposed) | 142 | 137 | 0.13 | 0.13 |
Disclaimer/Publisher’s Note: The statements, opinions and data contained in all publications are solely those of the individual author(s) and contributor(s) and not of MDPI and/or the editor(s). MDPI and/or the editor(s) disclaim responsibility for any injury to people or property resulting from any ideas, methods, instructions or products referred to in the content. |
© 2024 by the authors. Licensee MDPI, Basel, Switzerland. This article is an open access article distributed under the terms and conditions of the Creative Commons Attribution (CC BY) license (https://creativecommons.org/licenses/by/4.0/).
Share and Cite
Shokouhifar, M.; Hasanvand, M.; Moharamkhani, E.; Werner, F. Ensemble Heuristic–Metaheuristic Feature Fusion Learning for Heart Disease Diagnosis Using Tabular Data. Algorithms 2024, 17, 34. https://doi.org/10.3390/a17010034
Shokouhifar M, Hasanvand M, Moharamkhani E, Werner F. Ensemble Heuristic–Metaheuristic Feature Fusion Learning for Heart Disease Diagnosis Using Tabular Data. Algorithms. 2024; 17(1):34. https://doi.org/10.3390/a17010034
Chicago/Turabian StyleShokouhifar, Mohammad, Mohamad Hasanvand, Elaheh Moharamkhani, and Frank Werner. 2024. "Ensemble Heuristic–Metaheuristic Feature Fusion Learning for Heart Disease Diagnosis Using Tabular Data" Algorithms 17, no. 1: 34. https://doi.org/10.3390/a17010034
APA StyleShokouhifar, M., Hasanvand, M., Moharamkhani, E., & Werner, F. (2024). Ensemble Heuristic–Metaheuristic Feature Fusion Learning for Heart Disease Diagnosis Using Tabular Data. Algorithms, 17(1), 34. https://doi.org/10.3390/a17010034