Article

A New Approach to Identifying Sorghum Hybrids Using UAV Imagery Using Multispectral Signature and Machine Learning

by
Dthenifer Cordeiro Santana
1,
Gustavo de Faria Theodoro
1,
Ricardo Gava
1,
João Lucas Gouveia de Oliveira
1,
Larissa Pereira Ribeiro Teodoro
1,
Izabela Cristina de Oliveira
2,
Fábio Henrique Rojo Baio
1,
Carlos Antonio da Silva Junior
3,
Job Teixeira de Oliveira
1 and
Paulo Eduardo Teodoro
1,*
1
Department of Agronomy, Campus of Chapadão do Sul, Federal University of Mato Grosso do Sul (UFMS), Chapad ão do Sul 79560-000, MS, Brazil
2
Department of Agronomy, State University of São Paulo (UNESP), Ilha Solteira 15385-000, SP, Brazil
3
Department of Geography, State University of Mato Grosso (UNEMAT), Sinop 78550-000, MT, Brazil
*
Author to whom correspondence should be addressed.
Algorithms 2024, 17(1), 23; https://doi.org/10.3390/a17010023
Submission received: 9 December 2023 / Revised: 23 December 2023 / Accepted: 3 January 2024 / Published: 5 January 2024

Abstract

:
Using multispectral sensors attached to unmanned aerial vehicles (UAVs) can assist in the collection of morphological and physiological information from several crops. This approach, also known as high-throughput phenotyping, combined with data processing by machine learning (ML) algorithms, can provide fast, accurate, and large-scale discrimination of genotypes in the field, which is crucial for improving the efficiency of breeding programs. Despite their importance, studies aimed at accurately classifying sorghum hybrids using spectral variables as input sets in ML models are still scarce in the literature. Against this backdrop, this study aimed: (I) to discriminate sorghum hybrids based on canopy reflectance in different spectral bands (SB) and vegetation indices (VIs); (II) to evaluate the performance of ML algorithms in classifying sorghum hybrids; (III) to evaluate the best dataset input for the algorithms. A field experiment was carried out in the 2022 crop season in a randomized block design with three replications and six sorghum hybrids. At 60 days after crop emergence, a flight was carried out over the experimental area using the Sensefly eBee real time kinematic. The spectral bands (SB) acquired by the sensor were: blue (475 nm, B_475), green (550 nm, G_550), red (660 nm, R_660), Rededge (735 nm, RE_735) e NIR (790 nm, NIR_790). From the SB acquired, vegetation indices (VIs) were calculated. Data were submitted to ML classification analysis, in which three input settings (using only SB, using only VIs, and using SB + VIs) and six algorithms were tested: artificial neural networks (ANN), support vector machine (SVM), J48 decision trees (J48), random forest (RF), REPTree (DT) and logistic regression (LR, conventional technique used as a control). There were differences in the spectral signature of each sorghum hybrid, which made it possible to differentiate them using SBs and VIs. The ANN algorithm performed best for the three accuracy metrics tested, regardless of the input used. In this case, the use of SB is feasible due to the speed and practicality of analyzing the data, as it does not require calculations to perform the VIs. RF showed better accuracy when VIs were used as an input. The use of VIs provided the best performance for all the algorithms, as did the use of SB + VIs which provided good performance for all the algorithms except RF. Using ML algorithms provides accurate identification of the hybrids, in which ANNs using only SB and RF using VIs as inputs stand out (above 55 for CC, above 0.4 for kappa and around 0.6 for F-score). There were differences in the spectral signature of each sorghum hybrid, which makes it possible to differentiate them using wavelengths and vegetation indices. Processing the multispectral data using machine learning techniques made it possible to accurately differentiate the hybrids, with emphasis on artificial neural networks using spectral bands as inputs and random forest using vegetation indices as inputs.

1. Introduction

Genetic improvement has undergone significant advances in plant gene analysis over the years, but phenotypic evaluation techniques still need to be improved in search of faster and more accurate responses [1]. Currently, the methods used for phenotyping plants are costly, time-consuming, and subjective, and most require the plant to be destroyed [2,3]. High-throughput phenotyping (HTP) is a faster and non-destructive approach to the evaluation of plant characteristics, making it an essential tool in agriculture [4].
Using sensors attached to unmanned aerial vehicles (UAVs) enables fast, cost-effective, and high-resolution image processing, contributing to the measuring and monitoring of plant characteristics in several crops [5,6,7]. Furthermore, crop information is collected simultaneously at a large scale over time and space, making it possible to carry out automated data analysis [8].
Among the uses of phenotyping, we can highlight the identification and differentiation of cultivars by using multispectral sensors, which can be used to detect errors in sowing and find out the most differentiating characteristics between cultivars [9], thus contributing to better targeting of breeding programs. Using UAVs for phenotyping crops such as sorghum can make it easier to measure plant height, for example, since some genotypes are too tall, which hinders conventional assessments [10]. Other applications include the determination of crop chlorophyll [11] and, as it is a non-destructive evaluation, it enables the assessment of the presence of green leaves after flowering [12].
The use of HTP generates a large amount of data in which the use of machine learning techniques is a means of processing such data effectively and accurately, which aims to use algorithms to relate the information extracted to the reflectance of the phenotypes obtained [13]. To the best of our knowledge, there is some research that demonstrates that it is possible to distinguish different tree species using UAV-multispectral sensing in conjunction with machine learning models [14]. For genetic materials from the same species, there is little research on soybean cultivation [15]. The biochemical properties of leaves affect the absorption and reflectance of light in various spectral bands [16]. Spectral signatures can reveal biochemical and structural differences between plant populations distributed throughout space. Such physiological differences in populations of the same species can be attributed to the genetic distinction between them [17].
Distinguishing sorghum hybrids according to their canopy reflectance and using machine learning algorithms to classify these hybrids is a novel strategy that has yet to be studied. Our hypothesis is that using UAV imaging and machine learning techniques for data processing enables faster, accurate and large-scale discrimination of sorghum hybrids. Thus, the aim of this work was to: (i) discriminate sorghum hybrids using canopy reflectance at different wavelengths and vegetation indices; (ii) evaluate the performance of machine learning algorithms in classifying sorghum hybrids; and (iii) assess the accuracy of different input variables in machine learning models.

2. Materials and Methods

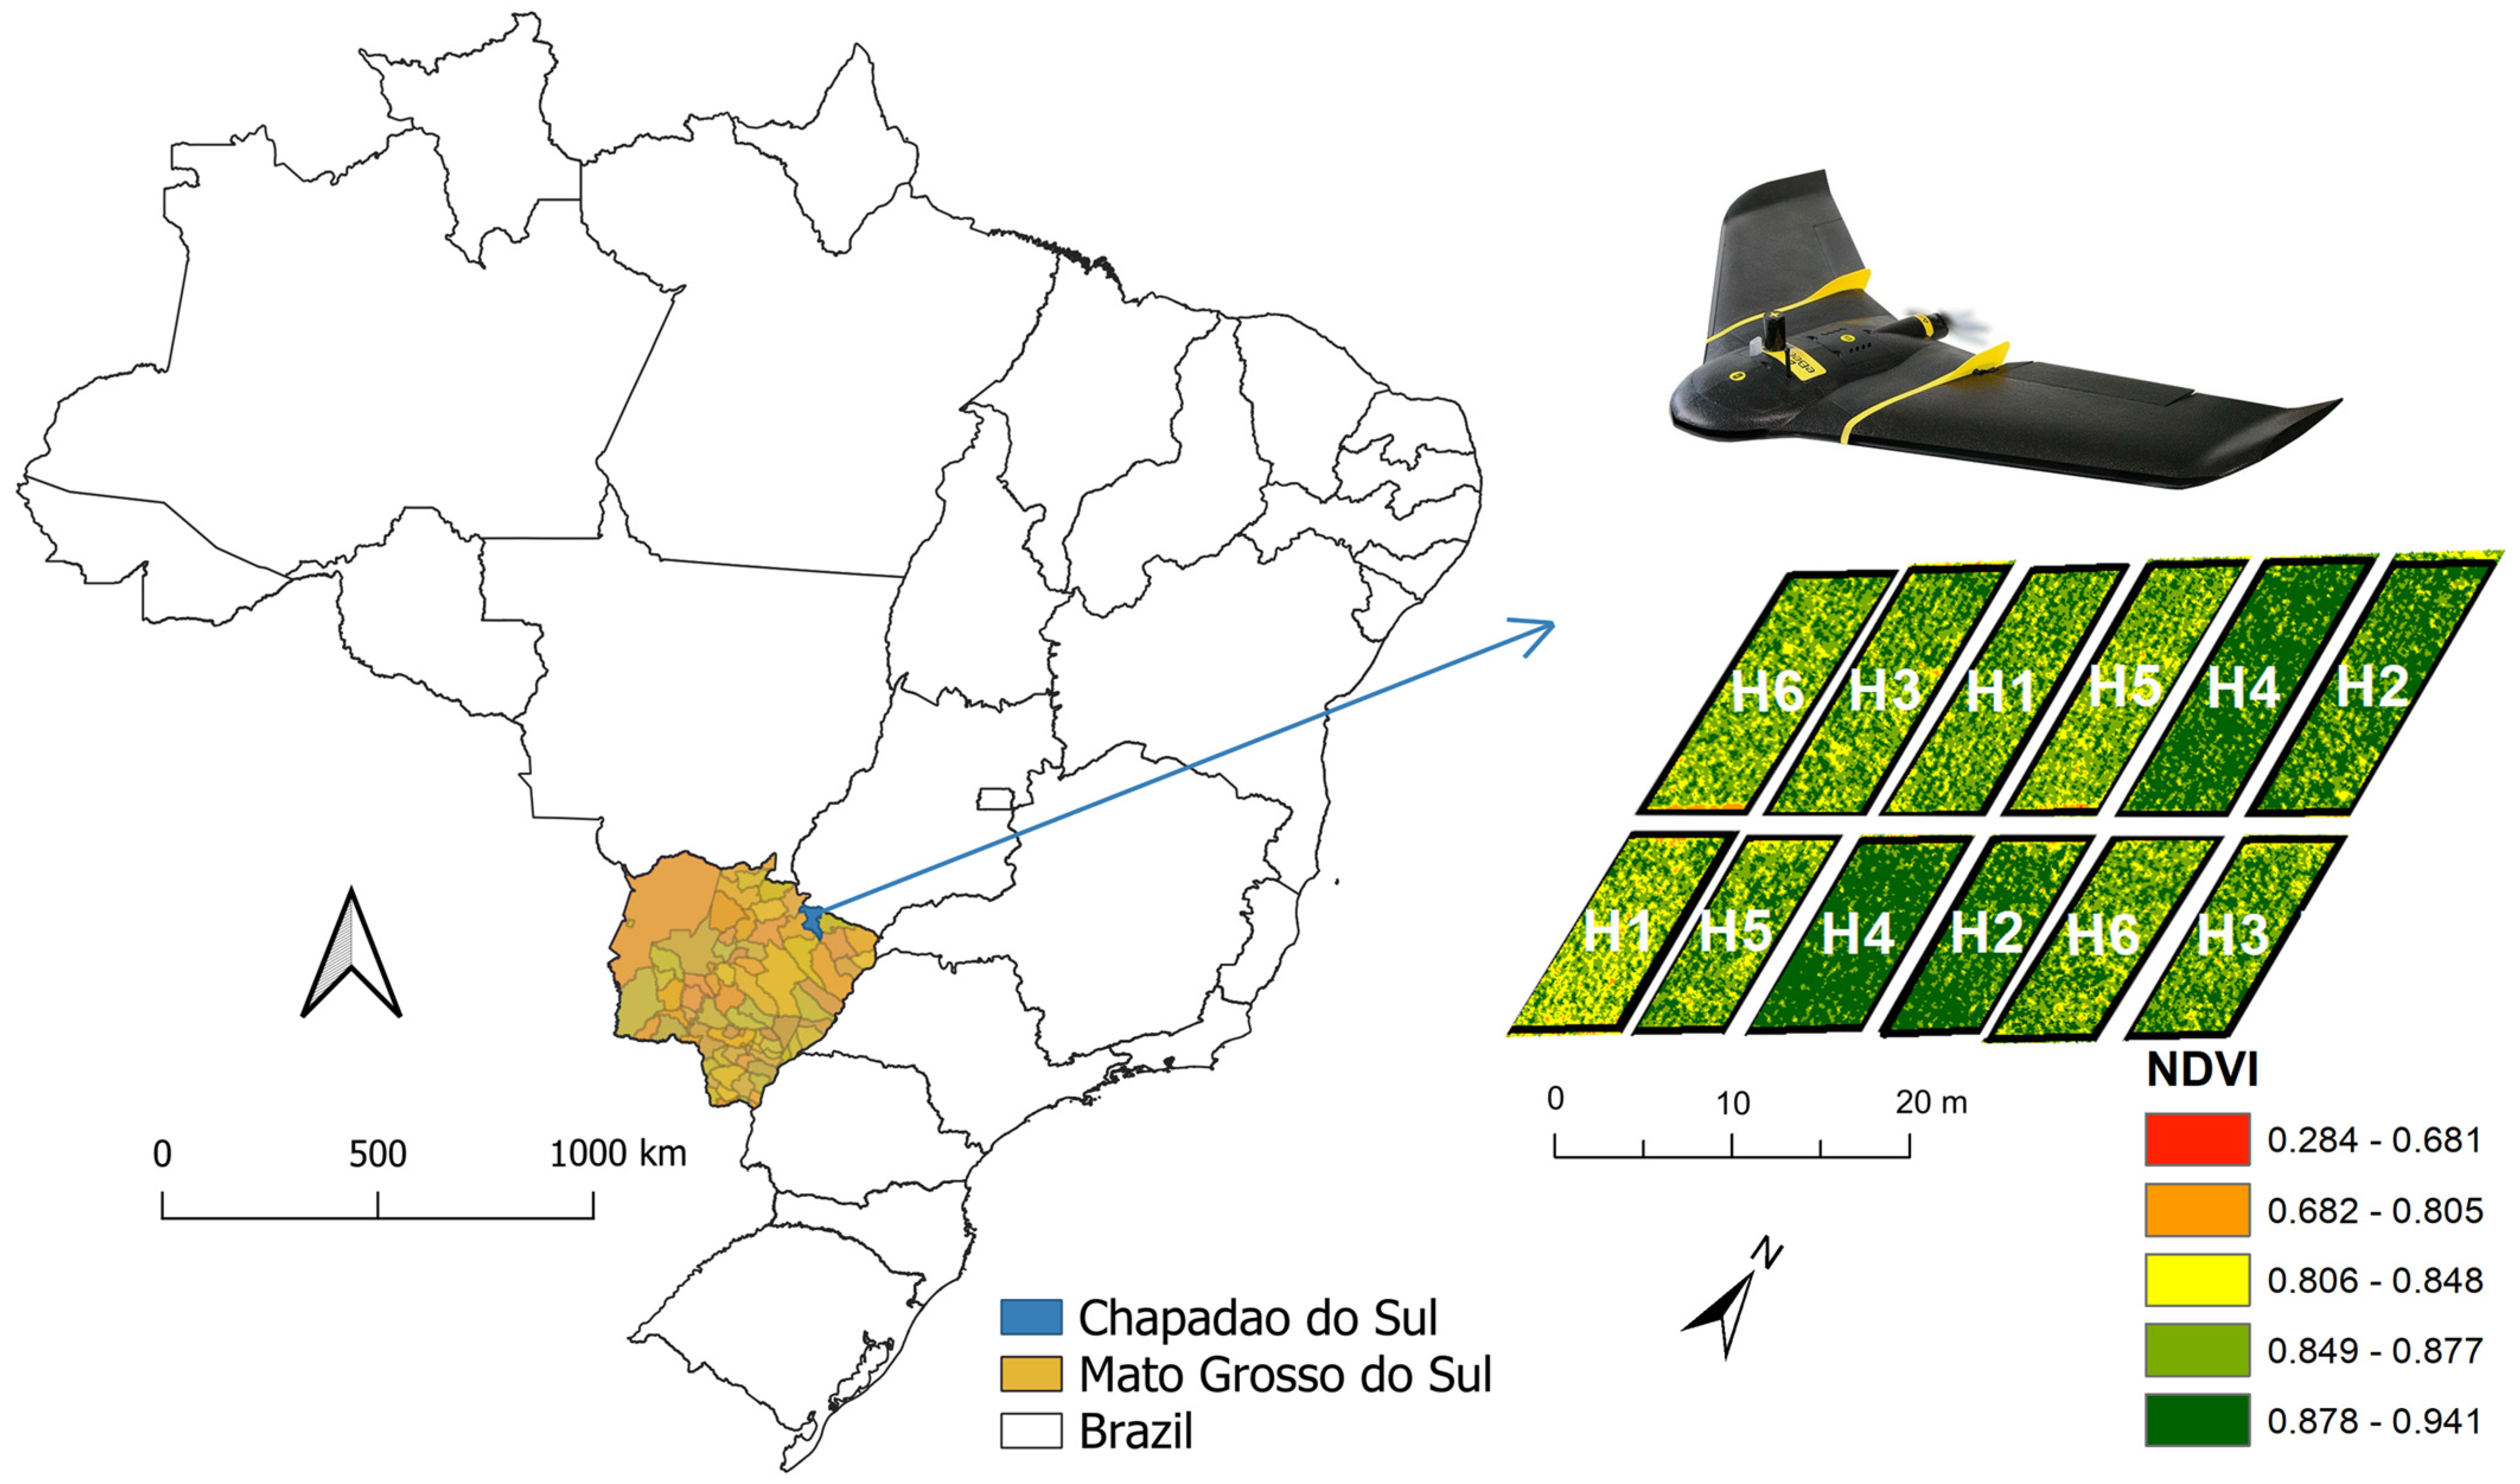
2.1. Field Experiment

The field experiment was carried out on 7 March 2022, in the experimental area of the Federal University of Mato Grosso do Sul (18°41′33″ S, 52°40′45″ W, with an altitude of 810 m) in the municipality of Chapadão do Sul, Mato Grosso do Sul, Brazil (Figure 1). The soil was managed using a tillage system (plowing and harrowing). According to the Koppen classification, the region’s climate is characterized as Tropical Savannah (Aw). The experimental design adopted was randomized blocks with three replications. The experiment was sown using a seeder and with a row spacing of 0.45 m. The sorghum hybrids evaluated were: 50A60 (H1), ADV1221 (H2), JB1330 (H3), NTX202 (H4), RANCHEIRO (H5) and SLP20K6D (H6). The hybrids were sown in two randomized blocks containing 10 lines of 10 m each. Crop management was carried out according to the requirements of the crop.

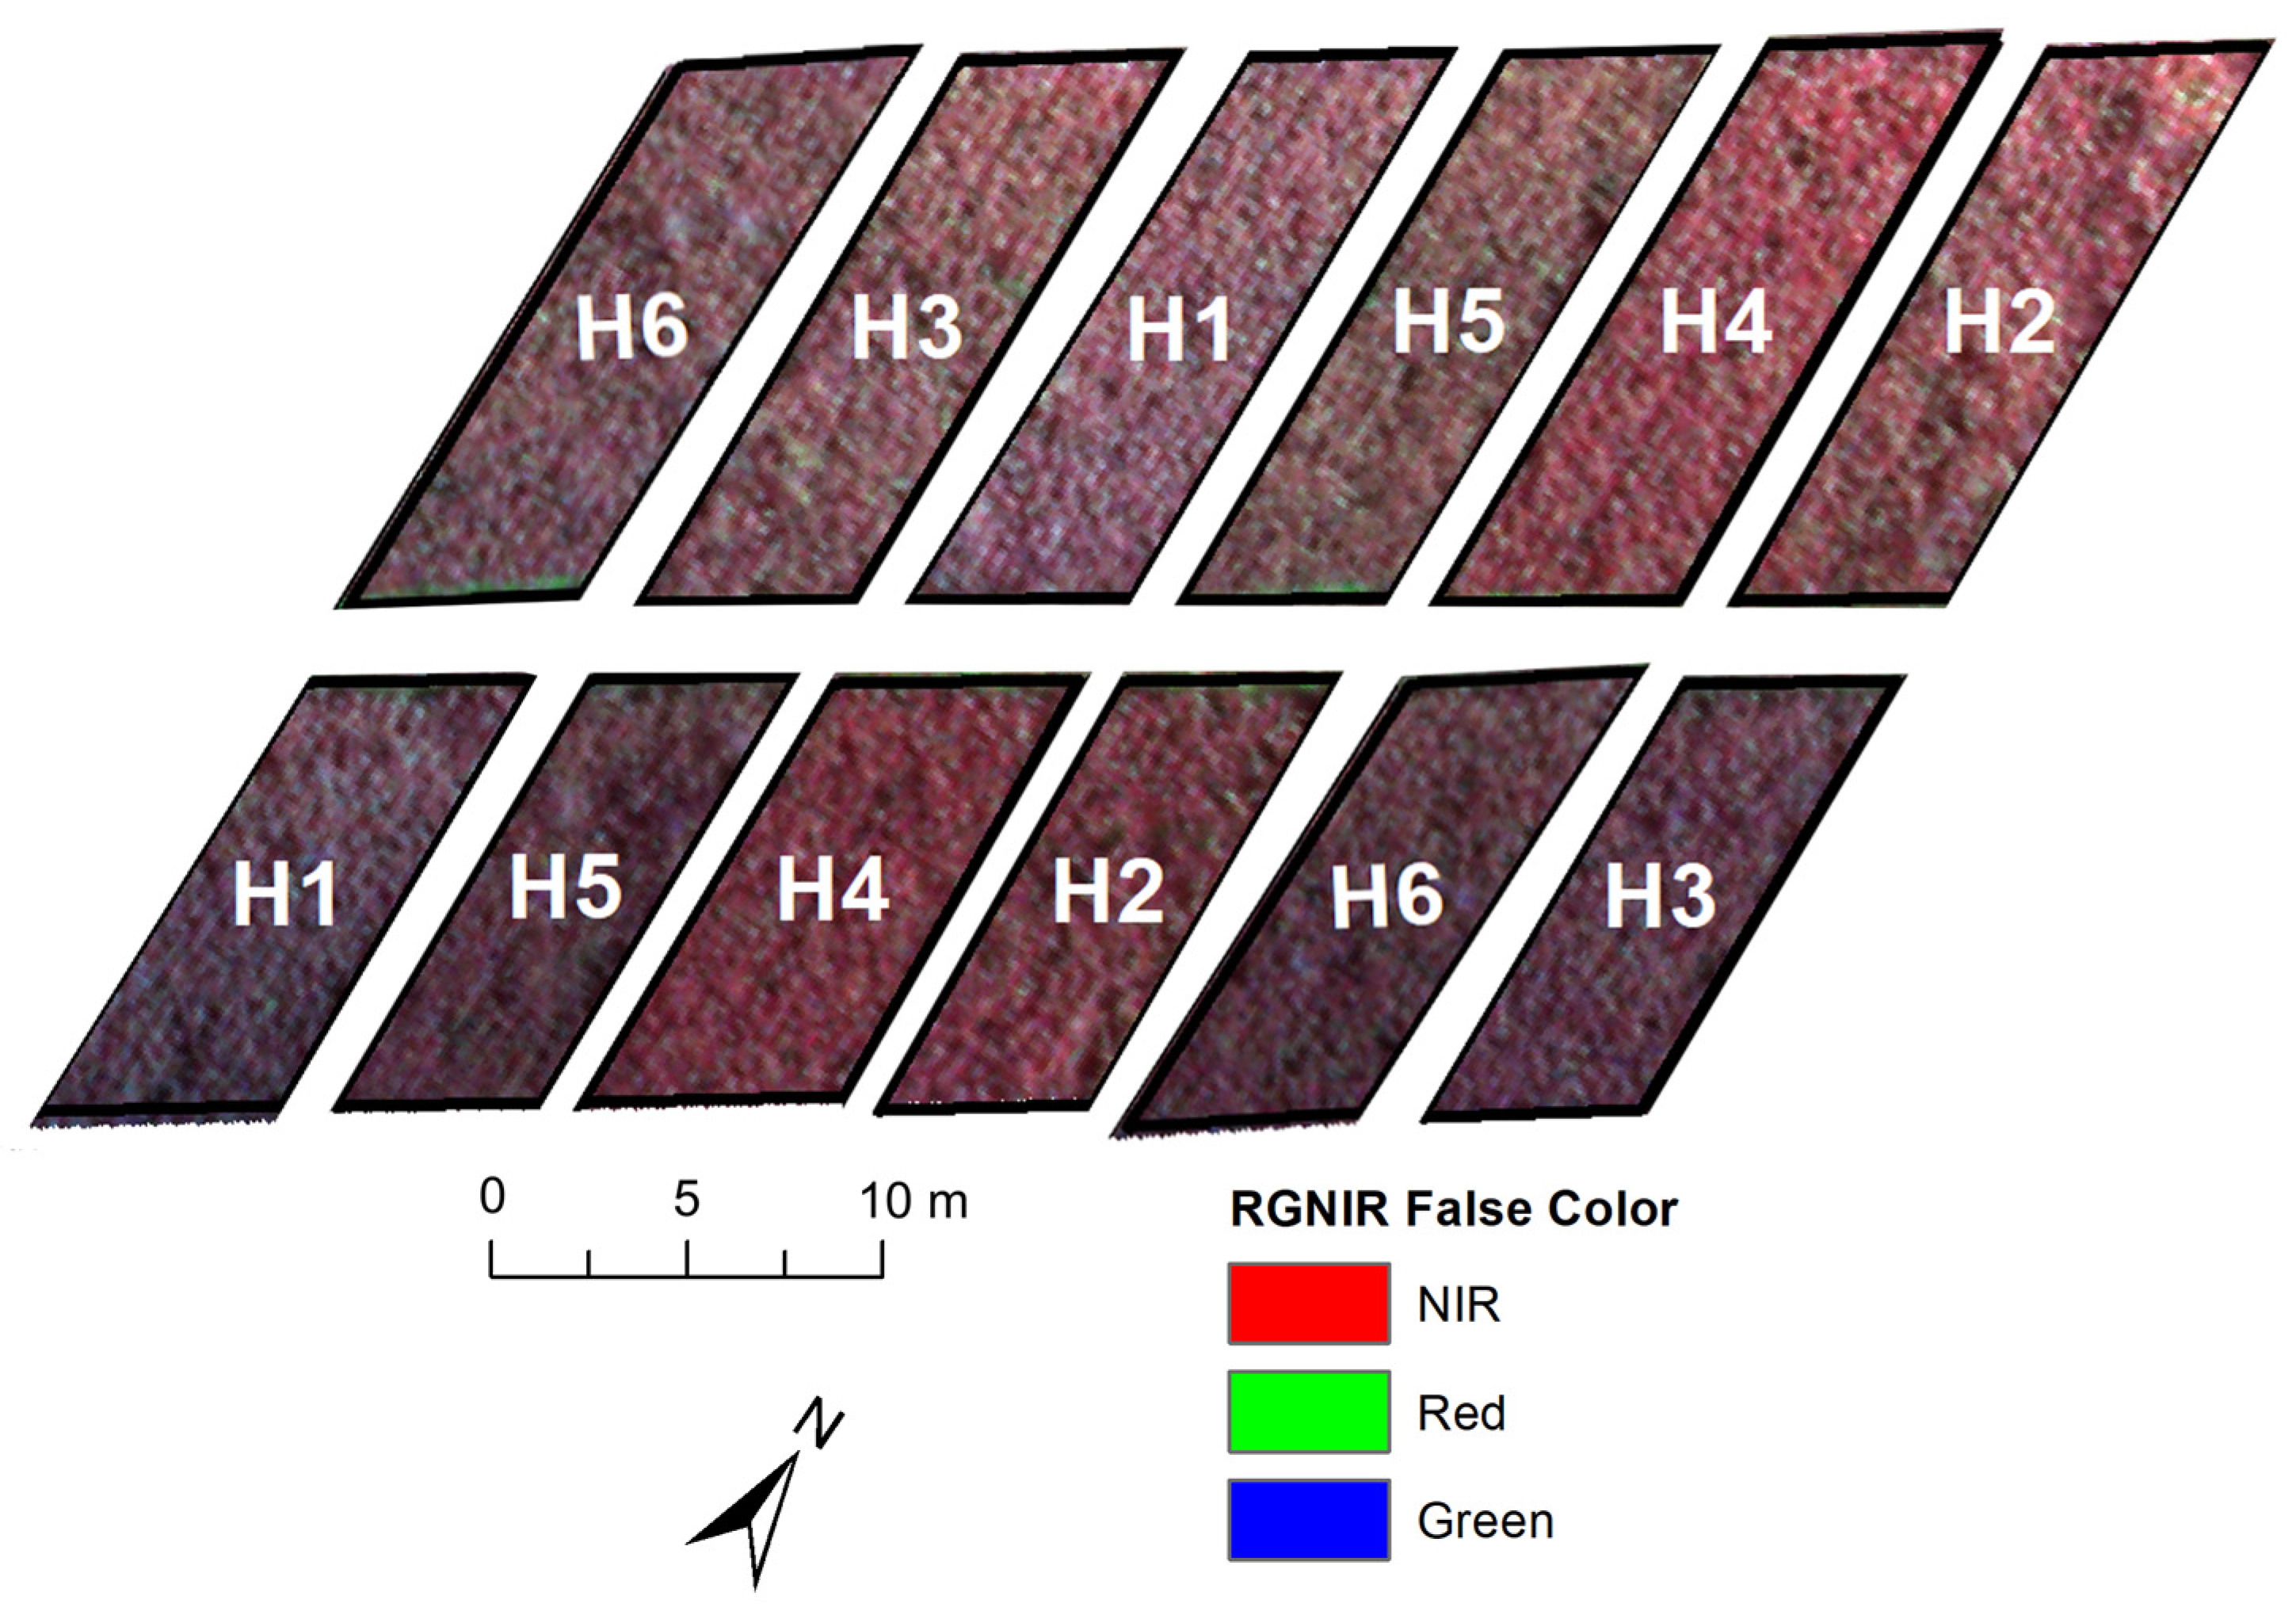
2.2. Collecting and Processing Multispectral Images

At 60 days after crop emergence (DAE), we performed a flyover using the Sensefly eBee RTK, a fixed-wing remotely piloted aircraft (RPA), equipped with autonomous takeoff, flight plan and landing control. The objective was to collect spectral information from six different sorghum hybrids. For this task, the RPA was equipped with a Parrot Sequoia multispectral sensor. The Sequoia sensor is a multispectral camera widely used in various agricultural activities. It utilizes a sunlight sensor combined with an additional 16-megapixel RGB camera for recognition purposes. This setup allowed us to obtain accurate and comprehensive data on the spectral characteristics of sorghum hybrids, contributing to a more detailed and meaningful analysis of our study. The adopted multispectral sensor has a horizontal angle of view (HFOV) of 61.9 degrees, a vertical angle of view (VFOV) of 48.5 degrees and a diagonal angle of view (DFOV) of 73.7 degrees. The flight took place at 09:00 (local time) in the morning, in a cloudless condition and at an altitude of 100 m, with a spatial resolution of 0.10 m. The aerial survey was carried out using RTK technology, which made it possible to position the sensor to collect the images with an accuracy of 2.5 cm. The images were mosaicked and orthorectified using Pix4Dmapper.
Radiometric calibration of the sensor was carried out with a factory-calibrated reflective surface. Parrot Sequoia has a brightness sensor that allows the acquired values to be calibrated. The wavelengths (SB) acquired by the sensor were: blue (475 nm, B_475), green (550 nm, G_550), red (660 nm, R_660), Rededge (735 nm, RE_735), and NIR (790 nm, NIR_790) according Figure 2. Once the SB data had been acquired, it was possible to calculate the vegetation indices (VIs) described in Table 1.

2.3. Machine Learning Models and Statistical Analysis

Data were subjected to machine learning analysis, in which six algorithms were tested: artificial neural network (ANN), support vector machine (SVM), decision trees J48 and REPTree (DT), random forest (RF) and logistic regression (LR) used as a control technique. In k-fold cross-validation, the input data into subsets divide of data called k-folds. The ML model is trained on all but one fold (k-1) and then evaluates the model on the dataset that was not used for training. A random cross-validation sampling strategy with k-fold = 10 and 10 repetitions (total of 100 runs) was applied. This strategy was used to evaluate the performance of the six supervised machine learning models, as already reported in other studies [27,28,29]. All model parameters were set according to the default setting of the Weka 3.8.5 software.
Three accuracy metrics were used to verify the accuracy of the algorithms in classifying sorghum hybrids: percentage of correct classifications (CC), Kappa coefficient, and F-score (Table 2).
An analysis of variance was carried out to assess the significance of ML, input, and interaction between them. Boxplots were used to illustrate the performance of the models and their significance, with the means of CC, kappa, and F-score according to the grouping of means from the Scott–Knott test [30] at 5% significance level. All analyses and graphs were generated using the ggplot2 and ExpDes.pt packages in the R software [31].

3. Results

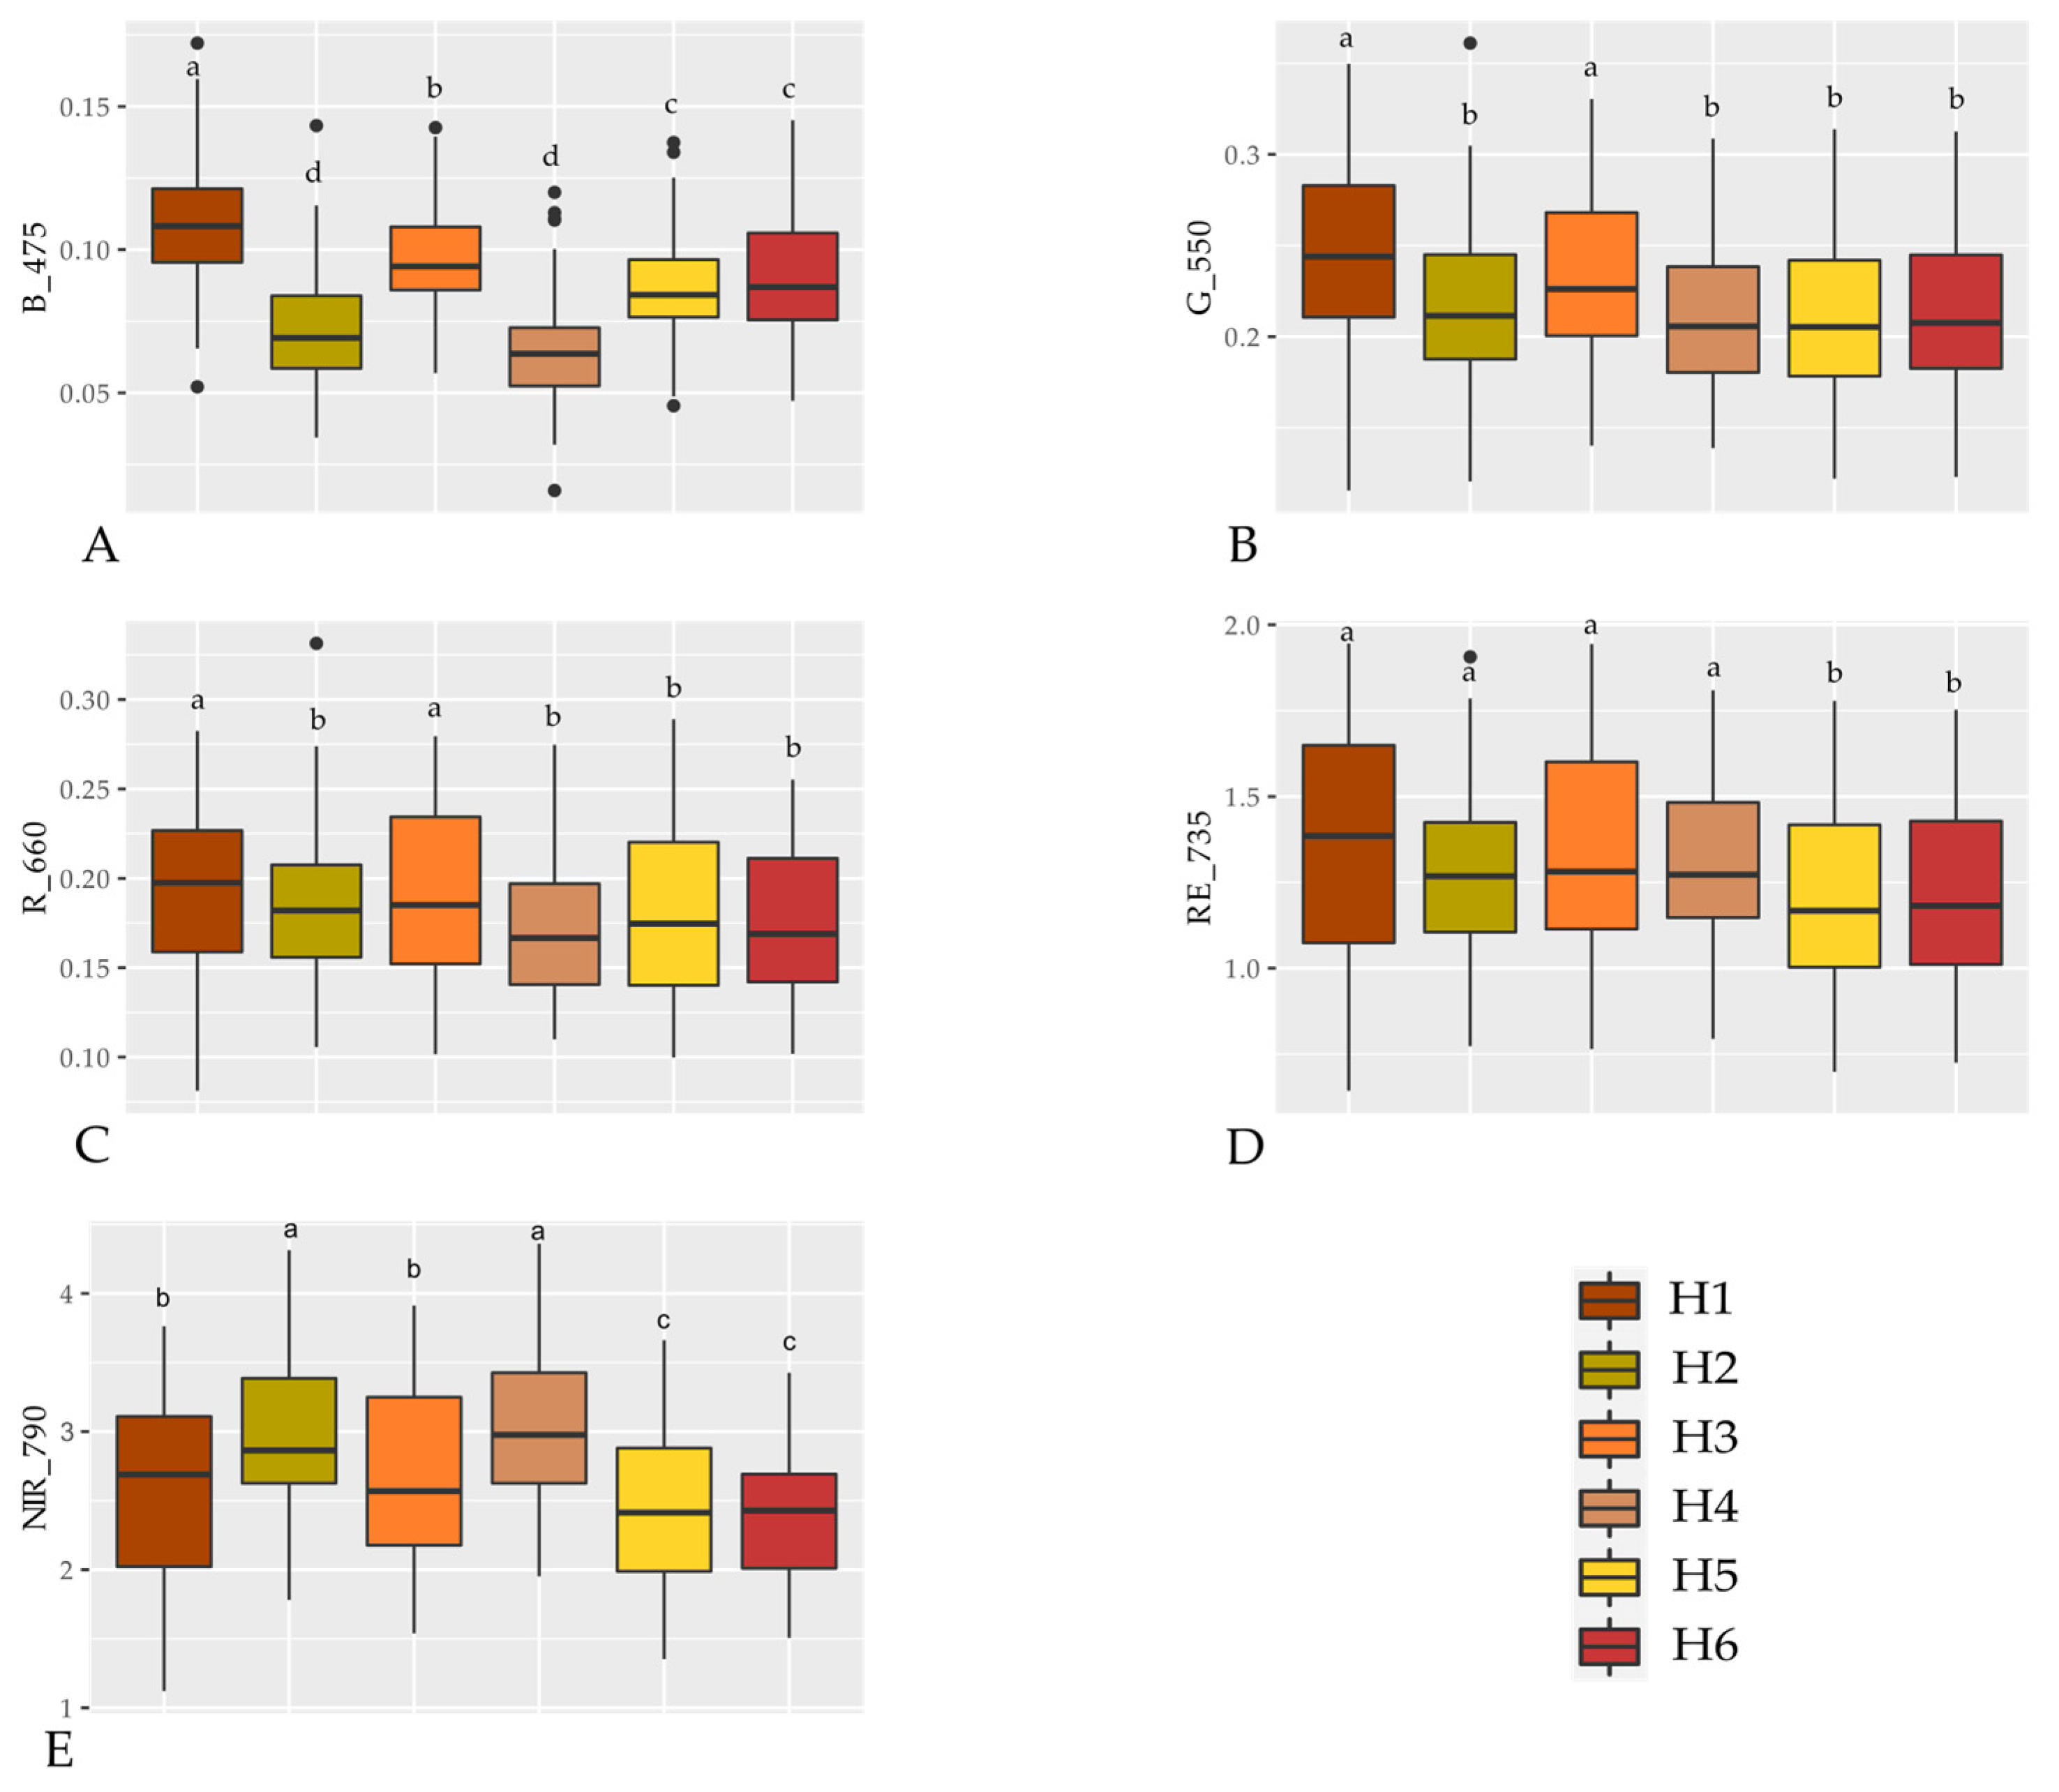
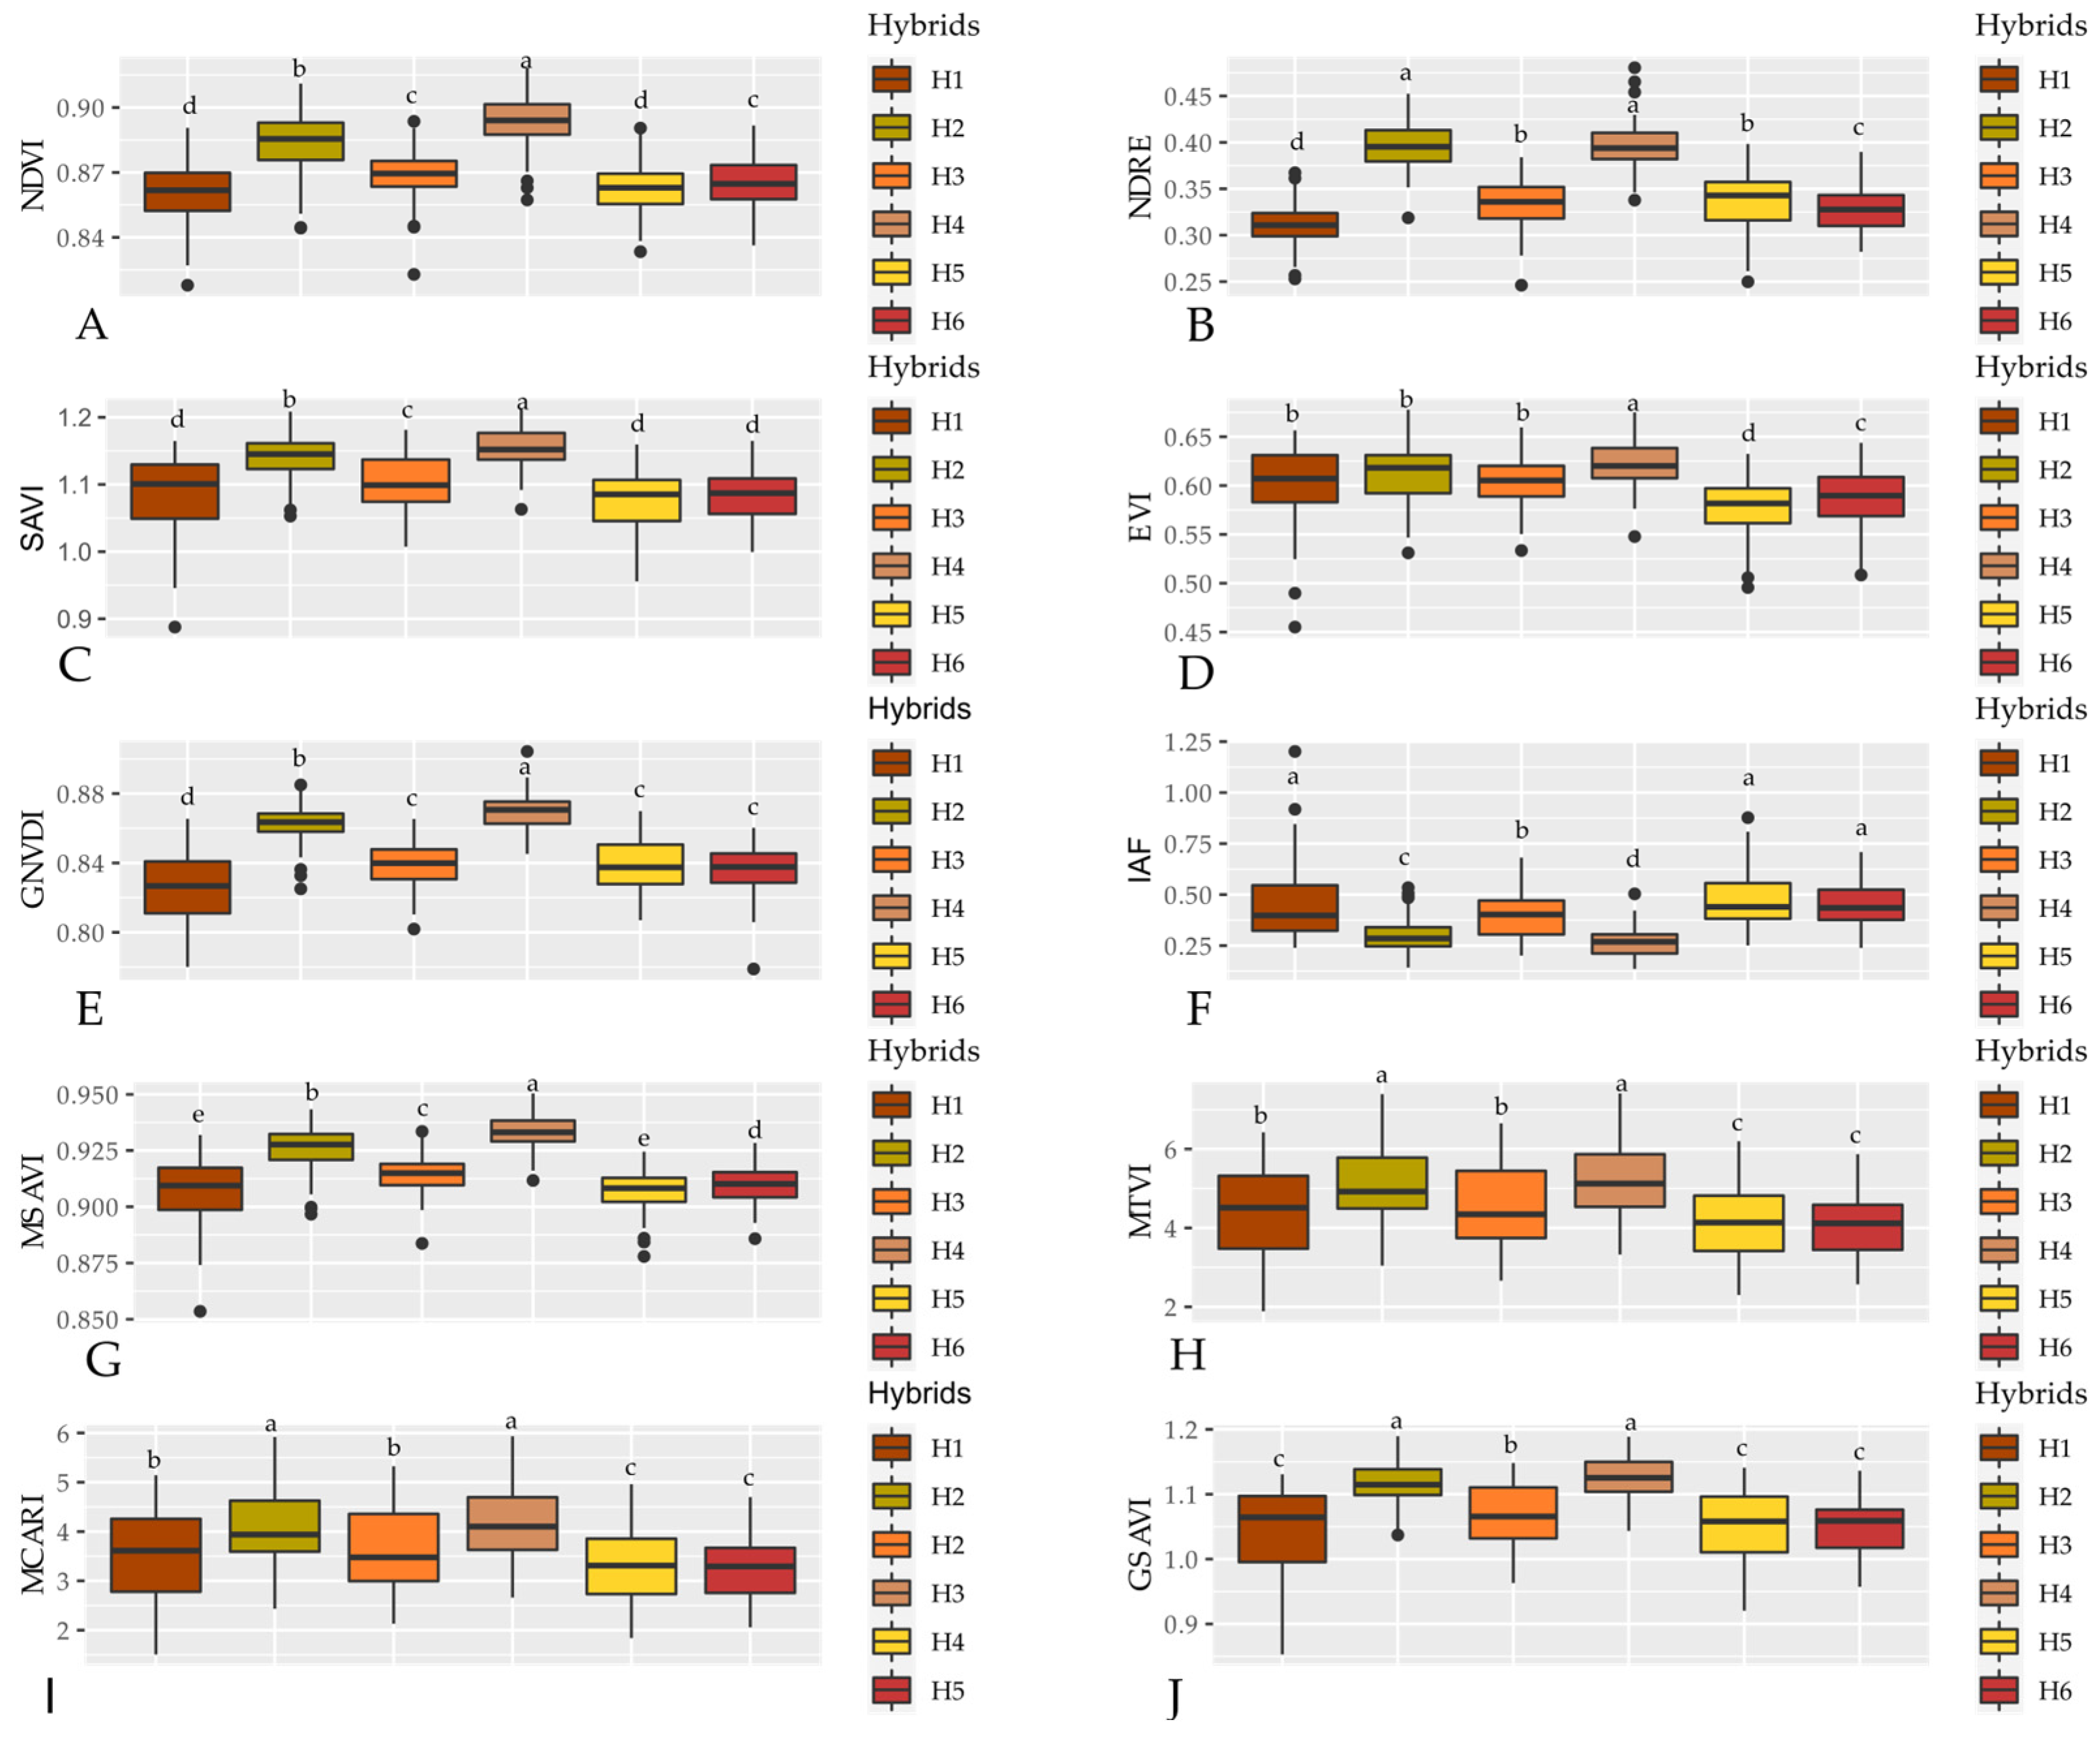
3.1. Spectral Signature of Hybrids

The six sorghum hybrids evaluated showed different reflectance behaviors in the visible range, especially from the 660 nm wavelength onwards, where the difference in reflectance between the hybrids becomes more evident. The difference in reflectance between the hybrids is even more marked from 735 nm onwards, where the reflectance from the H5 and H6 hybrids was similar and always lower than the others. The H4 and H2 hybrids had low reflectance up to just above 735 nm, standing out from the others from this wavelength onwards, especially the first one (Figure 3). Therefore, it is possible to observe distinct spectral signatures for each hybrid evaluated.
At wavelength B_475, the highest reflectance was observed for hybrid H1 and the lowest for hybrids H2 and H4 (Figure 3A). At wavelengths G_550 and R_660 (Figure 3B,C), the highest reflectances were observed by hybrids H1 and H4, while the other hybrids reflected less, but with no difference between them. At RE_735 (Figure 3D), hybrids H1, H2, H3, and H4 had the highest reflectances, which did not differ from each other, while hybrids H5 and H6 had the lowest reflectances. At wavelength NIR_790, hybrids H2 and H4 had the highest reflectances (Figure 3E), while the lowest reflectances were observed for H5 and H6.
Figure 4 shows the means of the vegetation indices, in which for all of them, except LAI, the highest means were achieved by the H4 hybrid, indicating a higher chlorophyll activity by this genotype. The lowest means for VIs were observed for hybrids H1, H5, and H6, while for LAI these hybrids had the highest means.

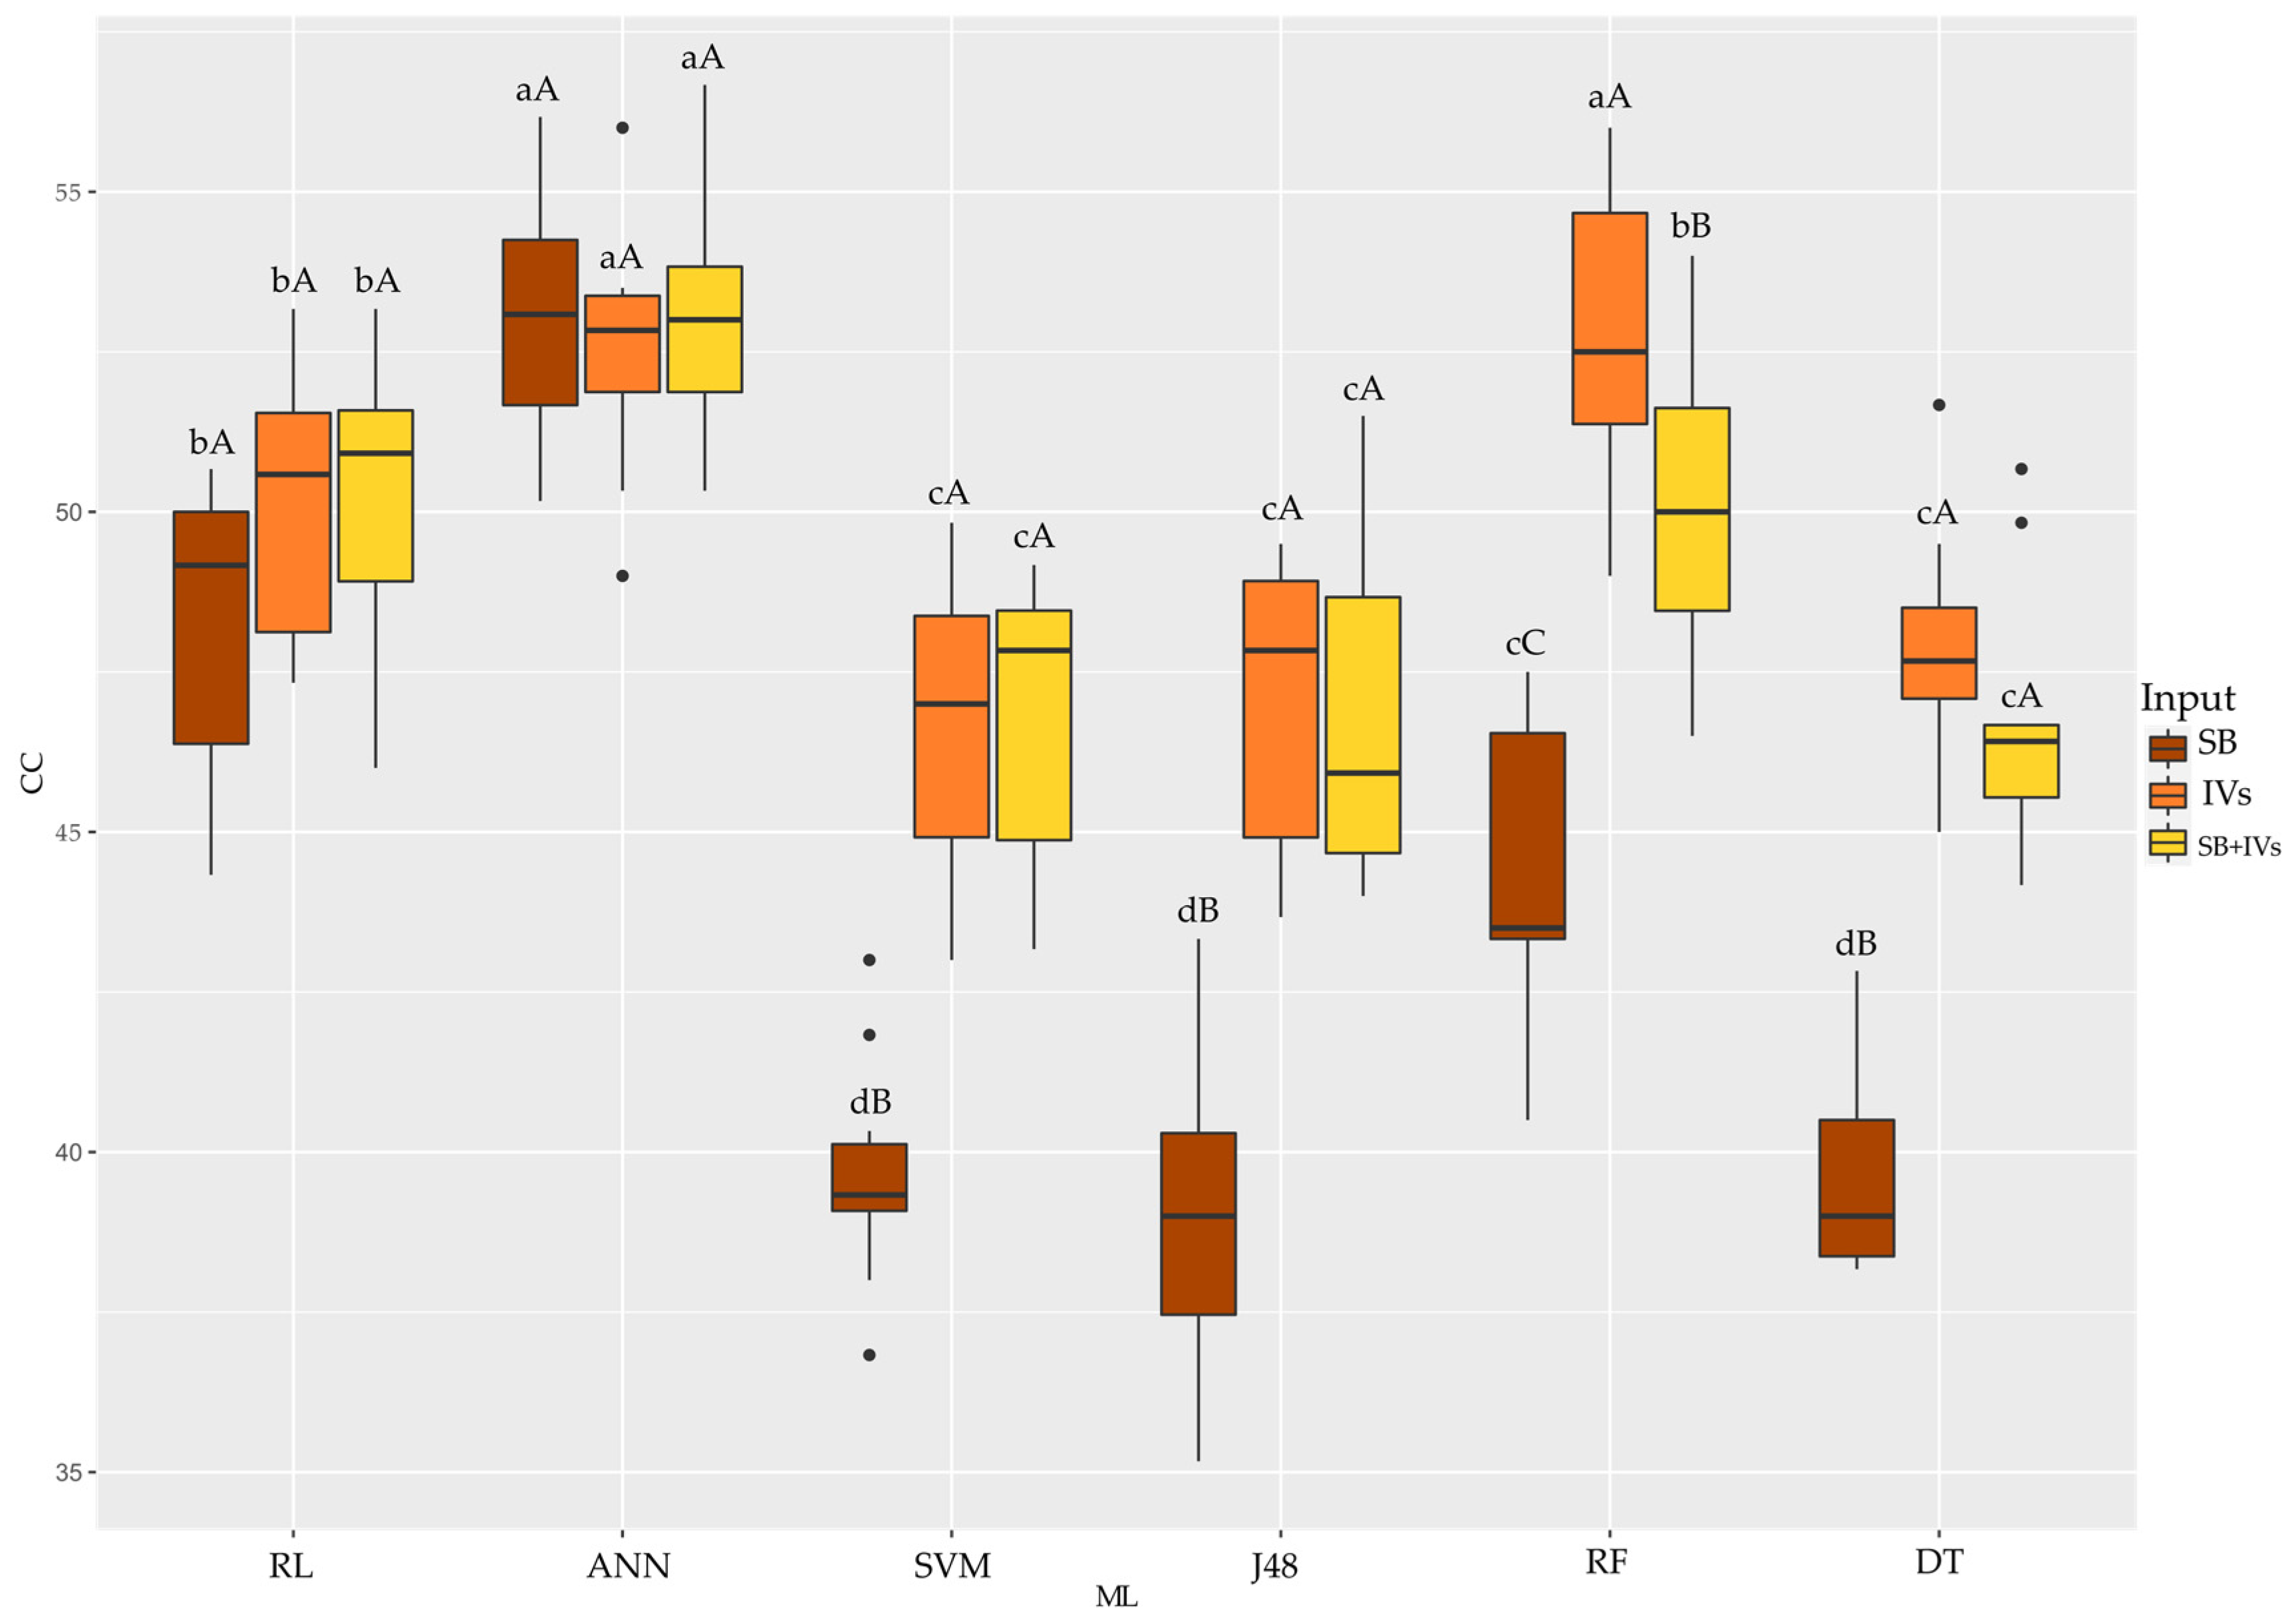
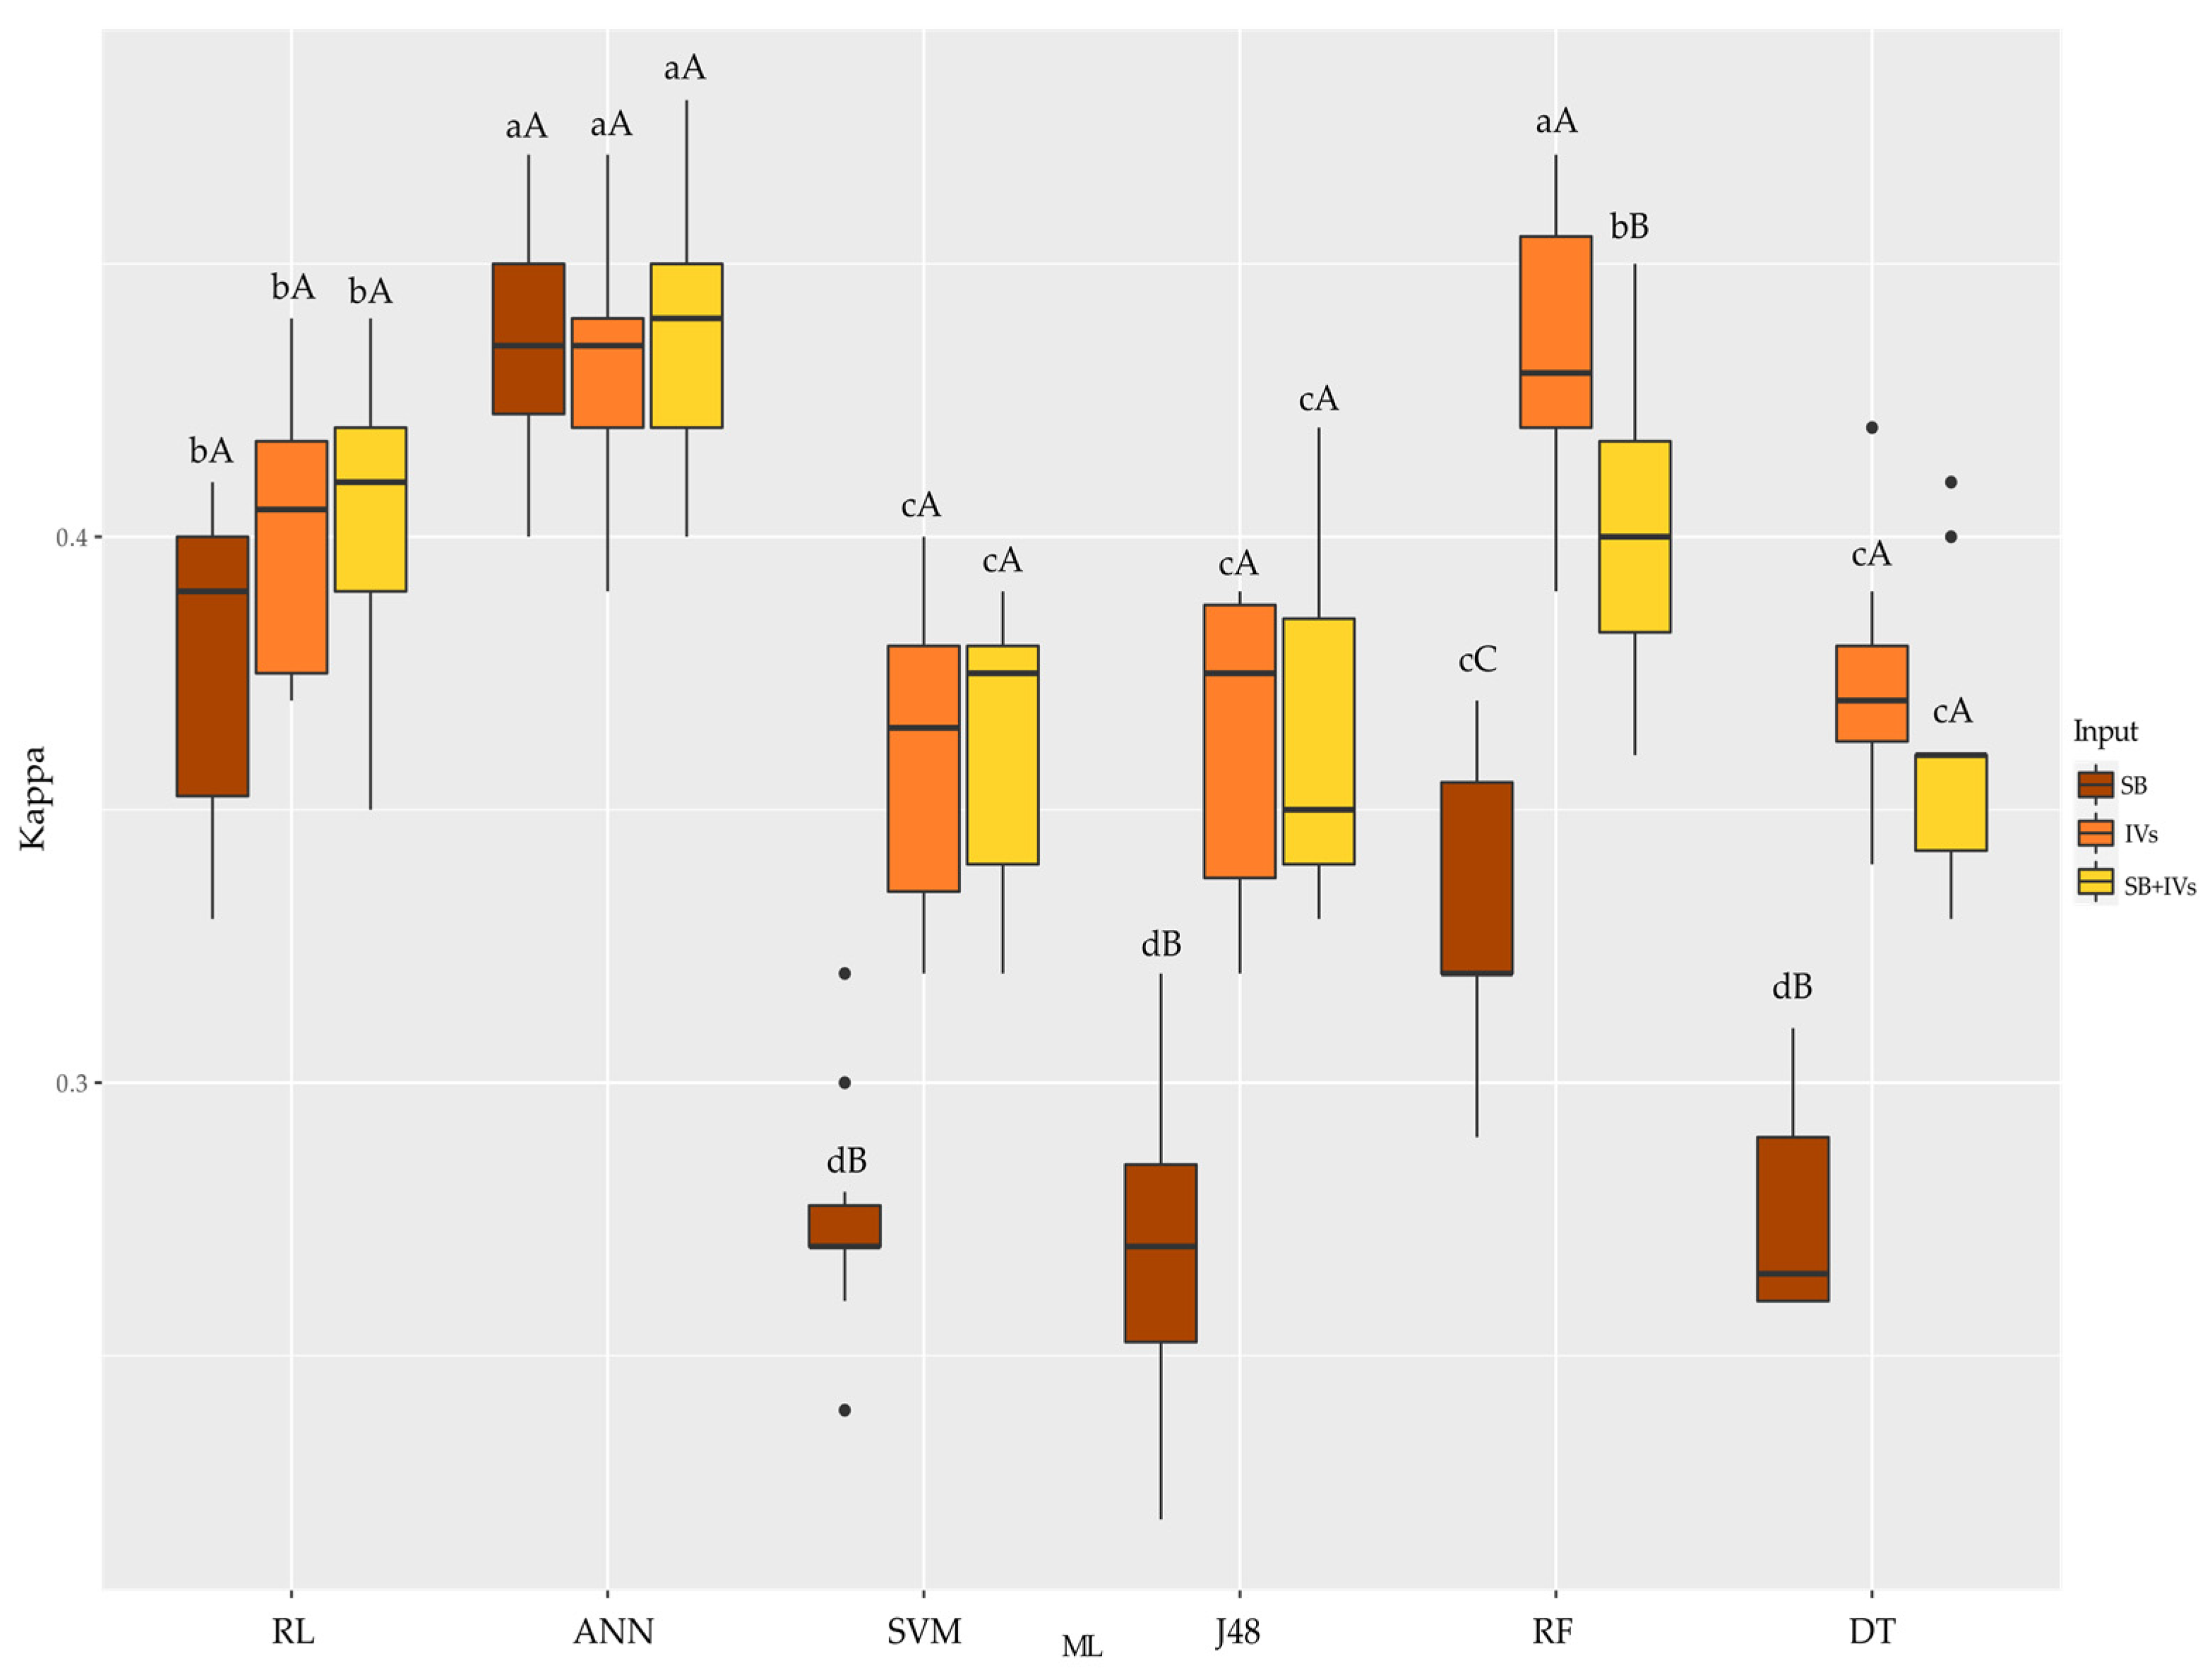
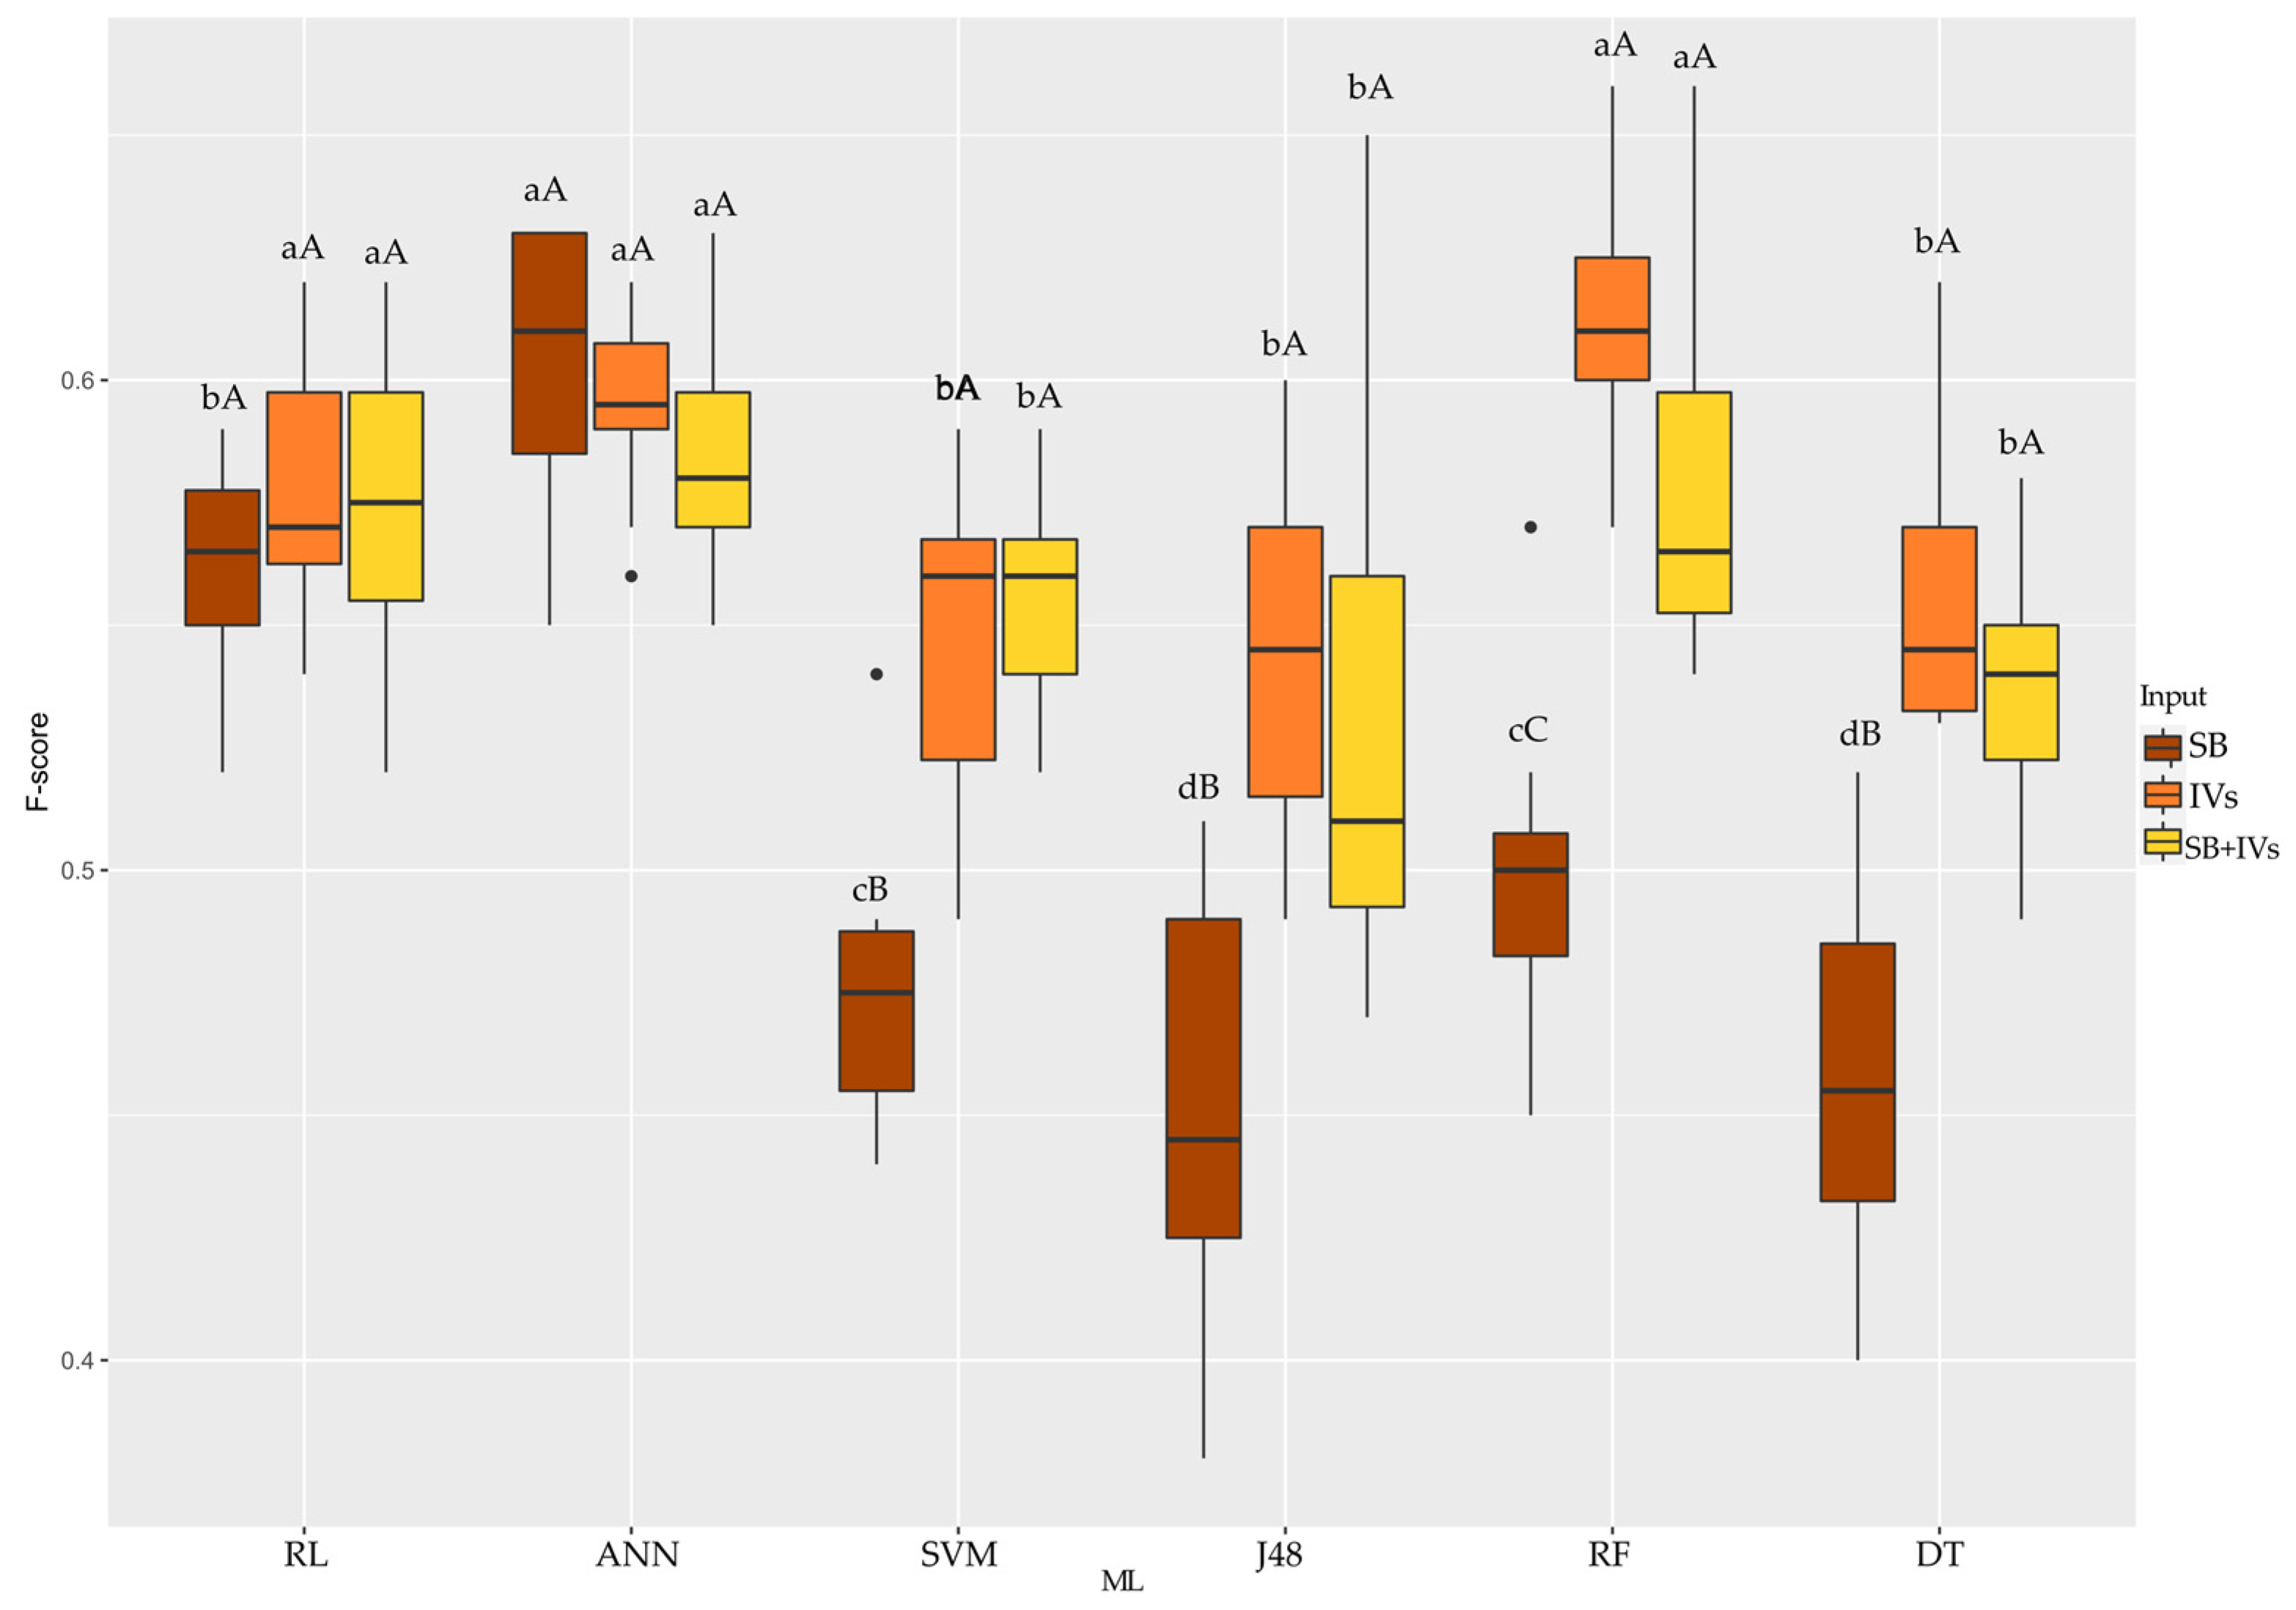
3.2. Classification of Hybrids Using Machine Learning

After identifying the spectral signature of each hybrid, the data was submitted to ML analysis in order to identify the most accurate algorithms for classifying each hybrid given the different input sets (using only SB, only VIs and SB + VIs). The significance of the interaction between ML x Inputs is notable for the three accuracy metrics tested (Table 3). Therefore, we performed a statistical unfolding of each metric, in order to identify the best algorithm for each input, and which input was best for each algorithm.
Using the CC accuracy metric (Figure 5), it can be seen that ANN performed best when using SB and SB + VIs as inputs to the algorithms (correct classification above 55%). Using the VIs as input to the algorithms, ANN and RF achieved the best accuracy. Evaluating each algorithm and inputs, SVM, J48 and DT achieved better accuracy using VIs and SB + VIs. RF achieved better accuracy using VIs. RL and ANN had the same classification accuracy regardless of the input used.
Regarding the Kappa coefficient (Figure 6), the SB and SB + VI inputs provided the highest accuracies by the ANN algorithm (above 0.4). VIs provided better answers for ANN and RF. SB + VIs provided the best answers for ANN. Evaluating the algorithms and their inputs, SVM, J48, and DT were better when VIs and SB + IVs were used. RF performed better with VIs. RL and ANN, as in CC, had the same accuracy response regardless of the input used in the algorithm.
By the F-score accuracy metric (Figure 7), when the input used was SB, ANN outperformed the other algorithms tested (around 0.60). When VIs and SB + VIs were used as inputs, RL, ANN, and RF performed better. Evaluating the algorithms, SVM, J48, and DT achieved the best results when VIs and SB + VIs were used as inputs. RF showed better accuracy when VIs were used as the input. RL and ANN had the same accuracy response regardless of the input.
The ANN algorithm performed best for the three accuracy metrics tested, regardless of the input used. In this case, the use of SB is feasible due to the speed and practicality of analyzing the data, as it does not require calculations to perform the VIs. RF showed better accuracy when VIs were used as an input. The use of VIs provided the best performance for all the algorithms, as did the use of SB + VIs which provided good performance for all the algorithms except RF.

4. Discussion

4.1. Spectral Signature of Hybrids

Each sorghum hybrid evaluated by the multispectral sensor showed a distinct spectral signature. This task of differentiating genetic materials has become a promising tool in the agricultural field, especially for plant breeding, through high-throughput phenotyping. Genotype-specific spectral signatures are influenced by the anatomical, morphological and physiological characteristics of each one, and this fact can be used in breeding programs to select distinct genotypes, increasing the genetic variability required to develop superior genotypes [32,33,34].
Pigments such as chlorophyll, carotenoids, and anthocyanins absorb light intensely in the visible range from 400 to 700 nm. It can be seen that the reflectance of sorghum hybrids is low until near the 660 nm range (Figure 2). Ref. [35] reported that the reflectance of healthy green leaves is low in the visible range, with a slight increase at 550 nm, which corresponds to the green region. The low reflectance in the visible wavelengths is due to the greater absorption by chlorophyll, which reflects less.
In the 475 nm wavelength blue region, the hybrids had little differentiation in their spectral signature. The 475 nm band, which covers the blue region, is related to the light absorption of green to yellow leaf pigments used in photosynthesis, being strongly related to the presence of xanthophylls, carotenes, and chlorophyll α and β pigments [36,37]. The red band (660 nm), is highly absorbed by chlorophylls to carry out photosynthesis and by phytochromes to be used in photoperiod processes. Both blue and red spectral bands are of significant importance for various plant biochemical processes, specifically photosynthesis. Bergamaschi [38] states that in addition this spectrum, the Rededge and NIR bands are also necessary for photoperiod processes and tissue elongation.
Another factor that contributes to the spectral range covering the NIR and Rededge reflecting more is that biochemical light absorption is low, which varies according to leaf structure [39]. This is evident in Figure 2, where there was greater differentiation between the hybrids from the 735 nm wavelength onwards. These findings can be attributed to the different biochemical abilities and leaf structure of the hybrids and also to the fact that the 790 nm wavelength is more sensitive in differentiating between them.
The sorghum hybrids behaved differently at the different wavelengths, as mentioned above. At B_475 nm (Figure 2A), hybrid H1 had the highest reflectance, followed by hybrids H3, H5, and H6, which had similar reflectance, and hybrids H2 and H4, which had the lowest and similar reflectance. Blue light in plants acts as a signaling agent and not as an energy source. This signaling is related to stomatal opening and is essential in the early hours of the day [40]. The hybrids with the lowest reflectance at this wavelength consequently absorbed blue SB, which means that these hybrids may have slightly higher photosynthetic efficiency than the others.
It should be noted that the stomatal opening caused by blue light does not depend directly on the guard cell or the photosynthesis of the mesophyll in response to it, but is enhanced by red light because the action of blue light alone tends to be less effective for stomatal opening [40,41,42]. Hybrids H1 and H3 had the highest reflectance in SB R_660 (Figure 2C). This spectral band, as well as blue, plays a fundamental role in the photosynthetic metabolism of plants [43]. Red light is intensely absorbed by chlorophyll in tissue that carries out photosynthesis, and compared to blue SB, there was little difference in reflectance between the hybrids, but the pattern of higher or lower reflectance remained the same, reinforcing the fact that hybrids with lower reflectance may have better photosynthetic performance.
At wavelength G_550, hybrids H1 and H3 reflected more and in a similar pattern. Within the visible range, the green wavelength is the most reflective, because around 10 to 50% of the green wavelength is not absorbed by the leaf chloroplasts [43,44]. The fraction of this band that is absorbed or transmitted by the plant is used in the essential processes of photosynthesis [45]. Among the roles played by the green wavelength is the CO2 assimilation used in the growth of plant biomass and yield. This SB is essential for the bottom leaves of the plant, where the blue and red wavelengths have a more limited incidence because they are more captured by the upper portion of the canopy [45,46]. The hybrids with the highest absorption in the 550 nm band, which corresponds to green light, were the same ones that absorbed less in the blue and red wavelengths.
Both wavelengths, RE and NIR, are sensitive to capturing plant reflectance, especially when plants are under stress [47] or when there are changes in the water status [48]. Due to this sensitivity, the sorghum hybrids reflected these wavelengths differently. This high reflectance above 700 nm is due to the spectrum’s sensitivity to changes in chlorophyll content, which in the Rededge range is mainly carried out by chlorophyll a [49].
It is noteworthy that the hybrids that reflected less in the visible range wavelengths were the ones that absorbed the most electromagnetic radiation. This indicates that these hybrids had a higher amount of chlorophyll [50]. This suggests that they had greater photosynthetic activity, and thus are physiologically superior.
VIs can provide information on several physiological parameters of the crop according to the reflectance values [35]. There was a great distinction between the hybrids for each VI used (Figure 4), even more so than between the wavelengths, because the indices used are sensitive to capturing the photosynthetically active activity of the plant canopy, leading to inferences about chlorophyll activity [51]. The VIs are calculated based on reflectance values at different wavelengths in the visible range, especially using distinct combinations between reflectances in the Rededge and NIR ranges. By combining these bands, the sensitivity of the indices to estimating chlorophyll is increased, which is further improved by combining NIR and Red, which are the most widely used for estimating plant biomass, as is the case with NDVI [52]. GNDVI is another index that is widely used in agriculture and, in this study, was able to differentiate sorghum hybrids in a similar way to NDVI. SAVI and MSAVI are indices that use medium and low-resolution images and can minimize soil influences [20], which were also able to differentiate between sorghum hybrids. Aiming at improving the efficiency of this data, associating this information with machine learning and looking for algorithms that provide accurate answers on the biophysical attributes of crops would improve the resources for evaluation in various fields [51]. Santana et al. [53], combining multispectral UAV data and machine learning algorithms achieved good accuracy in soybean classifications regarding grain industrial variables. There is an example of this distinction, it is possible to observe in Figure 1, an example with an NDVI map showing the variability between hybrids, which was possible to be distinguished by ML techniques.

4.2. Classification of Hybrids Using Machine Learning

After obtaining the spectral signature of each sorghum hybrid and observing the differentiation of these hybrids in terms of wavelength reflectance and VIs, data was submitted to machine learning analysis, evaluating the performance of six ML algorithms. We also tested different input data for these algorithms: using only SB, only VIs, and using both (SB + VIs), looking for the best performance in classifying the hybrids.
Considering the three accuracy metrics analyzed, the algorithm with the best performance was ANN, regardless of the input used. ANNs are used in several prediction and classification tasks in agriculture across a wide range of applications. [54] found high accuracy when using the algorithm to predict diameter at breast height (DBH) and total plant height (Ht) in eucalyptus trees. [55] achieved satisfactory accuracy in predicting tannin content in sorghum grains of different genotypes using artificial neural networks.
Regardless of the input, ANN algorithm achieved satisfactory accuracy in classifying sorghum hybrids. However, the most interesting from a data processing point of view would be using only SB as input variables. [28] stated that performing calculations to generate the VIs was an unnecessary task since using only SB as inputs for classifying soybean genotypes provided higher accuracy. [47] found that spectral bands, especially green and NIR, provide more accurate responses than using VIs for identifying soybean plants that are symptomatic or asymptomatic to nematode attacks.
Another algorithm that achieved good accuracy in classifying sorghum hybrids was RF using VIs as input set. RF is also used in several studies, such as recognizing the growth pattern of eucalyptus species using multispectral sensing [56]. Although it takes longer to obtain, the use of VIs can improve the image-based assessment of morphological and biochemical parameters of plants, consequently helping to reduce time and improve data processing by algorithms [57].
This study proposes a way of distinguishing sorghum hybrids using UAV-multispectral imagery, which consists of building a spectral signature model for sorghum hybrids and then processing this data using ML algorithms. Further information on the spectral signature of hybrids can be obtained using data from hyperspectral sensors in more different conditions of environments. The use of other sorghum hybrids, different vegetation indices, or an increased number of VIs can contribute to improving the accuracy of the ML algorithms.

5. Conclusions

There were differences in the spectral signature of each sorghum hybrid, which makes it possible to differentiate them using wavelengths and vegetation indices. Processing the multispectral data using machine learning techniques made it possible to accurately differentiate the hybrids, with emphasis on artificial neural networks using spectral bands as inputs and random forest using vegetation indices as inputs.

Author Contributions

Conceptualization, D.C.S. and G.d.F.T.; methodology, P.E.T.; software, D.C.S.; validation, L.P.R.T., F.H.R.B. and C.A.d.S.J.; formal analysis, D.C.S.; investigation, R.G.; resources, P.E.T.; data curation, P.E.T.; writing—original draft preparation, D.C.S.; writing—review and editing, I.C.d.O., J.L.G.d.O. and J.T.d.O.; visualization, G.d.F.T.; supervision, P.E.T.; project administration, P.E.T.; funding acquisition, F.H.R.B. All authors have read and agreed to the published version of the manuscript.

Funding

The authors would like to thank the Universidade Federal de Mato Grosso do Sul (UFMS), Universidade do Estado do Mato Grosso (UNEMAT), Conselho Nacional de Desenvolvimento Científico e Tecnológico (CNPq)–Grant numbers 303767/2020-0, 309250/2021-8 and 306022/2021-4, and Fundação de Apoio ao Desenvolvimento do Ensino, Ciência e Tecnologia do Estado de Mato Grosso do Sul (FUNDECT) TO numbers 88/2021, and 07/2022, and SIAFEM numbers 30478 and 31333. This study was financed in part by the Coordenação de Aperfeiçoamento de Pessoal de Nível Superior-Brazil (CAPES)–Financial Code 001.

Data Availability Statement

Data are available from the corresponding author upon reasonable request.

Acknowledgments

The authors would like to thank the Universidade Federal de Mato Grosso do Sul (UFMS), Universidade do Estado do Mato Grosso (UNEMAT), Conselho Nacional de Desenvolvimento Científico e Tecnológico (CNPq)–Grant numbers 303767/2020-0, 309250/2021-8 and 306022/2021-4, and Fundação de Apoio ao Desenvolvimento do Ensino, Ciência e Tecnologia do Estado de Mato Grosso do Sul (FUNDECT) TO numbers 88/2021, and 07/2022, and SIAFEM numbers 30478 and 31333. This study was financed in part by the Coordenação de Aperfeiçoamento de Pessoal de Nível Superior-Brazil (CAPES)–Financial Code 001.

Conflicts of Interest

The authors declare no conflict of interest.

References

  1. Herzig, P.; Borrmann, P.; Knauer, U.; Klück, H.-C.; Kilias, D.; Seiffert, U.; Pillen, K.; Maurer, A. Evaluation of RGB and multispectral unmanned aerial vehicle (UAV) imagery for high-throughput phenotyping and yield prediction in barley breeding. Remote Sens. 2021, 13, 2670. [Google Scholar] [CrossRef]
  2. Furbank, R.T.; Tester, M. Phenomics–technologies to relieve the phenotyping bottleneck. Trends Plant Sci. 2011, 16, 635–644. [Google Scholar] [CrossRef] [PubMed]
  3. Chen, D.; Neumann, K.; Friedel, S.; Kilian, B.; Chen, M.; Altmann, T.; Klukas, C. Dissecting the phenotypic components of crop plant growth and drought responses based on high-throughput image analysis. Plant Cell 2014, 26, 4636–4655. [Google Scholar] [CrossRef] [PubMed]
  4. Wilke, N.; Siegmann, B.; Postma, J.A.; Muller, O.; Krieger, V.; Pude, R.; Rascher, U. Assessment of plant density for barley and wheat using UAV multispectral imagery for high-throughput field phenotyping. Comput. Electron. Agric. 2021, 189, 106380. [Google Scholar] [CrossRef]
  5. Candiago, S.; Remondino, F.; De Giglio, M.; Dubbini, M.; Gattelli, M. Evaluating multispectral images and vegetation indices for precision farming applications from UAV images. Remote Sens. 2015, 7, 4026–4047. [Google Scholar] [CrossRef]
  6. Colomina, I.; Molina, P. Unmanned aerial systems for photogrammetry and remote sensing: A review. ISPRS J. Photogramm. Remote Sens. 2014, 92, 79–97. [Google Scholar] [CrossRef]
  7. Primicerio, J.; Di Gennaro, S.F.; Fiorillo, E.; Genesio, L.; Lugato, E.; Matese, A.; Vaccari, F.P. A flexible unmanned aerial vehicle for precision agriculture. Precis Agric. 2012, 13, 517–523. [Google Scholar] [CrossRef]
  8. Kar, S.; Purbey, V.K.; Suradhaniwar, S.; Korbu, L.B.; Kholová, J.; Durbha, S.S.; Adinarayana, J.; Vadez, V. An ensemble machine learning approach for determination of the optimum sampling time for evapotranspiration assessment from high-throughput phenotyping data. Comput. Electron. Agric. 2021, 182, 105992. [Google Scholar] [CrossRef]
  9. Ren, J.; Shao, Y.; Wan, H.; Xie, Y.; Campos, A. A two-step mapping of irrigated corn with multi-temporal MODIS and Landsat analysis ready data. ISPRS J. Photogramm. Remote Sens. 2021, 176, 69–82. [Google Scholar] [CrossRef]
  10. Watanabe, K.; Guo, W.; Arai, K.; Takanashi, H.; Kajiya-Kanegae, H.; Kobayashi, M.; Yano, K.; Tokunaga, T.; Fujiwara, T.; Tsutsumi, N.; et al. High-throughput phenotyping of sorghum plant height using an unmanned aerial vehicle and its application to genomic prediction modeling. Front. Plant Sci. 2017, 8, 421. [Google Scholar] [CrossRef]
  11. Zhang, H.; Ge, Y.; Xie, X.; Atefi, A.; Wijewardane, N.; Thapa, S. High throughput analysis of leaf chlorophyll content in sorghum using RGB, hyperspectral, and fluorescence imaging and sensor fusion. Plant Methods 2022, 18, 60. [Google Scholar] [CrossRef] [PubMed]
  12. Liedtke, J.D.; Hunt, C.H.; George-Jaeggli, B.; Laws, K.; Watson, J.; Potgieter, A.B.; Cruickshank, A.; Jordan, D.R. High-throughput phenotyping of dynamic canopy traits associated with stay-green in grain sorghum. Plant Phenomics 2020, 2020, 4635153. [Google Scholar] [CrossRef] [PubMed]
  13. Gill, T.; Gill, S.K.; Saini, D.K.; Chopra, Y.; de Koff, J.P.; Sandhu, K.S. A Comprehensive Review of High Throughput Phenotyping and Machine Learning for Plant Stress Phenotyping. Phenomics 2022, 2, 156–183. [Google Scholar] [CrossRef] [PubMed]
  14. da Silva, A.K.V.; Borges, M.V.V.; Batista, T.S.; da Silva, C.A., Jr.; Furuya, D.E.G.; Osco, L.P.; Ribeiro Teodoro, L.P.; Rojo Baio, F.H.; Ramos, A.P.M.; Gonçalves, W.N.; et al. Predicting eucalyptus diameter at breast height and total height with uav-based spectral indices and machine learning. Forests 2021, 12, 582. [Google Scholar] [CrossRef]
  15. da Silva, C.A., Jr.; Nanni, M.R.; Shakir, M.; Teodoro, P.E.; de Oliveira-Júnior, J.F.; Cezar, E.; de Gois, G.; Lima, M.; Wojciechowski, J.C.; Shiratsuchi, L.S. Soybean varieties discrimination using non-imaging hyperspectral sensor. Infrared Phys. Technol. 2018, 89, 338–350. [Google Scholar] [CrossRef]
  16. Yoder, B.J.; Pettigrew-Crosby, R.E. Predicting nitrogen and chlorophyll content and concentrations from reflectance spectra (400–2500 nm) at leaf and canopy scales. Remote Sens. Environ. 1995, 53, 199–211. [Google Scholar] [CrossRef]
  17. Zhang, J.; Han, M.; Wang, L.; Chen, M.; Chen, C.; Shen, S.; Liu, J.; Zhang, C.; Shang, J.; Yan, X. Study of Genetic Variation in Bermuda Grass along Longitudinal and Latitudinal Gradients Using Spectral Reflectance. Remote Sens. 2023, 15, 896. [Google Scholar] [CrossRef]
  18. Rouse, J.W.; Haas, R.H.; Schell, J.A.; Deering, D.W. Monitoring vegetation systems in the Great Plains with ERTS. NASA Spec. Publ. 1974, 351, 309. [Google Scholar]
  19. Gitelson, A.; Merzlyak, M.N. Spectral Reflectance Changes Associated with Autumn Senescence of Aesculus hippocastanum L. and Acer platanoides L. Leaves. Spectral Features and Relation to Chlorophyll Estimation. J. Plant Physiol. 1994, 143, 286–292. [Google Scholar] [CrossRef]
  20. Huete, A.R. A soil-adjusted vegetation index (SAVI). Remote Sens. Environ. 1988, 25, 295–309. [Google Scholar] [CrossRef]
  21. Huete, A.; Didan, K.; Miura, T.; Rodriguez, E.P.; Gao, X.; Ferreira, L.G. Overview of the radiometric and biophysical performance of the MODIS vegetation indices. Remote Sens. Environ. 2002, 83, 195–213. Available online: https://www.sciencedirect.com/science/article/pii/S0034425702000962 (accessed on 1 November 2023). [CrossRef]
  22. Gitelson, A.A.; Merzlyak, M.N. Signature Analysis of Leaf Reflectance Spectra: Algorithm Development for Remote Sensing of Chlorophyll. J. Plant Physiol. 1996, 148, 494–500. Available online: https://www.sciencedirect.com/science/article/pii/S0176161796802847 (accessed on 1 November 2023). [CrossRef]
  23. Allen, R.G.; Tasumi, M.; Trezza, R.; Waters, R.; Bastiaanssen, W. SEBAL Surface Energy Balance Algorithms for Land: Advanced Training and Users Manual, Idaho Implementation, 1st ed.; Department of Water Resources, University of Idaho: Moscow, ID, USA, 2002. [Google Scholar]
  24. Qi, J.; Chehbouni, A.; Huete, A.R.; Kerr, Y.H.; Sorooshian, S. A modified soil adjusted vegetation index. Remote Sens. Environ. 1994, 48, 119–126. [Google Scholar] [CrossRef]
  25. Haboudane, D.; Miller, J.R.; Pattey, E.; Zarco-Tejada, P.J.; Strachan, I.B. Hyperspectral vegetation indices and novel algorithms for predicting green LAI of crop canopies: Modeling and validation in the context of precision agriculture. Remote Sens. Environ. 2004, 90, 337–352. [Google Scholar] [CrossRef]
  26. Daughtry, C.S.T.; Walthall, C.L.; Kim, M.S.; de Colstoun, E.B.; McMurtrey Iii, J.E. Estimating corn leaf chlorophyll concentration from leaf and canopy reflectance. Remote Sens. Environ. 2000, 74, 229–239. [Google Scholar] [CrossRef]
  27. Santana, D.C.; Teixeira Filho, M.C.M.; da Silva, M.R.; das Chagas, P.H.M.; de Oliveira, J.L.G.; Baio, F.H.R.; Campos, C.N.S.; Teodoro, L.P.R.; da Silva, C.A., Jr.; Teodoro, P.E.; et al. Machine Learning in the Classification of Soybean Genotypes for Primary Macronutrients’ Content Using UAV–Multispectral Sensor. Remote Sens. 2023, 15, 1457. [Google Scholar] [CrossRef]
  28. Gava, R.; Santana, D.C.; Cotrim, M.F.; Rossi, F.S.; Teodoro, L.P.R.; da Silva, C.A., Jr.; Teodoro, P.E. Soybean Cultivars Identification Using Remotely Sensed Image and Machine Learning Models. Sustainability 2022, 14, 7125. [Google Scholar] [CrossRef]
  29. Baio, F.H.R.; Santana, D.C.; Teodoro, L.P.R.; de Oliveira, I.C.; Gava, R.; de Oliveira, J.L.G.; da Silva, C.A., Jr.; Teodoro, P.E.; Shiratsuchi, L.S. Maize Yield Prediction with Machine Learning, Spectral Variables and Irrigation Management. Remote Sens. 2023, 15, 79. [Google Scholar] [CrossRef]
  30. Scott, A.J.; Knott, M. A cluster analysis method for grouping means in the analysis of variance. Biometrics 1974, 30, 507–512. [Google Scholar] [CrossRef]
  31. Team, R.C. R: A language and Environment for Statistical Computing; R Foundation for Statistical Computing: Vienna, Austria, 2013. [Google Scholar]
  32. Kycko, M.; Zagajewski, B.; Lavender, S.; Romanowska, E.; Zwijacz-Kozica, M. The impact of tourist traffic on the condition and cell structures of alpine swards. Remote Sens. 2018, 10, 220. [Google Scholar] [CrossRef]
  33. Schweiger, A.K.; Cavender-Bares, J.; Townsend, P.A.; Hobbie, S.E.; Madritch, M.D.; Wang, R.; Tilman, D.; Gamon, J.A. Plant spectral diversity integrates functional and phylogenetic components of biodiversity and predicts ecosystem function. Nat. Ecol. Evol. 2018, 2, 976–982. [Google Scholar] [CrossRef] [PubMed]
  34. Yoosefzadeh-Najafabadi, M.; Earl, H.J.; Tulpan, D.; Sulik, J.; Eskandari, M. Application of Machine Learning Algorithms in Plant Breeding: Predicting Yield From Hyperspectral Reflectance in Soybean. Front. Plant Sci. 2021, 11, 624273. [Google Scholar] [CrossRef] [PubMed]
  35. Moreira, M.A. Fundamentos Do Sensoriamento Remoto e Metodologias de Aplicação; UFV: Viçosa, Brazil, 2005. [Google Scholar]
  36. da Silva, C.A., Jr.; Teodoro, P.E.; Teodoro, L.P.R.; Della-Silva, J.L.; Shiratsuchi, L.S.; Baio, F.H.R.; Boechat, C.L.; Capristo-Silva, G.F. Is it possible to detect boron deficiency in eucalyptus using hyper and multispectral sensors? Infrared Phys. Technol. 2021, 116, 103810. [Google Scholar] [CrossRef]
  37. de Moraes, E.C. Fundamentos de Sensoriamento Remoto; INPE: São José dos Campos, Brazil, 2002; pp. 1–7.
  38. Bergamaschi, H.; Bergonci, J.I. As Plantas e o Clima: Princípios e Aplicações; Agrolivros: Guaíba, Brazil, 2017. [Google Scholar]
  39. Liu, L.; Song, B.; Zhang, S.; Liu, X. A novel principal component analysis method for the reconstruction of leaf reflectance spectra and retrieval of leaf biochemical contents. Remote Sens. 2017, 9, 1113. [Google Scholar] [CrossRef]
  40. Shimazaki, K.; Doi, M.; Assmann, S.M.; Kinoshita, T. Light regulation of stomatal movement. Annu. Rev. Plant Biol. 2007, 58, 219–247. [Google Scholar] [CrossRef] [PubMed]
  41. Assmann, S.M. Enhancement of the stomatal response to blue light by red light, reduced intercellular concentrations of CO2, and low vapor pressure differences. Plant Physiol. 1988, 87, 226–231. [Google Scholar] [CrossRef] [PubMed]
  42. Gotoh, E.; Oiwamoto, K.; Inoue, S.; Shimazaki, K.; Doi, M. Stomatal response to blue light in crassulacean acid metabolism plants Kalanchoe pinnata and Kalanchoe daigremontiana. J. Exp. Bot. 2019, 70, 1367–1374. [Google Scholar] [CrossRef] [PubMed]
  43. Terashima, I.; Fujita, T.; Inoue, T.; Chow, W.S.; Oguchi, R. Green light drives leaf photosynthesis more efficiently than red light in strong white light: Revisiting the enigmatic question of why leaves are green. Plant Cell Physiol. 2009, 50, 684–697. [Google Scholar] [CrossRef]
  44. Nishio, J.N. Why are higher plants green? Evolution of the higher plant photosynthetic pigment complement. Plant Cell Environ. 2000, 23, 539–548. [Google Scholar] [CrossRef]
  45. Smith, H.L.; McAusland, L.; Murchie, E.H. Don’t ignore the green light: Exploring diverse roles in plant processes. J. Exp. Bot. 2017, 68, 2099–2110. [Google Scholar] [CrossRef]
  46. Trojak, M.; Skowron, E.; Sobala, T.; Kocurek, M.; Pałyga, J. Effects of partial replacement of red by green light in the growth spectrum on photomorphogenesis and photosynthesis in tomato plants. Photosynth. Res. 2021, 151, 295–312. [Google Scholar] [CrossRef]
  47. Santos, L.B.; Bastos, L.M.; de Oliveira, M.F.; Soares, P.L.M.; Ciampitti, I.A.; da Silva, R.P. Identifying Nematode Damage on Soybean through Remote Sensing and Machine Learning Techniques. Agronomy 2022, 12, 2404. [Google Scholar] [CrossRef]
  48. Seelig, H.D.; Hoehn, A.; Stodieck, L.S.; Klaus, D.M.; Adams, W.W., III; Emery, W.J. The assessment of leaf water content using leaf reflectance ratios in the visible, near-, and short-wave-infrared. Int. J. Remote Sens. 2008, 29, 3701–3713. [Google Scholar] [CrossRef]
  49. Kior, A.; Sukhov, V.; Sukhova, E. Application of reflectance indices for remote sensing of plants and revealing actions of stressors. Photonics 2021, 8, 582. [Google Scholar] [CrossRef]
  50. Motomiya, A.V.D.A.; Molin, J.P.; Motomiya, W.R.; Rojo Baio, F.H. Mapeamento do índice de vegetação da diferença normalizada em lavoura de algodão. Pesqui Agropecu Trop. 2012, 42, 112–118. [Google Scholar] [CrossRef]
  51. Hatfield, J.L.; Prueger, J.H.; Sauer, T.J.; Dold, C.; O’Brien, P.; Wacha, K. Applications of vegetative indices from remote sensing to agriculture: Past and future. Inventions 2019, 4, 71. [Google Scholar] [CrossRef]
  52. Giovos, R.; Tassopoulos, D.; Kalivas, D.; Lougkos, N.; Priovolou, A. Remote sensing vegetation indices in viticulture: A critical review. Agriculture 2021, 11, 457. [Google Scholar] [CrossRef]
  53. Santana, D.C.; Teodoro, L.P.R.; Baio, F.H.R.; dos Santos, R.G.; Coradi, P.C.; Biduski, B.; da Silva, C.A., Jr.; Teodoro, P.E.; Shiratsuchi, L.S. Classification of soybean genotypes for industrial traits using UAV multispectral imagery and machine learning. Remote Sens. Appl. 2023, 29, 100919. [Google Scholar] [CrossRef]
  54. Borges, M.V.V.; Garcia, J.d.O.; Batista, T.S.; Silva, A.N.M.; Baio, F.H.R.; da Silva, C.A., Jr.; de Azevedo, G.B.; Azevedo, G.T.d.O.S.; Teodoro, L.P.R.; Teodoro, P.E. High-throughput phenotyping of two plant-size traits of Eucalyptus species using neural networks. J. For. Res. 2022, 33, 591–599. [Google Scholar] [CrossRef]
  55. Sedghi, M.; Golian, A.; Soleimani-Roodi, P.; Ahmadi, A.; Aami-Azghadi, M. Relationship between color and tannin content in sorghum grain: Application of image analysis and artificial neural network. Braz. J. Poult. Sci. 2012, 14, 57–62. [Google Scholar] [CrossRef]
  56. de Oliveira, B.R.; da Silva, A.A.P.; Teodoro, L.P.R.; de Azevedo, G.B.; Azevedo, G.T.D.O.S.; Baio, F.H.R.; Sobrinho, R.L.; da Silva, C.A., Jr.; Teodoro, P.E. Eucalyptus growth recognition using machine learning methods and spectral variables. For. Ecol. Manag. 2021, 497, 119496. [Google Scholar] [CrossRef]
  57. Mokarram, M.; Hojjati, M.; Roshan, G.; Negahban, S. Modeling the behavior of Vegetation Indices in the salt dome of Korsia in North-East of Darab, Fars, Iran. Model Earth Syst. Environ. 2015, 1, 27. [Google Scholar] [CrossRef]
Figure 1. Location of the experimental area in Chapadão do Sul-MS, Brazil. Hibryds: 50A60 (H1), ADV1221 (H2), JB1330 (H3), NTX202 (H4), RANCHEIRO (H5) and SLP20K6D (H6).
Algorithms 17 00023 g001
Figure 2. RGB-NIR map of experiment. Hybrids: 50A60 (H1), ADV1221 (H2), JB1330 (H3), NTX202 (H4), RANCHEIRO (H5) and SLP20K6D (H6).
Algorithms 17 00023 g002
Figure 3. Boxplot of the multispectral reflectance from six sorghum hybrids 50A60 (H1), ADV1221 (H2), JB1330 (H3), NTX202 (H4), RANCHEIRO (H5) and SLP20K6D (H6) at Blue (475 nm, A), Green (550 nm, B), Red (660 nm, C), Rededge (735 nm, D) and NIR (790 nm, E) wavelengths. Hybrids followed by the same letters for each wavelength do not differ by the Scott-Knott test at 5% probability
Algorithms 17 00023 g003
Figure 4. Mean values of the vegetation indices NDVI (A), NDRE (B), SAVI (C), EVI (D), GNVDI (E), IAF (F), MSAVI (G), MTVI (H), MCARI (I), and GSAVI (J) calculated for the six sorghum hybrids 50A60 (H1), ADV1221 (H2), JB1330 (H3), NTX202 (H4), RANCHEIRO (H5) and SLP20K6D (H6). Hybrids followed by the same letters for each VI do not differ by the Scott-Knott test at 5% probability.
Algorithms 17 00023 g004
Figure 5. Boxplot for the correct classification accuracy metric of the six machine learning algorithms used with three different inputs tested for each algorithm. Equal uppercase letters does not differ between the 5% probability model inputs by the Scott–Knott test. Equal lowercase letters does not differ between mL to 5% probability by scott-knott test. SB: wavelengths; VIs: vegetation indices; RL: Logistic Regression; ANN: Artificial Neural Network; SVM: Support Vector Machine; J48: decision trees J48; RF: Randon Forest; DT: REPTree.
Algorithms 17 00023 g005
Figure 6. Boxplot for the Kappa coefficient accuracy metric of the six machine learning algorithms used with three different inputs tested for each algorithm. Equal uppercase letters does not differ between the 5% probability model inputs by the Scott–Knott test. Equal lowercase letters does not differ between mL to 5% probability by scott-knott test. SB: wavelengths; VIs: vegetation indices; RL: Logistic Regression; ANN: Artificial Neural Network; SVM: Support Vector Machine; J48: decision trees J48; RF: Randon Forest; DT: REPTree.
Algorithms 17 00023 g006
Figure 7. Boxplot for the F-score coefficient accuracy metric of the six machine learning algorithms used with three different inputs tested for each algorithm. Equal uppercase letters does not differ between the 5% probability model inputs by the Scott–Knott test. Equal lowercase letters does not differ between mL to 5% probability by Scott–Knott test. SB: wavelengths; VIs: vegetation indices; RL: Logistic Regression; ANN: Artificial Neural Network; SVM: Support Vector Machine; J48: decision trees J48; RF: Randon Forest; DT: REPTree.
Algorithms 17 00023 g007
Table 1. Vegetation indices evaluated and their respective equations and references.
SiglaVegetation IndexEquationReference
NDVINormalized Difference Vegetation Indice ( R N I R R R E D ) ( R N I R + R R E D ) [18]
NDRENormalized Difference Red Edge Indice ( R N I R R E D G E ) ( R N I R + R E D G E ) [19]
SAVISoil-Adjusted Vegetation Index ( 1 + 0.5 ) R N I R R R E D R N I R + R R E D + 0.5 [20]
EVIEnhanced Vegetation Index (EVI) 2.5 × ( R N I R R R E D ) ( ( R N I R ) + C 1 × R N I R ( C 2 × R B L U E ) + 1 ) [21]
GNDVIGreen Normalized
Difference Vegetation
( R N I R R G R E E N ) ( R N I R + R G R E E N ) [22]
LAILeaf Area Index l n ( 0.69 S A V I 0.59 ) 0.91 [23]
MSAVIModified Soil Adjusted
Vegetation Index
2 R N I R + 1 ( 2 R N I R + 1 ) 2 ( 8 R N I R R R E D ) 2 [24]
MTVIModified Triangular Vegetation Index 1.5   [ 1.2 R N I R R G R E E N 2.5 R R E D R G R E E N ] ( 2 R N I R + 1 ) 2 ( 6 R N I R 5 R R E D ) 0.5 [25]
MCARIModified Chlorophyll
Absorption Ratio Index
R E D G E R R E D 0.2 R E D G E R G R E E N R E D G E R R E D [26]
Rnir: near-infrared reflectance; Rgreen: green reflectance; Rred: red reflectance; Redge: Red-edge reflectance; L: soil effect correction factor.
Table 2. Accuracy of the algorithms and their respective equations.
SiglaAccuracyEquation
CCCorrect classifications C C = ( n u m b e r   o f   c o r r e c t   p r e d i c t i o n s ) ( t o t a l   i n s t a n c e s )
KappaKappa coefficient K a p p a = ( o b s e r v e d   a g r e e m e n t a g r e e m e n t   e x p e c t e d   b y   c h a n c e ) ( 1 a g r e e m e n t   e x p e c t e d   b y   c h a n c e )
F-scoreF-score 2 × ( P r e c i s i o n × r e c a l l ) ( P r e c i s i o n + r e c a l l )
Table 3. Summary of the analysis of variance for the metrics Correct Classification (CC), Kappa and F-score.
S.V.D.F.CCKappaF-Score
ML5377.88 *0.05 *0.03 *
Input2556.7 *0.08 *0.07 *
ML × Input1045.06 *0.01 *0.01 *
Residual1624.566.660
C.V. (%) 4.56.995.95
F.V.: Source of variation; D.F.: Degrees of freedom; ML: Machine Learning; C.V.: Coefficient of variation; * significant at 5% probability by the F test
Disclaimer/Publisher’s Note: The statements, opinions and data contained in all publications are solely those of the individual author(s) and contributor(s) and not of MDPI and/or the editor(s). MDPI and/or the editor(s) disclaim responsibility for any injury to people or property resulting from any ideas, methods, instructions or products referred to in the content.

