Abstract
Selecting the appropriate temporary facilities is important for reducing cost and improving the productivity and safety of craft professionals in construction projects. However, the manual planning process for scaffolding systems is typically prone to inefficiencies. This paper aims to develop a knowledge-based framework for a scaffolding decision support system for industry. An integrated two-phase system was established, including a technical evaluation module and a knowledge-based module. First, the system identifies feasible scaffolding alternatives from the database through a rule-based algorithm. Second, a knowledge-based module was designed to assess the alternative performance. The framework effectively generated the ranking of scaffolding alternatives, and the top three influential factors were identified, including the site accessibility, protection to workers and health risk. Thus, an application study of an industrial steel project was proffered to validate the effectiveness of the framework. The proposed framework may help decision-making regarding the implementation of temporary facility planning in industry practices. It has wider applicability because it simultaneously considers site conditions, productivity, safety, and financial benefits, and is designed and implemented through a computerized path. The paper contributes to the industry by developing an integrated decision support system for temporary facilities. Additionally, the practical contribution of this research is the provision of an optimized scaffolding planning method that could be utilized as a guide when implementing the decision support system.
1. Introduction
The performance of construction projects is significantly influenced by labor crews and related resources [1,2]. Among these resources, scaffolding systems are one of the most critical temporary structures which provide essential workspace to assist task execution and further improve the overall performance in construction projects [3,4]. Multiple types of scaffolding systems, such as scissor lift, vertical lift, telescopic lift, and system scaffolding, can be applied according to the complex job conditions. Meanwhile, onsite construction activities, such as bolting and welding, require the appropriate type of scaffolding systems to support them [5]. However, selecting the optimal type and model of scaffolding is a labor-intensive planning process, which requires the assessment of a set of different quantitative and qualitative criteria. These criteria reflect construction productivity, safety, cost and other performance goals [6,7,8]. To improve planning efficiency, there is a need for an automated model to assist planners to select the appropriate type of scaffolding system. However, current planning lacks effective approaches for evaluation of massive information and data, such as technical data and knowledge. The industry still heavily relies on manual evaluation, which triggers the need for automatic decision models that would help planners to evaluate the performance of different scaffolding systems for application.
A literature review shows that a limited amount of research has been conducted on this problem. Akinci et al. [9] proposed a prototype system presenting spatial differences of three types of temporary structures, i.e., scissor lift, swing stage and tube and coupler scaffolding, considering safety and other performance objectives in order to assist scaffolding planning. Fang et al. [10] proposed a method for comparison of safety performance between two types of scaffolding: bamboo scaffolding and metal scaffolding. The results are determined through the calculation of the average accidents risk criterion. Kim and Ahn [11] developed a safety assessment system through a BIM-based approach, which was capable of identifying different types of temporary facilities and determining the location of scaffolds to enhance safety.
To consider more criteria and integrate expert knowledge into scaffolding decision practices, more effective approaches have been developed. Kim and Fischer [12] formalized a taxonomy for temporary structures and summarized the relationship between activity features and scaffolding types. This research presented a heuristic scaffolding selection process to help engineers with effective decisions. Kim et al. [13] classified scaffolding systems into eight types, and further formalized a semiautomated system, called the scaffolding planning generator (SPG), to select the appropriate type according to work conditions. The system enables selection of scaffolding based on the geometric and action features of construction activities. Considering multiple influential factors, Jackman et al. [14] compared different types of scaffolding, including tube and coupler scaffolding, frame scaffolding and system scaffolding. Factors include convenience for stock and transport, size, and weight of the scaffolding modules. Jin et al. [5] presented an automated system to assist scaffolding space planning, and multiple criteria are integrated in the planning, such as productivity, number of supported tasks and cost. The authors claimed that qualitative criteria should also be considered in scaffolding planning practices. A comprehensive framework was proposed by Fang et al. [10] for assessing and selecting scaffolding. The framework was based on the analytic hierarchy process that incorporated expert knowledge into the selection process. In this study, the scaffoldings alternatives were limited to two scaffolding types: metal scaffolding and bamboo scaffolding. Bannier et al. [15] developed seven decision trees to describe scaffolding space requirements according to in-depth interviews and developed a decision supporting model that could be applied to planning and allocating scaffolding systems based on expert knowledge. Kim et al. [16] developed a decision-making framework to create effective scaffolding plans regarding safety, cost, and duration based on quantitative evaluation and expert judgment. With supported scaffolding, tower scaffolding, suspended scaffolding and mast climber, the framework was able to select the final scaffolding plan based on expert judgements to enhance construction safety and reduce duration and cost.
As addressed previously, there are several studies in the literature that assist temporary facility planners when evaluating the performance of different scaffolding systems for the jobsite. However, decisions regarding scaffolding planning are limited to several influential factors, and the decision-making process is currently mainly based on the knowledge and experience of construction planners, rather than a systematic and automated path. Therefore, the scaffolding planning process is completed without the assistance of automatic approaches that consider a set of quantitative and qualitative criteria, so the solutions cannot be directly generated. Therefore, there is a need to develop an effective framework and robust model that can be used in actual industry practices.
Multi-criteria decision-making (MCDM) methods have been widely used in construction management [17,18,19,20,21,22]. Fayek [23] provided in-depth discussions on fuzzy hybrid techniques applied in construction, including optimization problems, multicriteria decision making, and simulation. Alshibani et al. [24] developed a methodology for the selection of mobile cranes based on an integrated approach of the analytical hierarchy process (AHP) and multi-attribute utility theory (MAUT). Mahamadu et al. [25] developed a fuzzy-TOPSIS framework for supplier selection, which can compare the competence and readiness of different firms. Alireza et al. [26] proposed a TOPSIS-based framework for selection of the construction material supply chain that enhances sustainability. Wang et al. [27] proposed a supplier selection framework based on AHP and grey relational analysis for construction projects. Zhao et al. [28] presented an AHP-based supplier selection method for a prefabrication project that prioritized the criteria and supplier alternatives. Ahmad and Thaheem [29] developed a decision-making framework to assess sustainability for residential buildings based on AHP and BIM. Mathiyazhagan et al. [30] proposed a three-phase assessment model to select material for construction through the Fuzzy Technique for Order of Preference by Similarity to Ideal Solution (TOPSIS) approach. Ahmed et al. [31] developed a TOPSIS-based framework for the selection of concrete mixture sustainability design. Amorocho and Harmann [32] proposed a framework for the selection of renovation solutions for residential buildings based on TOPSIS and applied the framework effectively in two cases.
Based on the existing multi-criteria decision-making techniques for construction projects, this paper proposes a novel framework for a knowledge-based decision-making system of scaffolding selection through fuzzy multi-criteria decision-making analysis. The main contributions to the body of knowledge are as follows: first, this study proposes a knowledge-based scaffolding decision support system that integrates two-phase simulation modules and algorithms. Two-phase simulation modules include a technical evaluation module and an alternative ranking module; the algorithms include both rule-based algorithms and the knowledge-based algorithms. Second, the developed framework compares and assesses a set of scaffolding systems through the identified criteria. The criteria include factors related to site conditions, productivity, safety, and financial factors. This enables the selection of the most effective, efficient, and safe scaffolding. Third, the proposed framework is easy to use and saves time via an automated path. Finally, the effectiveness and efficiency of the developed framework are analyzed and validated through a hypothetical steel structure project. Thus, a sensitivity analysis was conducted to validate the result robustness.
The advantages of the developed scaffolding decision support system are: (1) effectively assessing multiple scaffolding systems considering a simultaneous set of qualitative and quantitative criteria through technical evaluation and expert investigation; (2) efficiently searching among a range of scaffolding types and models stored in the database; and (3) automating the identification process of the optimal scaffolding type. In terms of a decision-making process, the developed system integrates an activity database, a technical evaluation module, and an alternative ranking module. It analyzes and assesses the performance of scaffolding systems on multiple quantitative and qualitative criteria and identifies the most appropriate scaffolding model. The developed system contributes to the body of knowledge by proposing a knowledge-based system that allows planners and users to automate the scaffolding decision-making process, integrating technical evaluation and human knowledge, reducing calculation errors, and improving the planning speed through a computerized path.
The rest of the paper is organized as follows. The framework of the proposed decision support system for scaffolding is described in Section 2. Section 3 presents a case study implementing the proposed system. The results are further discussed in Section 4. Final conclusions and future work are highlighted in Section 5.
2. Framework of an Integrated Decision Support System for Scaffolding in Construction Projects
As shown in Figure 1, this study proposes a framework to fulfill a knowledge-based decision support system to select the optimal scaffolding system type. This system consists of two main parts: data processing and simulation modules. In the data processing part, the authors establish a database to prepare and process the related construction data for further evaluation, which includes the activity data, scaffolding configuration data and the project environmental characteristics. The simulation modules include two simulation phases which were developed to select the most suitable scaffolding model based on the data obtained from the databases, as shown in Figure 1. The two modules are the technical evaluation module (Phase 1) and alternative ranking module (Phase 2), respectively. In Phase 1, the technical evaluation module was developed to initially select and generate the applicable scaffolding alternatives among the potential scaffolding types initially stored in the database through a technical qualification process. In Phase 2, the alternative ranking module further compared the feasible alternatives obtained from Phase 1 based on the integrated method of FAHP analysis and TOPSIS evaluation. In this evaluation process, a set of qualitative and quantitative criteria were taken into account, and an in-depth expert investigation was conducted to further determine the priorities of various scaffolding types and select the optimal type. Finally, a sensitivity analysis was developed to discuss the robustness and stability of the ranking results influenced by the changes of weight values. The detailed process is addressed as follows.
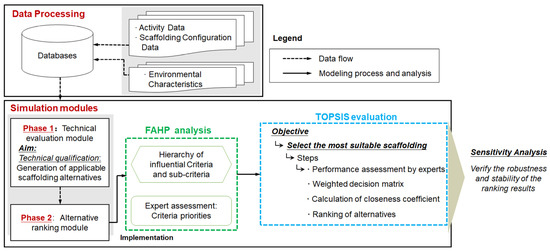
Figure 1.
Framework Architecture and data flow.
2.1. Data Processing
The system begins with the required data processing as shown in Figure 1. In this process, the related data are classified into three types of databases: (1) activity database, (2) scaffolding configuration database, and (3) environmental database.
The activity database stores the task data and workface information, such as workface coordinates, workface orientation, activity frequency, spatial relationship among workfaces, and geometric distances between structural components. Specifically, the workface coordinate (x, y, z) represents the coordinate of the workface geometric center, which are extracted from the 3D model. The workface orientation includes upward-type and forward-type. Furthermore, the activity frequency features are defined as the representation of the activity flow. Based on the action frequency, the activity features are classified into three types as shown in Figure 2: once-type actions, intermittent-type actions, and consecutive-type actions. The fourth type of data is the spatial relationship among task workfaces in the same work package, which is classified into two main types: the one-plane type and the multi-point type. In addition, the geometric distance between the structural components can be obtained from the 3D construction model, as the minimum distance significantly determines the feasible installation space of the scaffolding.
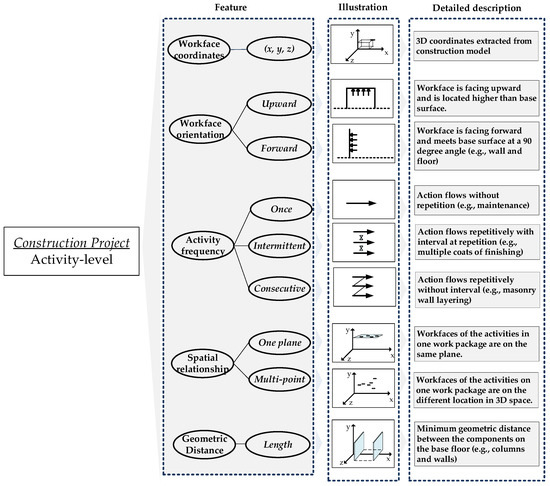
Figure 2.
Breakdown illustration of activity features.
The scaffolding configuration database includes the technical specification of the scaffolding structures, such as the maximum working height (MWH), scaffolding platform length (SPL), scaffolding platform width (SPW), raise/lower speed, drive speed-stowed, lift capacity and horizontal reach. The values of the specifications for each scaffolding type are constant, which are obtained from the technical specifications of the equipment manufacturers. The essential equipment information has been stored in the database for further rule checking, which compares the specification values of each scaffolding alternative with the values calculated for completing the task.
The environmental database involves the construction environmental characteristics, such as indoor and outdoor.
2.2. Simulation Modules
2.2.1. Technical Evaluation Module
The technical evaluation scaffolding selection module was designed and proposed to evaluate key information, including activity data and scaffolding configuration data related to multiple scaffolding types. This phase enables rule-based algorithms to select all of the feasible scaffolding from the database, as shown in Figure 3.
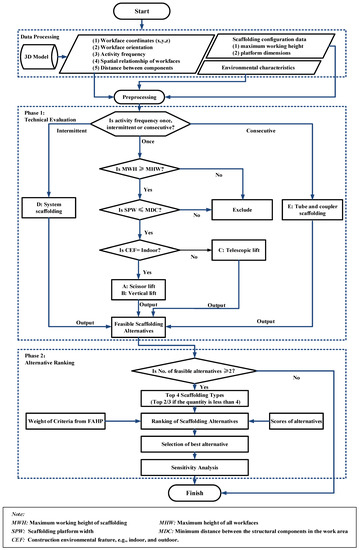
Figure 3.
Computation process of the selection system.
Specifically, the system uses technical qualification rules to carry out a number of calculations in the background, which are carried out automatically in the simulation. The calculation process identifies the types of scaffolding that are technically capable of assisting in the tasks. As illustrated in Figure 3, this involves obtaining the maximum working height of scaffolding (MWH), scaffolding platform width (SPW), maximum height of workfaces (MHW), and minimum distance of structural components (MDC). Based on the comparisons between parameters above, the system searches its database and selects technically qualified scaffolding. This searching process uses “if-then” checking rules to compare the scaffolding specification values with the required values for assisting in the tasks. To simplify the searching process, this phase has four primary parameters applied to verify the scaffolding applicability, which filters out inapplicable scaffolding. Scaffoldings that go against the “if-then” rules are excluded before the subsequent step.
In this module, applicable types of scaffolding are reviewed for their ability to effectively assist in the tasks by applying the rules. If suitable, the selection module outputs the technically feasible scaffoldings to Phase 2.
2.2.2. Phase 2: Alternative Ranking Module
In this phase, the user can compare the scaffolding alternatives obtained from Phase 1 if the number of applicable alternatives is more than two. The user manually selects the types with the lowest cost within the same manufacturing series to avoid the type with the higher performance and save operation cost.
In this phase, FAHP (Fuzzy Analytical Hierarchy Process) matrices enable the system to generate a ranking list and weights for all of the selection criteria. Then the potential alternatives are compared based on qualitative criteria, and the comparison process enables the user to rank the alternatives against each criterion. Alternatives are compared with one another using a score ranking from 1 to 10, with 1 being the lowest and 10 the highest performance. After the user has inputted the scores for each alternative, they are normalized into values ranging from 0 to 1. They are then multiplied by the weight of each criterion. Finally, the scores of alternatives are compared, and therefore reveal the most suitable scaffolding type.
Through this module, the user makes comparisons among the most applicable scaffolding systems generated from Phase 1. Phase 2 starts with the identification of influential factors for decision making and gives a detailed description of the ranking process.
The Influential Factors for Scaffolding Decision Making in Phase 2
Based on an intensive review of the literature and interviews with field experts, the scaffolding selection criteria were identified in this study. To collect data, an investigation survey was designed, and the survey forms were given to the selected experts and practitioners, who have rich working experience in the construction field. In the investigation, each of the experts compared and assessed the relative importance of each two of the criteria with a score from 1/9 (extreme vital unimportant) to 9 (extreme vital important). The relative importance values were prepared to calculate the weights of criteria in subsequent evaluations. The interviewed experts include two superintendents, two project managers, two operation managers, a safety manager, a cost manager and two scaffolding installation workers with rich working experience ranging from 8 to 16 years. The assessment criteria were categorized into four main groups and fifteen sub-criteria as shown in Figure 4. Four main criteria on the first level of hierarchy involve site conditions, productivity, safety, and financial factors, and the second level of hierarchy includes fifteen corresponding sub-criteria [10,12,16,33,34,35].
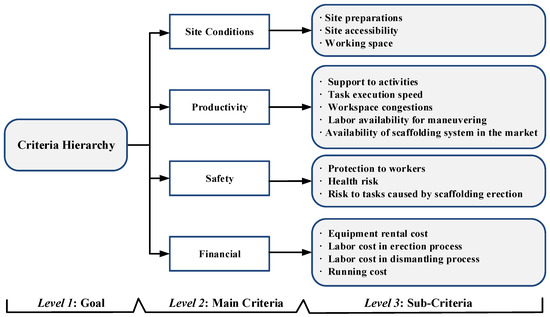
Figure 4.
Hierarchy of criteria for scaffolding selection.
Analysis Method of Fuzzy Analytical Hierarchy Processing
The AHP (analytical hierarchy processing) method was proposed by Saaty, and is a widely used approach for multi-criteria decision making problems [36,37]. In previous studies, AHP is frequently applied to determine the weights through pair-wise comparisons. The scale numbers interpret the relative importance for each pair of criteria from decision-makers’ opinions regarding the given problem. However, the actual construction decision-making process is often mixed with uncertain and ambiguous information, which AHP cannot deal with. It can be seen from Figure 4 that this involves a mix of both qualitative and quantitative criteria and sub-criteria. Under such evaluation circumstances, this research employed the FAHP method for the scaffolding selection problem, which provides an effective method to quantify parameters from imprecise and vague information [38,39,40,41]. The FAHP method is more powerful in handling the uncertainties and human judgement subjectivity that significantly affect decision results.
Therefore, the value of the criteria could be expressed through linguistic terms followed by its conversion into corresponding fuzzy numbers, and finally can be translated into crisp values. The pairwise comparison numbers can be scaled using the TFN (triangular fuzzy number) to further obtain the accurate weight of each criterion.
In fuzzy logic theory, the TFN is used to represent the vagueness of descriptions or statements in human language as real numbers that have a membership function ranging from 0 to 1. The general triangular fuzzy number is defined as follows:
where represents the left membership function of or the lowest boundary value of , and represents the right membership function of or the highest boundary value of . is termed as the middle value of . TFN can be represented as .
Based on the results of pairwise comparisons from the experts, the consistency check was performed on the comparison results from each expert, which validated the reasonability of the judgments. Then, the scores obtained from each respondent expert are averaged for value determination of criteria weights. As shown in Table 1, the scores can be transformed into triangular fuzzy numbers using the scale method in the research of Sen and Cinar [42].

Table 1.
Linguistic variables and fuzzy scales.
Steps to Proceed for FAHP-Based Module
(1) Construct the fuzzy pairwise comparison matrix.
where = 1 (if i = j) and , or (if i ≠ j).
(2) Calculate the weight matrix through normalization of the fuzzy matrix obtained from step (1).
where , and the resultant normalized fuzzy matrix is given as:
(3) Perform the consistency check. The consistency of each matrix is checked by the consistency ratio (CR). The consistency index (CI) and CR are calculated as follows:
where n represents the number of the elements in the matrix, λmax represents the principal eigenvalue, and RI represents the random index.
CI = (λmax − n)/(n − 1)
CR = CI/RI
Alternative Ranking
TOPSIS (Technique for Order Preference by Similarity to an Ideal Solution) was developed in 1981 [43]. The essential concept of the TOPSIS approach is that the alternative with the shortest distance from the ideal solution and the farthest distance from the negative-ideal solution is the best alternative [43,44]. In the TOPSIS implementation process, the normalized decision matrix is firstly computed through Equation (7).
where rij represents the normalized decision matrix, aij represents the assessment value of attribute j for alternative i, I indicates the total number of all potential alternatives, and J indicates the total number of attributes in the decision-making problem.
Then the weighted normalized decision matrix vij is calculated through Equation (8).
where wj is the normalized weight of attribute j obtained from FAHP as addressed in Section 2.2.2, and rij is the normalized decision matrix obtained from Equation (7).
The positive ideal solution (A+) and negative ideal solution (A−) are determined through Equations (9) and (10).
where A+ and A−, respectively, denote the positive ideal solution and the negative ideal solution, J1 represents the set of the benefits criteria, and J2 represents the set of cost criteria.
Then the Euclidean distance from the positive ideal solution (A+) and the negative ideal solution (A−) for each alternative can be calculated through Equations (11) and (12).
where S+ represents the distance from the maximum ideal point, and S− represents the distance from the minimum ideal point.
Finally, the closeness coefficient (CCi) for each alternative can be determined through Equation (13). The closeness coefficient reflects the relative distance of the alternative to the ideal solution. Based on the values of CCi, the ranking results are determined. The alternative with the maximum value of CCi achieves the best performance.
3. Implementation of the Proposed Framework
In this section, the methodology is applied for scaffolding selection for a maintenance jobsite relating to a steel structure. The jobsite is shown as a hypothetical 3D model as a simulation implementation case as shown in Figure 5. The goal of the simulation was to determine whether the developed framework would be effective in identifying an optimal scaffolding solution. The hypothetical jobsite involves multiple activities, and scaffolding systems are required to lift labor crews from a grade elevation to workface position at different elevations. The length of the work area is approximately 25.0 m, while the width is 20.0 m. The maximum height among all of the workfaces is 8.273 m. The 3D coordinates’ property information of the 42 workfaces on the north elevation are illustrated in Table 2. The following sections explain the application and implementation of the proposed methodology in selecting the best scaffolding system for the construction project.
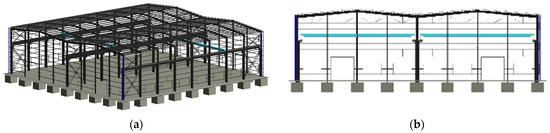
Figure 5.
3D model of the case study: (a) 3D model; (b) Side elevation.
Table 2.
Workface coordinates and properties.
The technical configuration of the scaffolding systems in the case study is shown in Table 3. The specification parameters for each scaffolding type were obtained from the technical information provided by the equipment manufacturers, which were stored in the database for rule checking in the proposed system.
Table 3.
Scaffolding specification database.
3.1. Step 1: Data Processing
According to the spatial data of the construction model in Table 2, it can be concluded that the spatial relationship among activity workfaces is the multi-point type. Additional information regarding the activity frequency is extracted from the schedule and construction model. In this case, the activity frequency is the once-type. Furthermore, the details and specifications of 24 types of scaffolding systems to be used were stored in the database of the simulation module, such as maximum platform height, capacity, and required parameters, as shown in Table 3.
3.2. Step 2: Implementation of Phase 1
The selection procedure began with a checklist provided by the planners, including the information about the project name, 3D model, workface data, and schedule, followed by a work description. Based on the checking algorithms shown in Figure 3, the module identified 13 candidate scaffolding systems that met the technical qualifications from the database. However, they involve four main types of different manufacturers, which are, respectively, Haulotte Compact, Genie GStm, Haulotte Quick-up and AMP series. Specifically, these four types are scissor lift, scissor lift, vertical lift, and vertical lift. As the rules and algorithms have been applied in Phase 1 to select the applicable types and models of scaffolding, the factor of running and rental costs for scaffolding is considered as a pre-assessment criterion within the models of the same scaffolding manufacturer for further checking in Phase 2. For example, if the module outputs three scissor lift models of the same manufacturer “Haulotte Compact” from Phase 1, the model with the lowest running and rental cost will be selected for selection in Phase 2. Therefore, the equipment models selected from the 13 identified candidate scaffoldings are Haulotte Compact 10DX, Genie GSTM-3390 RT, Haulotte Quick-up 8 and the AMP 26 model.
3.3. Step 3: Implementation of Phase 2
Phase 2 (Alternative ranking module) enables the users to determine the weight for each selected criterion. Ten respondents participated in the FAHP survey for the research. In the survey, they were asked to make pairwise comparisons between the criteria. The scaling rules for pairwise comparisons are presented in Table 1. The fuzzy evaluation matrix of the main criteria is illustrated in Table 4.
Table 4.
Fuzzy evaluation results of main criteria.
After obtaining the pairwise comparison matrix, local weights for the main criteria were calculated. As the procedure for obtaining local weights is the same for both the main criteria and sub-criteria, a sample calculation is given below for the main criteria C1–C4.
(1) Generate the geometric mean. Firstly, convert the n × n matrix to n × 1 matrix through the multiplication of as shown in Equation (13).
where A1 and A2 are two fuzzy matrixes, l1 and l2 are, respectively, the lower value in the first column of the corresponding matrix, m1 and m2 are, respectively, the middle value in the second column, and u1 and u2 are, respectively, the upper value in the third column.
(2) Then the 1/nth root of each value in the resultant matrix is calculated. For the matrix W obtained from Table 5, the root value of the first line is determined through Equation (15).
Table 5.
Global weights and ranking of criteria.
Similarly, the root value of the 2nd, 3rd and 4th line can be calculated and the results are shown.
The geometric mean for each line of matrix W is illustrated as Equations (15)–(18).
(3) Calculate the sum of each column and reciprocate the sum value.
Column_Sum(S1) = (3.156, 4.609, 6.406)
Reciprocal of S1 = (1/6.406, 1/4.609, 1/3.156) = (0.156, 0.217, 0.317)
(4) Determine the center of area (COA) for the fuzzy matrix W, and then calculate the defuzzified value for matrix W.
(5) Check the sum value (SV) of all columns. If the value of SV is larger than 1, the weight values should be normalized. For the W1 matrix, the checking process is shown in Equation (24).
SV = (0.339 + 0.230 + 0.487 + 0.119) = 1.174 > 1
As shown in Equation (8), the matrix should be normalized. Each value of matrix W1 is divided by 1.174, and the final weighted matrix for fuzzy pair-wise comparison matrix is generated as illustrated in Equation (25).
Using the same step-by-step calculation procedure, the local weights for the sub-criteria can be obtained. Then the global weight of each criterion was calculated by multiplying its local weight and the weight of the corresponding main criterion, which is summarized in Table 5.
In this phase, the respondent experts were asked to evaluate all the potential alternatives obtained from Phase 1 based on the numerical value (1–9) measurement among the sub-criteria. Therefore, the weighted normalized decision matrix is generated through Equation (7). Following the steps of the TOPSIS method, di+ (positive ideal solution) and di− (negative ideal solution) are calculated, and the separation distance of each alternative from di+ and di− is determined. The weighted normalized decision matrix and separation distance are illustrated in Table 6. The closeness coefficient (CCi) of each alternative to the ideal solution is evaluated. The results are shown in Table 7.
Table 6.
Weighted normalized decision matrix.
Table 7.
Closeness coefficient (CCi) and ranking of alternatives.
According to the results from Table 7, A2 shows super qualities that meet the requirements of assisting the tasks and ranks first. In addition, A1 and A3 have similar performance, and rank second and third, respectively.
4. Discussion
4.1. Sensitivity Analysis of Weight Changes
Since the criteria weights significantly affect the ranking results, the change in the weight value should be further evaluated. In this research, a sensitivity analysis was conducted to reveal how the ranking of alternatives changes due to the variation of criteria weights.
First, the weight value was adjusted from 1% to 500% decrease or increase. Results of the sensitivity analysis for each criterion are compared in Figure 6. In order to fix the criteria weight equal to 1, the remaining criteria must be proportionally reduced when a criterion weight increases. Therefore, the corresponding values of parameter Pt are determined through the methodology in this research. As shown in Figure 6, the results indicate that the ranking results remain stable when the sub-criteria of C24, C33, C41, C42, C43 and C44 are the main changing criteria. Meanwhile, A2 always achieves the best performance among the four alternatives, and A1 performs better than A3. Thus, A4 performs the worst in these cases.
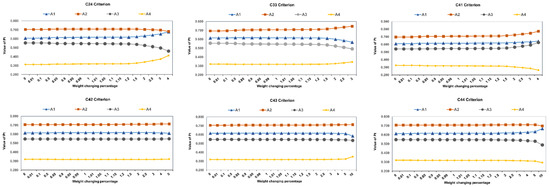
Figure 6.
Simulation results of sensitivity analysis of sub-criteria C24, C33, C41, C42, C43 and C44.
As illustrated in Figure 7, when the sub-criteria of C11, C21, C22 and C31 become the main changing criteria, respectively, the optimal alternative is still A2 in each condition. However, the ranking of the other three alternatives may change as the values of the sub-criteria change. In most cases, A1 performs better than A3 and A4. However, when the value of the main changing criterion (C11, C21 or C22) increases rapidly to 250% and with more base weight, A3 tends to achieve better than A1. On the other hand, when the value of the main changing criterion C31 increases to 200%, A3 performs worse than A4, which leads to a changing ranking result compared to the original (A2 > A1 > A3 > A4).
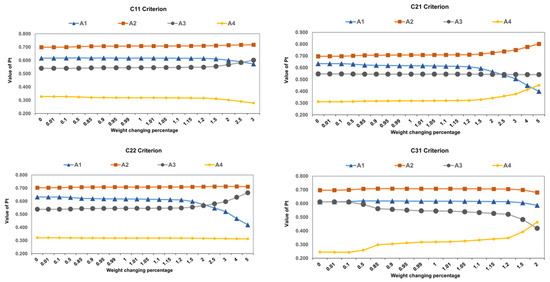
Figure 7.
Simulation results of sensitivity analysis of sub-criteria C11, C21, C22 and C31.
Figure 8 illustrates the simulation results when sub-criteria C12, C13, C25 and C32 becomes the main changing criterion, respectively. In these cases, the optimal alternative may change. In the C12 weight changing conditions, A3 performs the best when the value of the C12 criterion decreases to 1% and 10% of the base weight, and A2 is the optimal alternative in the other conditions. However, in the C13 changing conditions, A3 performs better than the other alternatives when the value of C13 increases to 250%, 300%, 400% and 500% of the base weight. Meanwhile, in the C23 changing conditions, A1 is the optimal alternative when the weight value of C23 increases to 400% and 500% of the base weight. The results illustrates that the overall ranking results significantly rely on the weight values of the sub-criteria, and therefore, the decision on optimal alternative should be determined based on the accurate analysis of the criteria weights.
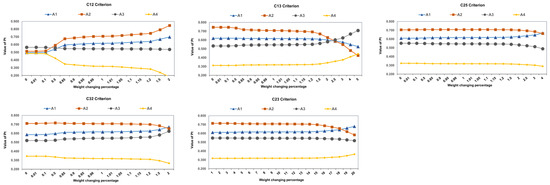
Figure 8.
Simulation results of sensitivity analysis of sub-criteria C12, C13, C25 and C23.
Therefore, the simulation results of the sensitivity analysis are summarized in Figure 9. As shown in Figure 9, the dark green bars indicate that the ranking was not changed after adjusting the criterion weight, and the light green bars indicate that the ranking has a slight change. This indicates that criteria of C41, C42, C43 and C44 have the least sensitivity, which indicates in turn that the ranking result will not change when C41, C42, C43 or C44 becomes the main changing criterion. On the other hand, the ranking results will change when the criteria weights fluctuate. Among the remaining sub-criteria, C22 has the most sensitivity, as the ranking results change rapidly in different conditions. To summarize, planners can select A3 as the optimal scaffolding plan in most conditions, and exclude A4, as it performs worst in most cases. Decision makers can also consider A1 and A3 based on the weight evaluation and further analysis. The final simulation results of the developed scaffolding planning system are proved to be effective and applicable.
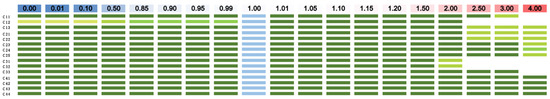
Figure 9.
Criteria sensitivity to the weight changes.
4.2. Comparisons of Different MCDM Methods
To compare the assessment results from different MCDM methods, another two methods, including the MAVT (Multi-Attribute Value Theory) and VIKOR (VIseKriterijumska Optimizacija I Kompromisno Resenje), were applied.
First, the correlation coefficient values between different methods, which indicate the degree of the ranking changes among the alternatives, were further compared. Table 8 illustrates the correlation coefficients of ranking results from each two methods. It can be concluded that there is a high level of consistency among the ranking results from three methods. Specifically, the correlation coefficient between TOPSIS and VIKOR achieved the highest value of 1.0, which indicates that the ranking results from these two methods are the same. Furthermore, TOPSIS and MAVT also achieved a high value of 0.900, which means the ranking results from MAVT have a strong correlation with TOPSIS.
Table 8.
Values of correlation coefficient.
Second, to compare the sensitivity results from three MCDM techniques, the sensitivity coefficients were also determined, which reflect the number of changes in the ranking result (single, double or more changes) when the weight of one of the criteria increases or decreases by 5 or 50%. If the ranking results are not changed, the sensitivity coefficient equals 0. If the ranking of one alternative increases and the ranking of another alternative decreases, the sensitivity coefficient equals 2. Table 9 shows the obtained values of sensitivity coefficient (SC*) when adjusting one criteria weight in different MCDM methods. Specifically, when the weight of each criterion increased or decreased by 5%, there were no changes in the ranking results using different MCDM methods. Furthermore, when the weight decreased by 50%, TOPSIS had the most significant change, and MAVT and VIKOR had a slight change in the ranking. On the other hand, when the weight increased by 50%, TOPSIS also had the most significant change and VIKOR had a slight change while MAVT showed a relatively stable ranking result. This indicates that the results from the TOPSIS method are more sensitive to the weight value changes of the criteria.
Table 9.
Sensitivity coefficient SC*.
To summarize, as there are a set of conflicting criteria in relation to site conditions, productivity, safety and financial factors, the MCDM methods have the advantage in assessing and ranking the performance of different alternatives. The results show that FAHP-TOPSIS, as well as FAHP-MAVT and FAHP-VIKOR, are effective measurement techniques for ranking the scaffolding systems. The ranking results and the sensitivity analysis from three methods show a high level of similarity among each two methods, which indicates that TOPSIS has a high accuracy in generating the optimal solution. Considering accuracy, simplicity, capability of dealing with each kind of comparison judgment, and the flexibility of the application, this paper adopted the FAHP-TOPSIS as a suitable method in the proposed decision support system regarding the scaffolding type selection problem.
5. Conclusions
The proposed framework provides a systematic and knowledge-based system for construction scaffolding decision-making problems. The developed framework not only considers multiple conflicting criteria, but also utilizes the rich knowledge of experts. Therefore, the framework presents an automated system that integrates a technical scaffolding database, expert knowledge, and the assessment criteria.
Compared with current studies and industry practices, the proposed methodology can assist construction managers and planners in selecting the optimal scaffolding type and model with low cost and improving the efficiency of construction activities through the consideration of multiple criteria, including support to activities, health risk, equipment rental cost, running cost, etc. The model also allows users to explore different scaffolding alternatives from the database to meet their needs. The system also assists planners and managers in saving costs in the renting and running of scaffolding systems.
The results and analysis in this research provide some interesting findings as follows. First, the proposed framework focuses on the decision making problem of scaffolding type and model considering both expert knowledge and technical parameters. Compared with planning practices in the industry, the developed model enables selection of the most efficient scaffolding model and achieves various conflicting objectives. Second, the results of the proposed model could achieve better performance compared with the traditional practices through the integration of two phases: multiple modules and algorithms. Third, the proposed model was also applied and validated to a case study, and the technical database can provide various alternatives for scaffolding. The results generated the optimal scaffolding alternative effectively through a computerized system. Furthermore, the developed system can be employed by project managers, scaffolding planners, engineers, and labor crews, and could also be used by scaffolding rental companies for better decision making.
In future research, the uncertainties in the expert knowledge could be further evaluated. More MCDM methods can be applied to the system to determine the best alternative, such as VIKOR and ELECTRE. With more criteria considered in the hierarchy, final decisions will be more accurate and effective.
Author Contributions
Conceptualization, methodology, software, validation, formal analysis, investigation, resources, data curation, writing—original draft preparation, writing—review and editing, visualization, supervision, project administration were made by H.J. and P.M.G. All authors have read and agreed to the published version of the manuscript.
Funding
This research was funded by Fundamental Research Funds for the Chinese Central Universities under grant number FRF-TP-20-020A1.
Data Availability Statement
The datasets used and/or analyzed during the current study are available from the corresponding author upon reasonable request.
Conflicts of Interest
The authors declare no conflict of interest.
References
- Gurmu, A.T. Preconstruction Phase Management Practices Enhancing Labor Productivity in Multistory Building Projects. J. Constr. Eng. Manag. 2023, 149, 04023032. [Google Scholar] [CrossRef]
- Raoufi, M.; Fayek, A.R. Key Moderators of the Relationship between Construction Crew Motivation and Performance. J. Constr. Eng. Manag. 2018, 144, 04018047. [Google Scholar] [CrossRef]
- Yin, Z.; Caldas, C. Scaffolding in industrial construction projects: Current practices, issues, and potential solutions. Int. J. Constr. Manag. 2022, 22, 2554–2563. [Google Scholar] [CrossRef]
- Cho, C.; Kim, K.; Park, J.; Cho, Y.K. Data-driven monitoring system for preventing the collapse of scaffolding structures. J. Constr. Eng. Manag. 2018, 144, 04018077. [Google Scholar] [CrossRef]
- Jin, H.; Nahangi, M.; Goodrum, P.M.; Yuan, Y. Multiobjective Optimization for Scaffolding Space Planning in Industrial Piping Construction Using Model-Based Simulation Programming. J. Comput. Civil. Eng. 2020, 34, 06019001. [Google Scholar] [CrossRef]
- Dogan, E.; Yurdusev, M.A.; Yildizel, S.A.; Calis, G. Investigation of scaffolding accident in a construction site: A case study analysis. Eng. Fail. Anal. 2021, 120, 105108. [Google Scholar] [CrossRef]
- Zeitzmann, J. Internal Analysis on Scaffolding; Kaefer Isoliertechnik: Bremen, Germany, 2006. [Google Scholar]
- Szóstak, M.; Hoła, B.; Bogusławski, P. Identification of accident scenarios involving scaffolding. Autom. Constr. 2021, 126, 103690. [Google Scholar] [CrossRef]
- Akinci, B.; Fischer, M.; Kunz, J.; Levitt, R. Representing work spaces generically in construction method models. J. Constr. Eng. Manag. 2002, 128, 296–305. [Google Scholar] [CrossRef]
- Fang, D.; Shen, Q.; Wu, S.; Liu, G. A comprehensive framework for assessing and selecting appropriate scaffolding based on analytic hierarchy process. J. Saf. Res. 2003, 34, 589–596. [Google Scholar] [CrossRef]
- Kim, H.; Ahn, H. Temporary facility planning of a construction project using BIM (Building Information Modeling). Comput. Civ. Eng. 2011, 627–634. [Google Scholar]
- Kim, J.; Fischer, M. Formalization of the features of activities and classification of temporary structures to support an automated temporary structure planning. Comput. Civ. Eng. 2007, 338–346. [Google Scholar]
- Kim, J.; Fischer, M.; Kunz, J.; Levitt, R. Semiautomated scaffolding planning: Development of the feature lexicon for computer application. J. Comput. Civil. Eng. 2015, 29, 04014079. [Google Scholar]
- Jackman, J.; Ogilvie, C.; Ryan, S.; Niederhauser, D. Scaffolding to Improve Reasoning Skills in Problem Formulation. In Proceedings of the 2008 Annual Conference & Exposition, Pittsburgh, PA, USA, 22–25 June 2008. [Google Scholar]
- Bannier, P.; Jin, H.; Goodrum, P.M. Modeling of work envelope requirements in the piping and steel trades and the influence of global anthropomorphic characteristics. J. Inf. Technol. Constr. 2016, 21, 292–314. [Google Scholar]
- Kim, K.; Cho, Y.K.; Kim, K. BIM-based decision-making framework for scaffolding planning. J. Manag. Eng. 2018, 34, 04018046. [Google Scholar] [CrossRef]
- Hosseini, S.A.; de la Fuente, A.; Pons, O. Multicriteria decision-making method for sustainable site location of post-disaster temporary housing in urban areas. J. Constr. Eng. Manag. 2016, 142, 04016036. [Google Scholar] [CrossRef]
- Jato-Espino, D.; Castillo-Lopez, E.; Rodriguez-Hernandez, J.; Canteras-Jordana, J.C. A review of application of multi-criteria decision making methods in construction. Autom. Constr. 2014, 45, 151–162. [Google Scholar] [CrossRef]
- Karakhan, A.A.; Rajendran, S.; Gambatese, J.; Nnaji, C. Measuring and evaluating safety maturity of construction contractors: Multicriteria decision-making approach. J. Constr. Eng. Manag. 2018, 144, 04018054. [Google Scholar] [CrossRef]
- Medineckiene, M.; Zavadskas, E.; Björk, F.; Turskis, Z. Multi-criteria decision-making system for sustainable building assessment/certification. Arch. Civ. Mech. Eng. 2015, 15, 11–18. [Google Scholar] [CrossRef]
- Tan, T.; Mills, G.; Papadonikolaki, E.; Liu, Z. Combining multi-criteria decision making (MCDM) methods with building information modelling (BIM): A review. Autom. Constr. 2021, 121, 103451. [Google Scholar]
- Zavadskas, E.K.; Antuchevičienė, J.; Kapliński, O. Multi-criteria decision making in civil engineering: Part I–a state-of-the-art survey. Eng. Struct. Technol. 2015, 7, 103–113. [Google Scholar] [CrossRef]
- Fayek, A.R. Fuzzy Logic and Fuzzy Hybrid Techniques for Construction Engineering and Management. J. Constr. Eng. Manag. 2020, 146, 04020064. [Google Scholar] [CrossRef]
- Alshibani, A.; Elassir, H.; Al-Najjar, M.; Hamida, H. AHP Based Approach for Crane Selection of Building Construction in Saudi Arabia: A Case Study. In Proceedings of the Annual Conference-Canadian Society for Civil Engineering, Montreal, QC, Canada, 12–15 June 2019. [Google Scholar]
- Mahamadu, A.-M.; Mahdjoubi, L.; Booth, C. Supplier BIM competence assessments within the cloud: A proposed Fuzzy-TOPSIS approach. BIM 2015, 149, 71–82. [Google Scholar]
- Alireza, A.F.F.; Rashidi, T.H.; Akbarnezhad, A.; Waller, S.T. BIM-enabled sustainability assessment of material supply decisions. Eng. Constr. Archit. Manag. 2017, 24, 668–695. [Google Scholar]
- Wang, T.-K.; Zhang, Q.; Chong, H.-Y.; Wang, X. Integrated supplier selection framework in a resilient construction supply chain: An approach via analytic hierarchy process (AHP) and grey relational analysis (GRA). Sustainability 2017, 9, 289. [Google Scholar] [CrossRef]
- Zhao, L.; Liu, Z.; Mbachu, J. Optimization of the supplier selection process in prefabrication using BIM. Buildings 2019, 9, 222. [Google Scholar] [CrossRef]
- Ahmad, T.; Thaheem, M.J. Economic sustainability assessment of residential buildings: A dedicated assessment framework and implications for BIM. Sustain. Cities Soc. 2018, 38, 476–491. [Google Scholar] [CrossRef]
- Mathiyazhagan, K.; Gnanavelbabu, A.; Prabhuraj, B.L. A sustainable assessment model for material selection in construction industries perspective using hybrid MCDM approaches. J. Adv. Manag. Res. 2018, 16, 234–259. [Google Scholar] [CrossRef]
- Ahmed, M.; Mallick, J.; AlQadhi, S.; Ben Kahla, N. Development of concrete mixture design process using MCDM approach for sustainable concrete quality management. Sustainability 2020, 12, 8110. [Google Scholar] [CrossRef]
- Amorocho, J.A.P.; Hartmann, T. A multi-criteria decision-making framework for residential building renovation using pairwise comparison and TOPSIS methods. J. Build. Eng. 2022, 53, 104596. [Google Scholar] [CrossRef]
- Mitropoulos, P.; Houssain, S.; Guarascio-Howard, L. Improving Productivity and Ergonomics in HVAC Installation. In Proceedings of the 49th ASC Annual International Conference Proceedings, San Luis Obispo, CA, USA, 10–13 April 2013. [Google Scholar]
- Kumar, C. Estimation and Planning Methodology for Industrial Construction Scaffolding. Master’s Thesis, University of Alberta, Edmonton, AB, Canada, 2013. [Google Scholar]
- Guo, S.J. Identification and resolution of work space conflicts in building construction. J. Constr. Eng. Manage. 2002, 128, 287–295. [Google Scholar] [CrossRef]
- Saaty, T.L. A scaling method for priorities in hierarchical structures. J. Math. Psychol. 1977, 15, 234–281. [Google Scholar] [CrossRef]
- Karayalcin, I.I. The analytic hierarchy process: Planning, priority setting, resource allocation. Eur. J. Oper. Res. 1982, 97–98. [Google Scholar] [CrossRef]
- Zadeh, L.A. Information and control. Fuzzy Sets 1965, 8, 338–353. [Google Scholar]
- Zadeh, L.A. Fuzzy logic. Computer 1988, 21, 83–93. [Google Scholar] [CrossRef]
- Rao, R.V.; Davim, J.P. A decision-making framework model for material selection using a combined multiple attribute decision-making method. Int. J. Adv. Manuf. Technol. 2008, 35, 751–760. [Google Scholar] [CrossRef]
- Mardani, A.; Jusoh, A.; Zavadskas, E.K. Fuzzy multiple criteria decision-making techniques and applications—Two decades review from 1994 to 2014. Expert Syst. Appl. 2015, 42, 4126–4148. [Google Scholar] [CrossRef]
- Sen, C.G.; Çınar, G. Evaluation and pre-allocation of operators with multiple skills: A combined fuzzy AHP and max–min approach. Expert Syst. Appl. 2010, 37, 2043–2053. [Google Scholar] [CrossRef]
- Hwang, C.L.; Yoon, K. Methods for Multiple Attribute Decision Making. In Multiple Attribute Decision Making; Springer: Berlin/Heidelberg, Germany, 1981; pp. 58–191. [Google Scholar]
- Yoon, K. System Selection by Multiple Attribute Decision Making. Ph.D. Thesis, Kansas State University, Manhatan, KS, USA, 1980. [Google Scholar]
Disclaimer/Publisher’s Note: The statements, opinions and data contained in all publications are solely those of the individual author(s) and contributor(s) and not of MDPI and/or the editor(s). MDPI and/or the editor(s) disclaim responsibility for any injury to people or property resulting from any ideas, methods, instructions or products referred to in the content. |
© 2023 by the authors. Licensee MDPI, Basel, Switzerland. This article is an open access article distributed under the terms and conditions of the Creative Commons Attribution (CC BY) license (https://creativecommons.org/licenses/by/4.0/).