Article

An Efficient Approach to Manage Natural Noises in Recommender Systems

1
College of Computer Science and Technology, Chongqing University of Posts and Telecommunications, Chongqing 400065, China
2
Key Laboratory of Data Science and Complex System Management, Chongqing University of Posts and Telecommunications, Chongqing 400065, China
3
School of Information and Communication Technology, Griffith University, Southport, QLD 4215, Australia
*
Authors to whom correspondence should be addressed.
Algorithms 2023, 16(5), 228; https://doi.org/10.3390/a16050228
Submission received: 15 February 2023 / Revised: 7 April 2023 / Accepted: 25 April 2023 / Published: 27 April 2023
(This article belongs to the Special Issue New Trends in Algorithms for Intelligent Recommendation Systems)

Abstract

:
Recommender systems search the underlying preferences of users according to their historical ratings and recommend a list of items that may be of interest to them. Rating information plays an important role in revealing the true tastes of users. However, previous research indicates that natural noises may exist in the historical ratings and mislead the recommendation results. To deal with natural noises, different methods have been proposed, such as directly removing noises, correcting noise by re-predicting, or using additional information. However, these methods introduce some new problems, such as data sparsity and introducing new sources of noise. To address the problems, we present a new approach to managing natural noises in recommendation systems. Firstly, we provide the detection criteria for natural noises based on the classifications of users and items. After the noises are detected, we correct them with threshold values weighted by probabilities. Experimental results show that the proposed method can effectively correct natural noise and greatly improve the quality of recommendations.

1. Introduction

The rapid and deep development of the internet has led to an information overload [1], and it is therefore difficult to obtain valuable information efficiently from vast amounts of data. Recommender systems [2,3,4] alleviate the problem and have achieved widespread success in numerous platforms such as Yahoo Music [5], Amazon e-commerce [6], Netflix [7], and YouTube [8]. Collaborative filtering [9,10,11], as one of the most popular recommendation techniques, plays a critical role in producing recommendations of high quality. The basic idea of collaborative filtering is to find the neighbors of the target user according to historical ratings and generate predictions by averaging the neighbors’ opinions. Therefore, ensuring the accuracy of historic ratings is very important for generating high-quality recommendations. However, some researchers have found that rating information does not always accurately reflect users’ preferences, as users are often affected by other factors when rating an item [12,13,14]. This means that noises sometimes exist in the ratings, which may mislead the decision of the recommendation algorithm and lower the performance of the recommender system. Generally, the noises in ratings are categorized into malicious noises [15,16,17,18] and natural noises [12,14,19,20,21]. Malicious noises are user ratings which are deliberately provided by some agents to mislead the recommendation algorithm and distort the recommendation results. For instance, some filmmakers may hire people to give high ratings for their films and low ratings for other films to maximize their business benefits. To address the problems caused by malicious noise, researchers present some techniques to resist attacks of malicious noise [16,17,18]. Chung et al. proposed Beta-Protection [16] to alleviate the effect of malicious noises. Xia et al. devised the segmentation approach based on a dynamic time interval [18], which can detect attacks regardless of the specific attack types. Cai and Zhu proposed the Value-Based Neighbor Selection (VNS) approach to detect shilling attacks [17].
Different from malicious noises, natural noises are often ignored in the recommender system. There are two main factors that produce natural noises: one is that preferences of users change over time; the other is that many external factors, such as personal background, social circle, mood, and environment [13], could greatly affect the evaluation of users on an item at some moments. Previous studies have revealed that the natural noises probably distort the results of recommender systems and reduce the accuracy of prediction [14]. To address the problems caused by natural noises, O’Mahony et al. [12] proposed a scheme to detect the ratings caused by natural noise and directly remove them from recommender systems. However, deleting ratings with natural noises makes the available data more sparse, while sparse rating data are not beneficial to generate high-quality recommendation results. Amatriain et al. [22] corrected the natural noises by asking users to rate items again. Pham and Jung [13] helped users to correct their own ratings by introducing an interactive recommender system. Although these two methods both improve the accuracy of recommendation, they need to collect user rating data multiple times, which increases the workload of data collection. By only utilizing rating information, some studies correct natural noises by re-predicting ratings with collaborative filtering [14,19,23,24,25]. Although this kind of method does not introduce additional information into the process of correcting natural noise, they need to execute the calculation of prediction twice, which is time-consuming. To avoid this problem, Bag et al. proposed a method that corrects natural noises with a threshold value [20].
To overcome the above problems, we present a new approach to managing natural noises in recommender systems. The proposed scheme detects natural noises according to the inconsistency between the rating behaviors and characteristics. Different from previous studies, we divide users into three subcategories: Negative, Average, and Positive. Meanwhile, items are divided into No-Preferred, Av-Preferred, and Preferred. Then, we consider the probability that each user belongs to each subcategory and correct the natural noise with threshold values weighted by probabilities. Experimental results on different datasets indicate that our scheme can effectively and efficiently manage natural noises in recommender systems. The contributions of this paper are described as follows:
  • The rules for detecting natural noises are proposed based on the subcategories of users and items. The proposed scheme detects natural noises only depending on historical ratings in the recommendation and does not introduce additional information into the recommender system.
  • In the proposed natural noise management scheme, we do not eliminate it directly but correct the natural noise with threshold values weighted by probabilities. Compared with re-predicting methods, our scheme has a much higher efficiency.
  • Experimental results on different datasets indicate that our proposed scheme performs better than previous typical methods. It has high potential to be used as a scheme for managing natural noises and provides a great decision support for recommender systems.
The remaining parts of this paper are organized as follows. Section 2 introduces the related works. Section 3 describes the proposed method of detecting and correcting natural noises in the ratings. Section 4 analyzes the performance of the proposed scheme on three datasets. The conclusion is drawn in Section 5.

2. Related Work

In any recommender system, the main types of malicious noises are product push and product nuke attacks [12]. These attacks are generally associated with user profiles. Many methods have been proposed to detect these attacks [16,17,18]. The basic idea of these methods is to examine each user’s rating behavior to judge whether a particular user profile is a security threat to the recommender system. However, with regards to natural noises, it is difficult to detect them due to their unintentionality, diversity, and quantification [26]. Compared with the case of malicious noises, studies on detecting natural noises are less explored.
To detect natural noises, O’Mahony et al. [12] employed the mean absolute error to measure the consistency between the actual ratings and the predicted ratings. If the error is larger than a threshold value, the ratings will be regarded as natural noises. Li et al. [26] devised another method to detect noisy ratings. Their method is based on the assumption that the ratings from a given user on similar items should have similar values. Based on this assumption, the self-contradiction capturing method is proposed. When the natural noises are found, the noisy rating is removed directly. In this way, the data sparsity problem is made more serious, and the performance of recommender systems may be affected.
To avoid the data sparsity problem, some researchers aim to correct the natural noises rather than remove them directly. Amatriain et al. [22] modified noisy ratings by re-rating (i.e., requiring users to rate the items again). Pham and Jung [13] corrected the natural noises by introducing an interactive recommender system. They focus on the phenomenon that users may commit some mistakes when rating items. Once the user make a mistake, the interactive recommender system will remind them to correct the ratings. However, the cost of requiring users to rate items again or creating an interactive recommender system is very high. Moreover, the methods in [13,22] may introduce additional information into the recommender system. These additional information themselves contain uncertainty and do not correct natural noises completely.
Different from the previous work, Toledo et al. [14] modified natural noises by predicting a new value using collaborative filtering. If the difference between the noisy rating and its new rating is larger than a threshold value, the noisy rating will be replaced by the new rating. So, this scheme improves the recommendation quality. Yera et al. [23] incorporated a fuzzy model with re-predicting to correct natural noises. Castro et al. applied the re-predicting technique to group recommender systems [19,25]. Choudhary et al. introduced the re-predicting method into multi-criteria recommender systems [24]. Although these re-predicting methods achieve some success in managing noise, they are still time-consuming. To achieve high efficiency, Bag et al. [20] adopted a threshold value to correct natural noises, which is a promising method for managing natural noises. Table 1 summarizes the main methods for dealing with natural noises.
To overcome the drawbacks of the existing methods, we present an alternative approach to managing natural noises in recommender systems. Different from the existing methods, we group users into three subcategories: Negative, Average, and Positive. Similarly, items are divided into No-Preferred, Av-Preferred, and Preferred. Then, we consider the probability that a user belongs to each subcategory and correct the natural noise with threshold values weighted by probabilities. Experimental results on some real datasets indicate that our proposed scheme presents a significant improvement on managing natural noises.

3. The Proposed Approach of Managing Natural Noises

In recommender systems, the prediction results usually depend on the historical ratings provided by users. It is generally assumed that the ratings can accurately reveal users’ opinions on items. However, in fact, the ratings are often influenced by some accidental factors, such as the mood, environment, and evaluations provided by friends. This means that the ratings affected by accidental factors cannot represent the real intention of users and probably have some negative effects on recommendations. These ratings are regarded as natural noise. To deal with natural noises, we first need to detect whether they exist in a rating and then correct them.

3.1. Detection of Natural Noise

In our scheme, the basic idea is to search for inconsistencies between users’ characteristics and their rating behaviors. In this regard, we divide ratings into three classes (i.e., representing users’ rating behaviors) and also classify users and items into different subcategories (i.e., representing users’ characteristics). Based on these classifications, we present the details of inconsistency detection in the following.

3.1.1. The Classification of Ratings

In order to detect natural noise, we first divide the ratings into three classes, i.e., low ratings, medium ratings, and high ratings. To precisely describe these three types of ratings, two thresholds k and v are defined as
k = min R + r o u n d 1 3 × ( max R min R ) ,
v = max R r o u n d 1 3 × ( max R min R ) ,
where max R and min R are the maximum and the minimum value for all possible ratings, respectively, and the function round(x) returns the nearest integer value to x. The threshold k is used to differentiate low ratings and middle ratings, and the threshold v is used to differentiate middle ratings and high ratings. That said, the ratings smaller than k are defined as low ratings, the ratings larger than v are defined as high ratings, and the ratings between k and v are defined as medium ratings.

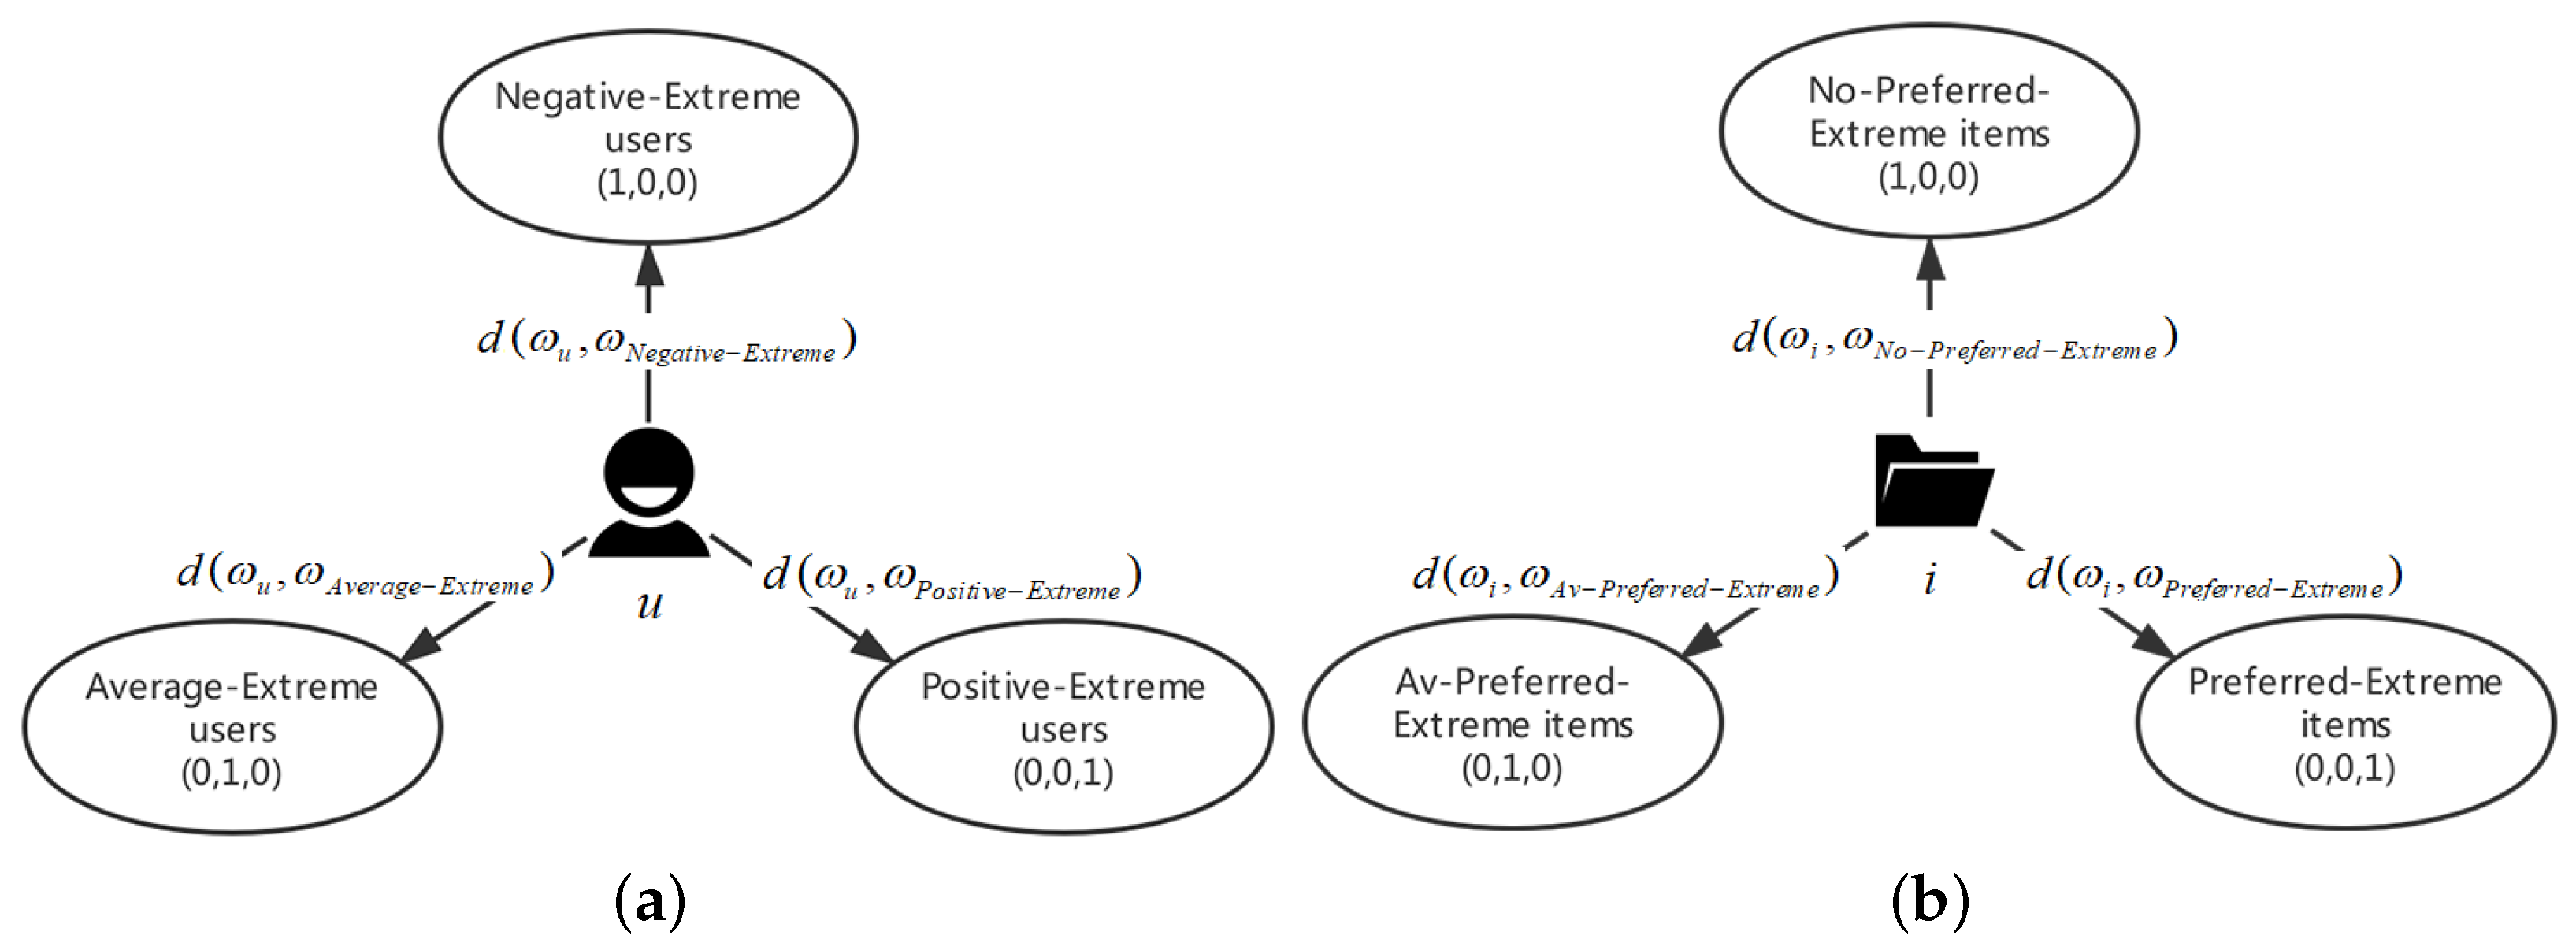
3.1.2. The Subcategories of Users and Items

For a given user u, the percentages of low, medium, and high ratings among all historical ratings can be calculated as follows:
x u = UR low | UR | , y u = UR middle | UR | , z u = UR high | UR | ,
where U R denotes the set of all ratings provided by user u, and U R l o w , U R m i d d l e , and U R h i g h are the subsets of U R , which consist of low ratings, medium ratings, and high ratings as given by Equations (1) and (2). The function · returns the number of elements in a set. Based on this, we use the triple ω u = ( x u , y u , z u ) to describe the trend of how user u rates items.
Similarly, the triple ω i = ( x i , y i , z i ) is used to describe the tendency of how item i obtains ratings from users. Here, x i , y i , and z i are the corresponding percentages of low ratings, medium ratings, and high ratings of all the ratings of item i, which are calculated as
x i = IR low | IR | , y i = IR middle | IR | , z i = IR high | IR | ,
where I R denotes the set of all ratings on item i, and I R l o w , I R m i d d l e , and I R h i g h are the subsets of I R that consist of low ratings, medium ratings, and high ratings, respectively.
According to Equation (3), we define three kinds of special virtual users, i.e., Negative-Extreme user, Average-Extreme user, and Positive-Extreme user. A Negative-Extreme user is a virtual user who only gives low ratings for all items, i.e., x u = 1 , y u = 0 , z u = 0 . Similarly, an Average-Extreme user is a user whose x u = 0 , y u = 1 , z u = 0 , and a Positive-Extreme user is a user whose x u = 0 , y u = 0 , z u = 1 . For items, according to Equation (4), we define three kinds of special virtual items, i.e., No-Preferred-Extreme item ( x i = 1 , y i = 0 , z i = 0 ), Av-Preferred-Extreme item ( x i = 0 , y i = 1 , z i = 0 ), and Preferred-Extreme item ( x i = 0 , y i = 0 , z i = 1 ). Table 2 lists these special virtual users and items.
Here, the virtual users and items in Table 2 are used as criteria for classifying users and items into subcategories. For a given user u, we determine which subcategory user u should belong to by calculating the distances from u to the Negative-Extreme user, the Average-Extreme user, and the Positive-Extreme user. The distance between two triples ω 1 = x 1 , y 1 , z 1 and ω 2 = x 2 , y 2 , z 2 is defined by
d ω 1 , ω 2 = ( x 2 x 1 ) 2 + ( y 2 y 1 ) 2 + ( z 2 z 1 ) 2 .
With Equation (5), we can compute the distances between user u and the three kinds of users. For a given item i, the distances between i and the three kinds of items can also be calculated with Equation (5). Figure 1a illustrates the distances from user u to the three kinds of users given in Table 2. According to the three distances in Figure 1a, we divide users into three subcategories: Negative, Average, and Positive. The rules of classifying users are as follows:
  • If d ( ω u , ω N e g a t i v e E x t r e m e ) is the minimum value among d ( ω u , ω N e g a t i v e E x t r e m e ) , d( ω u , ω A v e r a g e E x t r e m e ) and d ( ω u , ω P o s i t i v e E x t r e m e ) , the user u is regarded as a Negative user;
  • If d ( ω u , ω A v e r a g e E x t r e m e ) is the minimum value among d ( ω u , ω N e g a t i v e E x t r e m e ) , d( ω u , ω A v e r a g e E x t r e m e ) and d ( ω u , ω P o s i t i v e E x t r e m e ) , the user u is regarded as an Average user;
  • If d ( ω u , ω P o s i t i v e E x t r e m e ) is the minimum value among d ( ω u , ω N e g a t i v e E x t r e m e ) , d( ω u , ω A v e r a g e E x t r e m e ) and d ( ω u , ω P o s i t i v e E x t r e m e ) , the user u is regarded as a Positive user.
Here, Negative users are fastidious and tend to rate items with low ratings. Positive users are the opposite of negative users. They are generous and tend to provide items with high ratings. Average users like to offer medium ratings to items.
Similarly, Figure 1b illustrates the three distances from item i to the three kinds of items given in Table 2. We classify items into three subcategories: No-Preferred, Av-Preferred, and Preferred. The rules of classifying items are as follows:
  • If d ( ω i , ω N o P r e f e r r e d E x t r e m e ) is the minimum value among d ( ω i , ω N o P r e f e r r e d E x t r e m e ) , d ( ω i , ω A v P r e f e r r e d E x t r e m e ) and d ( ω i , ω P r e f e r r e d E x t r e m e ) , the item i is regarded as a No-Preferred item;
  • If d ( ω i , ω A v P r e f e r r e d E x t r e m e ) is the minimum value among d ( ω i , ω N o P r e f e r r e d E x t r e m e ) , d ( ω i , ω A v P r e f e r r e d E x t r e m e ) and d ( ω i , ω P r e f e r r e d E x t r e m e ) , the item i is regarded as a Av-Preferred item;
  • If d ( ω i , ω P r e f e r r e d E x t r e m e ) is the minimum value among d ( ω i , ω N o P r e f e r r e d E x t r e m e ) , d ( ω i , ω A v P r e f e r r e d E x t r e m e ) and d ( ω i , ω P r e f e r r e d E x t r e m e ) , the item i is regarded as a Preferred item.
Here, No-Preferred items are more likely to get low ratings from users. On the contrary, most users will offer high ratings to Preferred items. In the case of Av-Preferred items, they tend to get medium ratings.
Based on above rules, the subcategories of users and items are summarized in Table 3.
Remark 1. 
If there are two or more than two minimum values, this user (or this item) is neglected, and we do not classify it as any subcategory.

3.1.3. The Rules of Detecting Natural Noise

After classifying users and items, we can make the following judgment. The ratings of Negative users on No-Preferred items should be low. If Negative users provide medium or high ratings on No-Preferred items, the ratings will be regarded as natural noises. Similarly, if the ratings of Average users on Av-Preferred items are low ratings or high ratings, the ratings are also natural noises. The ratings of Positive users on Preferred items will be considered natural noises if they are low or medium ratings. Table 4 summarizes the rules for detecting natural noises.

3.2. Correction of the Natural Noise

After detecting the natural noise in ratings, we design a method to correct it according to the characteristics of the user. As we know, positive users are most likely to provide high ratings to Preferred items, but there still exists the possibility that they provide items with low or medium ratings. Thus, we correct the natural noise with threshold values weighted by probabilities. The details of our scheme are as follows.
Firstly, we calculate the probabilities that user u belongs to the three subcategories of users, i.e., p ( u Negative ) , p ( u Average ) , and p ( u Positive ) . Since the probabilities are correlated to the distance given by Equation (5), they are defined as
p ( u Negative ) = φ ( u , Negative ) φ ( u , Negative ) + φ ( u , Average ) + φ ( u , Positive ) ,
p ( u Average ) = φ ( u , Average ) φ ( u , Negative ) + φ ( u , Average ) + φ ( u , Positive ) ,
p ( u Positive ) = φ ( u , Positive ) φ ( u , Negative ) + φ ( u , Average ) + φ ( u , Positive ) ,
where φ ( u , Negative ) = 1 d ω u , ω Negative Extreme , φ ( u , Average ) = 1 d ω u , ω Average Extreme and φ ( u , Positive ) = 1 d ω u , ω Positive Extreme .
Secondly, we calculate the probabilities that item i belongs to the three subcategories of items. The corresponding probabilities are denoted as p ( i No Preferred ) , p ( i Av Preferred ) , and p ( i Preferred ) , which are obtained by
p ( i No Preferred ) = φ ( i , No Preferred ) φ ( i , No Preferred ) + φ ( i , Av Preferred ) + φ ( i , Preferred ) ,
p ( i Av Preferred ) = φ ( i , Av Preferred ) φ ( i , No Preferred ) + φ ( i , Av Preferred ) + φ ( i , Preferred ) ,
p ( i Preferred ) = φ ( i , Preferred ) φ ( i , No Preferred ) + φ ( i , Av Preferred ) + φ ( i , Preferred ) .
where φ ( i , No Preferred ) = 1 d ω i , ω No Preferred Extreme , φ ( i , Av Preferred ) = 1 d ω i , ω Av Preferred Extreme and φ ( i , Preferred ) = 1 d ω i , ω Preferred Extreme .
Thirdly, based on the probabilities of users and items, we calculate the probabilities that user u gives low ratings, medium ratings, and high ratings to item i as
p ( r u i k ) = π ( r u i k ) π ( r u i k ) + π ( k < r u i < v ) + π ( r u i v ) ,
p ( k < r u i < v ) = π ( k < r u i < v ) π ( r u i k ) + π ( k < r u i < v ) + π ( r u i v ) ,
p ( r u i v ) = π ( r u i v ) π ( r u i k ) + π ( k < r u i < v ) + π ( r u i v ) .
where r u i is the value rated by user u on item i, π ( r u i k ) = p ( u Negative ) × p ( i No Preferred ) , π ( k < r u i < v ) = p ( u Average ) × p ( i Av Preferred ) and π ( r u i v ) = p ( u positive ) × p ( i Preferred ) .
Finally, the proposed rules to correct the natural noise in ratings are as follows:
1.
For the rating of a No-Preferred item from Negative users, the correction strategy is as follows:
  • If the score is a low rating, keep it unchanged;
  • If the score is a medium rating, it is corrected by
    r u i = k × p ( r u i k ) + r u i × p ( k < r u i < v ) + v × p r u i v ;
  • If the score is a high rating, it is corrected by
    r u i = k × p ( r u i k ) + k + v 2 × p ( k < r u i < v ) + r u i × p r u i v .
2.
For the rating of an Av-Preferred item from Average users, the correction strategy is as follows:
  • If the score is a low rating, it is corrected by
    r u i = r u i × p ( r u i k ) + k + v 2 × p ( k < r u i < v ) + v × p ( r u i v ) ;
  • If the score is a medium rating, keep it unchanged;
  • If the score is a high rating, it is corrected by Equation (16).
3.
For the rating of a Preferred item from Positive users, the correction strategy is as follows:
  • If the score is a low rating, it is corrected by Equation (17);
  • If the score is a medium rating, it is corrected by Equation (15);
  • If the score is a high rating, keep it unchanged.

4. Experimental Analyses

4.1. Evaluation Metrics

The quality of recommendation algorithms is generally evaluated based on the predictive accuracy and the recommendation accuracy [27]. The former computes the errors between predicted ratings and actual ratings. Hence, the smaller the values are, the higher the accuracy is. The classical metrics are the Mean Absolute Error ( M A E ) and Root Mean Square Error ( R M S E ), which are given by
M A E = ( u , i ) T | r u i p u i | | T | ,
R M S E = ( u , i ) T ( r u i p u i ) 2 | T | ,
where T is the set of predicted ratings and p u i represents the predicted rating of user u on item i.
For the recommendation accuracy, P r e c i s i o n , R e c a l l , and F 1 value are three typical metrics. P r e c i s i o n refers to the proportion of successful recommended items in all recommended items. R e c a l l is the proportion of successful recommended items in all items that users really like. F 1 value is the comprehensive value of P r e c i s i o n and R e c a l l .

4.2. Datasets

To assess the quality of the proposed scheme, we use three benchmark datasets Movielens-100K [28], Yahoo Music [29], and Epinions [30]. Movielens-100K is collected by GroupLens Research and contains a huge amount of rating information about movies. Yahoo Music is a dataset of ratings on music. Epinions is a website that collects large numbers of products and their ratings from users. In our experiments, we select users who rate at least 20 items as the final datasets. Each dataset is divided into two parts with the ratio of 80%:20%. The 80% part is used as the training set and the other part is used as the test set. More details about the experiment datasets are shown in Table 5.

4.3. Experimental Results in Similarity Based Models

The similarity-based model is one kind of classic model and has been widely used in recommendations due to its effectiveness. Here, we use the commonly used Pearson Correlation Coefficient (PCC) [31] as the test benchmark. The predictive value of user u on item i is calculated according to the following typical prediction formula [31]:
p u i = r ¯ u + u N ( u ) s i m P C C ( u , v ) ( r v i r ¯ v ) u N ( u ) | s i m P C C ( u , v ) | ,
where N ( u ) is the neighbor set of u, and r ¯ u and r ¯ v are the average rating value of user u and user v, respectively. Except for our schemes, some other schemes on managing natural noises [14,20] are also considered. Toledo et al. [14] suggested to replace the noises with the re-predicted values. Bag et al. [20] suggested to directly correct noises with a threshold value. We also compare our scheme with these two schemes. The tested schemes in experiments are shown in Table 6.

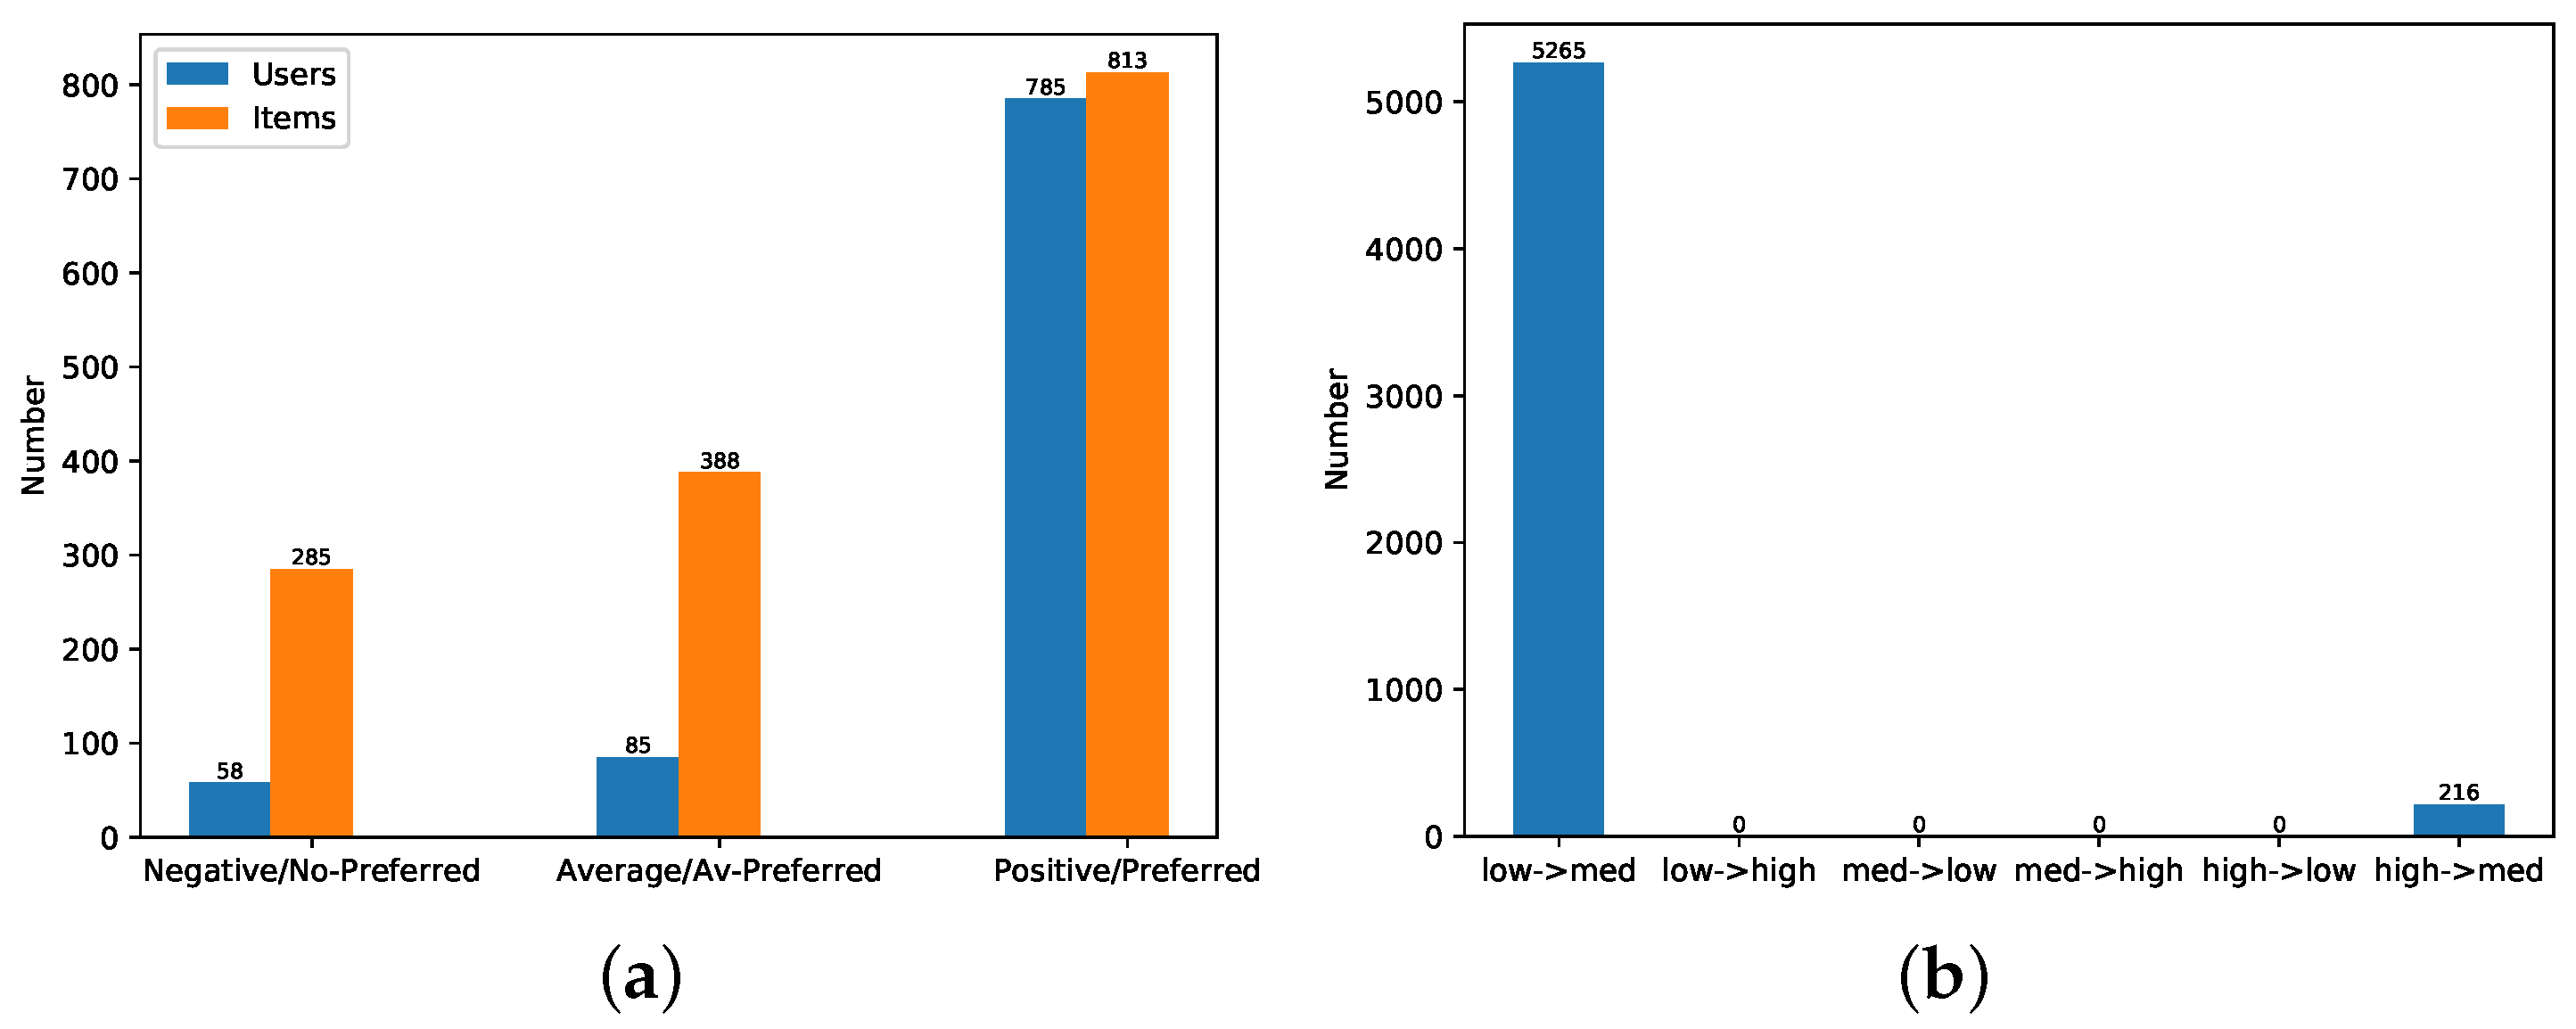
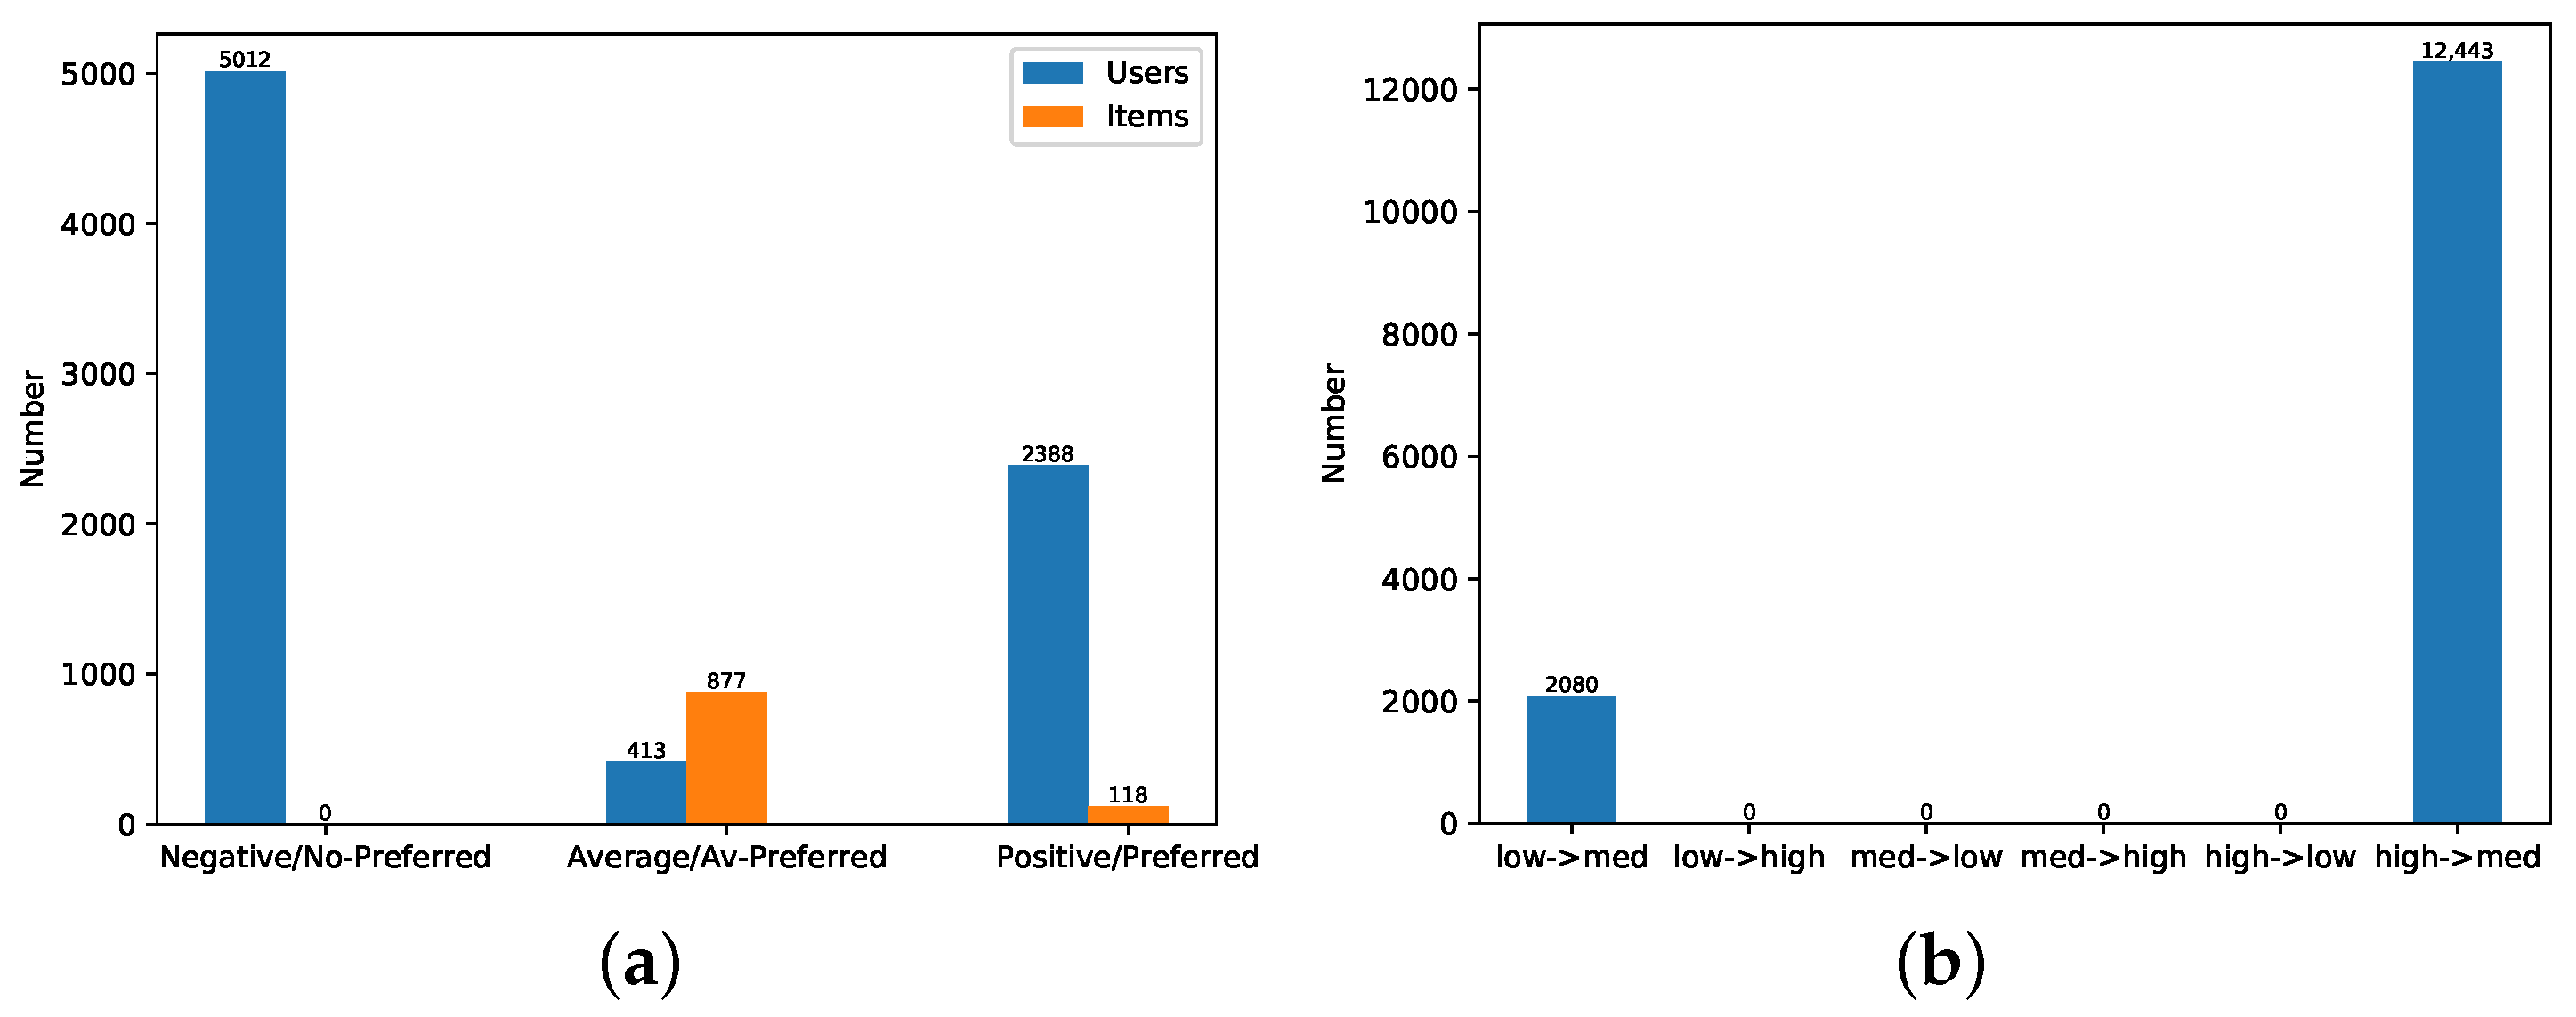
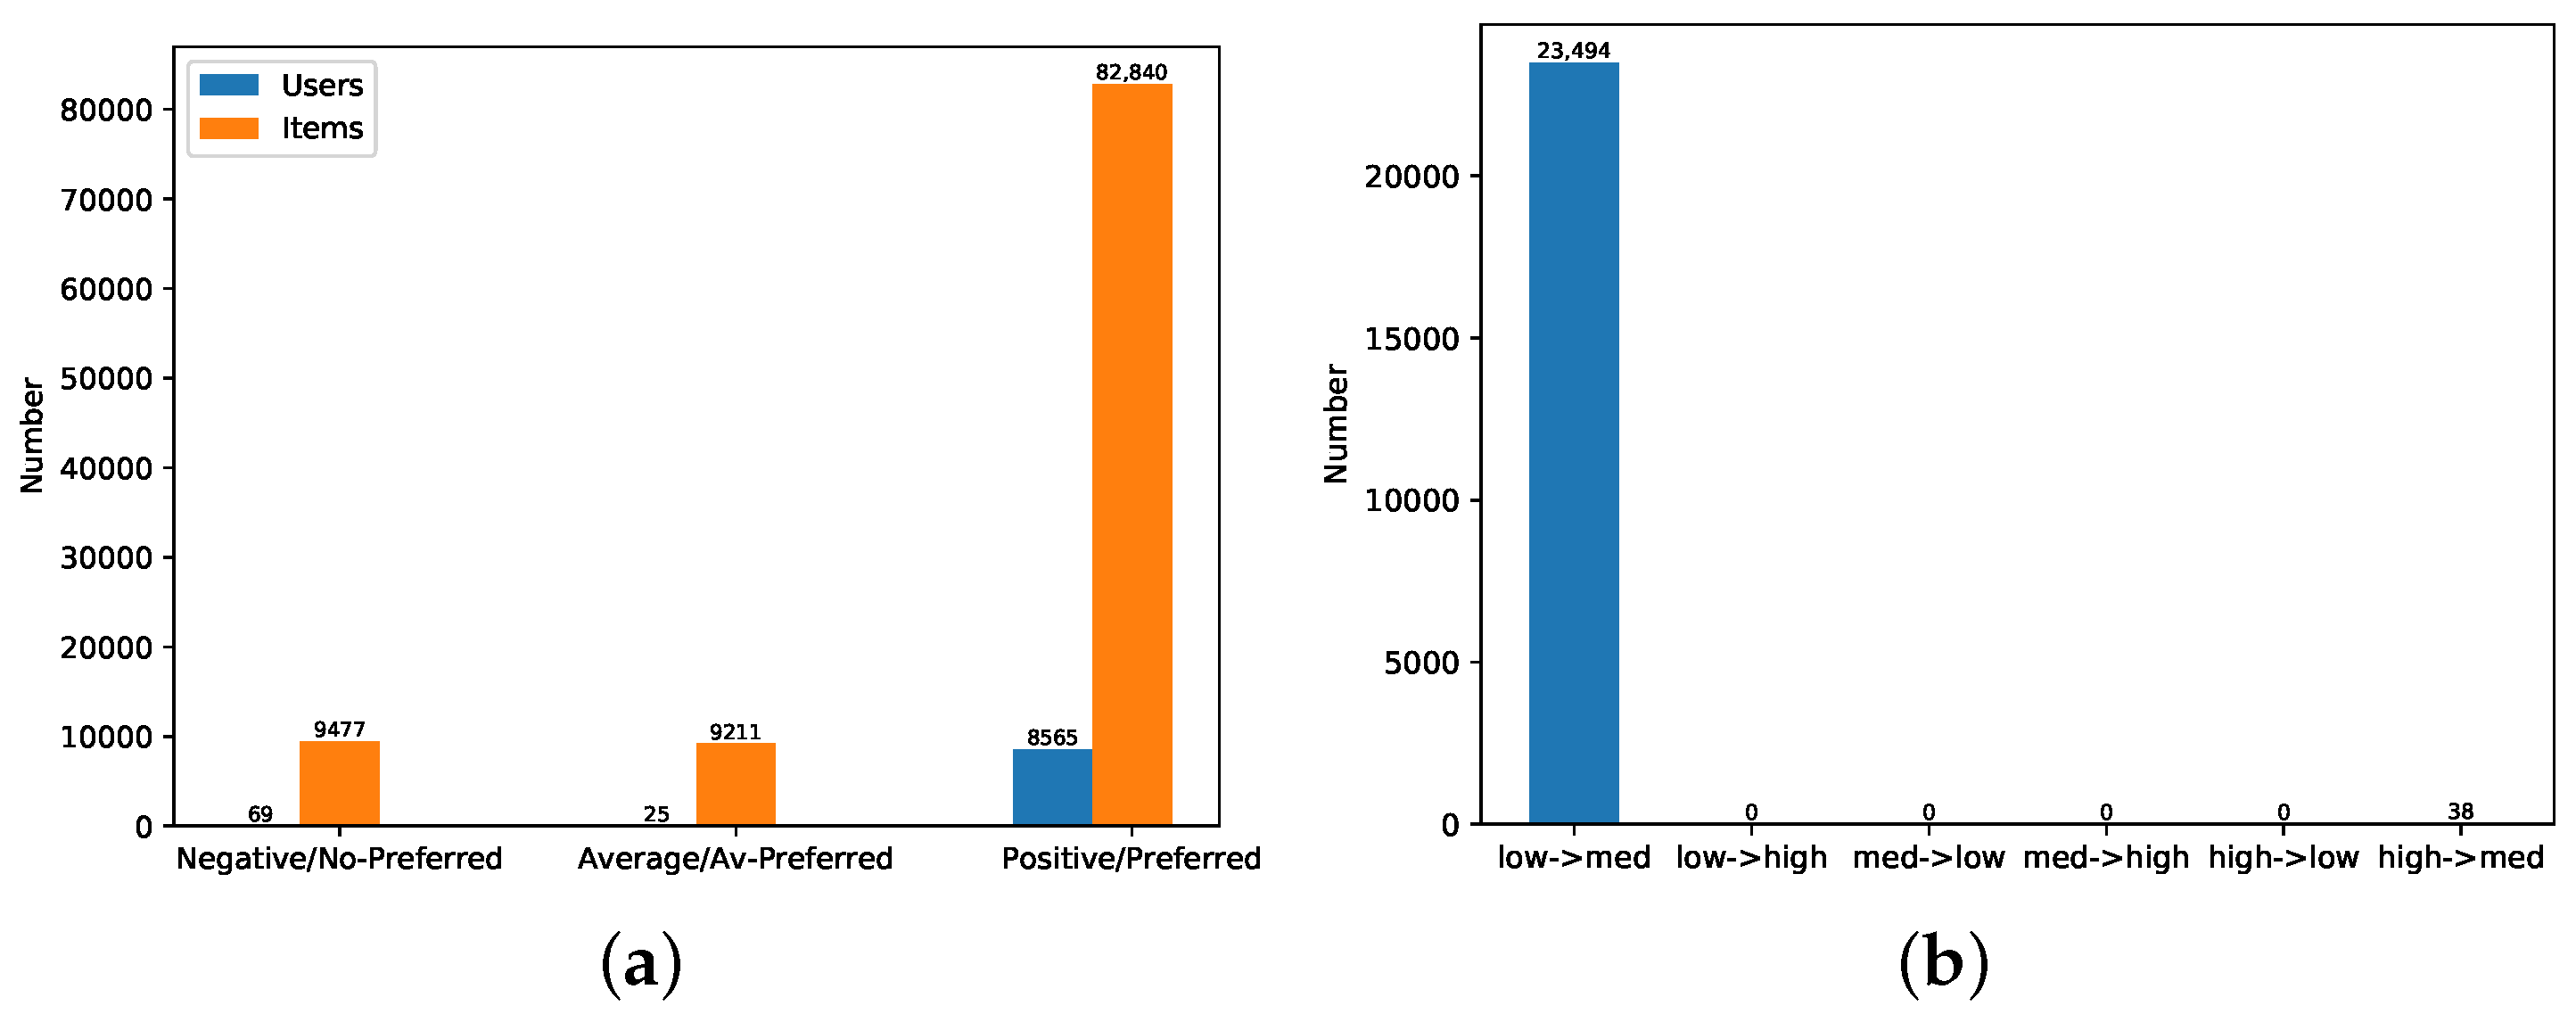
4.3.1. Correction of Natural Noises

According to the rules in Section 3.1.1, the users are divided into three subcategories: Negative, Average, and Positive. The items are also divided in three subcategories: No-Preferred, Av-Preferred, and Preferred. Figure 2a shows the results of the classifications of users and items in the dataset Movielens-100K. There are 58 Negative users, 85 Average users, and 785 Positive users in the training dataset. Meanwhile, the numbers of No-Preferred items, Av-Preferred items, and Preferred items are 285, 388, and 813, respectively. Based on the proposed rules for detecting and correcting natural noise, the natural noises are found in 6.85% of ratings (i.e., 5481 ratings). Figure 2b illustrates the corrections for natural noise in the Movielens-100K dataset. Among the 5481 ratings, 5265 ratings are corrected from low ratings to medium ratings, and 216 ratings are corrected from high ratings to medium ratings.
Figure 3a shows the classification of users and items in the dataset Yahoo Music. In the user set, 5012 users are the Negative users, 413 users are the Average users, and 2388 users are the Positive users. Moreover, no items are regarded as No-Preferred items. In total, 877 items are regarded as Av-Preferred items, and 118 items are regarded as Preferred items. Figure 3b shows the details of correcting natural noises in the dataset Yahoo Music. About 16.72% of ratings (i.e., 14,523 ratings) are affected by the natural noise. With our method, 2080 low ratings are corrected as medium ratings, and 12,443 high ratings are corrected as medium ratings.
The classification results for the users and the items in the dataset Epinions are shown in Figure 4a. The numbers of Negative users, Average users, and Positive users are 69, 25, and 8565, respectively. Correspondingly, the numbers of No-Preferred items, Av-Preferred items, and Preferred items are 9477, 9211, and 82,840. Figure 4b shows the results of correcting natural noises. About 6.09% of ratings (i.e., 23,532 ratings) are considered to be affected by natural noises. Here, 23,494 low ratings and 38 high ratings are corrected as medium ratings.

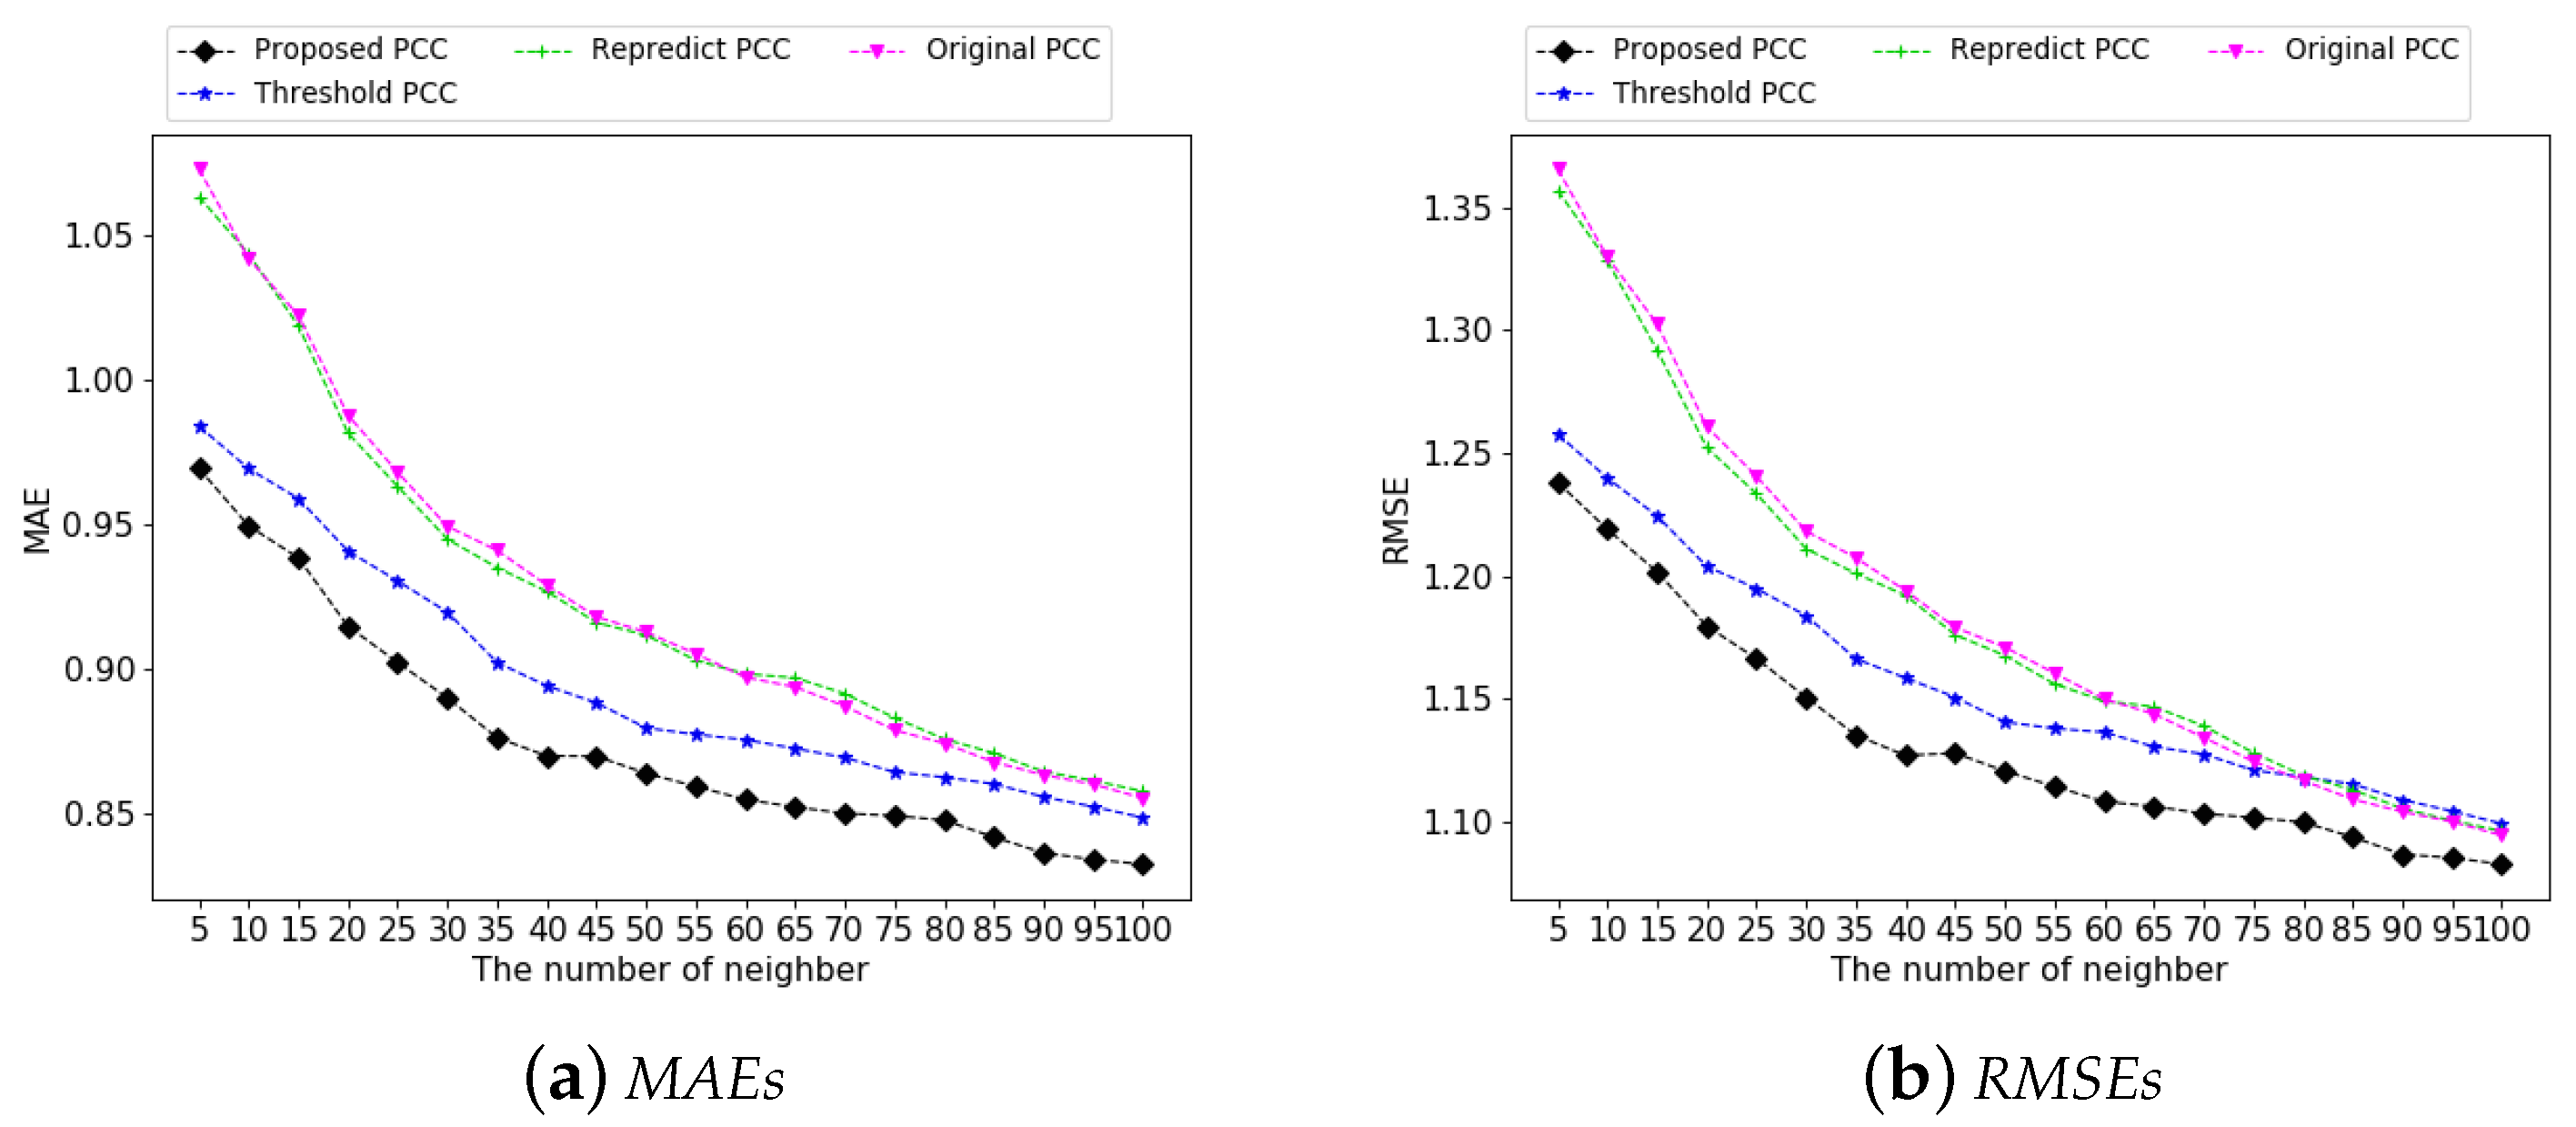
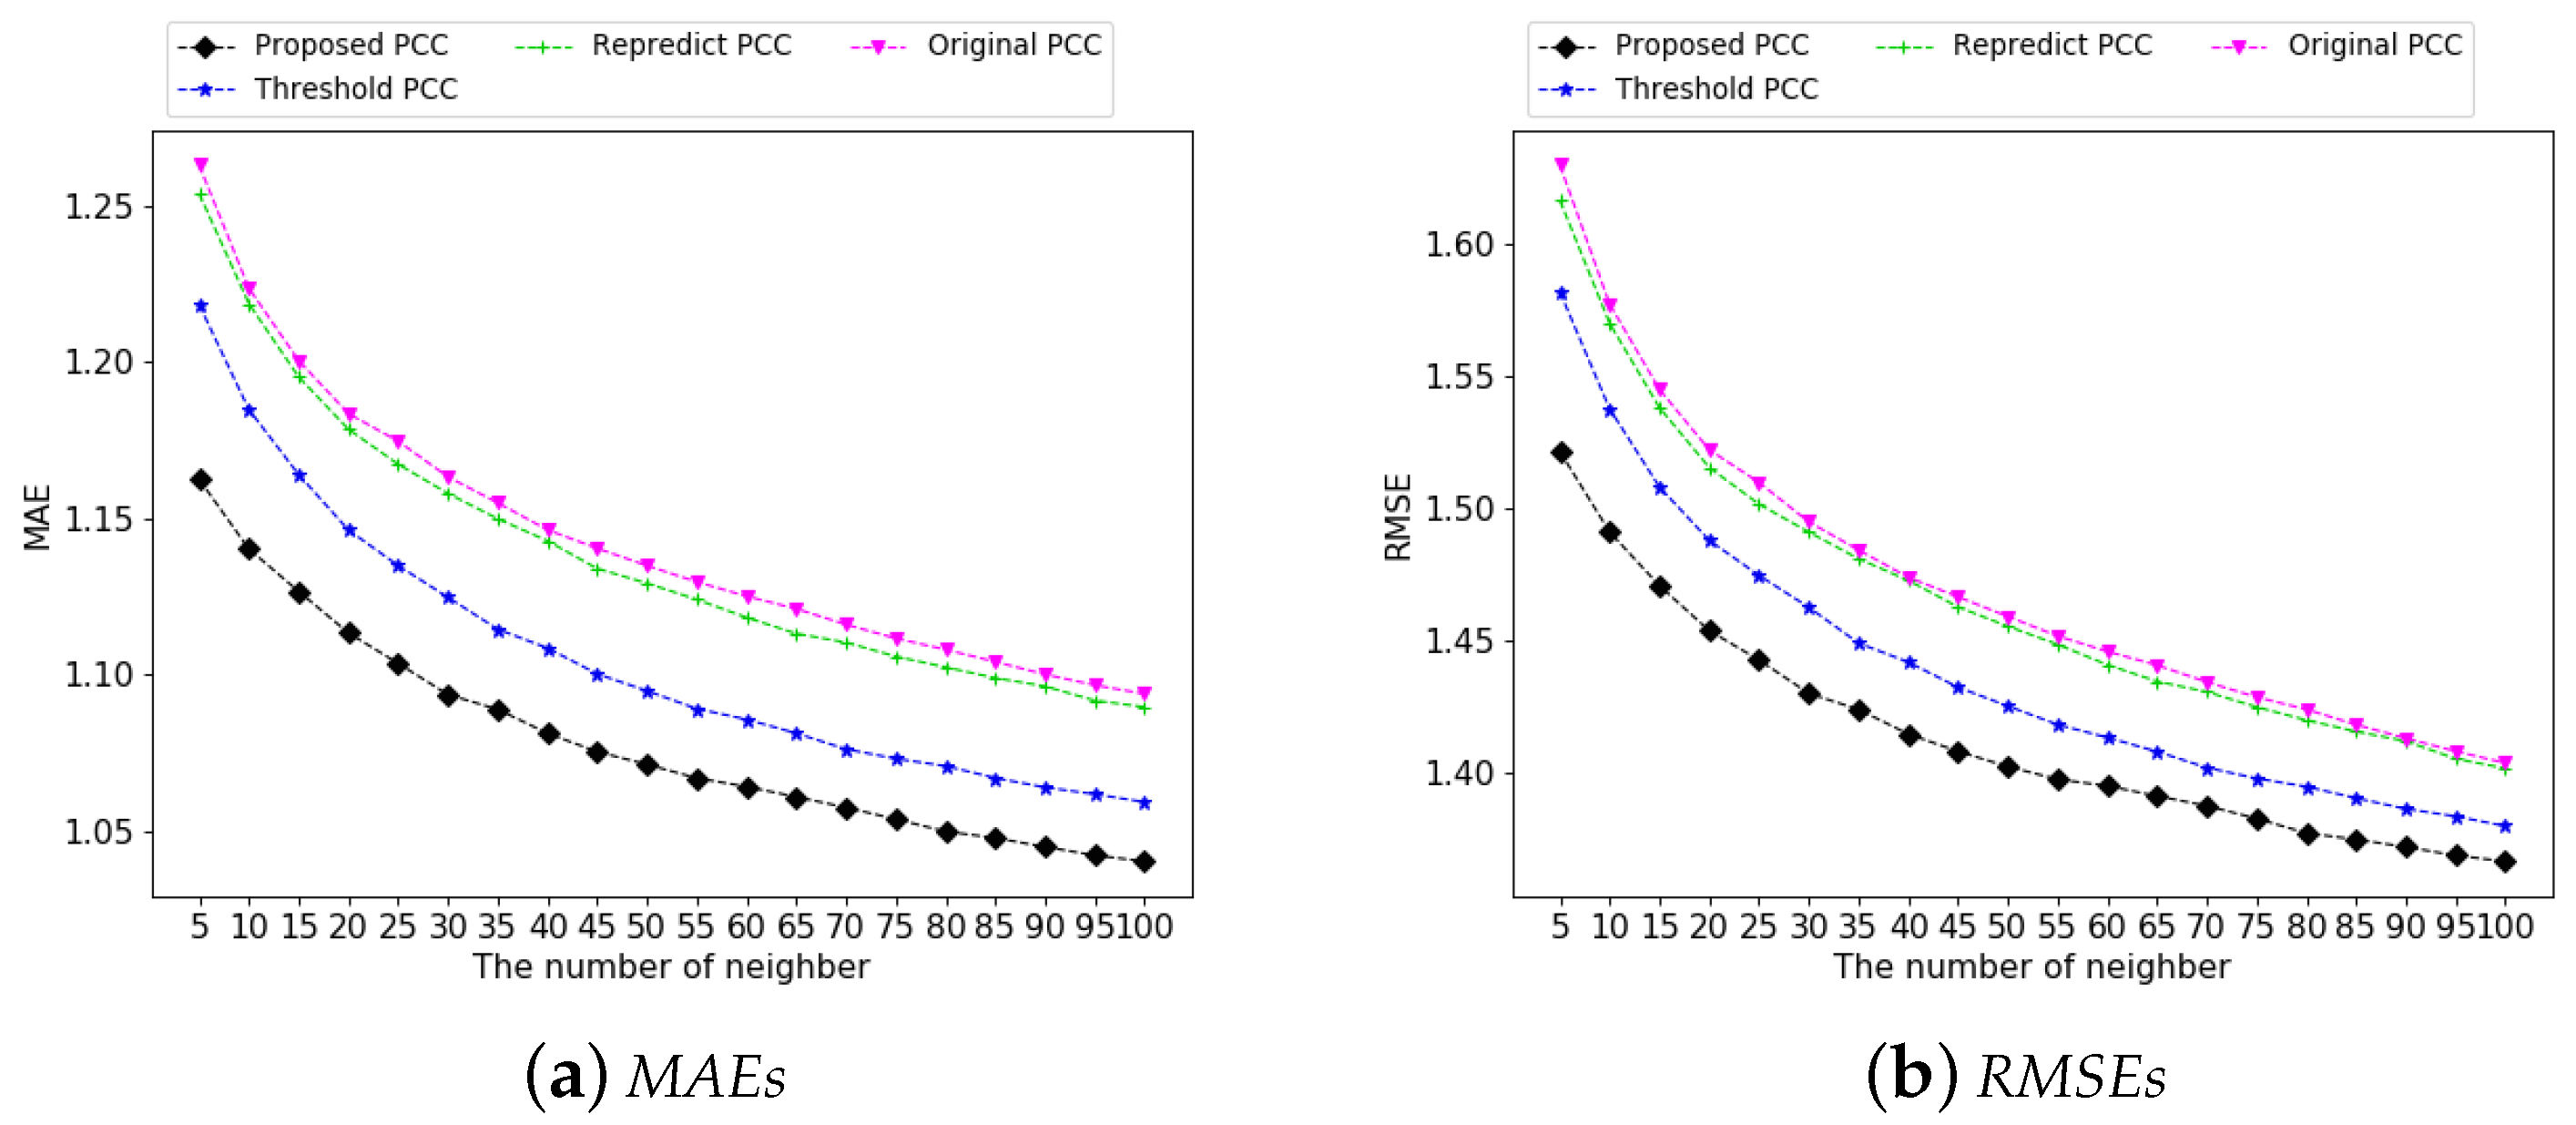
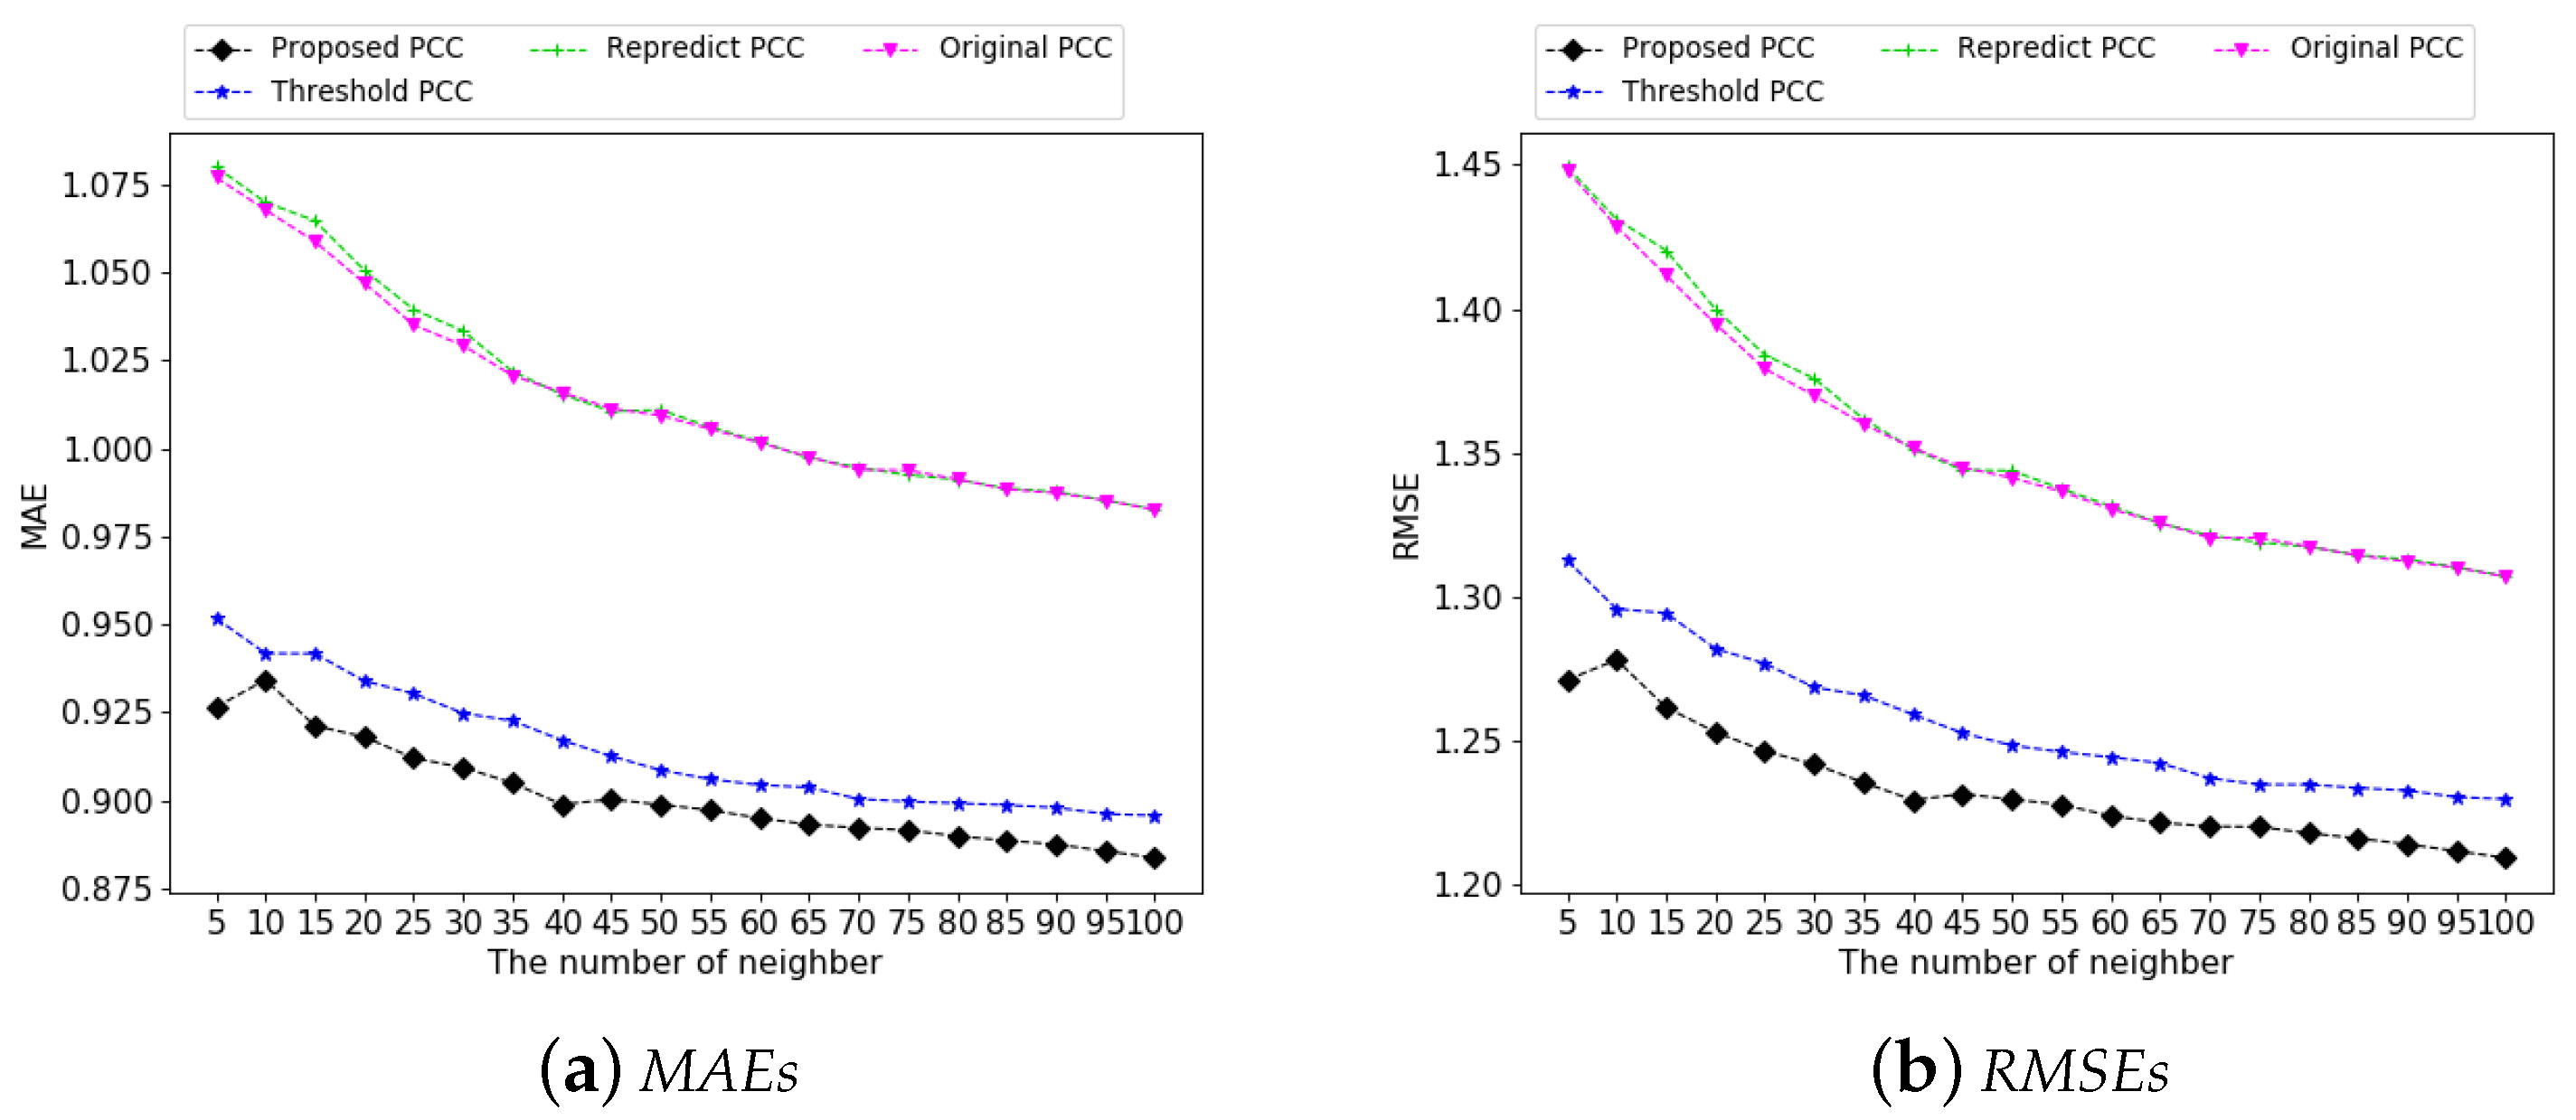
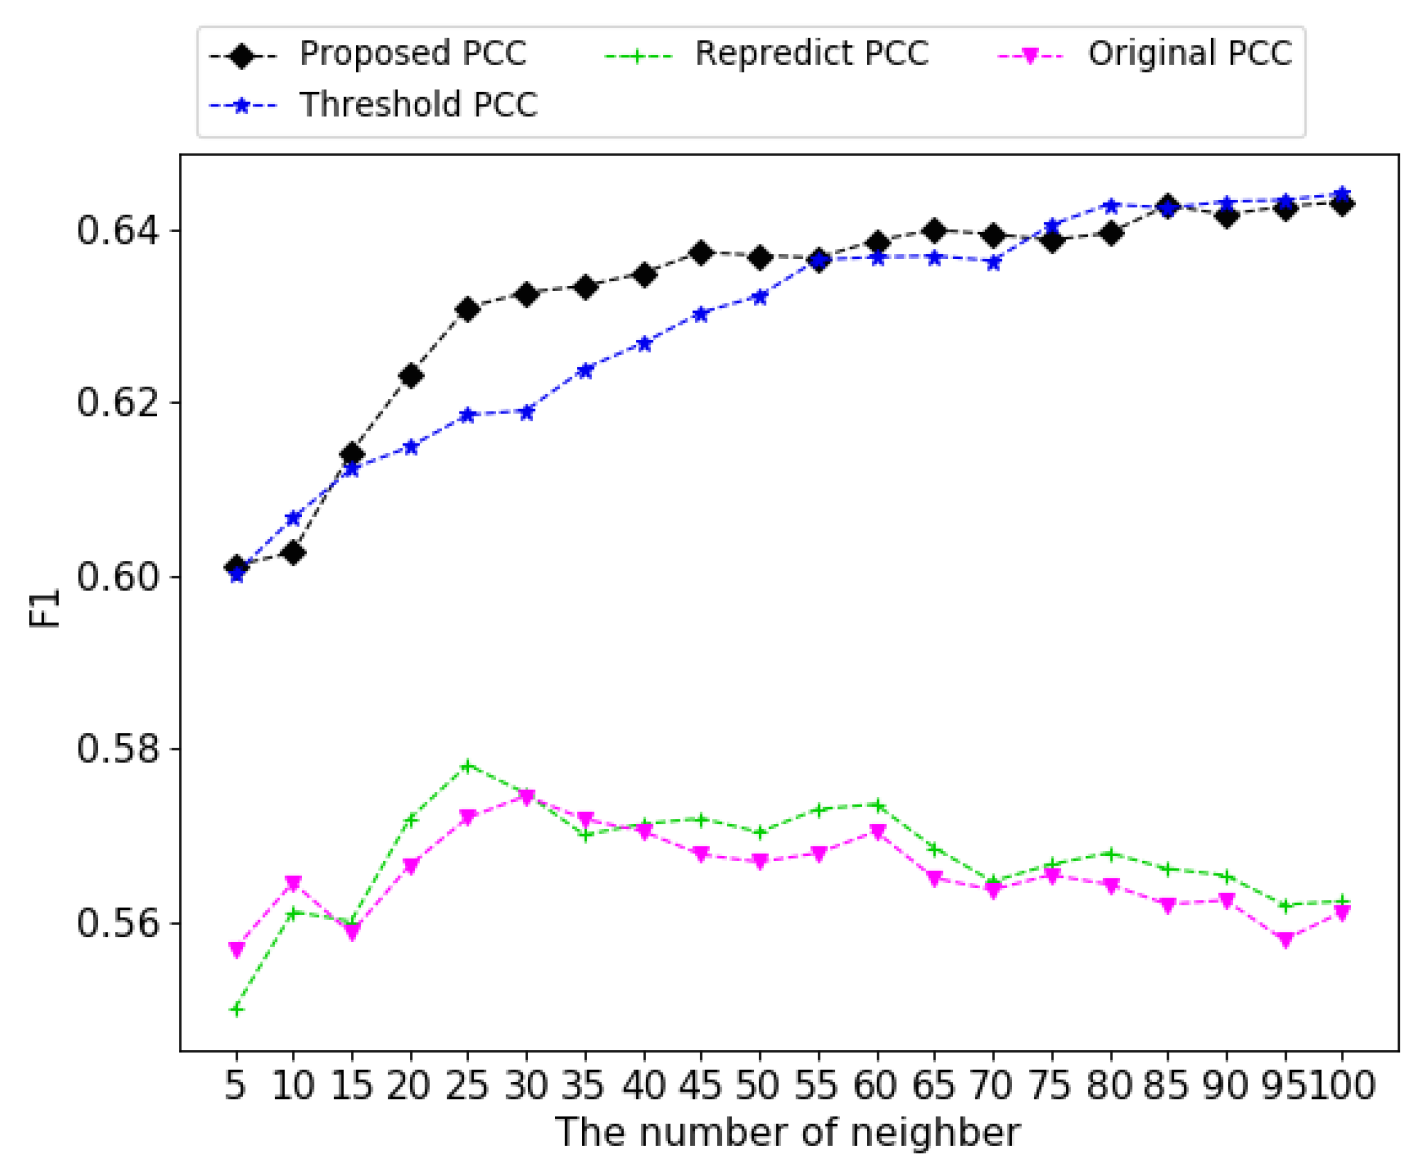
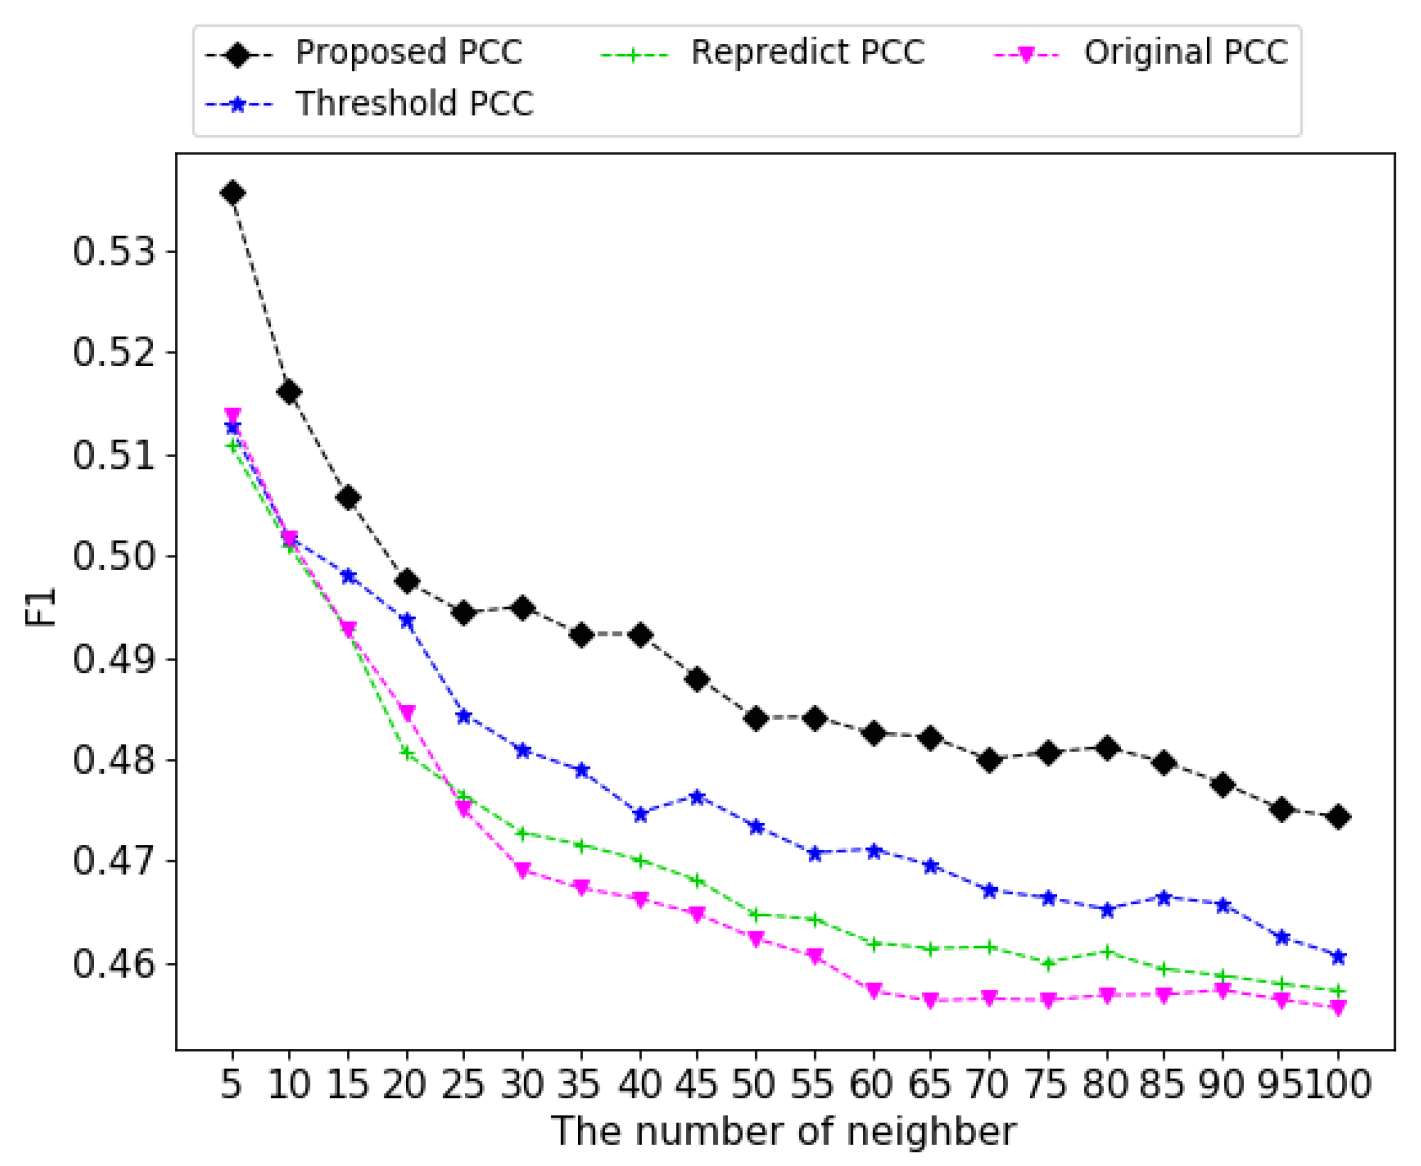
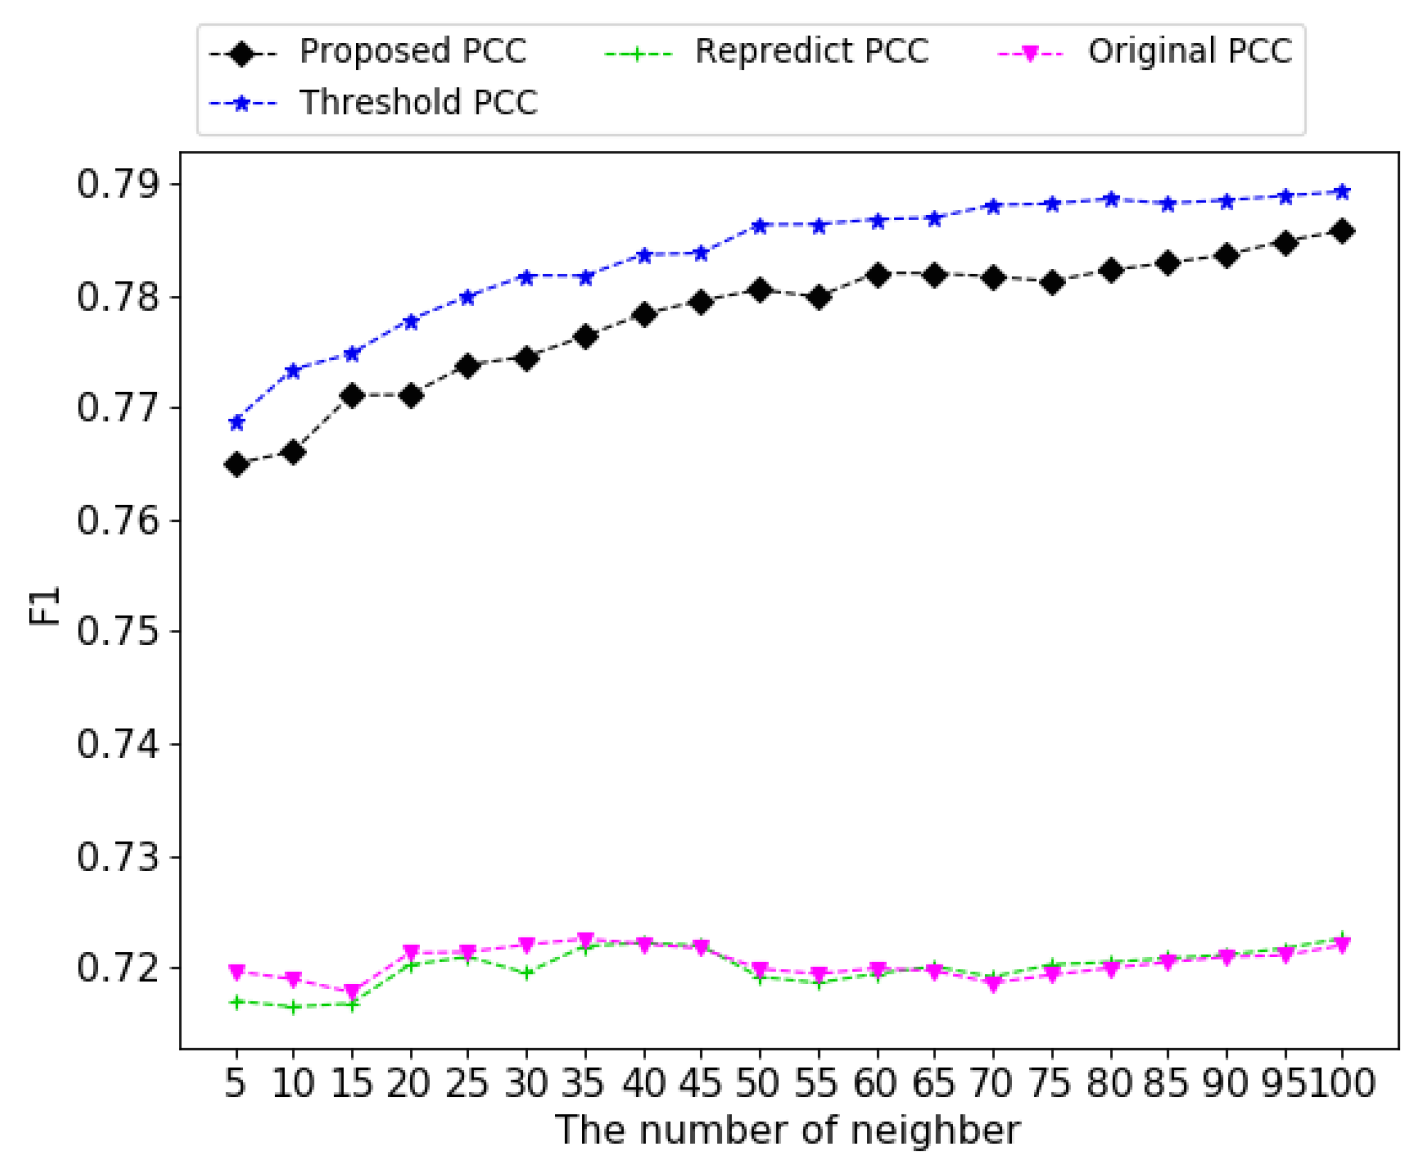
4.3.2. Performance Analysis

We evaluate the effect of correcting natural noise by comparing the difference in recommendation quality between the original and denoised datasets. For all the schemes in Table 6, the evaluation metrics are calculated.
Figure 5, Figure 6 and Figure 7 depict the M A E s and R M S E s on the datasets Movielens-100K, Yahoo Music, and Epinions. It is easily observed from the trend of the curves that both M A E and R M S E decrease as we increase the neighbor size. Moreover, our scheme has the lowest M A E and R M S E . Compared with the Original PCC, our scheme achieves an obvious promotion on the accuracy of predicted ratings. For example, in the dataset Movielens-100K, the M A E and the R M S E are improved by about 5.1% and 5.3%, respectively; in the dataset Yahoo Music, the improvements of M A E and R M S E are about 6.5% and 5.8%; in the dataset Epinions, the improvements of M A E and R M S E in are about 11.3% and 11.8%. These results indicate that our scheme has a good effect in terms of correcting noises.
The Repredict PCC and the Threshold PCC are two schemes with denoising technology used for comparison. Comparing with the Repredict PCC, our scheme has obvious advantages in M A E and R M S E . Moreover, since our scheme can correct the natural noise directly, it has higher efficiency than the Repredict PCC, which needs to recalculate the ratings. Although the Threshold PCC can directly correct the natural noise in ratings and has high efficiency, it only changes the ratings from one level to another level, which probably introduces new deviation and limits the further promotion of predictive accuracy. The results in Figure 5, Figure 6 and Figure 7 also confirm this claim. In Figure 5, the gaps of M A E and R M S E between the Threshold PCC and our scheme are about 2% and 2.4%, respectively. In Figure 6, our scheme has about 2.7% and 2.5% advantages in M A E and R M S E over the Threshold PCC. In Figure 7, our scheme still has about 1.3% and 2.3% better performances in the M A E and R M S E than the Threshold PCC. Therefore, the experimental results indicate that our scheme can effectively detect and correct natural noises.
The F 1 values are calculated according to the cases listed in Table 6. The experimental results are depicted in Figure 8, Figure 9 and Figure 10. According to Figure 8, it can be seen that our scheme and the Threshold PCC have larger F 1 values than those of the Original PCC and the Repredict PCC in the dataset Movielens-100K.
Compared with the Original PCC, the F 1 value of our scheme increases by about 6.7%, which means that correcting the natural noises in ratings can effectively improve the quality of recommendation. Figure 9 shows the test result in the dataset Yahoo Music. Obviously, our scheme has the best F 1 values among all of the schemes. Different from Figure 8 and Figure 10, the F 1 value decreases as the number of neighbors increases in Figure 9. The reason may be related to the quality of ratings. In the dataset Yahoo music, about 16.72% of ratings are detected with natural noises. Meanwhile, the percentages of the ratings with natural noises in the datasets Movielens-100K and Epinions are 6.85% and 6.09%, respectively. This means that the quality of ratings in Yahoo Music is lower than the other datasets. When the quality of ratings is low, using more neighbors in the calculation of recommendation may introduce more errors. The results in Figure 10 are similar to the results in Figure 8. Our scheme and the Threshold PCC have much better F 1 values than the Original PCC and the Repredict PCC. Moreover, although the Threshold PCC has the best F 1 value in the dataset Epinions, the F 1 value of our scheme is very close to that of the Threshold PCC. The difference between them is smaller than 1%. Based on the above analysis on F 1 values, we can conclude that our scheme also improves recommendation accuracy by correcting natural noises.

4.4. Experimental Results in Learning Based Models

Currently, the learning-based method is a research hotspot and has good application in the field of recommendations. Here, two classic learning-based methods, i.e., ConsisRes [32] and MF [33], are selected to evaluate the performance of our natural noise management scheme. We first test the results generated by ConsisRec and MF in the three original datasets, Movielens-100K, Yahoo Music, and Epinions, then generate the results in the same way in these datasets after denoising by our scheme. All the results are listed in Table 7.
According to Table 7, we can see that (i) regardless of whether the original dataset or the denoised dataset is used, the ConsisRec model shows a very tiny difference in MAE, RMSE, and F1 results; (ii) the results of MF are also similar to those of ConsisRec, that is, the changes in MAE, RMSE, and F1 between the original datasets and their denoised datasets are very small. The test results in Table 7 show that our proposed method of removing natural noise does not significantly improve the recommendation quality of the two benchmarks. The main reason can be summarized as follows: our scheme detects and corrects natural noise mainly based on the rating bias of users. It can be regarded as a typical natural noise management scheme based on the explicit features of users and items. However, the learning-based models (such as ConsisRec and MF) utilize both explicit and implicit features of users and items to generate recommendation results. For ConsisRec and MF, the implicit features have more effect on the recommendation results than the explicit features. Since our noise management scheme only considers the explicit features of users and items, the improvement in recommendation quality caused by our scheme is not obvious in ConsisRec and MF. On the other hand, since similarity-based benchmarks, such as PCC, only rely on explicit features to generate recommendation results, our scheme can bring more obvious improvements in recommendation quality in such benchmarks. Therefore, it can be concluded that our scheme can improve the recommendation results of the similarity-based models, but the improvement is not significant for learning-based models.

5. Conclusions

Natural noises in users’ ratings are usually ignored, which may have a serious negative effect on the performance of recommender systems. To manage the noises, a new scheme is proposed with the aim of first detecting noises and then correcting them. In the process of detecting, users and items are divided into subcategories, which are used as the criteria to identify natural noises. In the process of correcting, the probabilities that users or items belong to different subcategories are considered. We correct the natural noise in ratings with threshold values weighted by probabilities. Our scheme manages natural noise mainly based on the explicit features of users and items. Thus, the proposed scheme can significantly improve the recommendation quality for the recommendation models based on explicit features, such as the PCC model. Meanwhile, a shortcoming in this paper is that our scheme cannot bring a significant improvement for the recommendation models that mainly rely on implicit features.
In this paper, we only design a natural noise correction scheme based on the features of users and items. To construct a comprehensive scheme for correcting noise, more information such as implicit features should also be considered in future work. Moreover, another line of interesting future work would be to embed the noise correction as a component into the learning-based recommendation models.

Author Contributions

Conceptualization, Y.W. and C.L.; methodology, B.L.; software, H.L.; validation, Y.W., C.L. and B.L.; formal analysis, P.W.; investigation, P.W.; resources, Y.W.; data curation, B.L.; writing—original draft preparation, C.L.; writing—review and editing, Y.W. and L.Y.Z.; visualization, H.L.; supervision, Y.W.; project administration, L.Y.Z.; funding acquisition, Y.W. All authors have read and agreed to the published version of the manuscript.

Funding

This research was funded by the National Natural Science Foundation of China (No. 62272077), the MOE Layout Foundation of Humanities and Social Sciences, China (No. 20YJAZH102), the Natural Science Foundation of Chongqing, China (No. cstc2021jcyj-msxmX0557), the Science and Technology Innovation Project of The Chengdu-Chongqing Twin Cities Economic Zone (No. KJCX2020027), and the Science and Technology Research Program of Chongqing Municipal Education Commission (No. KJQN202100604).

Data Availability Statement

Publicly available datasets were analyzed in this study. Movielens 100K data can be found here: https://grouplens.org/datasets/movielens/, YahooMusic data can be found here: https://webscope.sandbox.yahoo.com/, Epinions data can be found here: http://www.trustlet.org/downloaded_epinions.html.

Conflicts of Interest

The authors declare that they have no known competing financial interests or personal relationships that could have appeared to influence the work reported in this paper.

References

  1. Eppler, M.J.; Mengis, J. The Concept of Information Overload—A Review of Literature from Organization Science, Accounting, Marketing, MIS, and Related Disciplines (2004). In Kommunikationsmanagement im Wandel; Springer: Berlin/Heidelberg, Germany, 2008; pp. 271–305. [Google Scholar]
  2. Khan, Z.Y.; Niu, Z.D.; Sandiwarno, S.; Prince, R. Deep learning techniques for rating prediction: A survey of the state-of-the-art. Artif. Intell. Rev. 2021, 54, 95–135. [Google Scholar] [CrossRef]
  3. Ahmadian, S.; Joorabloo, N.; Jalili, M.; Ahmadian, M. Alleviating data sparsity problem in time-aware recommender systems using a reliable rating profile enrichment approach. Expert Syst. Appl. 2022, 187, 115849. [Google Scholar] [CrossRef]
  4. Lü, L.Y.; Medo, M.; Yeung, C.H.; Zhang, Y.C.; Zhang, Z.K.; Zhou, T. Recommender systems. Phys. Rep. 2012, 519, 1–49. [Google Scholar] [CrossRef]
  5. Koenigstein, N.; Dror, G.; Koren, Y. Yahoo! music recommendations: Modeling music ratings with temporal dynamics and item taxonomy. In Proceedings of the Fifth ACM Conference on Recommender Systems, Chicago, IL, USA, 23–27 October 2011; pp. 165–172. [Google Scholar]
  6. Smith, B.; Linden, G. Two Decades of Recommender Systems at Amazon.com. IEEE Internet Comput. 2017, 21, 12–18. [Google Scholar] [CrossRef]
  7. Gomez-Uribe, C.A.; Hunt, N. The Netflix Recommender System: Algorithms, Business Value, and Innovation. ACM Trans. Manag. Inf. Syst. (TMIS) 2015, 6, 1–19. [Google Scholar] [CrossRef]
  8. Covington, P.; Adams, J.; Sargin, E. Deep Neural Networks for YouTube Recommendations. In Proceedings of the 10th ACM Conference on Recommender Systems, Boston, MA, USA, 15–19 September 2016; pp. 191–198. [Google Scholar]
  9. Margaris, D.; Vassilakis, C.; Spiliotopoulos, D. On Producing Accurate Rating Predictions in Sparse Collaborative Filtering Datasets. Information 2022, 13, 302. [Google Scholar] [CrossRef]
  10. Singh, P.K.; Sinha, S.; Choudhury, P. An improved item-based collaborative filtering using a modified Bhattacharyya coefficient and user–user similarity as weight. Knowl. Inf. Syst. 2022, 64, 665–701. [Google Scholar] [CrossRef]
  11. Liu, N.; Li, M.X.; Qiu, H.Y.; Su, H.L. A hybrid user-based collaborative filtering algorithm with topic model. Appl. Intell. 2021, 51, 7946–7959. [Google Scholar]
  12. O’Mahony, M.P.; Hurley, N.J.; Silvestre, G.C. Detecting noise in recommender system databases. In Proceedings of the 11th International Conference on Intelligent User Interfaces, Sydney, Australia, 29 January–1 February 2006; pp. 109–115. [Google Scholar]
  13. Pham, H.X.; Jung, J.J. Preference-based user rating correction process for interactive recommendation systems. Multimed. Tools Appl. 2013, 65, 119–132. [Google Scholar] [CrossRef]
  14. Toledo, R.Y.; Mota, Y.C.; Martínez, L. Correcting noisy ratings in collaborative recommender systems. Knowl.-Based Syst. 2015, 76, 96–108. [Google Scholar] [CrossRef]
  15. Turk, A.M.; Bilge, A. Robustness analysis of multi-criteria collaborative filtering algorithms against shilling attacks. Expert Syst. Appl. 2019, 115, 386–402. [Google Scholar] [CrossRef]
  16. Chung, C.Y.; Hsu, P.Y.; Huang, S.H. βP: A novel approach to filter out malicious rating profiles from recommender systems. Decis. Support Syst. 2013, 55, 314–325. [Google Scholar] [CrossRef]
  17. Cai, Y.F.; Zhu, D. Trustworthy and profit: A new value-based neighbor selection method in recommender systems under shilling attacks. Decis. Support Syst. 2019, 124, 113112. [Google Scholar] [CrossRef]
  18. Xia, H.; Fang, B.; Gao, M.; Ma, H.; Tang, Y.Y.; Wen, J. A novel item anomaly detection approach against shilling attacks in collaborative recommendation systems using the dynamic time interval segmentation technique. Inf. Sci. 2015, 306, 150–165. [Google Scholar] [CrossRef]
  19. Castro, J.; Yera, R.; Martínez, L. An empirical study of natural noise management in group recommendation systems. Decis. Support Syst. 2017, 94, 1–11. [Google Scholar] [CrossRef]
  20. Bag, S.; Kumar, S.; Awasthi, A.; Tiwari, M.K. A noise correction-based approach to support a recommender system in a highly sparse rating environment. Decis. Support Syst. 2019, 118, 46–57. [Google Scholar] [CrossRef]
  21. Wang, P.Y.; Wang, Y.; Zhang, L.Y.; Zhu, H. An effective and efficient fuzzy approach for managing natural noise in recommender systems. Inf. Sci. 2021, 570, 623–637. [Google Scholar] [CrossRef]
  22. Amatriain, X.; Pujol, J.M.; Tintarev, N.; Oliver, N. Rate it again: Increasing recommendation accuracy by user re-rating. In Proceedings of the Third ACM Conference on Recommender Systems, New York, NY, USA, 22–25 October 2009; pp. 173–180. [Google Scholar]
  23. Yera, R.; Castro, J.; Martínez, L. A fuzzy model for managing natural noise in recommender systems. Appl. Soft Comput. 2016, 40, 187–198. [Google Scholar] [CrossRef]
  24. Choudhary, P.; Kant, V.; Dwivedi, P. Handling Natural Noise in Multi Criteria Recommender System utilizing effective similarity measure and Particle Swarm Optimization. Procedia Comput. Sci. 2017, 115, 853–862. [Google Scholar] [CrossRef]
  25. Castro, J.; Yera, R.; Martinez, L. A fuzzy approach for natural noise management in group recommender systems. Expert Syst. Appl. 2018, 94, 237–249. [Google Scholar] [CrossRef]
  26. Li, B.; Chen, L.; Zhu, X.Q.; Zhang, C.Q. Noisy but non-malicious user detection in social recommender systems. World Wide Web 2013, 16, 677–699. [Google Scholar] [CrossRef]
  27. Shani, G.; Gunawardana, A. Evaluating Recommendation Systems. In Recommender Systems Handbook; Springer: Berlin/Heidelberg, Germany, 2011; pp. 257–297. [Google Scholar]
  28. MovieLens 100K Dataset. Available online: https://grouplens.org/datasets/movielens/ (accessed on 14 January 2022).
  29. Yahoo Music Dataset. Available online: https://webscope.sandbox.yahoo.com/ (accessed on 14 January 2022).
  30. Epinions Dataset. Available online: http://www.trustlet.org/downloaded_epinions.html (accessed on 14 January 2022).
  31. Breese, J.S.; Heckerman, D.; Kadie, C.M. Empirical Analysis of Predictive Algorithms for Collaborative Filtering. arXiv 2013, arXiv:1301.7363. Available online: http://xxx.lanl.gov/abs/1301.7363 (accessed on 19 August 2022).
  32. Yang, L.; Liu, Z.; Dou, Y.; Ma, J.; Yu, P.S. ConsisRec: Enhancing GNN for Social Recommendation via Consistent Neighbor Aggregation. In Proceedings of the 44th International ACM SIGIR Conference on Research and Development in Information Retrieval, SIGIR ’21, Virtual Event, 11–15 July 2021; Association for Computing Machinery: New York, NY, USA, 2021; pp. 2141–2145. [Google Scholar]
  33. Koren, Y.; Bell, R.; Volinsky, C. Matrix Factorization Techniques for Recommender Systems. Computer 2009, 42, 30–37. [Google Scholar] [CrossRef]
Figure 1. The distances between users (or item) and user (or item) categories. (a) User and its possible categories; (b) Item and its possible categories.
Algorithms 16 00228 g001
Figure 2. The results on Movielens-100K: (a) The classification results of users/items based on our scheme; (b) The correction results on noisy ratings based on our scheme.
Algorithms 16 00228 g002
Figure 3. The results on Yahoo Music: (a) The classification results of users/items based on our scheme; (b) The correction results on noisy ratings based on our scheme.
Algorithms 16 00228 g003
Figure 4. The results of denoise on Epinions: (a) The classification results of users/items based on our scheme; (b) The correction results on noisy ratings based on our scheme.
Algorithms 16 00228 g004
Figure 5. The MAEs/RMSEs on Movielens-100K.
Algorithms 16 00228 g005
Figure 6. The MAEs/RMSEs on Yahoo Music.
Algorithms 16 00228 g006
Figure 7. The MAEs/RMSEs on Epinions.
Algorithms 16 00228 g007
Figure 8. The F1 values on Movielens-100K.
Algorithms 16 00228 g008
Figure 9. The F1 values on Yahoo Music.
Algorithms 16 00228 g009
Figure 10. The F1 values on Yahoo Epinions.
Algorithms 16 00228 g010
Table 1. Existing works about managing natural noises.
Manage Natural NoisesAuthorProblemMain Work
Remove noisesO’Mahony et al. (2006) [12]Data sparsityDetect noises and remove them
Li et al. (2013) [26]Data sparsityDetect noises and remove them
Correct noisesAmatriain et al. (2009) [22]Depending on additional informationRe-rating
Pham and Jung (2013) [13]Depending on additional informationInteractive recommender systems
Toledo et al. (2014) [14]Time-consumingRe-predicting
Yera et al. (2016) [23]Time-consumingRe-predicting
Castro et al. (2017) [19]Time-consumingRe-predicting
Choudhary et al. (2017) [24]Time-consumingRe-predicting
Castro et al. (2018) [25]Time-consumingRe-predicting
Bag et al. (2019) [20]-Threshold value
Table 2. The special virtual users and items, which both include three different types.
Special virtual users Negative-Extreme x u = 1 , y u = 0 , z u = 0 Only provides low ratings for items
Average-Extreme x u = 0 , y u = 1 , z u = 0 Only provides medium ratings for items
Positive-Extreme x u = 0 , y u = 0 , z u = 1 Only provides high ratings for items
Special virtual items No-Preferred-Extreme x i = 1 , y i = 0 , z i = 0 Only get low ratings from users
Av-Preferred-Extreme x i = 0 , y i = 1 , z i = 0 Only get medium ratings from users
Preferred-Extreme x i = 0 , y i = 0 , z i = 1 Only get high ratings from users
Table 3. The classification of users and items, where users (items) are classified as three subcategories according to the rules of the classifying user (item).
SubcategoryRemark
Users categoriesNegativeTend to provide high ratings for items
AverageTend to provide medium ratings for items
PositiveTend to provide low ratings for items
Items categoriesNo-PreferredTend to get high ratings from users
Av-PreferredTend to get medium ratings from users
PreferredTend to get low ratings from users
Table 4. The rules of detecting natural noises, where rating r u i is determined whether it is noise based on the subcategories associated with the user u and the item i.
Low RatingsMedium RatingHigh Ratings
(Negative users, No-Preferred items)-Natural noiseNatural noise
(Average users, Av-Preferred items)Natural noise-Natural noise
(Positive users, Preferred items)Natural noiseNatural noise-
Table 5. The details about the experimental datasets.
DatasetRatingsUsersItemsSparsityRating Scale
Movielens-100K100,00094316826.30%1–5
Yahoo Music270,121808910003.33%1–5
Epinions482,8508693123,3300.45%1–5
Table 6. The schemes in our experiments.
Scheme Description
Original PCC/ConsisRec/MF Apply PCC/ConsisRec/MF to the original dataset
Repredict PCC/ConsisRec/MF Apply PCC/ConsisRec/MF to the dataset which is denoised by the scheme in [14]
Threshold PCC/ConsisRec/MF Apply PCC/ConsisRec/MF to the dataset which is denoised by the scheme in [20]
Proposed PCC/ConsisRec/MF Apply PCC/ConsisRec/MF to the dataset which is denoised by our scheme
Table 7. The test results of two learning-based benchmarks in three original datasets and their denoised datasets.
Dataset MF ConsisRec
RMSE MAE F1 RMSE MAE F1
Movielens 100K denoised by our scheme 0.9523 0.7510 0.6657 0.9287 0.7319 0.6667
Original Movielens 100K 0.9499 0.7571 0.6586 0.9264 0.7287 0.6989
YahooMusic denoised by our scheme 1.2630 0.9562 0.5767 1.2760 0.9897 0.5728
Original YahooMusic 1.2205 0.9650 0.6040 1.2822 1.0371 0.5195
Epinions denoised by our scheme 1.9925 1.3505 0.6612 1.1024 0.8607 0.5669
Origianl Epinions 1.9900 1.3661 0.6580 1.1025 0.8642 0.6274
Disclaimer/Publisher’s Note: The statements, opinions and data contained in all publications are solely those of the individual author(s) and contributor(s) and not of MDPI and/or the editor(s). MDPI and/or the editor(s) disclaim responsibility for any injury to people or property resulting from any ideas, methods, instructions or products referred to in the content.

