1. Introduction
Over the last decades, wearable monitoring systems have been researched, developed and progressively enhanced to support healthcare needs and fit for real-time bio-signals processing, including heart rate measurement and emotional state recognition. As a result, wearable devices are becoming more portable, user friendly, accurate and reliable, which minimizes disturbance to the user’s daily routine. Moreover, combined with access to wireless Internet, these devices are being used in remote subject monitoring. The main advantages are real-time requirements, security, privacy, diversity of services, etc. This paper proposes a wearable solution that can assist different groups of people, as it can provide remote healthcare tracking, overcoming the state-of-the-art systems.
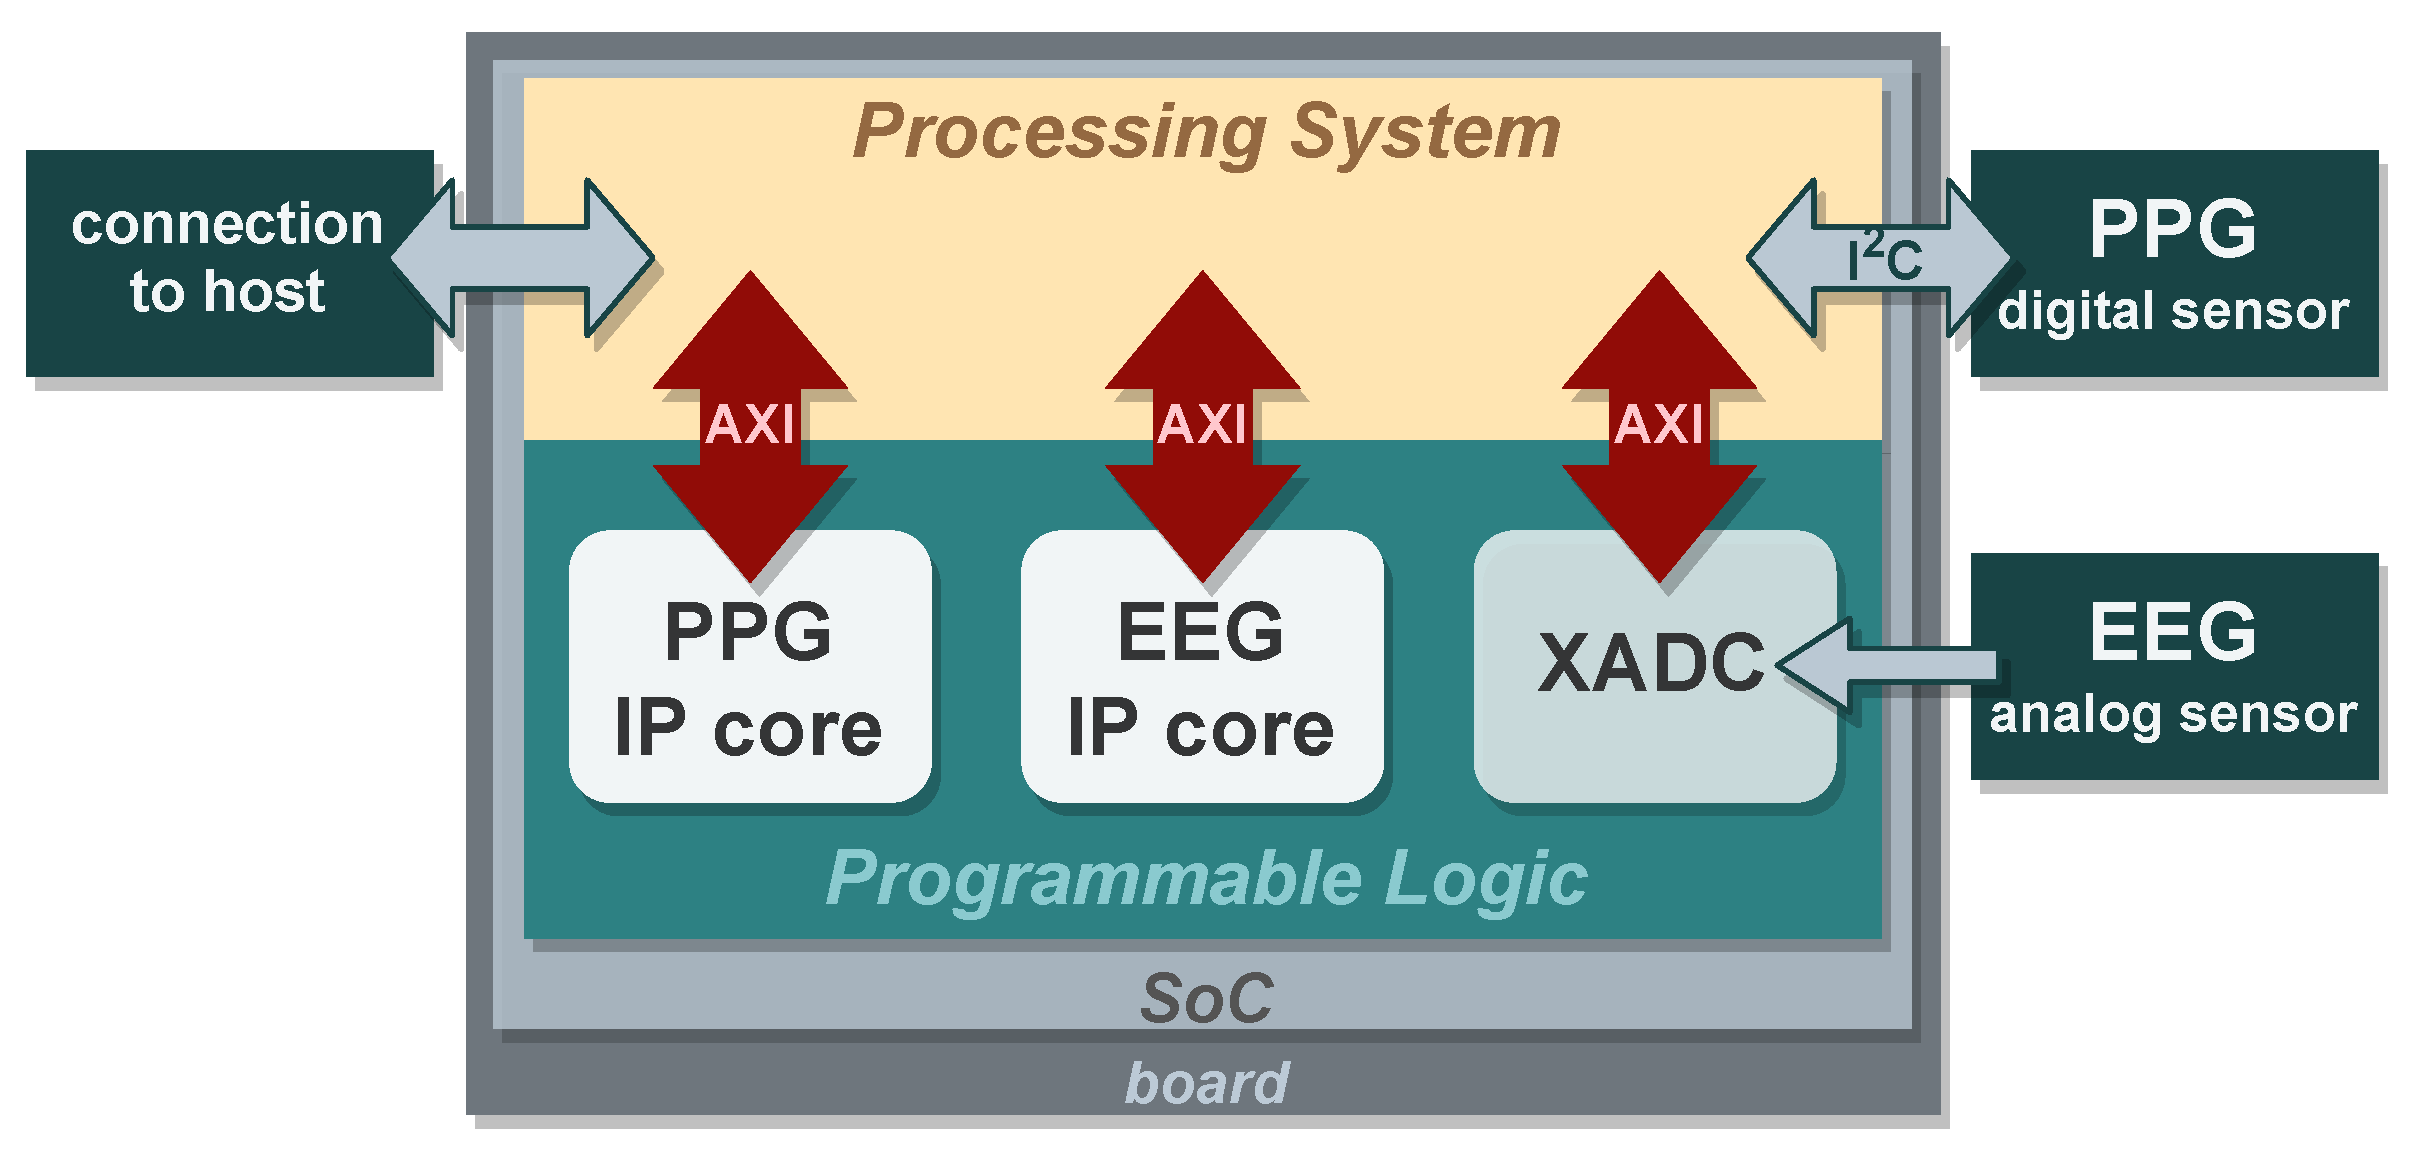
The system uses a ZYNQ7010 system-on-chip (SoC) field-programmable gate array (FPGA) to take advantage of high processing speed and reconfigurable logic at low cost. This kind of device is useful to create flexible and customized hardware solutions with high performance and low power consumption. It is intended to perform signal processing tasks locally and online, instead of transmitting the collected raw sensor data to be processed by an external server, as conventional systems do. By performing the computations locally, at the node, the required bandwidth and power consumption are minimized. Furthermore, this architecture offers parallel computation, which is suitable to handle multiple biometric signals at a time. Such functionalities overcome the limitations of conventional wearable solutions that use general-purpose processors. The proposed system intends to measure a person’s heart rate using photoplethysmography (PPG) and to assess the emotional state via electroencephalography (EEG). The concept of the proposed system architecture is sketched in
Figure 1.
The system has a dual-core ARM processor and a programmable logic area, where dedicated hardware cores are implemented. Both hardware and software are fully programmable, permitting to adapt the system to other applications and to upgrade already implemented applications. An I2C interface is used to communicate with the PPG digital sensor and a XADC (analog to digital converter from Xilinx) core is used to read the analog data from an ECG sensor.
2. Background on Biometric Signals Processing
The underlying framework of the proposed work includes biometric techniques, EEG and PPG, which are introduced next.
2.1. EEG
EEG is a non-invasive technique for probing the electric activity of human brain neurons by attaching electrodes on the scalp that detect voltage fluctuations upon ion flow [
1]. Five major frequency bands can be identified in brain waves, depending on the neural activity— delta (1–3 Hz), theta (4–7 Hz), alpha (8–13 Hz), beta (14–30 Hz) and gamma (31–50 Hz) [
1] —whose frequency pattern changes may denote a response to an external stimulus, or some brain disorder. Activities such as sleeping, exercising or meditation can also be detected in brain waves.
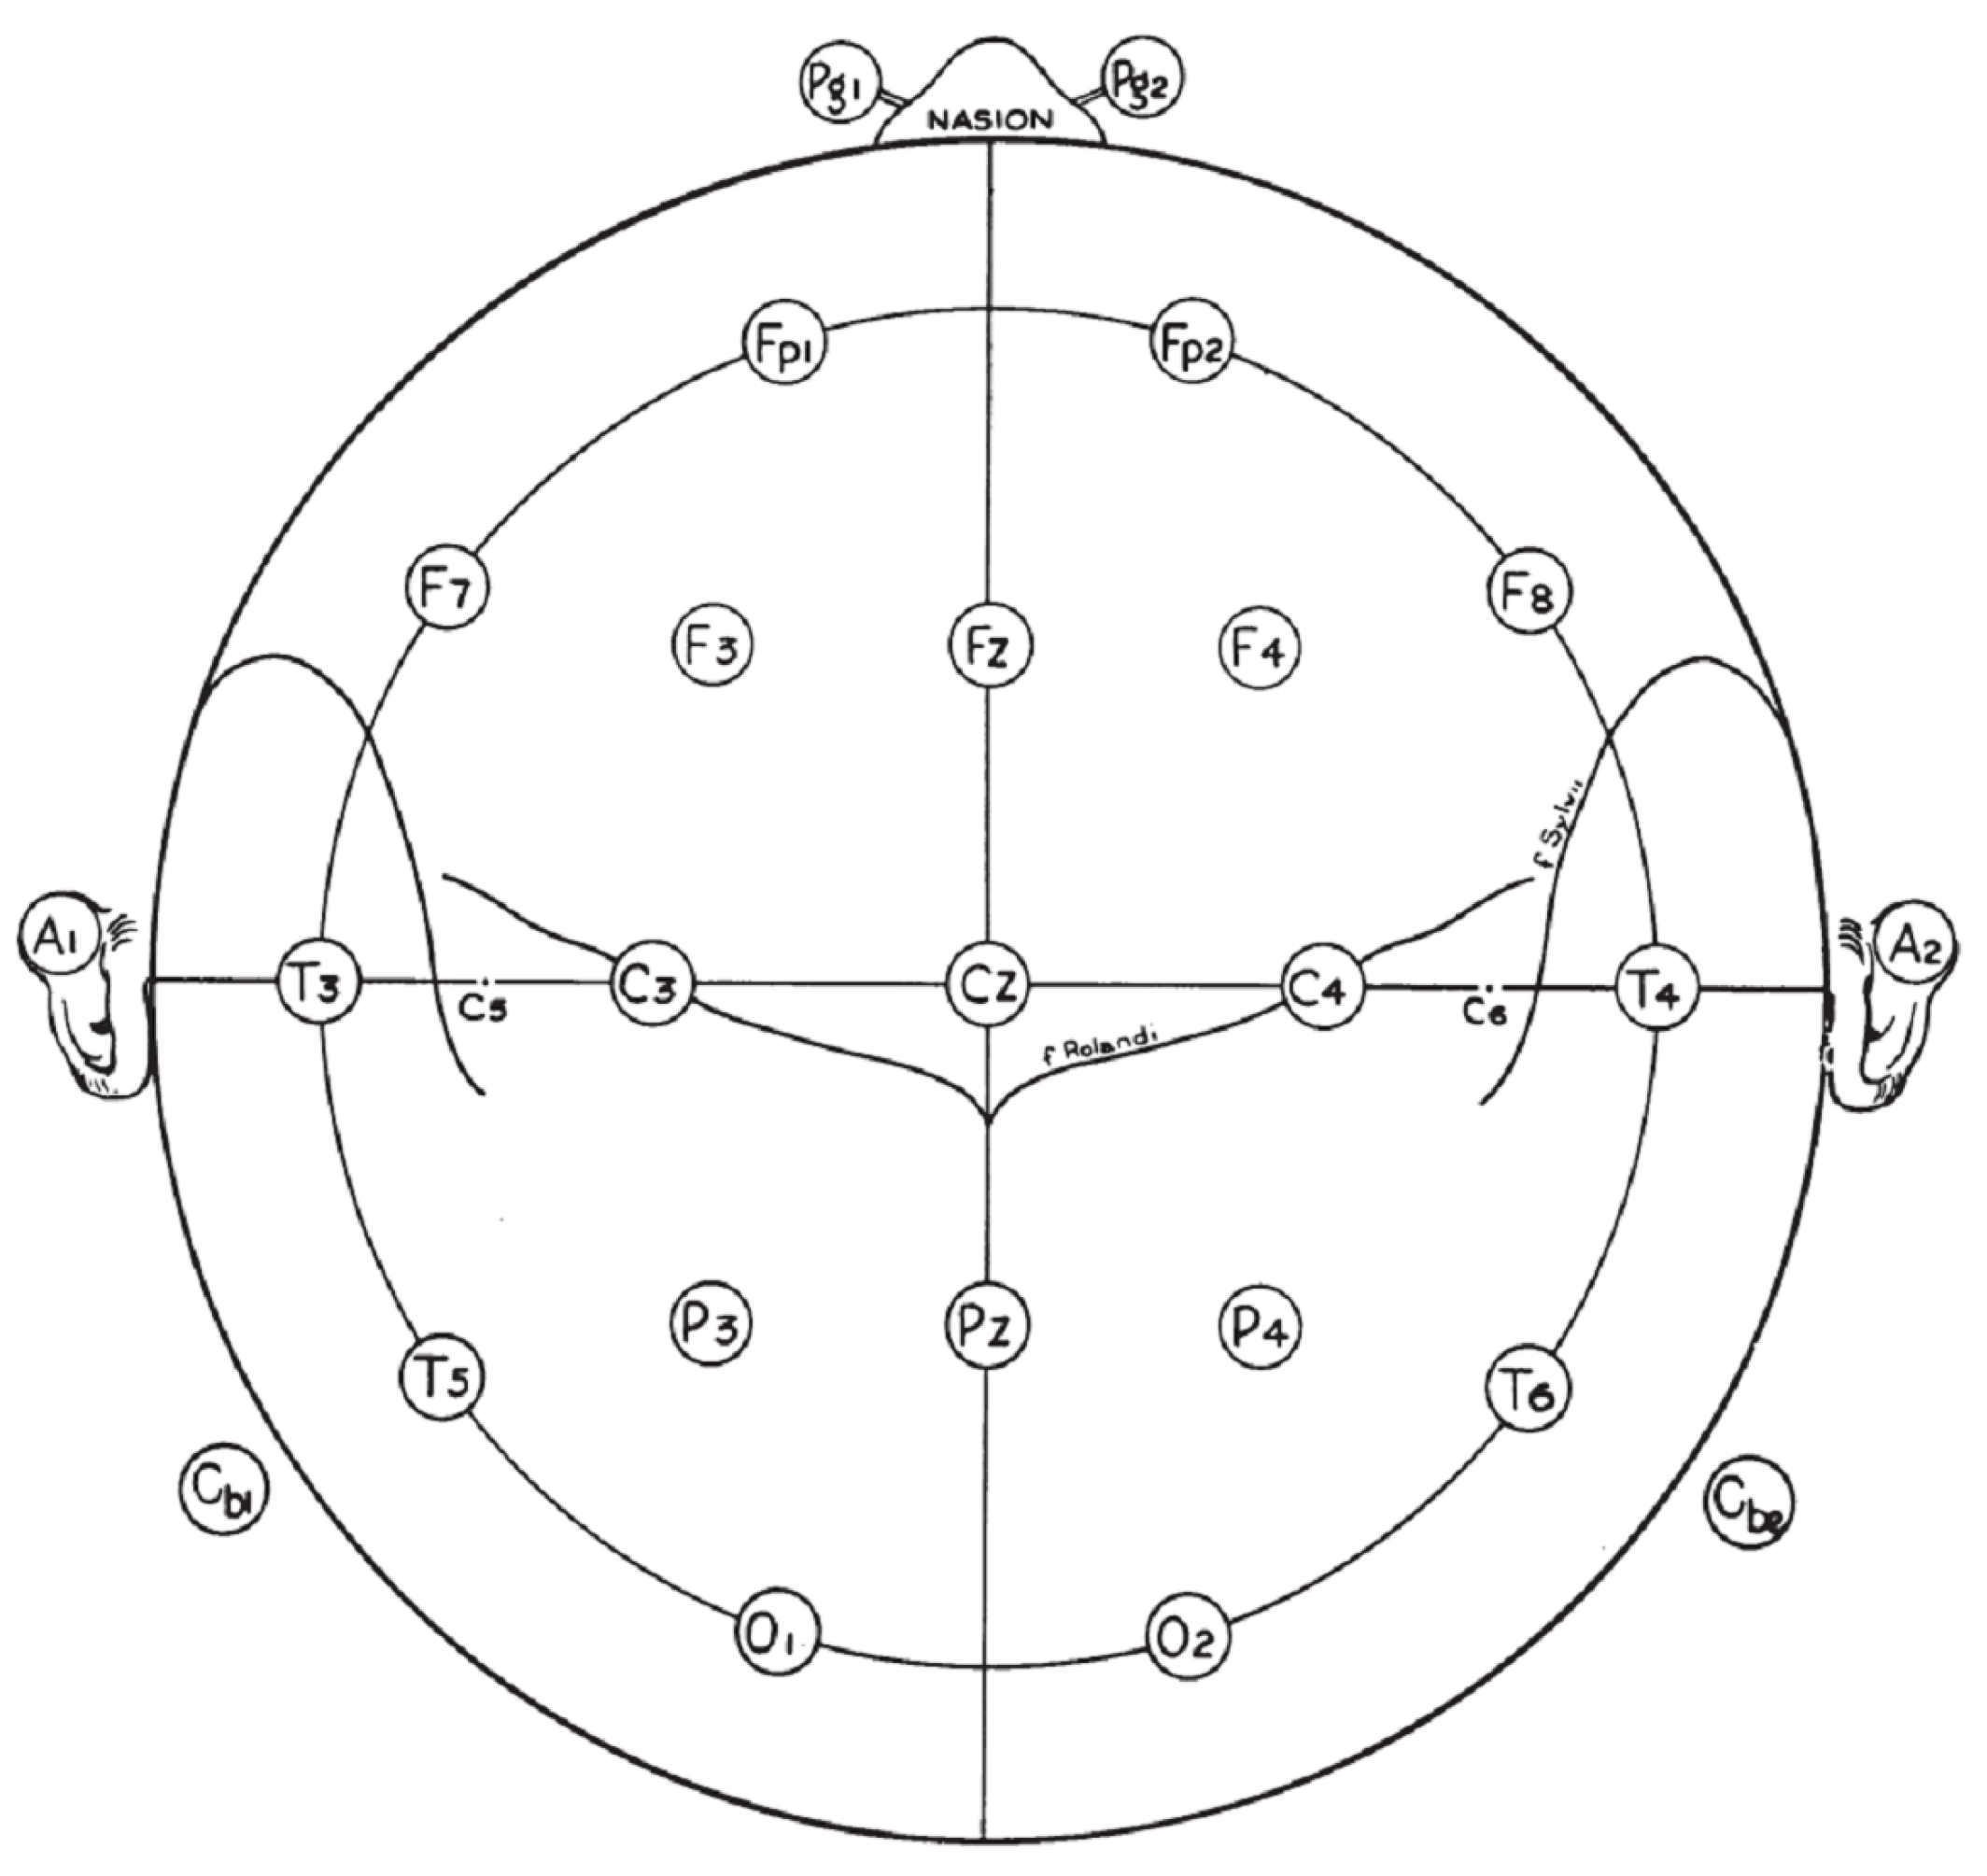
The positioning of electrodes is crucial for accurate signal acquisition, given the scope of the application. The standardization is set by the International 10/20 System [
2], represented in
Figure 2.
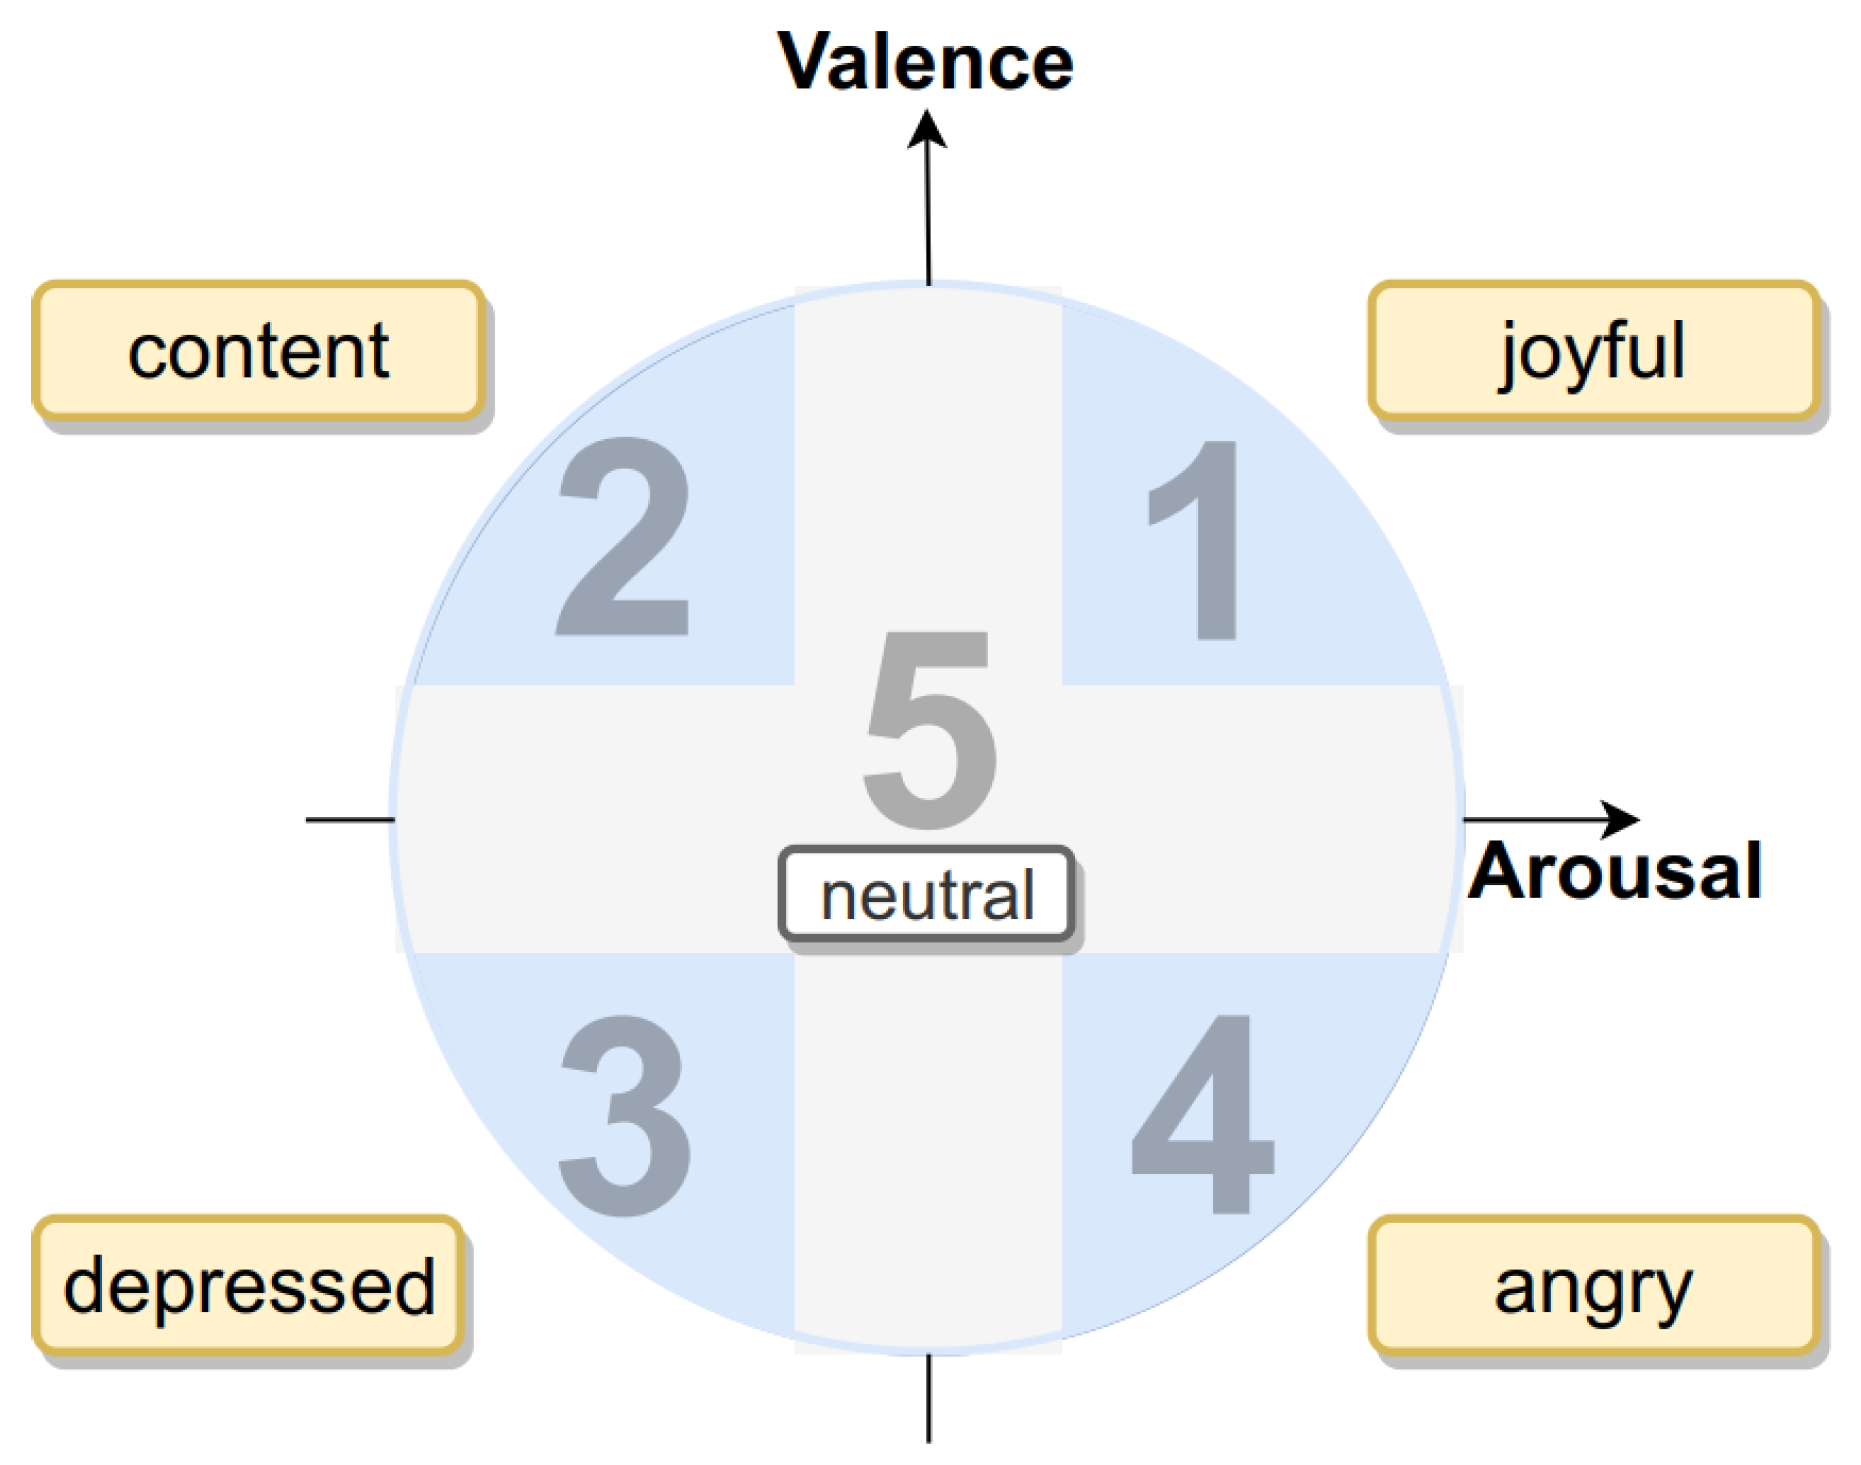
A common application of EEG is emotion classification, which maps and recognizes patterns on features of EEG signals from different known emotions. Russell [
3] defined arousal as the metric for awareness or unawareness during an activity, and valence as the metric for pleasure or displeasure. Both quantities are described as a 2D plane, where arousal is in the horizontal axis and valence in the vertical axis. The resulting emotion in each quartile is a combination of the two.
Processing the EEG signal comprises several steps, namely, noise reduction, signal enhancement, feature extraction and classification. During the acquisition via the electrode, the recorded signal is attenuated by skin tissues and bones but also subject to noise caused by muscular activities, eye movements, eye blinks and cardiac signals [
4]. In fact, the normal EEG signal amplitude ranges microvolts, although a single neuron promotes voltage changes of millivolts. Therefore, in order to remove this noise, the EEG signal is pre-processed and its quality is improved [
5]. After signal pre-processing, features are extracted, that is, patterns are identified in order to reduce dimensional space without losing essential information. Classification is performed by, for example, support vector machine (SVM), linear discriminant analysis (LDA), neural network (NN) or k-nearest neighbor (KNN) [
5].
2.2. PPG
PPG is an optical technique that detects blood volume changes in a microvascular tissue [
6]. PPG uses a light source for emitting light to the tissue and a photodetector for measuring the consequent received light, by transmission or reflection, from which the blood volume variation is estimated. The principle of PPG is as follows. During the cardiac cycle, arteries suffer blood volume reduction when transiting from the systolic phase to the diastolic phase. The PPG sensor detects this change optically, and its photodetector converts the received light energy into an electrical current. A waveform can be acquired and some physiological parameters extracted; for instance, the variability of the time between heartbeats [
7].
A PPG signal comprises two components: a pulsatile (AC), given by cardiac variations in blood volume caused by heartbearts, and a superimposed (DC), variable with some anatomic factors, such as respiration, thermoregulation, vasomotor and sympathetic nervous system activities [
6].
The monitoring and analysis of PPG signal unveils a wide set of clinical applications, namely, the measurement of heart rate, blood pressure, respiratory rate, blood oxygen saturation and several vascular assessments [
6].
PPG is regarded as a non-invasive and low-cost method, and can be integrated in a portable, ready-to-use and convenient device from the user point of view. PPG sensors can be placed on different anatomical positions, but PPG signal has higher quality at the earlobes or fingertips [
8].
2.3. Related Work
FPGA-based works aiming at emotion identification from EEG signals are emerging in the literature. Fang et al. [
9] implemented a convolutional neural network (CNN) in a Virtex-7 FPGA for emotion detection from EEG signals from six channels. The classifier was integrated in a complete system containing an acquisition headset and a MATLAB program for feature extraction. Two experiments were conducted, one in real time and a second one offline using the DEAP dataset. During the real-time experiment, the system took 450 ms to detect an emotion, from the acquisition node. The offline processing of DEAP dataset resulted in a valence–arousal classification accuracy of 76.67%.
The system proposed in [
9] contributes with a complete execution of the classification process. However, the system is oriented to operate in a laboratory environment, rather than targeting a wearable device for daily use. This is a gap in the literature of emotion recognition, and represents an opportunity to develop a novel FPGA-based system with this scope.
Wearable systems for biosignal acquisition and monitoring with reconfigurable technology were proposed in [
10,
11,
12]. They monitor ECG, EEG, oxygen saturation and motion. However, these systems only acquire signal data to be processed by another computing system and are unable to make real-time decisions.
In [
13], the authors proposed a hardware/software system for acquisition and processing of EEG biosignals. A algorithm based on a convolutional neural network (CNN) is used to improve the classification accuracy. A hardware accelerator is proposed to speed up inference.When executed in a PYNQ-Z2 board with ZYNQ7020 FPGA, the system executes an inference in 0.22 s with 3.1 W of power. The system consumes a large percentage of on-chip memories and cannot be implemented on lower density FPGAs and only considers one type of application.
The system proposed in this paper targets very low-density FPGAs and integrates two types of monitoring signals. The system can be straightforwardly implemented with a soft processor instead of hard processing to target non-SoC FPGAs with reduced power requirements.
3. Proposed Biometric System
The proposed biometric system conceptualized in
Figure 1 comprises two intellectual property (IP) cores implementing a heart rate calculator and an emotion detector.
3.1. Heart Rate Calculator Using PPG
The heart rate calculator algorithm operates over two channels of the PPG signal, the red (RED) and the infra-red (IR), probed by distinct LEDs and photosensors. The computation of the hear rate comprises two main stages: preprocessing and periodicity search of both RED and IR signals. The computational operations included in the first one are the following:
DC mean calculation: a loop over a buffer containing N signal samples computes the sum of their values, and then the average by dividing the accumulated sum by N.
DC mean subtraction: the computed average is subtracted from each channel sample by an iterative loop.
Linear regression calculation: a dot product between the sample set and corresponding shifted sample indexes is computed, then divided by a constant.
Linear regression subtraction: the computed value is multiplied by each shifted sample indexes and subtracted from each channel sample.
Mean square calculation: the sum square of all sample values is calculated and divided by N.
Pearson correlation calculation: a dot product (Equation (
1)) between both channels’ samples is determined and then divided by
N.
The Pearson correlation is a quality metric and denotes the linear association between two variables—in this case, RED and IR channels. Graphically, it measures the feasibility of drawing a line to best fit both data. Values range
, where
and 1 mean, respectively, the strongest negative and positive associations, that is, a perfect linear fit with negative and positive slopes. The absence of the linear correlation corresponds to 0. A correlation besides these key values means a linear association that does not fit all data. In short, the closer the absolute value of the Pearson correlation to 1, the more linear the association between the two variables. The Pearson correlation coefficient
r is calculated using Equation (
1):
where
N is the number of samples;
denotes a preprocessed IR sample;
is the mean value of preprocessed IR samples, which is 0, because of DC removal;
denotes a preprocessed RED sample;
is the mean value of preprocessed RED samples, which is also 0.
A good quality signal must have a Pearson correlation equal or greater than . Otherwise, the sample set is discarded, and a new collection is recorded.
From this stage, the algorithm initiates an iterative process of finding the signal periodicity, via peak detection. In this step underlies the concept of autocorrelation, a function that allows to identify patterns in a signal. More specifically, it consists of the correlation—or similarity—between a signal and its delayed copy. As such, taking into account that PPG is a periodic signal, this property is advantageous to determine heart rate, especially in noisy environments, such as probing data using bio-sensors. Mathematically, the autocorrelation
R at a given delay
m is the sum of the products between each sample (
) and its delayed one (
), over all
N samples of set
X, shown in Equation (
2):
Figure 3 shows the result of computing the values of autocorrelation for all possible sample delays, from 0 to
, where
, and after normalizing the values relatively to the autocorrelation at delay
.
The shift
k corresponding to the index of the closest local maximum matches the number of samples containing a complete heart beat. This peak, marked in
Figure 3 by green, is sufficient to determine PPG signal periodicity. Therefore, pulse period
is calculated multiplying the number of samples
k by the time gap between two samples, that is, sample period
. This way, the heart rate is the inverse of the pulse period, represented in Equation (
3):
where
denotes the sampling rate, inverse of
. This result corresponds to beats per second (
), so the beats per minute (
) are given by Equation (
4):
3.2. Emotion Detector from EEG
The K-nearest neighbors (KNN) algorithm is a supervised learning classifier, meaning that a training set containing multiple input–output data observations determines the inference of the output of an unseen input object, the test set. In practice, KNN maps objects into images, given a collection of previously memorized training object–image pairs (instances). The principle of KNN is to find the K closest memorized instances to the recently observed set of features, in other words, to find the known instances that are the most similar to the feature set to be classified. Once the most suitable instances are assessed, the emotion classes that each instance is associated with are registered. The modal class is declared as the predicted emotion of the queried test set.
Measuring the similarity of training and test sets is the distance between their points, considering that the feature sets can be viewed as arrays. This KNN version uses the method of the Canberra distance, mathematically defined in Equation (
5) as
, where
u and
v denote two points in
n-dimensional space:
The input objects of the classifier are EEG features that are normalized to
. This way, the distances between test and training instances are not biased by a dominant feature. Normalization methods vary, but a common approach is the rescaling from minimum and maximum values, as stated in Equation (
6). There,
x represents the whole feature set to be normalized;
is the
j-th element of the
i-th array of EEG features; and
denotes a normalized EEG feature. The equation applies a linear transformation to the vector space containing the set of EEG features:
In short, to classify an unobserved test instance, the algorithm determines its
K most similar instances from the observed training set. This step implies two tasks: the computation of the Canberra distance,
, between the test and every training instance, and then sorting those distances to obtain the
K shortest distances. The
K training instances that present more similarity with the test instance correspond to the
K shortest Canberra distances. The wider the training set, the more Canberra distances are calculated and compared, and thus the higher the computational cost. Once the
K shortest Canberra distances are found, the corresponding
K training instances are selected to proceed with the algorithm. The next step is to register the emotion classes associated with the selected
K instances, finding the most common class. In other words, the
K training instances vote for a class. The most voted class determines the emotion prediction output.
Figure 4 shows the mapping of emotions into the Russell’s Cartesian model, where emotions are obtained combining three levels of intensities of valence and arousal.
4. PPG IP Core
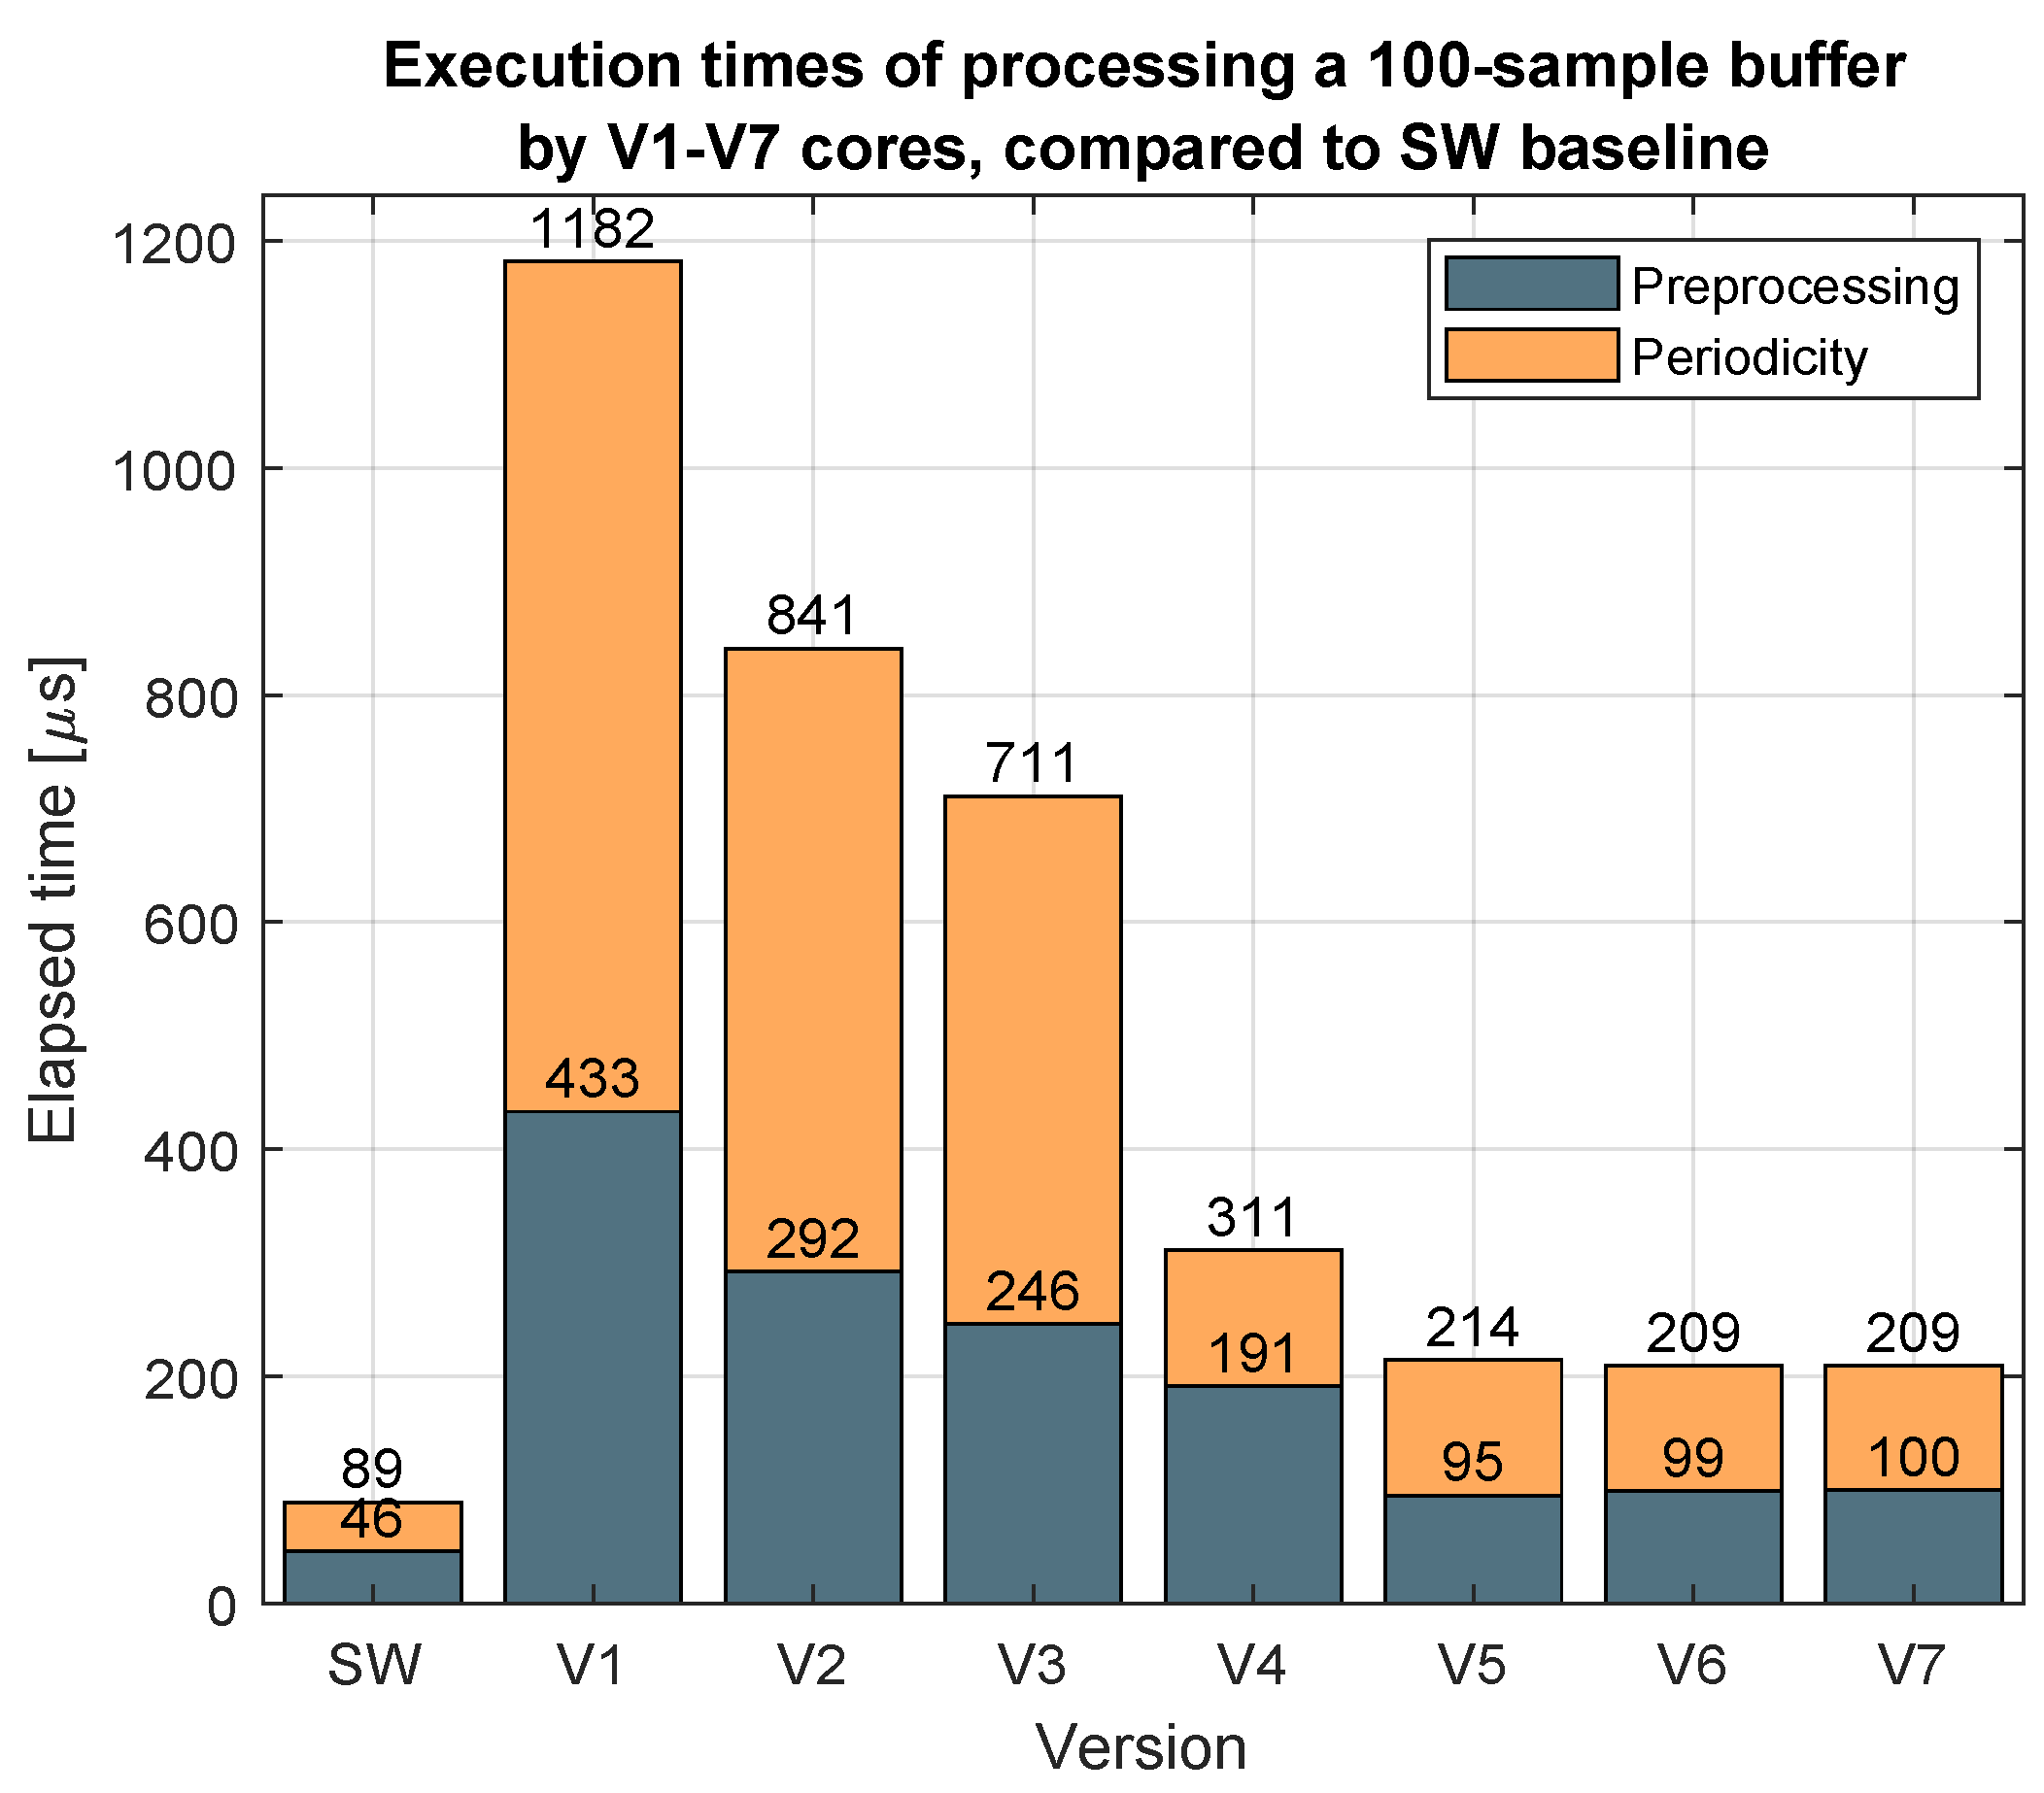
The process of designing the PPG IP core was iterative and involved the development of seven design iterations that gradually incorporated more algorithm functionalities inside the core. The idea was to study the performance improvement as more operations were added or the IP accesses were more efficiently managed. The first version corresponds to a software-only implementation. The final version implements the operations of the preprocessing stage, described in
Section 3.1, and computes autocorrelation values, using programmable logic components. Throughout the process, seven versions were designed.
Figure 5 depicts one of the metrics considered to compare the developed versions, showing the elapsed time of processing a buffer containing 100 PPG samples. The reference is the software-only implementation. The stages of preprocessing and periodicity search can be distinguishable. This figure shows that the gradual inclusion of functionalities inside the core decreases the execution time.
Table 1 presents the improvement added for each design iteration. The features added on each iteration can be summarized as the integration of more operations of the algorithm in hardware and optimizing data transfers to reduce the overall latency.
The design iteration #7 is used in a further design process of defining a finite data resolution such that the resulting error—the difference between exact and optimized values—is acceptable for a given context. Every variable dimension must be specified, as the ultimate goal is to design an optimized hardware solution. Allocating specific word lengths to variables leads to a discrete range of their assigned values. An advantage of this process is finding the optimal balance between both system precision and required hardware resources. Most variables declared in the software implementation, of type float, are now represented by a fixed point. This notation allows to represent a real number with a specific amount of fractional bits and integer bits. It is implicit that a binary point divides both parts, similar to the decimal point used in decimal numbers. A variable can be represented by fixed-point notation as <W,I>, where W identifies the total number of bits and I specifies the number of bits of the integer part. The number of fractional bits corresponds to the difference W-I. In brief, the methodology consists of designing, at first, the pessimistic version that leads to null word length conversion errors. This version is taken as reference from which the number of bits is reduced. This means that every variable is initially assigned a wide number of bits, determined by holding the precision of the arithmetic operations between variables. Multiple versions were created, where most variables were provided, at least, 12, 8, 4, 2 and 0 fractional bits. The evaluation of the impact of progressively neglecting the arithmetic precision, by reducing the word length, can be discussed in terms of errors, resource utilization and execution time.
To assess the accuracy of heart rate detection by the designed versions, the 2015 IEEE SP Cup competition database [
14] was used, containing wrist-type signals. This dataset includes records of eight subjects performing physical activities, namely walking and running. The original dataset with 1.355.776 samples was sampled at a frequency of 125
, and split into 1024-sample sets, resulting in 1324 sets (1.355.776/1024 = 1324). The dataset was processed by the software version and optimized cores. The results showed that the compared versions present similar absolute errors of the computed heart rates. Therefore, precision loss over the fixed-point versions does not interfere much with the final result. More specifically, the least conservative version (0 fractional bits) obtained only 7 results differing from the SW baseline, out of 1324 comparisons. This means that the discarding of the fractional bits by this version led to an accuracy loss of
, when compared to the conservative version. A simpler core design, rejecting fractional bits, is seen as the solution that minimizes the hardware resource usage.
5. EEG IP Core
The objective of creating the EEG IP core is to perform the classification of EEG signals in hardware, without intervention from the CPU. The KNN classifier comprises three main tasks. The first one is the Canberra distance computation, the second one is sorting the computed distances, and the third one is the translation of the shortest distances into a predicted emotion. The candidate tasks to be integrated into a hardware specification are the calculation of distances between test and training instances and the retrieval of the K shortest values. The assessment of the emotion class does not execute significant processing tasks, and thus it may be assured by software-only instructions. This section addresses the implementation of the module that receives instances of feature sets to output the K nearest ones.
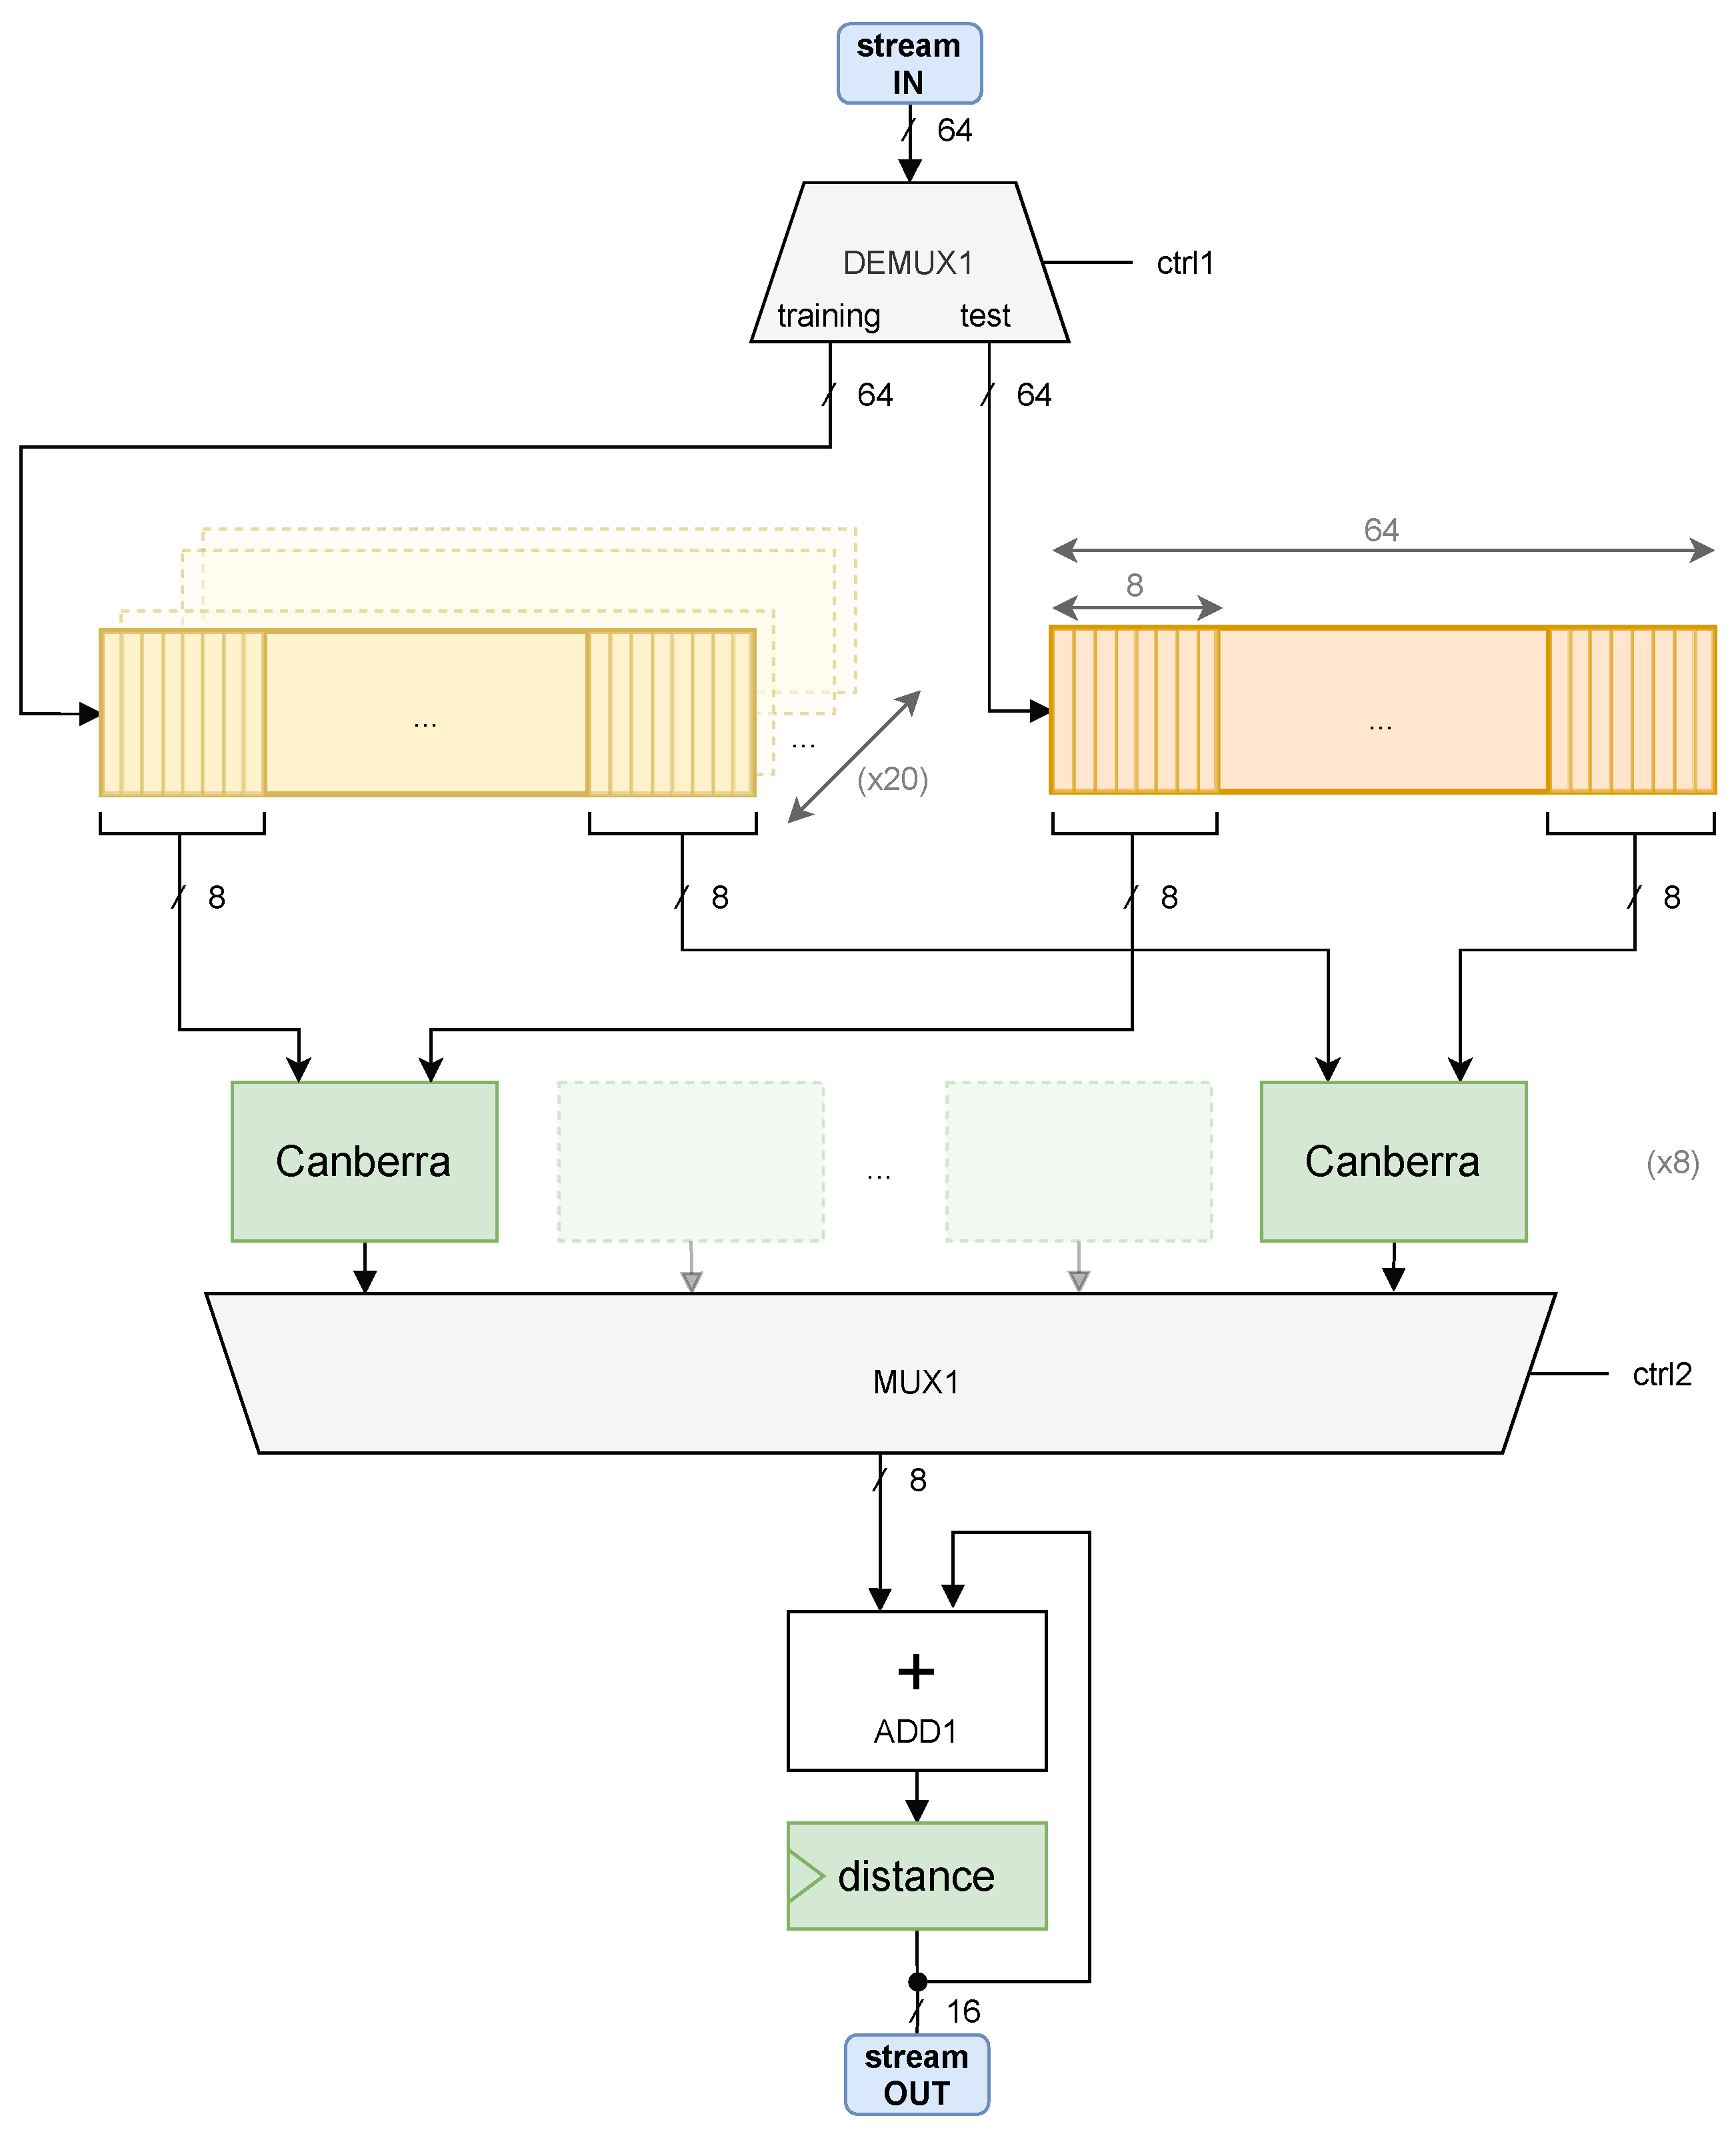
The approach to tackle the problem is to design two independent IP cores implementing each task. This design concept implies that an output channel of the first core is connected to an input channel of the second core. The block diagram of the core,
EEG_CALCDIST, is depicted in
Figure 6. The module that computes distances is simplified by a green box named
Canberra. The diagram allows to visualize the data flowing from the incoming stream channel down to the output port. In the hardware perspective, 8
Canberra blocks are instantiated so that partial distances can be computed in parallel and added to an accumulator.
Canberra boxes implement the computation of a partial distance between two features. In other words, given two arrays, x and y, a partial result is the distance between and , regarding a specific arrays’ dimension i. To obtain a Canberra distance, this box must iterate over two complete test and training arrays. Then, the final result is the sum of all terms.
In more detail, the
Canberra boxes implement the logic written in
Figure 7. It consists of the computation of a partial distance between two features. In other words, given two arrays,
x and
y, a partial result is the distance between
and
, regarding a specific arrays’ dimension
i. To obtain a Canberra distance, this box must iterate over two complete test and training arrays. Then, the final result is the sum of all terms.
The second module of the EEG IP core is the
EEG_SORTDIST, designed to sort the outcome of
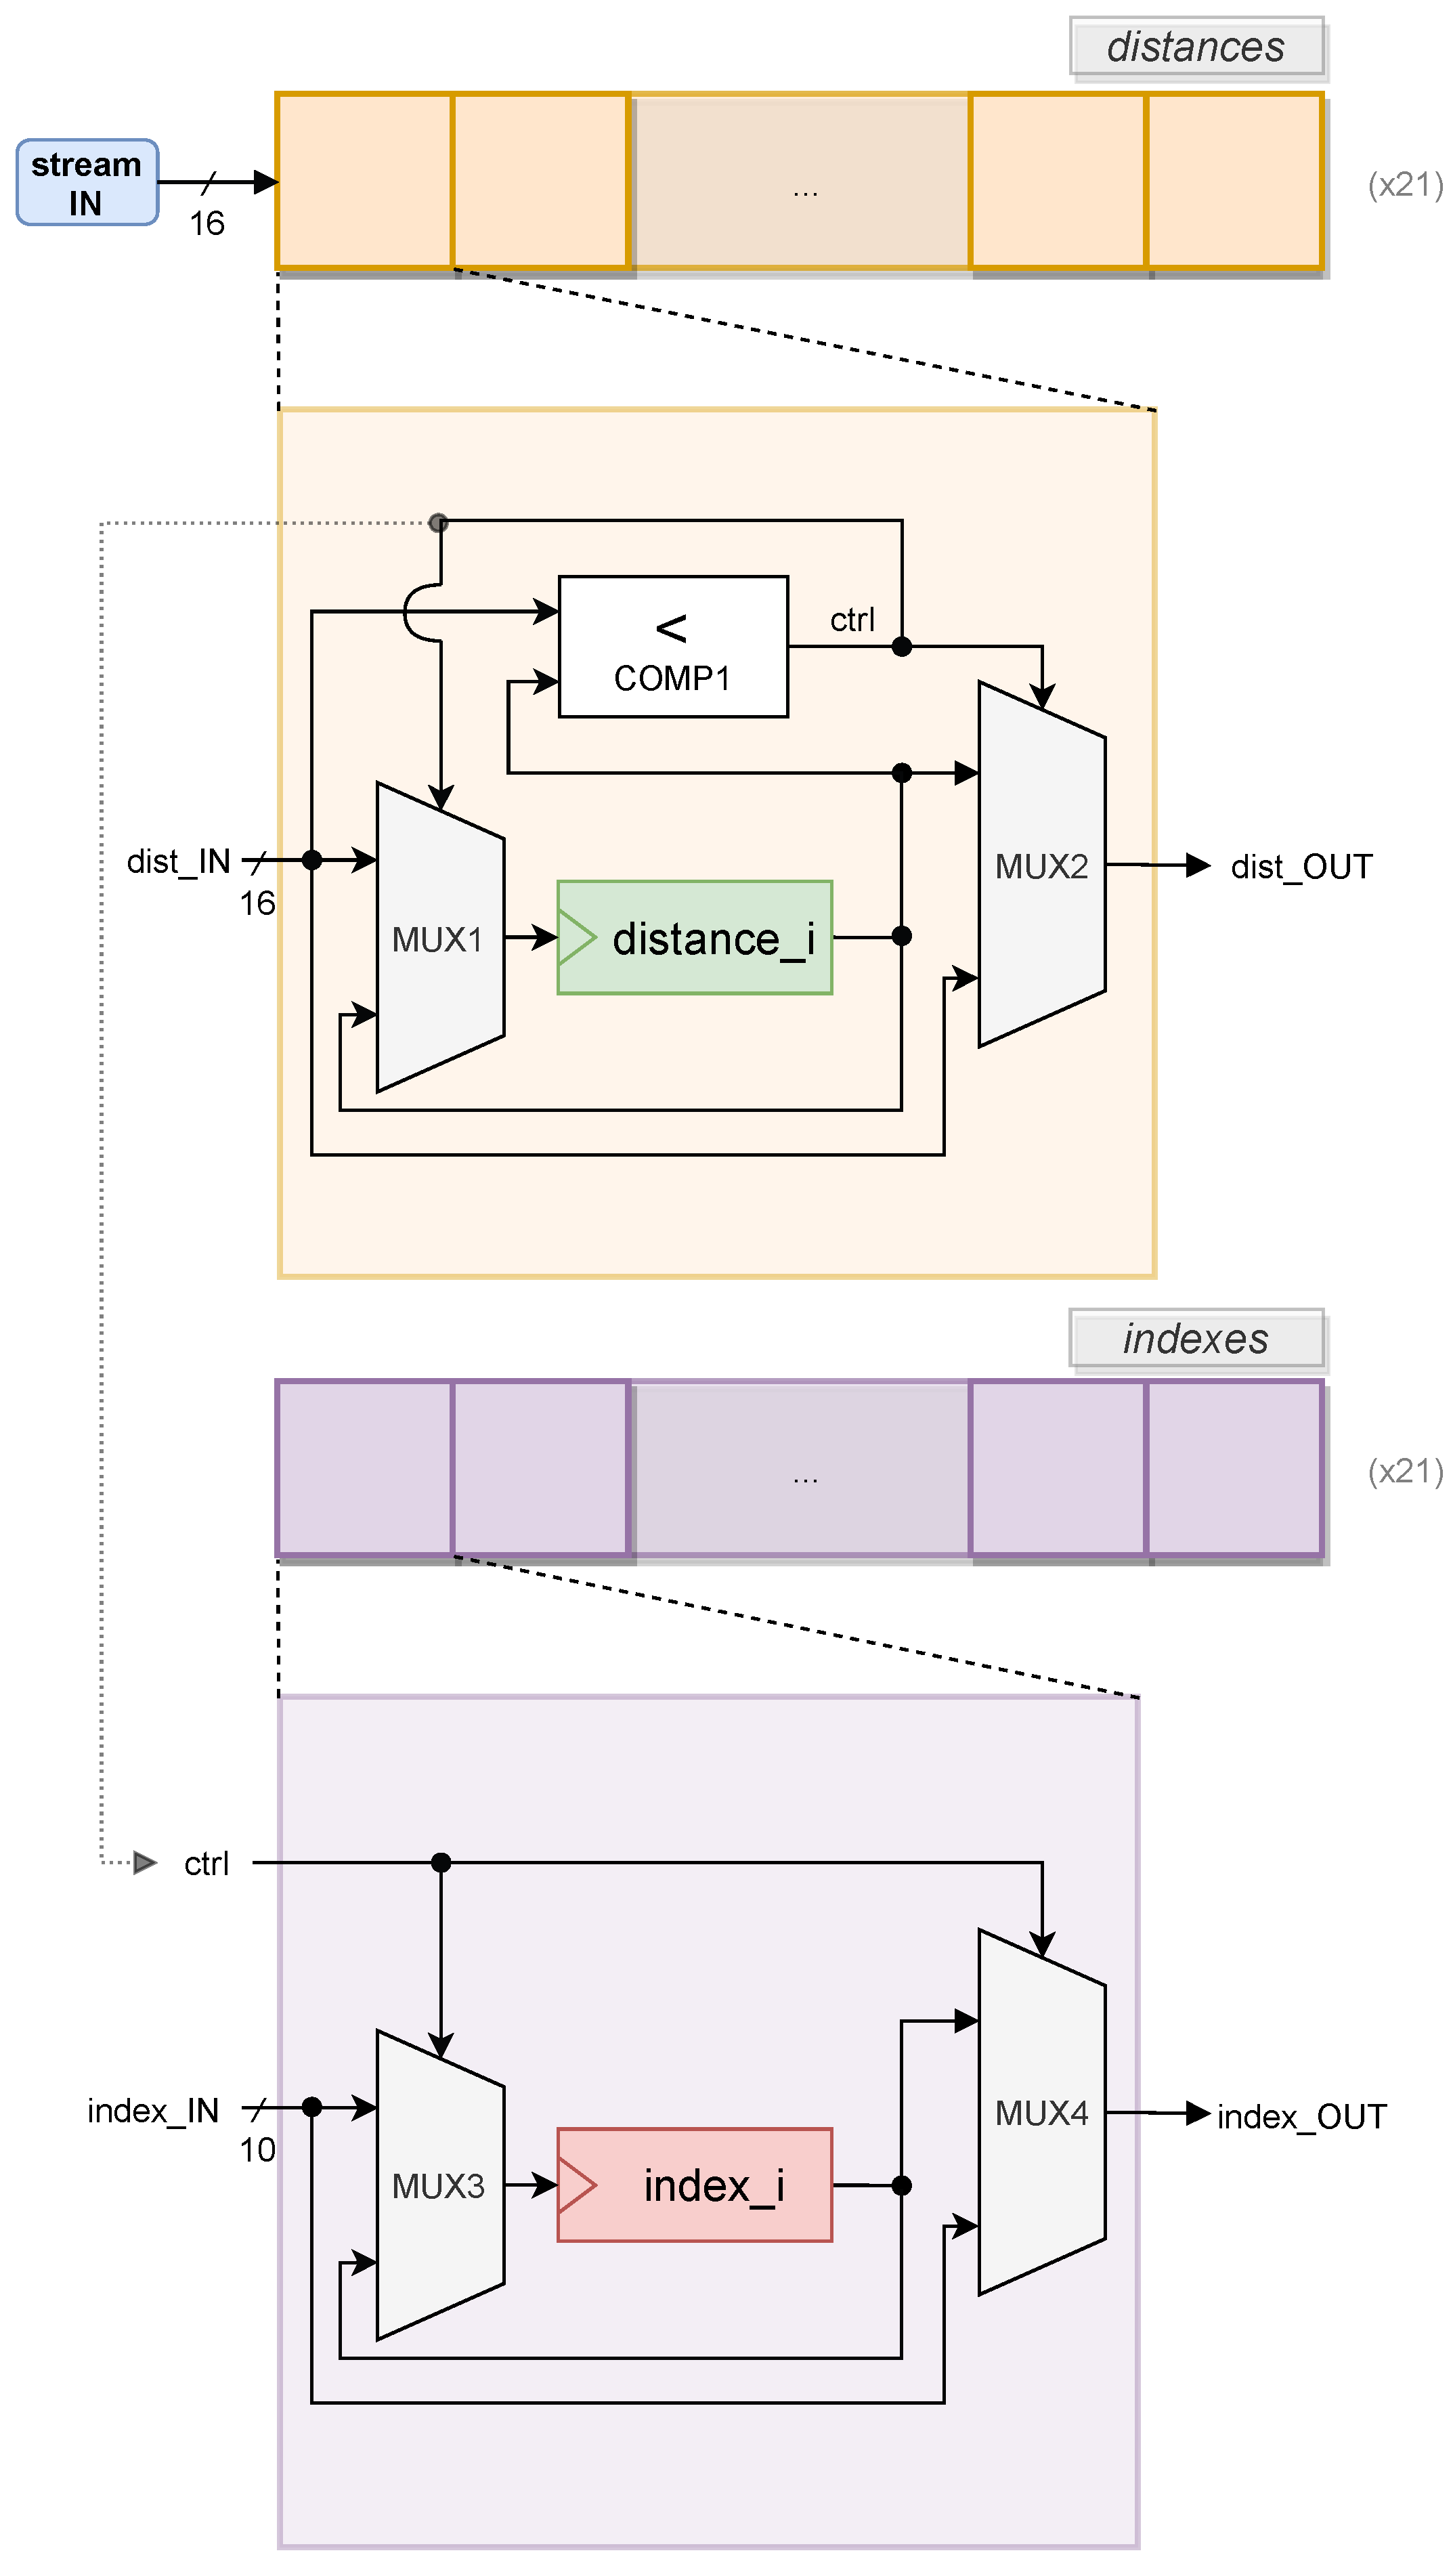
EEG_CALCDIST. A possible method to sort distances is to pass the input values through all memory elements, comparing the distances to the stored values. The idea is to, at each memory address (cell), update or hold the stored value, depending on its comparison to the received value. If the received distance is less than the distance stored at a given cell, the cell is updated. Before being overwritten, the stored value is passed to the next cell. Otherwise, the stored value is held, and the input value is propagated to the next cell, where the logic repeats. This iterative procedure can be seen as a chain, or an array, transferring values between adjacent cells, or elements. This logic guarantees that, for each received distance, a precise number of instructions is executed to complete an iteration of the insertion sort. The design diagram of sort distances core is depicted in
Figure 8.
This provides a graphical view of the datapath that implements the insertion sort of distances and indexes.
In parallel, the control logic represented by
ctrl is also taken to manage
indexes memory, represented by a purple chain, on the bottom half of
Figure 8. Whenever a
distance_i is updated,
index_OUT carries the value stored in
index_i, and
index_i is pushed the value passed by
index_IN. Otherwise,
index_i holds the same value and
index_OUT pushes
index_IN. Once the insertion sort algorithm is completed, the values stored inside each
index_i register are transferred via an AXI4-Lite interconnection.
6. HW/SW Implementation
The proposed system is demonstrated using the ZYBO development board and the custom hardware, which includes designed IP cores. ZYBO is a low-cost board containing the Zynq-7010 All-Programmable SoC, and features a 650 MHz dual-core ARM Cortex-A9 processor.
6.1. Embedded Software
Embedded software targeting the created hardware design is required to coordinate the IP cores with the software instructions and to control specific accesses to the device. The embedded software application is developed using the Vitis IDE tool and run by the processing system. The application coordinates software instructions with IP core calls, being responsible for several tasks, such as the following:
Specifying the memory addresses and IP core interfaces where data is loaded or retrieved;
Enabling data transfers through Direct Memory Access (DMA);
Triggering the execution of the cores;
Executing software-only instructions;
Measuring the execution time of IP cores and pieces of code.
6.2. Block Diagram
A block diagram containing the final arrangement of the involved components inside the biometric system is represented in
Figure 9.
The Zynq’s PS, located at the bottom right of the diagram, is the diagram’s main block. This component is the software interface responsible for managing the data flow between the cores.
The AXI buses are represented by two AXI Interconnect blocks connected to the HP ports of the PS. These blocks establish a bridge between PS and PL ports. In the diagram of
Figure 9, AXI Interconnects link the PS HP ports to the AXI4-Stream port of AXI direct memory access (DMA) blocks located in the PL. Additionally, AXI connects the PS GP ports to the AXI DMA AXI4-Lite ports.
AXI DMA provides a direct high-bandwidth access to the external memory for a AXI4-Stream port. This feature allows to transfer volumes of data without the control of the PS, speeding up data transfers. The block diagram contains two AXI DMA block with different configurations. The bottom one provides a one-way channel to transfer EEG features from the memory to the EEG_CALCDIST IP core via AXI4-Stream. The top AXI DMA block is a two-way channel that allows the transfer of PPG samples from the memory to the PPG IP core but also to return the PPG IP core’s products to the PS.
6.3. Hardware Resources Utilization
The hardware resources consumed by the integrated system are listed in
Table 2. The utilization rates are reported to the available resources of the Zynq-7010 PL. Some observations can be highlighted:
LUTs are the most used resource, with a 51% occupation rate, when compared to FF (30%), DSP (20%) and BRAM (14%);
The EEG_CALCDIST IP core takes 32% of the used LUTs and 31% of the used FFs;
DSPs are only occupied by the PPG IP core;
The three custom IP cores represent 60% of the consumed LUTs, 53% of the FFs, 47% of the BRAMs and 100% of the DSPs, and this shows that DMA and AXI peripherals demand significant hardware resources;
Overall, the Zynq is not fully occupied, which means that further functionalities may be added to the biometric system.
6.4. Acceleration Results
The processing of raw PPG signals by the PPG sub-system comprises two main stages: preprocessing and periodicity search. The first stage is executed by the designed IP core, present at the PL. The second stage is executed by the PS and recurring calls of the IP core.
Table 3 shows the total elapsed time of a complete execution of the PPG algorithm, discriminating the split times of both stages. The times are referred to input PPG signals comprising two buffers of 1024 16-bit samples. These buffers are shared with the channels of an optoelectronic sensor that collects PPG data. The values of the table include the application of
O0 and
O3 optimizations. Regarding the non-optimized versions, the embedded system (
HW/SW O0) outperforms the results of the software-only version (
SW O0). The overall execution time was reduced by 64%, while the preprocessing and periodicity search stages were respectively reduced by 86% and 58%. These values correspond to a speedup ranging between
and
. The
O3 optimization applied to the HW/SW design (
HW/SW O3) increased the overall execution time of the equivalent software-only (
SW O3) by 58%. This is due to the 90% increase in the execution time of the periodicity search stage. However, the preprocessing stage is outperformed, and its execution time reduced by 50% (speedup of 2 times).
The EEG embedded system is a KNN classifier composed by a pair of IP cores, dedicated to the calculation and sorting of Canberra distances between sets of EEG features. Because of the direct connection between first core’s output and second core’s input, the PS does not interact with the results obtained by the first core. Therefore, the measurement of the execution time of calculation and sorting stages is performed jointly. The PS is responsible for assessing the classification given the results produced by the IP cores pair.
Table 4 summarizes the execution times of the processing steps, applied to optimized and non-optimized implementations. The high number of operations to be executed over a memory (training set) containing 1024 sets of 160 EEG features created an opportunity for acceleration via HW. The results show that the HW/SW co-design outperforms the SW-only
O0 baseline by 100 times and the
O3 version by 40. The problem of calculating distances was approached by launching eight instances of
Canberra blocks to execute in parallel the correspondent arithmetic instructions. Moreover, the sorting task was unlocked by the concept of a chain of sorting cells through which data (distances) propagated continuously.
6.5. Prototype Concept
To build an operational prototype, besides the PPG and EEG IP cores, it is necessary to develop an additional block that processes raw EEG signals and obtains EEG features. This block, called “EEG preprocessing”, works as a digital signal processor (DSP) integrated in the PS, for instance. Taking into account that EEG signals are collected by analog sensors, an analog-to-digital converter is also required. Moreover, a connection to the sensors and a connection to a Bluetooth module to support wireless communication must be established. This technology presents low power consumption, being advantageous for transferring reduced data buffers in the proximity of a host computer or mobile phone. Assuming that a user’s heart rate is computed each second and their emotional state is assessed every five seconds, it means that, per second, the following are sent:
In this example, the prototype throughput is bytes per second.
7. Conclusions
The main goal of this work was to design and implement an efficient wearable HW/SW embedded system to accelerate the execution of a heart rate calculator and an emotion classifier. The design process involved several iterations, in which the architecture was improved for performance. Furthermore, it addressed the implementation of an efficient and compact implementation of a kNN classifier.
The classification of a single emotion by the proposed EEG sub-system outperformed the software benchmark by 40 times. However, the results showed that the proposed PPG sub-system executed the preprocessing stage two times faster than the software-only system and performed the periodicity search two times longer.
Regarding the hardware utilization, the proposed biometric system is feasible to be implemented with the resources available in the targeted platform. The occupation of a low-end/low-cost programmable logic device, the Zynq-7010 was only 36%.
There is room for upgrading the developed IP cores and for implementing additional processing modules. The IP cores were designed to be reused in further monitoring systems. The PPG IP core may be integrated in different algorithms besides heart rate calculation. For instance, the specification of the preprocessing task can be exploited in multiple PPG-based applications. Moreover, the EEG IP core is prepared to process data from up to 32 EEG electrodes, supporting the implementation of multi-channel systems in portable devices. This work is a starting point of the development of more complex biometric systems that may offer autonomy, portability and high processing capability for wearable monitoring devices.
Future Work
A possible improvement regarding the EEG sub-system is the development of a processing module of EEG signals. This module would handle the preprocessing stage, which includes noise removal, signal enhancement and decomposing the signal into the major frequency bands to extract the relevant patterns. The preprocessing module returns the EEG features that are loaded into the KNN classifier.
The results obtained by the developed PPG IP core suggest a future improvement of the PPG sub-system. The algorithm’s routine of detecting the peak of PPG signals alternates between control instructions and the computation of autocorrelation values. This behavior explains the deceleration obtained by the PPG IP core. An alternate approach would be to start by tackling the computational tasks necessary to obtain autocorrelation values, followed by the execution of the control instructions. This would allow the execution of the autocorrelation function concurrently and leaving the peak detection for a later stage.
Author Contributions
Conceptualization, M.I.F., H.C.N. and R.P.D.; methodology, M.I.F., H.C.N., R.P.D. and M.P.V.; software, M.I.F. and R.P.D.; validation, M.I.F. and R.P.D.; formal analysis, M.I.F., R.P.D. and M.P.V.; investigation, M.I.F. and R.P.D.; resources, M.I.F., M.P.V. and H.C.N.; data curation, M.I.F.; writing—original draft preparation, M.I.F., R.P.D. and M.P.V.; writing—review and editing, M.P.V. and R.P.D.; visualization, M.I.F. and R.P.D.; supervision, R.P.D., H.C.N. and M.P.V.; project administration, R.P.D.; funding acquisition, R.P.D. All authors have read and agreed to the published version of the manuscript.
Funding
This work was supported by national funds through Fundação para a Ciência e a Tecnologia (FCT) with Reference UIDB/50021/2020 and was also supported by project IPL/IDI&CA/2022/eS2ST/ISEL through Instituto Politécnico de Lisboa.
Conflicts of Interest
The authors declare no conflict of interest.
References
- Jatupaiboon, N.; Pan-Ngum, S.; Israsena, P. Real-time EEG-based happiness detection system. Sci. World J. 2013, 2013, 618649. [Google Scholar] [CrossRef] [PubMed]
- Klem, G.H.; Lüders, H.O.; Jasper, H.; Elger, C. The ten-twenty electrode system of the International Federation. Electroencephalogr. Clin. Neurophysiol. 1999, 52, 3–6. [Google Scholar]
- Russell, J.A. A Circumplex Model of Affect. J. Personal. Soc. Psychol. 1980, 39, 1161. [Google Scholar] [CrossRef]
- Alarcao, S.M.; Fonseca, M.J. Emotions Recognition Using EEG Signals: A Survey. IEEE Trans. Affect. Comput. 2017, 10, 374–393. [Google Scholar] [CrossRef]
- Ilyas, M.Z.; Saad, P.; Ahmad, M.I. A survey of analysis and classification of EEG signals for brain-computer interfaces. In Proceedings of the 2015 2nd International Conference on Biomedical Engineering, ICoBE 2015, Penang, Malaysia, 30–31 March 2015; pp. 1–6. [Google Scholar] [CrossRef]
- Allen, J. Photoplethysmography and its application in clinical physiological measurement. Physiol. Meas. 2007, 28, R1. [Google Scholar] [CrossRef] [PubMed]
- Moraes, J.L.; Rocha, M.X.; Vasconcelos, G.G.; Vasconcelos Filho, J.E.; de Albuquerque, V.H.C.; Alexandria, A.R. Advances in photopletysmography signal analysis for biomedical applications. Sensors 2018, 18, 1894. [Google Scholar] [CrossRef] [PubMed]
- Castaneda, D.; Esparza, A.; Ghamari, M.; Soltanpur, C.; Nazeran, H. A review on wearable photoplethysmography sensors and their potential future applications in health care. Physiol. Behav. 2017, 176, 139–148. [Google Scholar] [CrossRef]
- Fang, W.C.; Wang, K.Y.; Fahier, N.; Ho, Y.L.; Huang, Y.D. Development and Validation of an EEG-Based Real-Time Emotion Recognition System Using Edge AI Computing Platform With Convolutional Neural Network System-on-Chip Design. IEEE J. Emerg. Sel. Top. Circuits Syst. 2019, 9, 645–657. [Google Scholar] [CrossRef]
- Toral, V.; García, A.; Romero, F.J.; Morales, D.P.; Castillo, E.; Parrilla, L.; Gómez-Campos, F.M.; Morillas, A.; Sánchez, A. Wearable System for Biosignal Acquisition and Monitoring Based on Reconfigurable Technologies. Sensors 2019, 19, 1590. [Google Scholar] [CrossRef] [PubMed]
- Alves, A.P.; Plácido da Silva, H.; Lourenco, A.; Fred, A. BITalino: A Biosignal Acquisition System based on Arduino. In Proceedings of the International on Biomedical Electronics and Devices, Barcelona, Spain, 11–14 February 2013. [Google Scholar]
- Joaquim, M.S.; Maçorano, R.; Canais, F.; Ramos, R.; Fred, A.L.; Torrado, M.; Ferreira, H.A. Learning Data Representation and Emotion Assessment from Physiological Data. In Proceedings of the ICASSP 2020—2020 IEEE International Conference on Acoustics, Speech and Signal Processing (ICASSP), Barcelona, Spain, 4–8 May 2020; pp. 3452–3456. [Google Scholar] [CrossRef]
- Xie, Y.; Majoros, T.; Oniga, S. FPGA-Based Hardware Accelerator on Portable Equipment for EEG Signal Patterns Recognition. Electronics 2022, 11, 2410. [Google Scholar] [CrossRef]
- Zhang, Z.; Pi, Z.; Liu, B. TROIKA: A General Framework for Heart Rate Monitoring Using Wrist-Type Photoplethysmographic Signals During Intensive Physical Exercise. IEEE Trans. Biomed. Eng. 2015, 62, 522–531. [Google Scholar] [CrossRef] [PubMed]
- Kastner, R.; Matai, J.; Neuendorffer, S. Parallel Programming for FPGAs. arXiv 2018, arXiv:1805.03648. [Google Scholar]
| Disclaimer/Publisher’s Note: The statements, opinions and data contained in all publications are solely those of the individual author(s) and contributor(s) and not of MDPI and/or the editor(s). MDPI and/or the editor(s) disclaim responsibility for any injury to people or property resulting from any ideas, methods, instructions or products referred to in the content. |
© 2023 by the authors. Licensee MDPI, Basel, Switzerland. This article is an open access article distributed under the terms and conditions of the Creative Commons Attribution (CC BY) license (https://creativecommons.org/licenses/by/4.0/).


