Article

An Efficient Optimized DenseNet Model for Aspect-Based Multi-Label Classification

1
Department of Creative Technologies, Air University Islamabad, Islamabad 44000, Pakistan
2
Department of Computing, Riphah International University, Faisalabad 38000, Pakistan
3
School of Digital Science, Universiti Brunei Darussalam, Jalan Tungku Link, Gadong BE1410, Brunei
4
Department of Information and Communication Technology, University of Agder (UiA), N-4898 Grimstad, Norway
5
Faculty of Computing, Riphah International University, Islamabad 44000, Pakistan
*
Authors to whom correspondence should be addressed.
Algorithms 2023, 16(12), 548; https://doi.org/10.3390/a16120548
Submission received: 4 October 2023 / Revised: 21 November 2023 / Accepted: 23 November 2023 / Published: 28 November 2023
(This article belongs to the Special Issue Machine Learning in Big Data Modeling)

Abstract

:
Sentiment analysis holds great importance within the domain of natural language processing as it examines both the expressed and underlying emotions conveyed through review content. Furthermore, researchers have discovered that relying solely on the overall sentiment derived from the textual content is inadequate. Consequently, sentiment analysis was developed to extract nuanced expressions from textual information. One of the challenges in this field is effectively extracting emotional elements using multi-label data that covers various aspects. This article presents a novel approach called the Ensemble of DenseNet based on Aquila Optimizer (EDAO). EDAO is specifically designed to enhance the precision and diversity of multi-label learners. Unlike traditional multi-label methods, EDAO strongly emphasizes improving model diversity and accuracy in multi-label scenarios. To evaluate the effectiveness of our approach, we conducted experiments on seven distinct datasets, including emotions, hotels, movies, proteins, automobiles, medical, news, and birds. Our initial strategy involves establishing a preprocessing mechanism to obtain precise and refined data. Subsequently, we used the Vader tool with Bag of Words (BoW) for feature extraction. In the third stage, we created word associations using the word2vec method. The improved data were also used to train and test the DenseNet model, which was fine-tuned using the Aquila Optimizer (AO). On the news, emotion, auto, bird, movie, hotel, protein, and medical datasets, utilizing the aspect-based multi-labeling technique, we achieved accuracy rates of 95%, 97%, and 96%, respectively, with DenseNet-AO. Our proposed model demonstrates that EDAO outperforms other standard methods across various multi-label datasets with different dimensions. The implemented strategy has been rigorously validated through experimental results, showcasing its effectiveness compared to existing benchmark approaches.

1. Introduction

Sentiment analysis, also known as opinion mining, has become an increasingly important topic of discussion in various fields. It is crucial in evaluating customer feedback, understanding public opinions, and tracking real-world activities [1]. Analyzing sentiment in textual data allows us to extract valuable insights and to make informed decisions based on the emotions expressed. Several existing sentiment analysis techniques exist, including machine learning-based strategies and lexicon-based approaches [2,3,4]. Machine Learning (ML) methods leverage algorithms and models to automatically classify sentiment, while lexicon-based techniques rely on predefined sentiment dictionaries. These methodologies have been widely used in sentiment classification tasks, offering different advantages and trade-offs depending on the application. In sentiment analysis, classification typically involves binary methods for sentiment polarity (positive or negative) or multi-class methods for categorizing emotions into multiple classes. This distinction sets sentiment analysis apart from other techniques, as it requires specialized approaches to handle the complexity of emotions expressed in a text. This paper proposes a multi-label labeling strategy to categorize emotions, encompassing a diverse range of emotional aspects of the human mind.
The impact of sentiment analysis is evident in various domains. For instance, in one study [5], a multi-task, multi-label classification approach was proposed to integrate attitude categorization using subject tweets and sentiment analysis. Although the sentiment analysis task was framed as a multi-label problem, where multiple emotions could be associated with a single text, the study utilized data that allowed for a wide range of emotional reactions. Similarly, another article [6] classified emotions by categorizing news articles using labels and phrases obtained from a newspaper repository. The potential application of aspect-based multi-label techniques to classify textual data according to mood remains an open question.
An exponential growth in potential label combinations presents a major hurdle in multi-label sentiment analysis. The objective of conventional multi-label learner (MLL) approaches is to enhance the precision and effectiveness of each multi-label learner through the utilization of label associations [7]. These methods can be categorized based on their approach to program development. Some techniques focus on testing various MLLs, assuming that the MLL can predict all labels and incorporate label correlations into the learning process [8,9]. Other methods, such as EPS and RAKEL, rely on ensembles of single learners [10,11]. This proposed work employs an ensemble learning approach, creating a group of learners capable of predicting a single label. These foundational learners are combined to create a multi-label classifier capable of predicting among all labels. The starting point for these learners is often the utilization of label associations with a single label. Figure 1 provides a visualization of the multi-labeling process.
Sentiment analysis, a rapidly evolving field, has gained significant attention due to its relevance in various domains. Traditional approaches in MLL techniques have focused on developing individual MLLs, which may limit the generalization ability of a single learner [13]. To overcome this limitation, ensemble learning methods have surfaced, intending to enhance the overall capability of the learning system. This approach mitigates the likelihood of overfitting and fosters cross-learner creation within a single-label environment [13]. Ensemble learning involves building a cluster of basic MLLs that can collectively predict all connected labels, thereby significantly enhancing the generalization potential of the training approach [13]. This group of learners is referred to as an MLL ensemble [14]. The primary goal of multi-label-based ensemble learning is to develop a network of learners that is both accurate and diverse [15]. It is crucial because the base learners’ collective abstraction capability and diversity are closely related to the ensemble’s generalization flaw. Unlike conventional MLL ensemble methods that combine multiple base pair trainers into a single MLL, multi-label-driven ensemble methods utilize MLL as the foundation of the learning process.
Despite their significance, multi-label supervised methods have received little attention in this context. Creating a collection of precise and diverse base solutions suitable for multi-label situations presents several challenges. One of the key research obstacles in this field involves the conventional ensemble learning methods, which mainly address challenges related to single-label learning. However, in multi-label scenarios, the most difficult task lies in assessing the reliability of the multi-label base learners, as it demands thorough comprehension of the interrelationships between different types of labels. Differentiating between diverse label learning within a multi-label context poses challenges since the behavior of the base learners depends on the entire set of labels rather than a single term [15].
This paper presents a unique methodology that leverages an evolving ensembler [16] and employs multi-label categorization on textual data, thereby attaining consistent enhancements in precision. The proposed method addresses the challenges previously encountered in multi-labeling text data. By incorporating a genetic algorithm with a support vector machine, improvements in various performance measures, including precision, have been observed. The suggested research demonstrates that merging DenseNet with the Aquila Optimizer (AO), i.e., the proposed method, yields promising results by significantly increasing quality performance while maintaining reasonable cost [16]. To further validate the study, comparisons are made between the newly developed model and five other classifiers, including stable discriminant analysis, decision tree, Convolutional Neural Network (CNN), maximum entropy, random forest, and generalized linear model. These comparisons confirm the superiority of the suggested methodology over all benchmark techniques [16]. The contributions are listed below in alphabetical order.
  • Introducing a novel approach that utilizes aspect-based multi-label classification for accurately classifying emotions in textual data, enabling more granular sentiment analysis.
  • Comparative Analysis of Sentiment Classification Techniques: Conducting an extensive analysis to compare the effectiveness of different sentiment classification techniques in categorizing emotions, providing insights into their suitability for multi-label sentiment analysis tasks.
  • Evaluation of State-of-the-Art Algorithms: Assessing the performance of five advanced multi-label classification algorithms on diverse emotion-based textual datasets, offering a comprehensive understanding of their strengths and weaknesses in handling multi-label sentiment analysis.
  • Introduction of Ensembler: Presenting the approach called Ensemble of DenseNet based on AO (EDAO) technique, which enhances the accuracy and variation of multi-label sentiment analysis models by integrating accuracy and diversity, offering a new perspective on multi-label instruction approaches.
  • Development of Comprehensive Workflow: Establishing a comprehensive workflow that incorporates preprocessing, feature extraction, and model tuning techniques, elevating the performance of sentiment analysis models and ensuring the use of refined and precise data.
  • Experimental Validation and Performance Comparison: Extensive experiments are being conducted to validate the effectiveness of the proposed EDAO approach. These experiments involve comparing the approach with existing benchmark methods and showcasing its superior ability to capture sentiment variations and handle complex multi-label datasets.
These contributions significantly advance the field of multi-label sentiment analysis by introducing innovative approaches, conducting thorough evaluations, and providing valuable insights into sentiment classification model performance.
The following is a breakdown of the manuscript’s structure. Section 2 contains relevant work on MLL by other scholars in the area. The specifics of our conceptual framework for aspect-based multi-labeling, which utilizes a DenseNet-based ensembler, are described in Section 3. Section 4 describes the general framework. Section 4 of the study thoroughly presents the experimental results collected. Section 5 concludes with a summary of the findings and recommendations for further research.

2. Related Work

New frameworks are made to gain information from various sources, with the information source numbers (for instance, pictures, text, and recordings) being utilized in AI. Examples of such applications include the semantic annotation of images, the categorization of text, and the semantic annotation of photographs and videos. Conventional single-label-based ML algorithms are unsuccessful in these situations.

2.1. Transformation-Based Schemes

Issue transformation algorithms, as the name suggests, tackle a labeling classification problem by breaking it down into multiple single-label multi-class classification tasks. During the training phase, data from label training is transformed into single-label training data. Various popular ML techniques are then used to train a single-label classifier. In the testing phase, the method generates numerous single-label predictions for each case in the testing set, repeating this process for each instance. Among the approaches in this category, the simplest is the “one vs. the rest” approach, which decomposes a multi-label class imbalance into several single-label classification problems. In this approach, each dataset instance is assigned to a single label or the remaining labels within the group based on available information. The availability of information serves as the foundation for decision-making. A closely related technique is Binary Relevance (BR), which transforms a multi-label classification challenge into instances that either belong to one of the labels or have no affiliation with any label. While this approach effectively reduces the number of possible solutions, it assumes label independence, disregarding potential connections between labels. The BR learning model implicitly assumes label independence, overlooking the fact that labels may depend on more than just a single label in the training examples. Classifier Chains (CC) [17], on the other hand, is a novel method that classifies whether an instance belongs to a single label within a chain-like structure. It is an extension of the BR approach but can more accurately capture the interdependencies between each pair of labels.
Deep learning methods, often utilized in video and audio processing, have been demonstrated to learn language processing and picture processing from text repositories and text vectors in neural networks (NNs) [18,19,20,21,22]. CNN has played a vital role as a particular type of NN and is currently at the center of several profound learning applications. CNN has been used to analyze feelings in tweets and film reviews and to categorize news data [23,24]. The author in [25] offers a multi-label strategy based on layered aggregation, incorporating various approaches. The initial step, as demonstrated in [26], involves binary classification concerning the labels to illustrate the concept. Firstly, regardless of whether the input example possesses a specific label, all output data from the binary classification is initially stored in the original input space. Subsequently, these outputs are paired with their corresponding labels. A meta-classifier determines which marks are displayed at the second level in the stacked output. The meta-classifier numbers correspond to the number of labels, and the meta-classifier at the top of the second level chooses a particular label. Ultimately, the results of the second phase of the binary classification are the ultimate results of the sample. It is important to note that the main difference between the binary meaning models [27,28] is that the latter utilizes predicted labels for training, while the former employs ground truth labels. The author of [29,30] describes a unique technique for stacking features for a meta-classifier that uses base labels for most of the learning algorithm and may include findings from any step into the training and testing outcomes (e.g., use or rule). Calibrated label ranking is a viable approach for transforming an unplanned multi-label classification problem into a label rating solution, enabling the distinction between relevant and irrelevant labels [11].
The label space is changed by utilizing a new domain adaptation approach in place of the data. This process is referred to as the Labeled Power (LP) group method, where every example is categorized as a power set within the label space transformation (subset) [31]. It is possible to categorize instances in the dataset using power sets, which combine many labels. New labels should be provided to integrated power sets to classify examples in the dataset. Because they contain all possible label subsets, LP learning has the advantage of considering label correlations; however, because the label subsets can be quite large, this technique is computationally expensive. To avoid sampling the labels that do not happen regularly, the label set’s minimal frequency of recurrence is specified by the prune transformation (PT). In [32], the author created a PT-based multi-label approach for feature selection, which was later adopted by the community to increase the classification performance (PT + MI).
Additionally, the X2 statistic, combined with PT (PT+CHI), is utilized to identify the essential characteristics [33,34]. As a result of a transformation issue, such as a deficiency of class labels and the loss of several other classes, the difficulty of transformation may, however, raise further concerns in the future. To handle multi-label problems, the algorithm adaption technique calls for a change in the current classification algorithm. Table 1 outlines effective methods for transforming the situation.

2.2. Adaption Algorithm

The second category of ML approaches involves procedure adaptation methods. These ML adaptation methods go beyond traditional feature selection techniques and encompass both classification and optimization approaches. In these methods, features are evaluated using multivariable scores or other measures, enabling ML to assess the significance and relevance of each feature in various ways [34,35]. This selection of ML features aims to identify the optimal subset of features, considering their importance and consistency. One specific approach is the evaluation of Relief characteristics, which is based on detecting variations in feature values among the most similar pairs of instances. For instance, when a variation in functionality is observed between similar pairs, the number of relevant characteristics decreases (a ‘hit’). Conversely, in cases where dissimilar class values are encountered within a comparative instance pair, the feature scoring increases (a ‘miss’) if feature differences are detected. Relief-based methods encompass various adaptations for multi-label classification. One such adaptation is the submission of Relief for multi-label classification based on previously adjusted probability estimates [36]. Another modification involves considering the closest instances with the same labels but different values [37]. In [38], a method was introduced that incorporates a Hamming distance-dependent differential function.
Algorithm adaptation approaches, as opposed to problem transformation approaches, which act as wrappers around standard ML methods, modify existing ML techniques to handle multi-label classification problems. BR-K-Nearest Neighbors (BRkNN) [39] is a hybrid technique incorporating approaches for producing BRkNN from both ML and kNN. The author of [40] used MLkNN to assess the appropriate set of labels for this model’s inclusion in the model evaluation based on the maximization of a testable prediction. Neural models were employed to identify which label collection corresponded to a specific study instance. The NN model is another ML model. Ref. [41] suggested adjusting a fluid, adaptive resonance map for the NN to make the technology presented suitable for the classification of the machine.
Mutual information is a frequently used measure in multi-label learning. Two techniques commonly employed to calculate this mutual information are Label Combination (LC) and One by One (OBO). In the case of OBO, it sequentially evaluates each label, calculating the sum of individual scores between each feature and each label. OBO has been combined with sequential forward selection, as seen in [12]. On the other hand, Conditional Mutual Information (CM) considers all labels simultaneously, offering a ranking that considers experiences with all labels or a limited number of them. CM was integrated with sequential forward selection in a related context in [42].
Optimization approaches frame the task of ML feature selection as a constrained optimization problem, which can be addressed using various methods. These methods often aim to balance the performance and utility of the selected subset of features. This approach is advantageous because it eliminates the need to specify the number of features required in the selection process. However, the user may need to explicitly define the subset’s size in a subsequent filtering operation. It’s worth noting that these algorithms are often associated with high computational costs. In traditional classification, Quadratic Programming Feature Selection (QPFS) [43] is widely regarded as the standard method. Similarly, in the context of multi-label classification, Ref. [44] adopted a similar approach, considering each label independently. Additionally, Ref. [45] employed regularization techniques to achieve a sublinear convergence rate.

2.3. Ensemble Methods

Ensemble methods, a prevalent strategy in multi-label grading, combine multiple ML models to improve overall performance. These methods build upon fundamental techniques like issue conversion and algorithm adaptation, essential for developing hybrid approaches in ML categorization, particularly in multi-label scenarios. However, the label-exact process within the training set presents challenges. Firstly, it lacks anticipation of specific label sets, demanding flexibility. Secondly, as label numbers grow, computational complexity escalates exponentially, a significant concern for conventional methods. To address the first issue, an innovative approach employs an ensemble of classifiers with an M-label power pack. This approach treats each label in the subset as an individual class, enhancing adaptability and classification accuracy. To tackle the second challenge, an ensemble of classifiers processes average binary options, providing final predictions for labels exceeding a predefined threshold [46]. The random allocation of classifiers introduces variability for improved results. Another method, the Ensemble of Classifier Chains (ECC), described in [47], uses random trainers. When replacement data are unavailable, a bagging method gathers samples from the existing dataset [48,49,50], potentially enhancing predictive performance without replacement data. Table 2 discusses the comparison of literature methods.

3. Proposed Methodology

In the proposed work, the following stages are conducted: data collection, preprocessing, aspect/feature extraction, representation of word2vec, and implementation of the swarm ensembler, as depicted in Figure 2.
Data gathering begins with site scraping and online repository access, which yielded the dataset utilized in this paper. Another crucial step is the analysis of the data. It is imperative to refine the acquired data thoroughly. Secondly, the raw, unclean data undergo a preprocessing stage, during which it is refined and formatted in preparation for subsequent accurate processing. Thirdly, we extract and compare the features (aspects) of the enhanced data. We were working with aspect-based labels and multidimensional data, which can be challenging and prone to various interpretations. Fourthly, we employed the word2vec tool to generate data vectors, serving as a tool for data representation. Before the multi-labeling application, the data undergo training utilizing the suggested method known as EDAO. Subsequently, an analysis is conducted. The following sections of this article provide a detailed elucidation.

3.1. Dataset Collection

The evaluations are gathered using a web data extraction approach, and specifically collected data are taken through the Kaggle website. To achieve nominal scaling, we propose utilizing a novel data format and evaluating correlations between labels. To assess EDAO’s effectiveness, we carefully selected eight substantial datasets for text labeling from the Kaggle collection [51,52,53]. To determine the diversity of the proposed SEn, benchmark datasets from various application domains are being utilized to evaluate the proposed EDAO. According to these datasets, texts are categorized into several categories, including emotions, movies, medical, and hotels.
Table 3 provides an overview of the characteristics of multi-label datasets, each containing 1000 instances. These datasets are designed to represent various protein types and include six labels, each corresponding to different protein classes.
To clarify the relevance of the dataset section, it is important to note that these datasets were carefully chosen due to their direct applicability to sentiment analysis and their representation of diverse subject areas. Including datasets spanning different domains is instrumental in evaluating the generalizability and robustness of the proposed EDAO algorithm. For instance, the hotel dataset focuses on textual data from the hospitality industry, allowing the algorithm to comprehend sentiments expressed in hotel reviews. Conversely, the medical dataset deals with biological texts, facilitating sentiment analysis within medical literature and healthcare-related content. The movie dataset comprises textual data from the film industry, enabling the algorithm to gauge sentiments expressed in movie reviews and discussions. On the other hand, while also textual, the protein dataset delves into protein classification, presenting unique sentiment analysis challenges. Similarly, the automobile dataset provides a collection of text related to automobiles, facilitating sentiment analysis in the context of car reviews or vehicle-related discussions. As previously mentioned, the emotion dataset serves as a benchmark dataset, covering a wide spectrum of emotions and allowing the algorithm to detect and analyze sentiments across various emotional states. Incorporating datasets like the bird and news ones further broadens the evaluation scope, encompassing additional domains where sentiment analysis is valuable. These datasets empower the algorithm to comprehend sentiments expressed in texts related to ornithology or news articles. By encompassing datasets from diverse application domains, the evaluation of the proposed EDAO algorithm becomes more comprehensive and meaningful. This approach ensures that the algorithm’s performance is scrutinized across a wide range of textual data, leading to a more reliable and robust assessment of its effectiveness in sentiment analysis.

3.2. Preprocessing of Data

Data preprocessing is a method for converting data collected into a convenient format. The raw data are converted into structural data at this step. There may be blank lines and blank columns for data obtained from scrapping. The data are then examined using the Panda library, which is only utilized to save pertinent data.
Comprehensive preprocessing is essential for multi-labeling as it directly impacts the success rate of a project. The presence of missing attributes or anomalies, outliers, null values, or incorrect information in the data renders it impure. If any of the variables mentioned above occur, the trustworthiness of the findings would be undermined. In this work, we explore the complex problem of recognizing and classifying different features or dimensions in textual data. This particular type of multi-labeling goes beyond a general categorization strategy and attempts to give several labels to various textual elements. We use a number of methods to do this, concentrating especially on tokenization and lemmatization.
Tokenization: To implement aspect-based multi-labeling, detailed comprehension of the text is necessary, broken down into smaller components called tokens. Tokens encompass not only single words but also crucial phrases or components that aid in pinpointing particular details inside the text. Tokenization is the first stage of deconstructing the text, making it easier to analyze each component in more detail.
Lemmatizing: It is essential for standardizing word representation since aspect-based multi-labeling is subtle. We establish a consistent framework for comprehending various kinds of expression connected to each feature by breaking words down into their basic or lemma forms. This guarantees that differences in word forms do not impede the proper labeling of particular characteristics.

3.3. Feature Extraction

Words are converted into functional vectors at the network’s first level to provide semanticized and structural word data. Vocabulary Word consists of Vwords. The lexicon of a character in Vcharr is reflected. Every sentence containing n words supplies the vectorization of wn (each word) (w1, w2, w3, … wn).
V n = r w o r d , r w c h a r
The variable rwchar is for the character level, whereas the variable rword is for the implantation of the word level. The acquisition of semantic and syntactic information typically involves words, while character-level insertion aims to capture morphological and structural details.

3.4. Word2Vec Representation

Word2vec, a potent NLP technique, utilizes vector functions to decode the complexities of language. With a rich text corpus, it employs NNs to gain profound linguistic insights. It autonomously extracts location characteristics even from brief text snippets. This versatile tool excels with short text or single words. Leveraging extensive text data and word2vec’s capabilities enables efficient word generation and seamless navigation of vast datasets. Deep learning primarily focuses on words and their meanings, making word2vec a valuable asset for tackling word meaning-related challenges. Word documents are transformed into vectors for training. Within word2vec’s intricate framework lie three million words intricately connected. Exploring relationships between terms becomes effortless in this expansive linguistic landscape.

3.5. Swarm-Based Ensembler

The swarm-based ensembler that is currently available in the literature is discussed in this section.

3.5.1. DenseNet Classification

Through this research, we aim to develop a classification system for categorizing aspects based on multi-labeling from a dataset. A robust CNN classifier is meticulously constructed to classify the labels within a dataset and to extract meaningful features from the data. This endeavor necessitates the utilization of two formidable deep-learning libraries: Torchvision and PyTorch. Torchvision, a pre-trained data learning model, empowers the process by endowing maximum control against overfitting while simultaneously enhancing the optimization of outcomes right from the outset. A five-layer dense block is defined as a consequence of the computation carried out by the network using the DenseNet block architecture illustrated in Figure 3 and a growth rate of L = 5. It is vital to recognize that the number 121 in DenseNet-121 denotes that the NN has 121 layers. A typical DenseNet-121 composition consists of several different layers that are combined. A total of five convolution and pooling layers are used, as well as three transition layers (6, 12, 24, and 48), two DenseBlocks (11 and 33) convolutions, and one classification layer (16). DenseNet supports feature reuse, reduces the number of parameters, and enhances the model’s performance for multi-label classification and classification accuracy.

3.5.2. DenseNet Mechanism

The distinguishing essence of DenseNet lies in its foundational concept of feed-forward networks, bestowing upon it a prominent edge over other network architectures. DenseNet offers a plethora of enthralling advantages. First and foremost, DenseNet helps to mitigate the vanishing-gradient issue. Furthermore, DenseNet exhibits its prowess by intensifying the propagation of features, fostering their regeneration, and effectively reducing the parameter count. It is achieved through the unique mechanism of a dense layer, which elegantly consolidates the outputs from preceding layers by concatenating them along the depth dimension. Figure 4 depicts the function of a DenseNet process, which combines transition layers and dense blocks to categorize an input review depending on its content. When a text is supplied as input to the DenseNet, the text is processed through many dense blocks. Each layer’s feature maps remain the same from layer to layer except for the number of filters, which change from layer to layer within a single dense block. Upon traversing a dense block, data moving within DenseNet progress to the next stage, the transition layer.
Within the architectural framework of DenseNet, the transition layer assumes the crucial responsibility of executing two fundamental operations: convolution and pooling. These operations are diligently performed in the downsampling procedures strategically positioned outside the dense blocks. To ensure the harmonization of feature map lengths within the dense block before concatenation, a convolution layer can be incorporated before each convolution. In the realm of the DenseNet architecture, the transition layer encompasses diverse components, including batch normalization (BN), as well as other essential elements like average pooling layers and convolution layers, all working together to optimize computational efficiency and to minimize the number of input feature maps.
Figure 4 depicts the DenseNet flow chart. The DenseNet design’s dense block comprises a layer of BN, ReLU activation, and convolution, all accompanied by convolution. After the last dense block, an average global pooling layer is performed, and the results are sent to a Softmax classifier.

3.5.3. Multi-Objective Optimization Solution

After evaluating the initial classifier for consistency and complexity, the next step involves optimization, a multi-objective problem-solving process similar to standard optimization in conventional machine learning. This optimization process aims to convert optimal labeling into unique objective efficiency using the weight-sum method. However, it is important to note that this approach is susceptible to weight shifting due to the trade-off between the ensemble’s generalization ability and the two objectives. To address this challenge, we have implemented the AO [54], a swarm-based multi-objective optimization method, which systematically explores optimal trade-offs within a swarm population, effectively managing multi-objective reduction complexities without compromising generalization. Our paper introduces the AO as a novel technique inspired by the natural hunting behavior of Aquilas. The AO algorithm employs four strategies: soaring high for exploration, gliding and attacking to explore diverging search spaces, gradually descending to exploit converging areas, and diving by foot to capture insights. These diverse approaches synergize to unlock the algorithm’s optimization potential, as shown in Figure 5.
EDAO excels in improving both accuracy and variation in sentiment analysis, especially in multi-label datasets where multiple sentiments need predicting.
It achieves this by generating diverse base learners, each skilled in capturing different sentiments, enhancing its ability to understand nuanced variations in sentiment across texts. The results consistently demonstrate EDAO’s superiority over benchmark schemes and individual learning methods, with higher precision, recall, F1-score, and accuracy across various datasets. EDAO’s success is attributed to its utilization of DenseNet-AO, a specialized variant designed to target diversity-related objectives, setting it apart from methods that may not explicitly consider diversity. Furthermore, EDAO offers a sensitivity analysis, quantifying the uncertainty and variability in its decision-making process, highlighting its reliability and consistency. The AO’s is used to find the optimal parameters for the DenseNet algorithm, as shown in Algorithm 1.
Table 4 succinctly outlines EDAO’s unique features that distinguish it from other multi-label learning techniques and the benefits they bring. EDAO stands out for its integration of accuracy and diversity in the optimization process, enhancing both precision and variation in sentiment analysis. Notably, it employs DenseNet-AO, a specialized variant, to target diversity-related objectives, setting it apart. The table underscores EDAO’s superior performance compared to benchmarks and highlights its use of sensitivity analysis for assessing reliability. The pseudocode of the proposed model is provided in Algorithm 2.
Algorithm 1 Aquila Optimizer for DenseNet parameters.
1:
Input: Population
2:
Output: BestParametersFound
3:
Initialize Population
4:
EvaluateFitness(Population)
5:
generation ← 0
6:
while not TerminationCriteriaMet do
7:
      selectedParents ← SelectParents(Population)
8:
      offspring ← CrossoverAndMutate(selectedParents)
9:
      EvaluateFitness(offspring)
10:
      nextGeneration ← SurvivalSelection(Population, offspring)
11:
      UpdateParameters(nextGeneration)
12:
      generation ← generation + 1
13:
end while
14:
return BestParametersFound
1:
function EvaluateFitness(Individual)
2:
      Calculate objectiveFunctionValue using TrainAndEvaluateDenseNet(Individual)
3:
      Calculate fitness ← 1 / (1 + objectiveFunctionValue)
4:
      Update Individual.fitness and Individual.objectiveValue
5:
end function
1:
function TrainAndEvaluateDenseNet(Parameters)
2:
                                        ▹ Train DenseNet and evaluate on validation set
3:
                                         ▹ Return objective function value (e.g., validation loss)
4:
end function
1:
function SelectParents(Population)
2:
                                   ▹ Use a selection mechanism to choose individuals for reproduction
3:
end function
1:
function CrossoverAndMutate(Parents)
2:
                             ▹ Apply crossover and mutation to generate offspring from selected parents
3:
                                               ▹ Return new population of offspring
4:
end function
1:
function SurvivalSelection(Population, Offspring)
2:
                                           ▹ Combine current population and offspring
3:
                                          ▹ Select individuals to survive based on fitness
4:
                                           ▹ Return next generation of individuals
5:
end function
1:
function UpdateParameters(NextGeneration)
2:
                                    ▹ Update parameters of individuals in the population
3:
end function
Algorithm 2 Proposed model algorithm (pseudocode).
Require: Data (Input data for sentiment analysis)
Ensure: SentimentResults (Output Classification results)
1:
procedure CollectData                                ▹ Implementation details for collecting data
2:
end procedure
3:
procedure PreprocessData(Data)
4:
      PerformPOSTagging(Data)
5:
      LemmatizeData(Data)
6:
      PerformPOSTagging(Data)
7:
end procedure
8:
procedure ExtractFeatures(Data)                         ▹ Implementation details for feature extraction
9:
end procedure
10:
procedure GenerateWordVectors(Features)                    ▹ Implementation details for word vector generation
11:
end procedure
12:
procedure TrainModel(WordVectors)
13:
      InitializeModel
14:
      FineTuneModel(WordVectors)
15:
      OptimizeModel(AquilaOptimizer)
16:
end procedure
17:
procedure EvaluateModel
18:
      CalculateAccuracy
19:
      CalculateRecall
20:
      CalculateFscore
21:
      PerformSensitivityAnalysis
22:
      CalculatePrecision
23:
      MeasureComputationalComplexity
24:
end procedure
25:
SentimentResults ← AnalyzeData(Data)

4. Simulation Results and Discussion

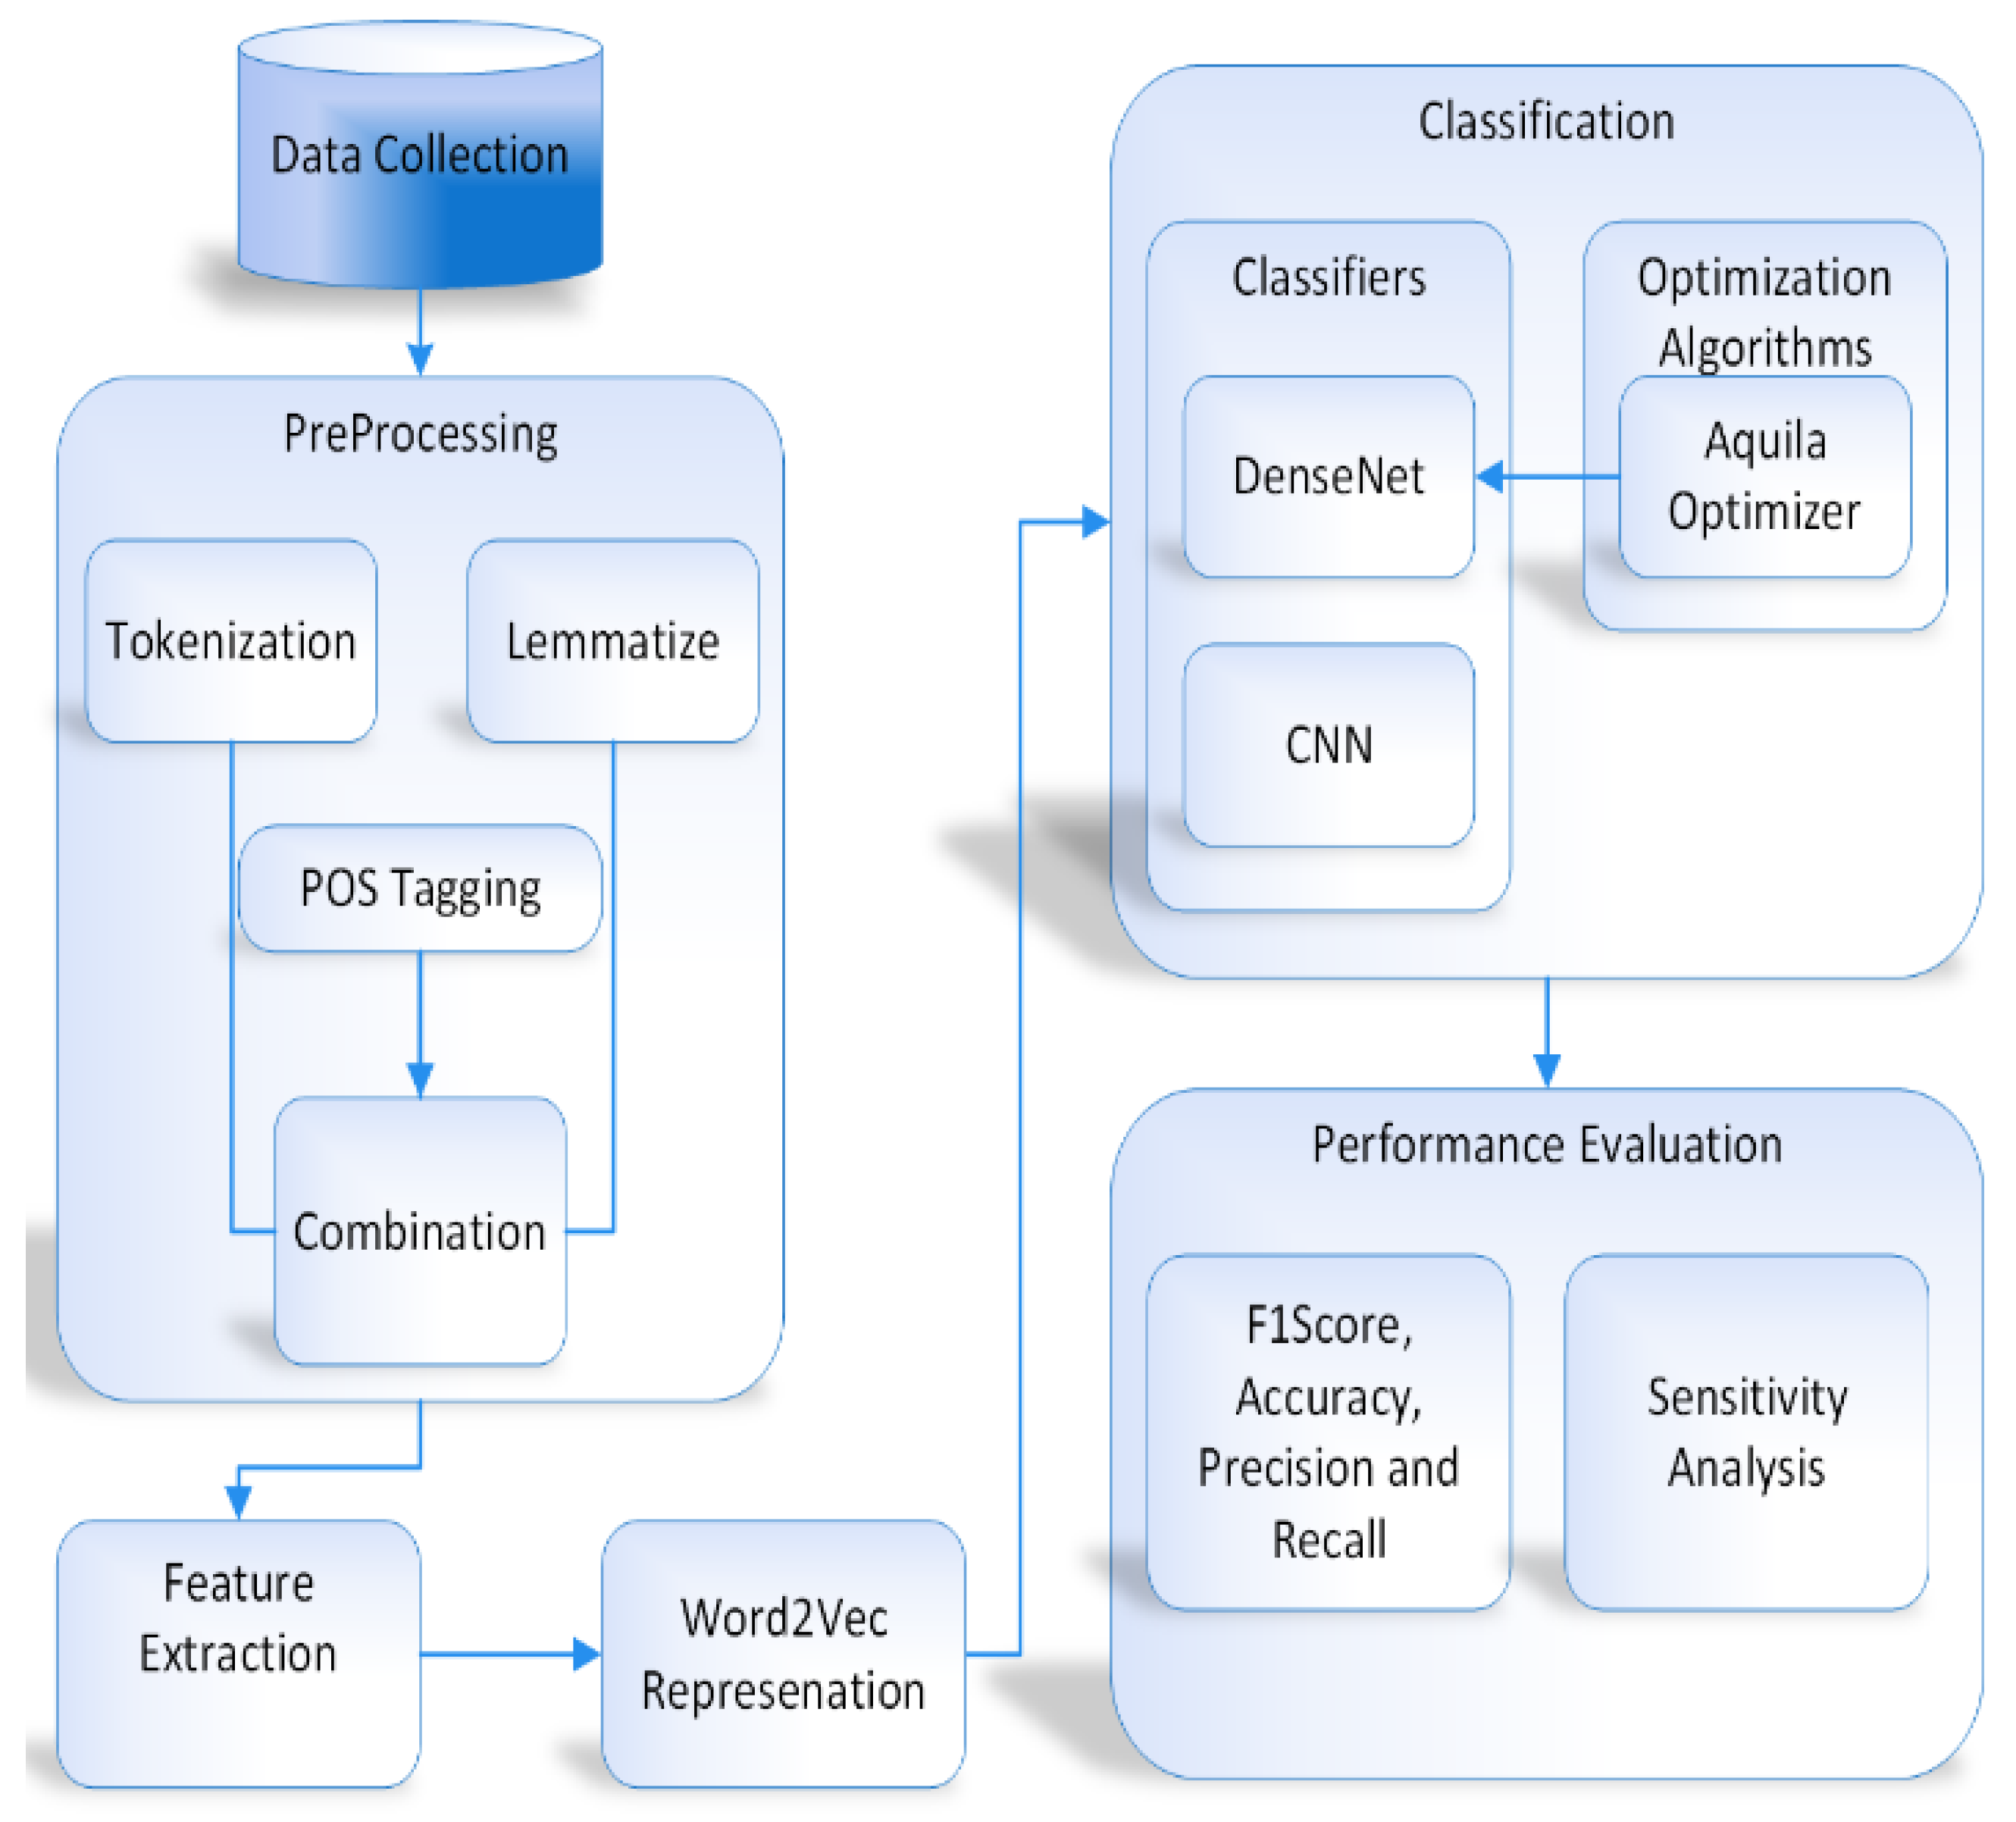
This section provides an extensive description of the experimental results along with an in-depth analysis of the outcomes. A system with specification a ninth-generation Core i7 processor with 2.4 quad-cores was used for the research. The main programming language used for this study is Python, and the programming environment used was the Spyder IDE.

4.1. Dataset Description

Based on the findings reported in Table 5, our proposed ensembler underwent comprehensive testing across diverse real-world multi-label classification datasets spanning various domains. Among these datasets, the Medicine [51] dataset is the first in biology. Its primary objective is to estimate the prevalence of different diseases within the population. The results of this study were obtained from the Kaggle website. The second dataset, called hotel reviews, contains the pertinent hotel booking records from Kaggle [52]. The other dataset comes from various diseases. The results of this study were obtained from the Kaggle website. The second dataset, called hotel reviews, contains the pertinent hotel booking records from Kaggle [52]. The other dataset comes from Kaggle [53], which aims to identify the specific subject categories to which each document belongs. For the purpose of classification, we have partitioned the dataset into training and testing sets using an 80/20 split. This means that 80% of the data are allocated for training the model, while the remaining 20% are reserved for evaluating the model’s performance.

4.2. Metrics for Performance Evaluation

This section will apply five essential multi-label metrics, as previously introduced and discussed in our work. These metrics have gained significant attention in the current literature, making them fundamental for our analysis. To illustrate, consider the scenario within our multi-label datasets, which consist of multiple instances represented as (ci, pi), where “ci” represents a specific label and “pi” is the associated input. We will use the notation h(pi) for the predictive label collection. Additionally, we will introduce ci, f to denote the individual MLL h function and ci, f for the separate MLL h function, each corresponding to a specific (ci, pi) pair. Regarding the variable “ci”. This variable reflects how the learner rates input “pi” at label “ci”, ensuring that "ci” accurately corresponds to the label assigned to input “pi”. This alignment holds significant importance in our analysis.

4.2.1. Accuracy

The ratio of accurately anticipated observations to all observed data points (or observations plus predictions) is the most easily understood performance metric (or observations). High-precision models are the most accurate because they are the most precise (high accuracy). Precision is essential, but only an asymmetric dataset will have nearly equal-sized negative and false positive results.

4.2.2. Precision

It establishes the percentage of cases correctly diagnosed out of all those that received favorable labels under specific conditions. The ratio of all correctly predicted positive observations to the amount of all foreseen positive sightings plus the number of significant positive observations is known as precision. A low rate of false positives in medical diagnosis is associated with good diagnostic accuracy.

4.2.3. Recall

Recall, also known as the true positive rate or sensitivity, is a crucial metric in multi-labeling. It measures the proportion of correctly predicted positive observations within the context of our multi-label dataset. It is calculated by dividing the total number of observations by the correctly predicted positive observations. This metric is significant, alongside accuracy and other key metrics, for assessing the performance of multi-label classification models.

4.2.4. F-Measure

The F-measure combines precision and recall, providing a balanced evaluation of multi-label classification performance. This metric, also known as the balanced F-score, represents the harmonic mean of precision and recall. The formula for computing it involves the square of the scaling factor divided by the weighted sum. It is essential to note that precision and recall are equally weighted in this metric, commonly referred to as the F1-measure.

4.3. Compared Models

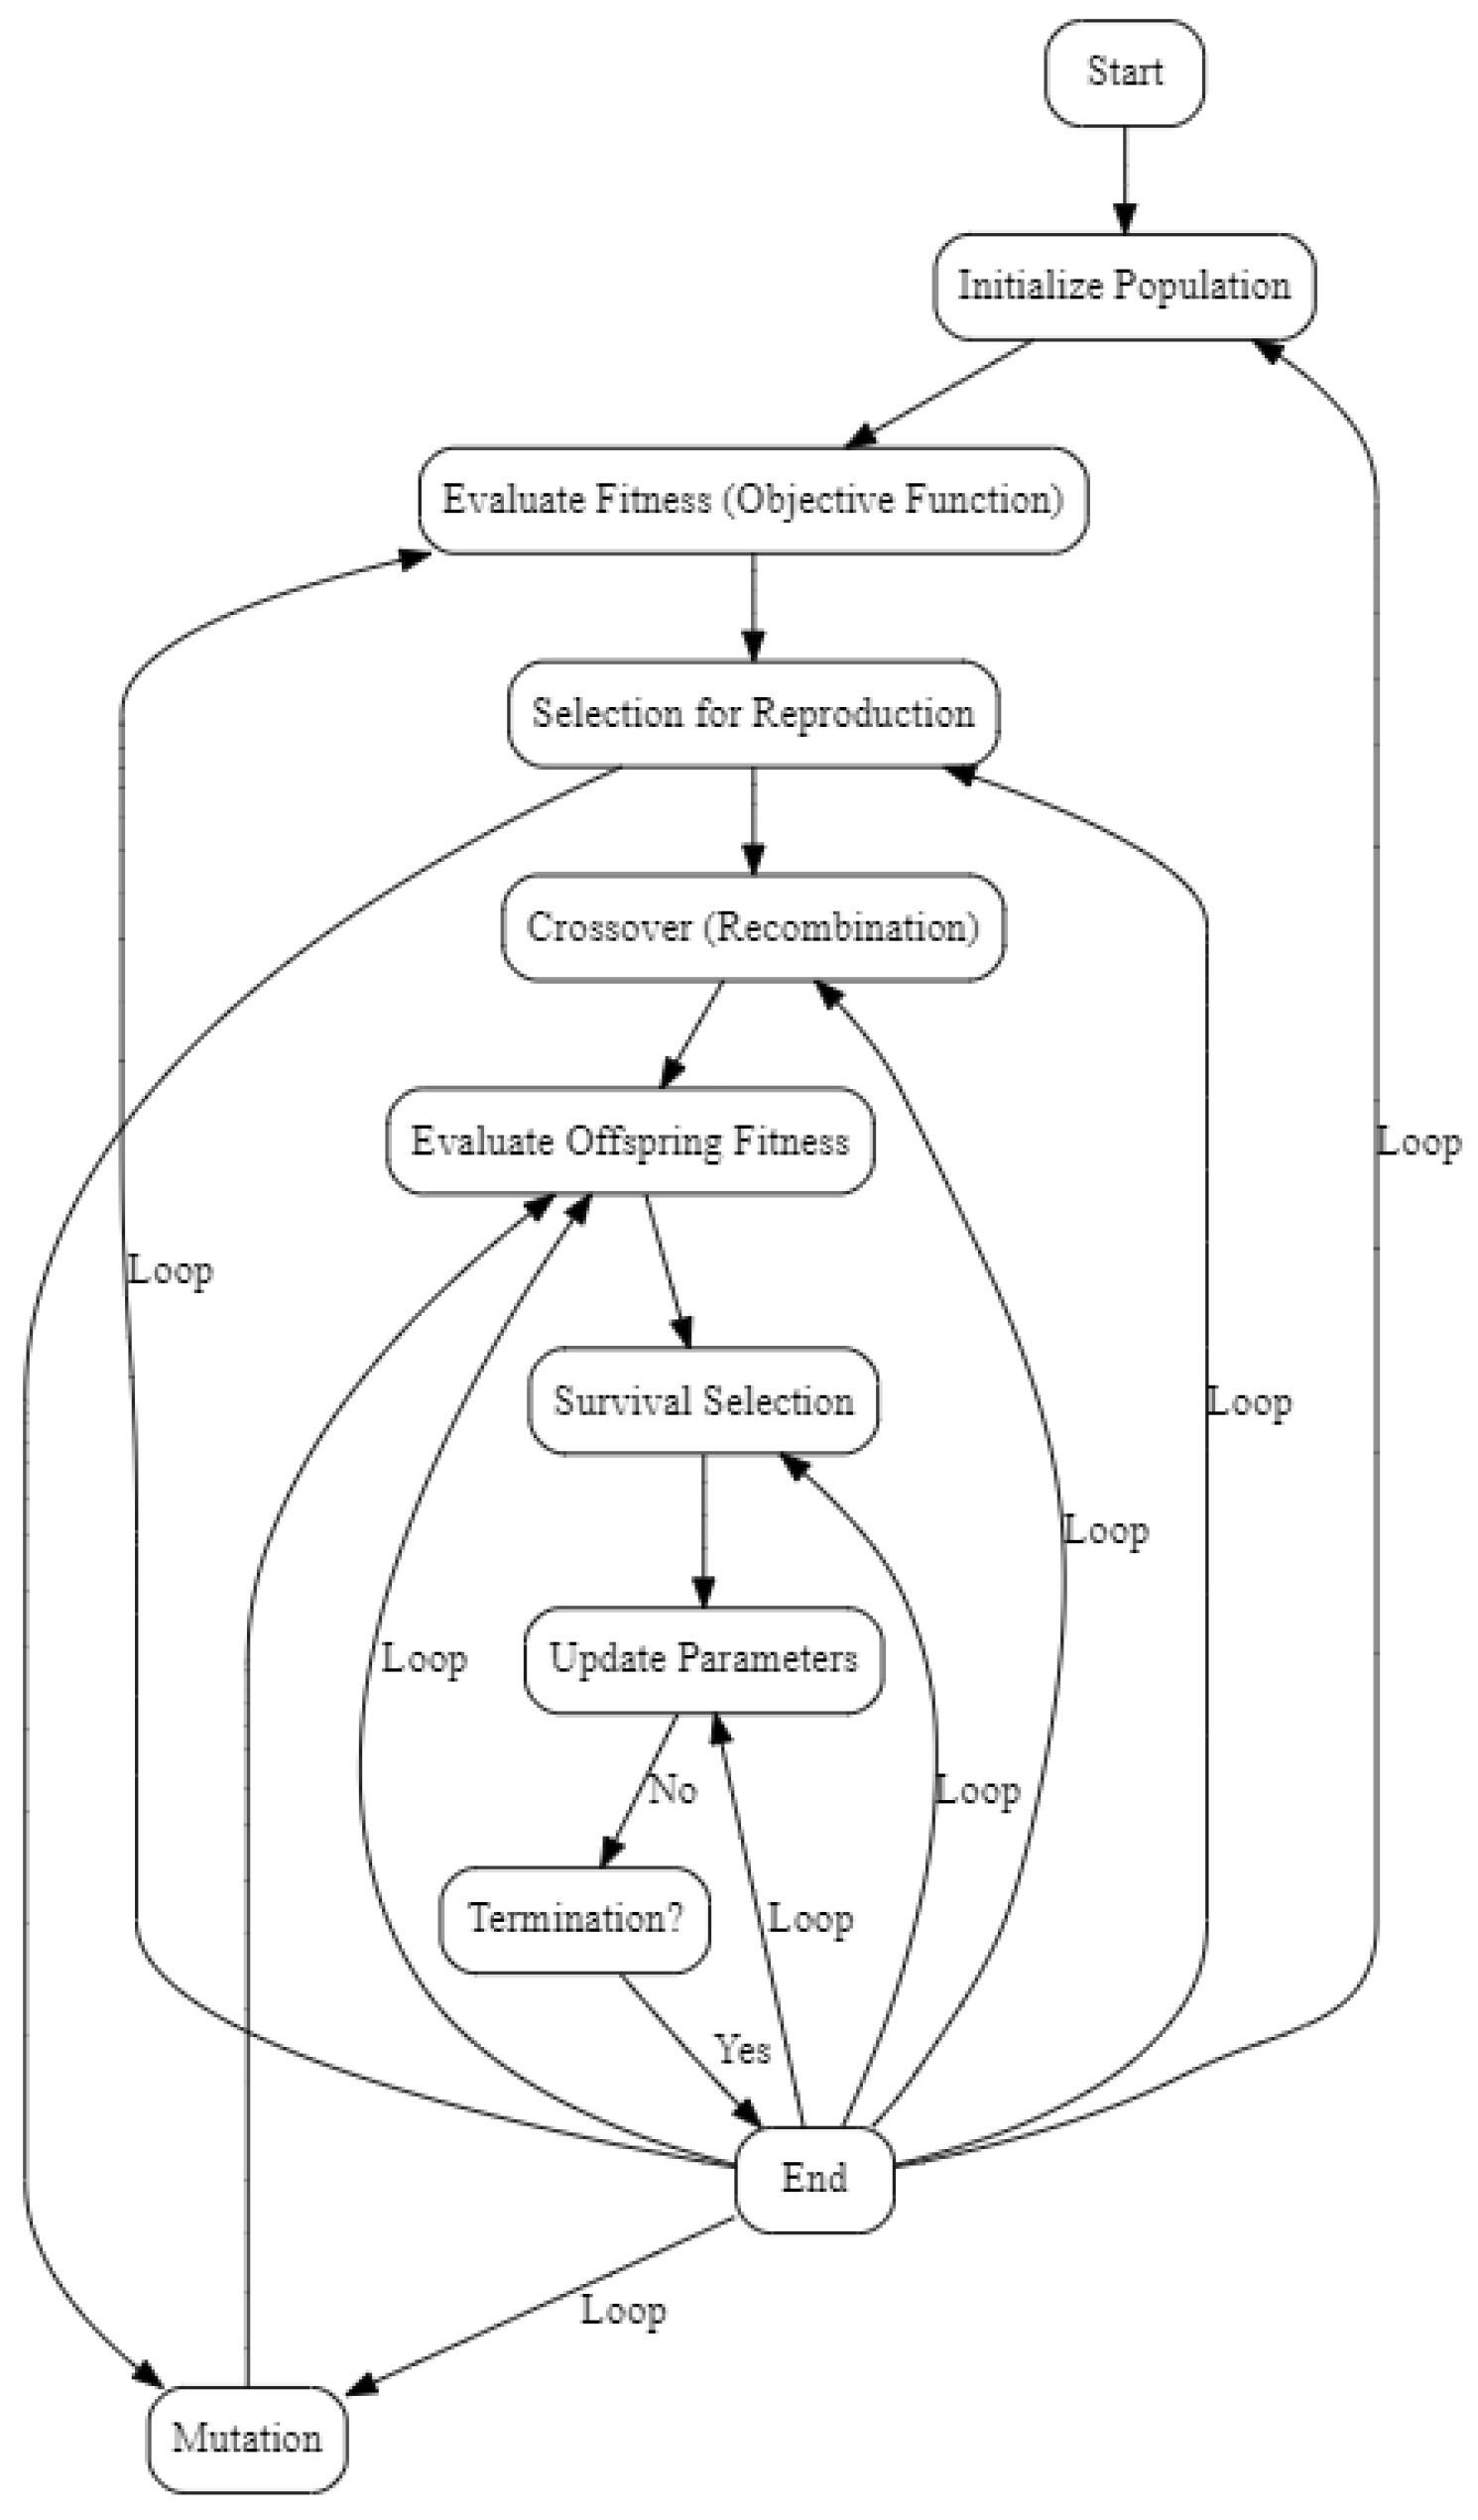
The suggested EDAO was put through its paces in a full comparison with the most commonly used MLL techniques to demonstrate its efficacy. In the ensemble multi-label learning (EnML) domain, two distinct scenarios, ML-NCL and ML-HISC, stand out. These scenarios optimize a single target to validate the provided objective function. By focusing on individual targets, they serve as valuable testbeds for refining and validating the optimization process within the EnML framework. All of these techniques are summarized in the following sections.
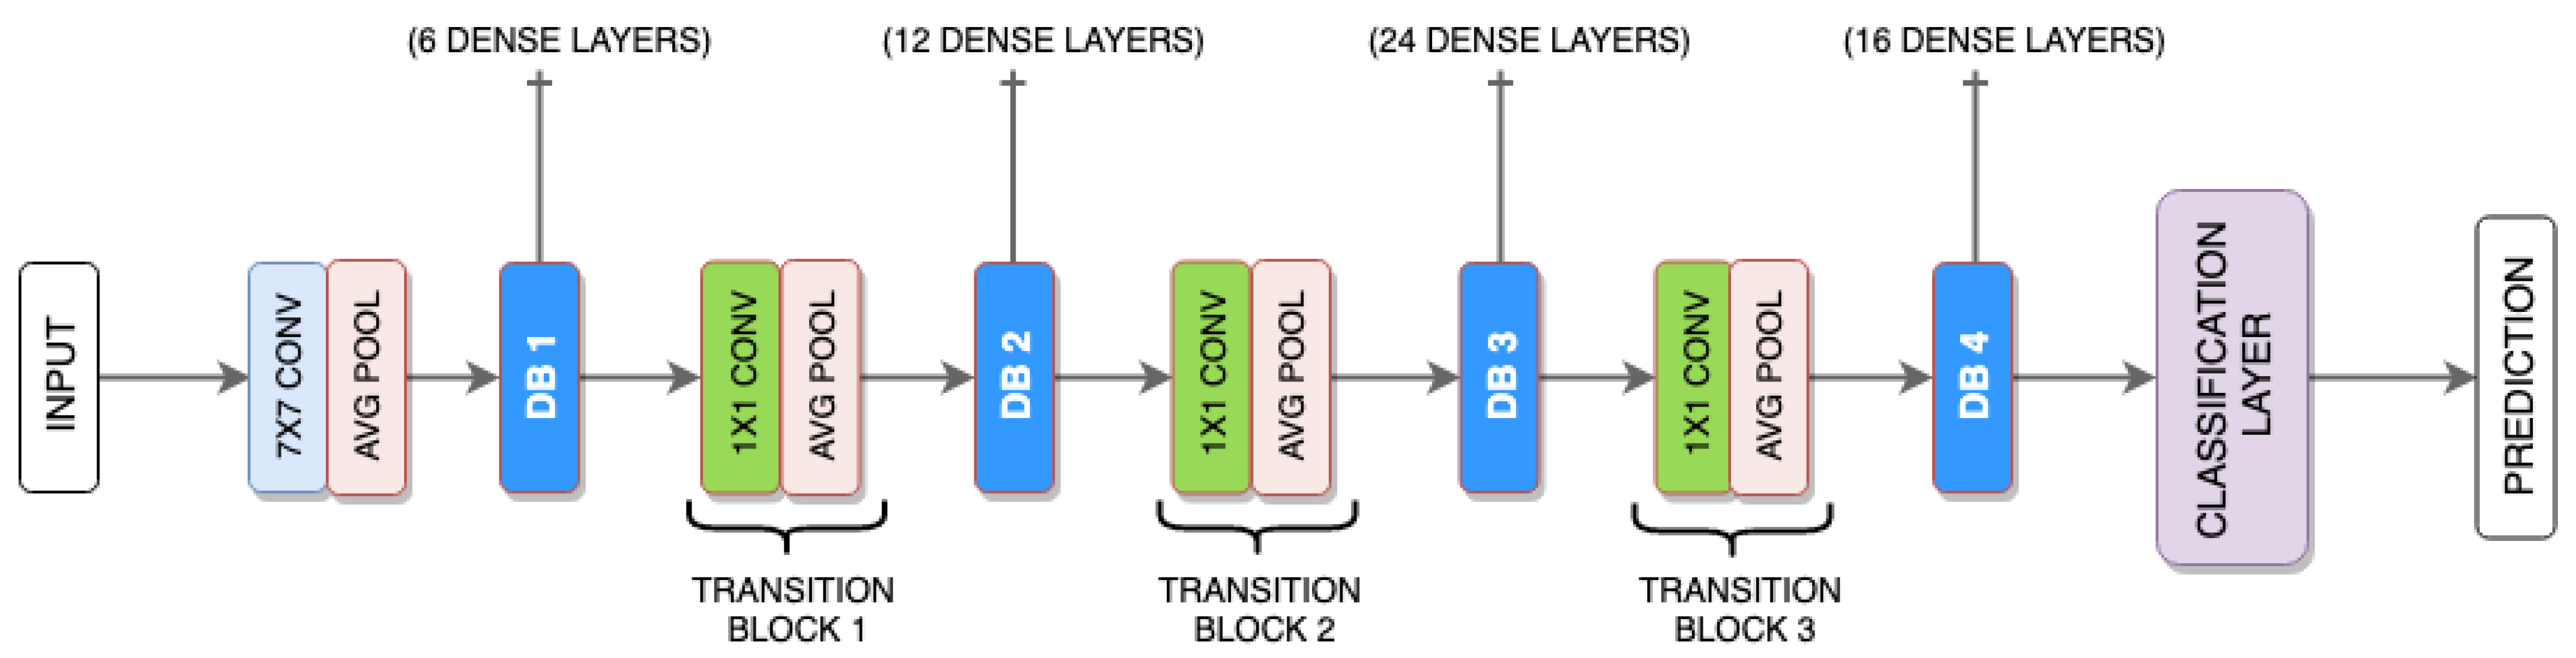
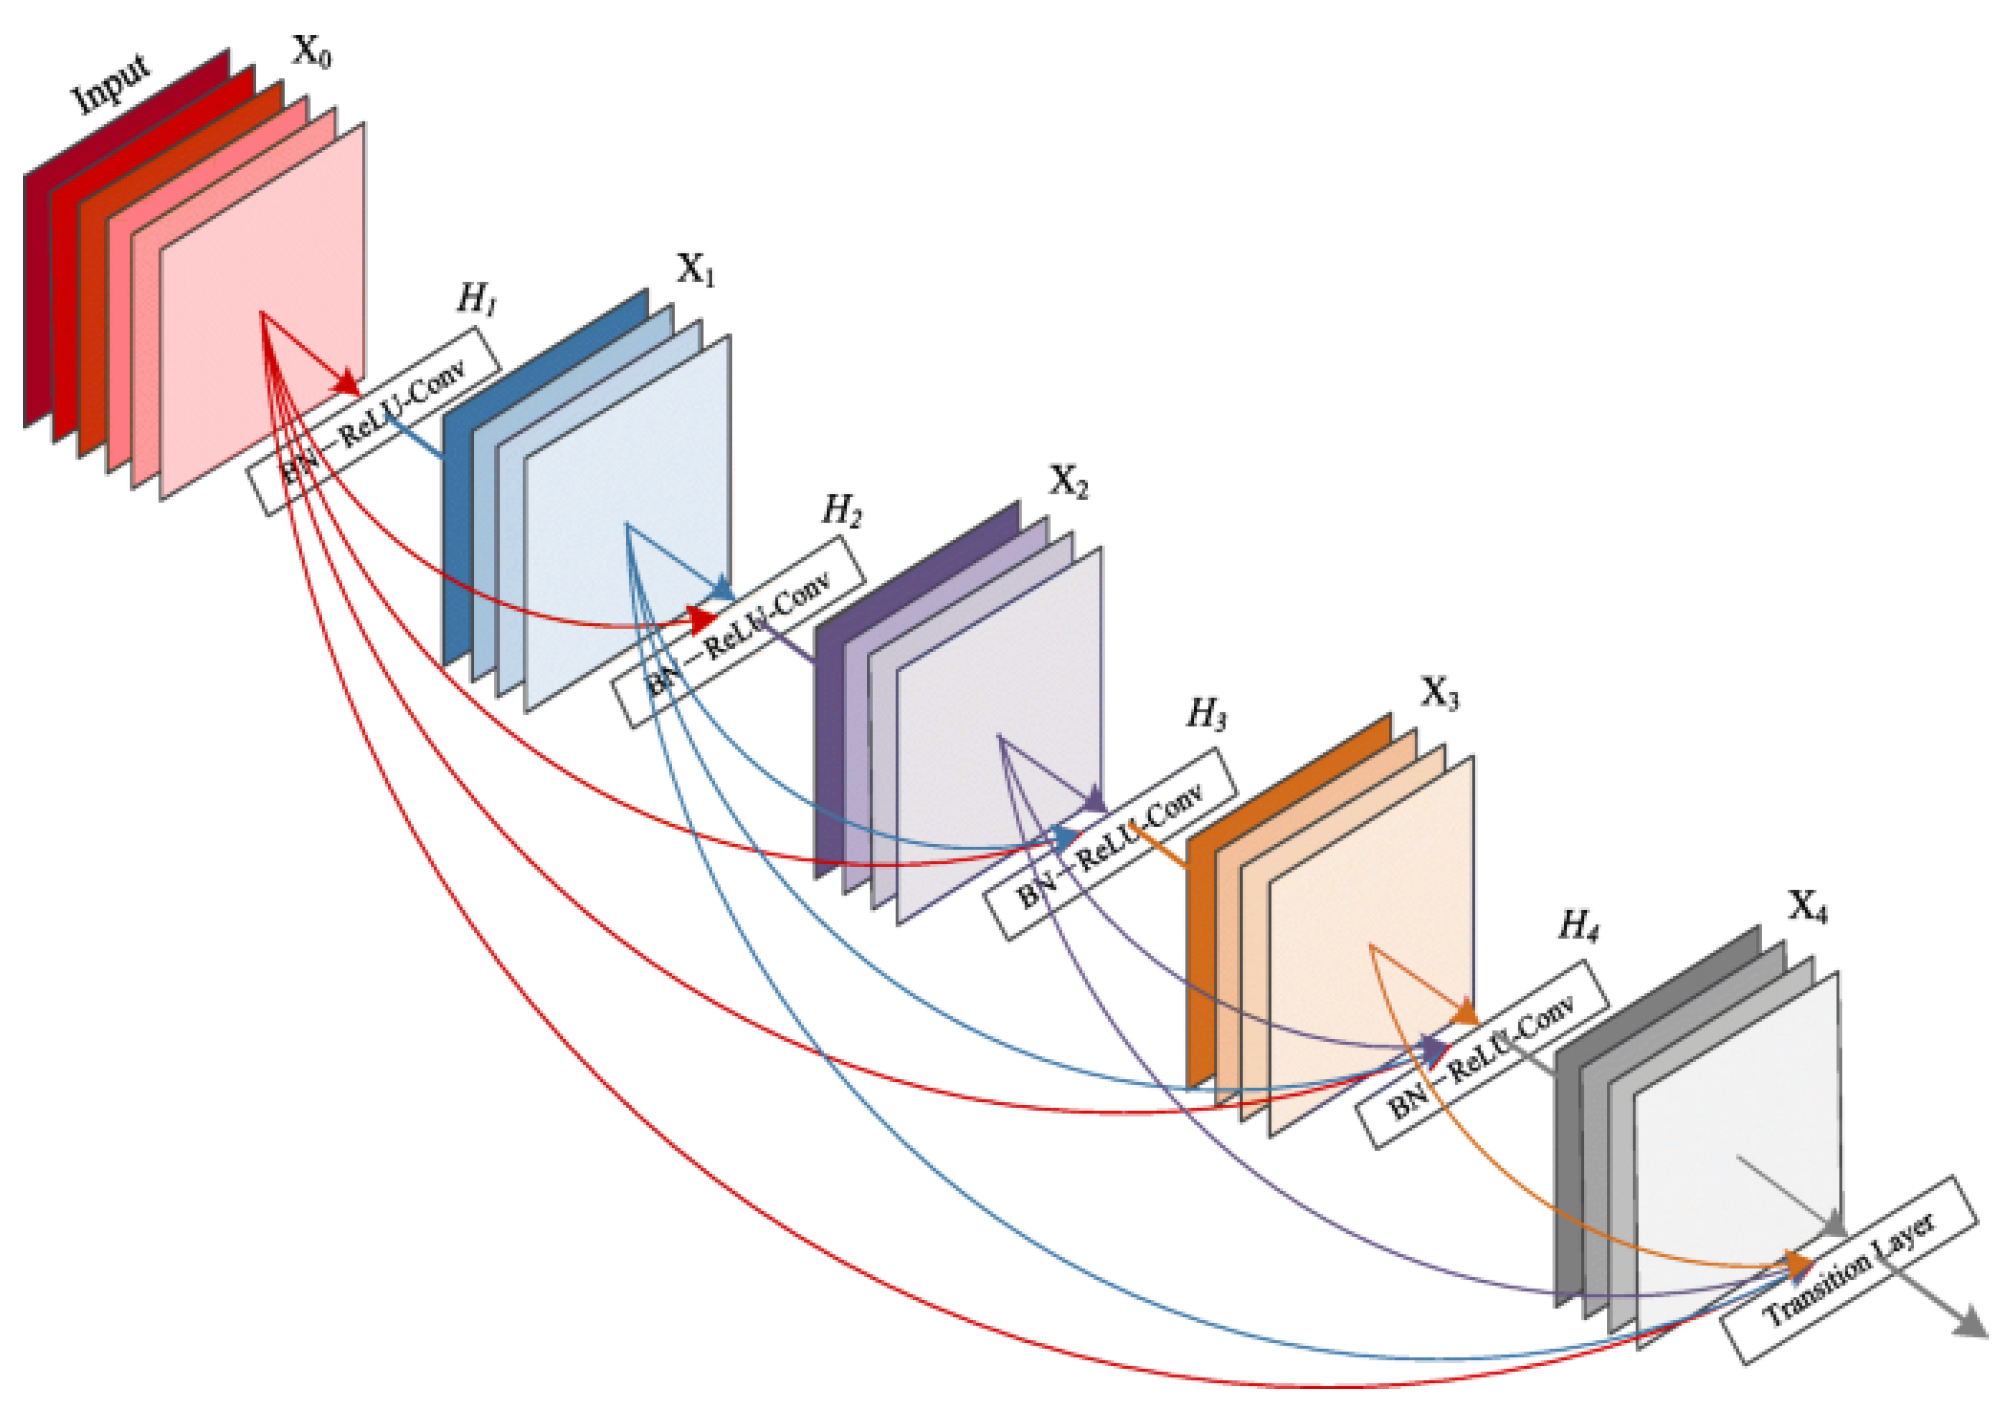
  • Proposed Ensembler: DenseNet is used as a DNN algorithm ensemble with AO and as an ensembler. The DenseNet makes use of its bunch of layers.
  • NB: The ML algorithm was utilized in the multi-labeling method.
  • CNN: The multi-label learning (MLL) algorithm is fundamentally rooted in the domain of NNs.
  • ML-RBF [22]: Additionally, the RBF NN algorithm-based MLL algorithm is the primary trainer utilized by the ENL system and is developed based on RBF NN.
  • RAKEL [26]: Another approach to multivalued learning. In this approach, a basic learner with a single label makes judgments based on a randomly selected subset of the encountered labels. This limited subset serves as the basis for decision-making, reflecting the nature of most basic learners in this context.
  • ECC [24] provides a detailed description of an ensemble approach for MLL based on using classifier chains. To transform EnML into a subproblem, we must first modify the unique goal into the one we used to create EnML.
M L HSIC C = 1 / log ( M L HSIC ) M L NCL L = 1 M L N C L / ( m × L )
Enhanced DenseNet with Aquila Optimizer (EDAO) is a revolutionary advancement in sentiment analysis that has unique characteristics that distinguish it from other approaches. The Aquila Optimizer, a customized optimization method created especially for adjusting DenseNet’s parameters, is one of its main contributions. This new optimizer, which prioritizes effectiveness and efficiency, is essential to improving the convergence and general performance of the model. Moreover, EDAO overcomes the drawbacks of other sentiment analysis techniques, excelling especially in multi-label sentiment analysis. Through its optimization process, EDAO combines accuracy and diversity, in contrast to benchmark techniques that could just favor accuracy. This integrated approach is beneficial, allowing EDAO to perform better than approaches with a more limited accuracy-focused scope and to catch sentiment fluctuations with ease.
More specifically, to identify minute emotion differences across various texts, EDAO carefully use DenseNet-AO, a DenseNet variation. By leveraging DenseNet-AO, this approach greatly improves the model’s capacity to traverse the intricacies of multi-label datasets, hence addressing a prevalent sentiment analysis difficulty. DenseNet-AO integration is also essential for increasing generalization efficiency, which enables the model to easily adjust to new or unknown input. A sensitivity analysis is a crucial assessment indicator for the decision-making process in terms of robustness and stability, according to EDAO. This novel approach solves the issues with the robustness of current techniques and offers a thorough evaluation of the model’s dependability in a range of scenarios. Furthermore, EDAO simplifies label space translation, reducing the computational burden involved in this procedure. Using the LP approach for label space translation improves the model’s efficiency and scalability, enabling it to handle large datasets with ease. Essentially, Enhanced DenseNet with Aquila Optimizer is a ground-breaking sentiment analysis system that combines cutting-edge optimization techniques, DenseNet-AO’s strength, and an all-encompassing strategy to overcome the drawbacks of conventional approaches. Together, these unique qualities improve EDAO’s performance, let it capture sentiment nuances more effectively, and present it as a reliable multi-label sentiment analysis solution.

4.4. Performance of Different Methods

For each experimental data collection, tenfold cross-validation is conducted. Using the provided outputs, the selected technique’s standard deviation and average productivity are computed for the entire dataset. The experiments were carried out utilizing a device powered by a robust 2.24 GHz Intel Xeon processor and bolstered by a generous 16 GB of RAM.
Table 6, Table 7 and Table 8 show the productivity of six different approaches. Based on all metrics and datasets, the proposed model beats the other methods evaluated, including the ML-RBF process and two combination approaches, RAKEL and ECC. The technique described remains constant across all datasets. It has been demonstrated that, compared to non-ensemble methods, our ensembler EDAO can effectively improve the generalization efficiency of DNN.
EDAO’s advantages over other multi-component learning techniques, such as ECC and NB, highlight our concept’s effectiveness. By harnessing the potential of integrated learners in conjunction with machine learning, MLL undergoes a significant improvement in generalization. Within this proposed setting, DenseNet excels, driven by its unmatched ability to address diversity-related objectives that have long challenged the field of multi-label research. Through the ingenious use of the AO algorithm, DenseNet transcends conventional boundaries, leading to a movement of diversification across the MLL domain. This distinctive attribute is a fundamental pillar behind DenseNet’s remarkable ascent. In our proposed approach, we examine the impact of objective functions on outcomes by comparing EDAO with CNN and Naive Bayes, representing two types of objective functions. The technique consistently yields the best results across all datasets, as evidenced in Table 6, Table 7 and Table 8. Visualizations of the model loss and suggested model accuracy are presented in
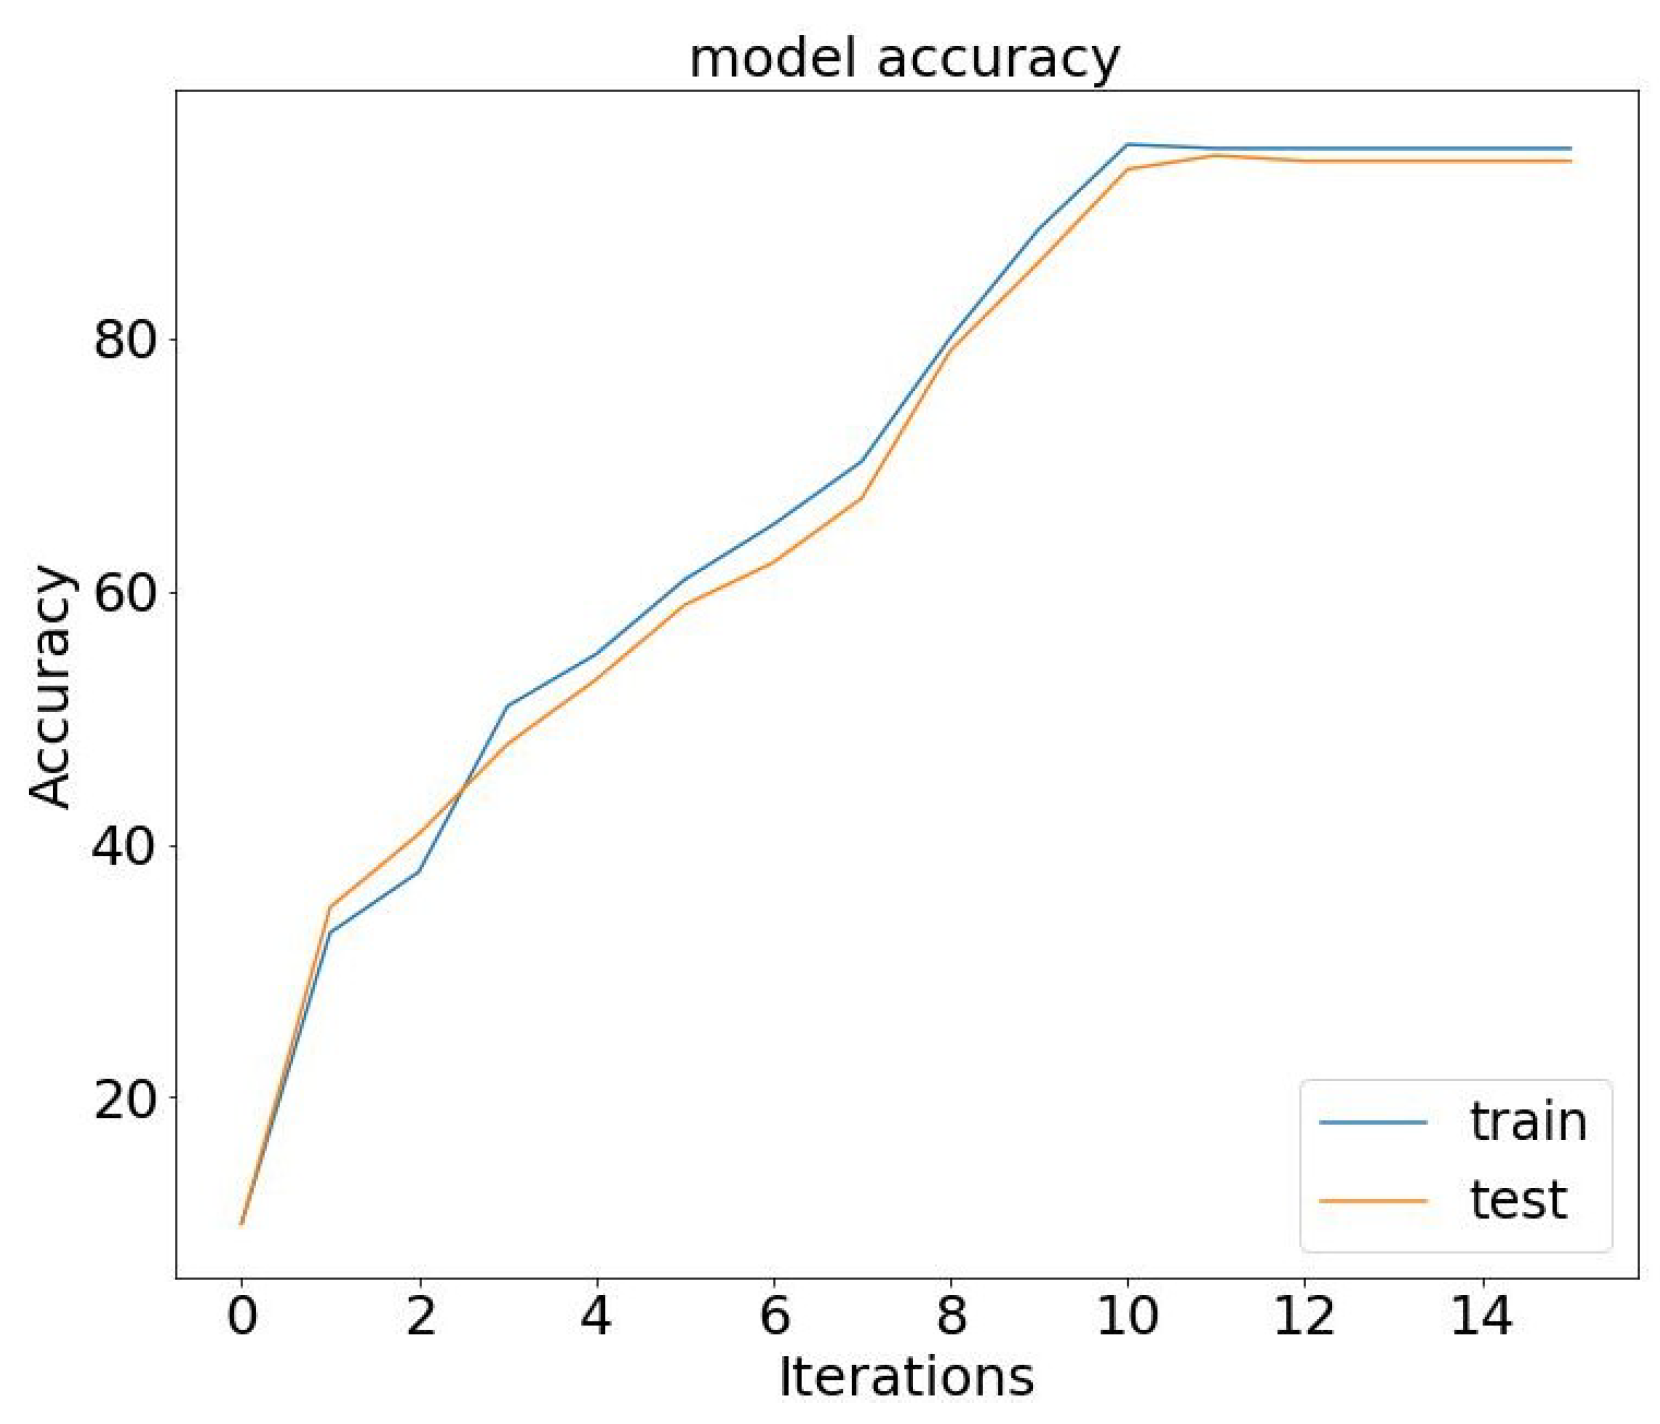
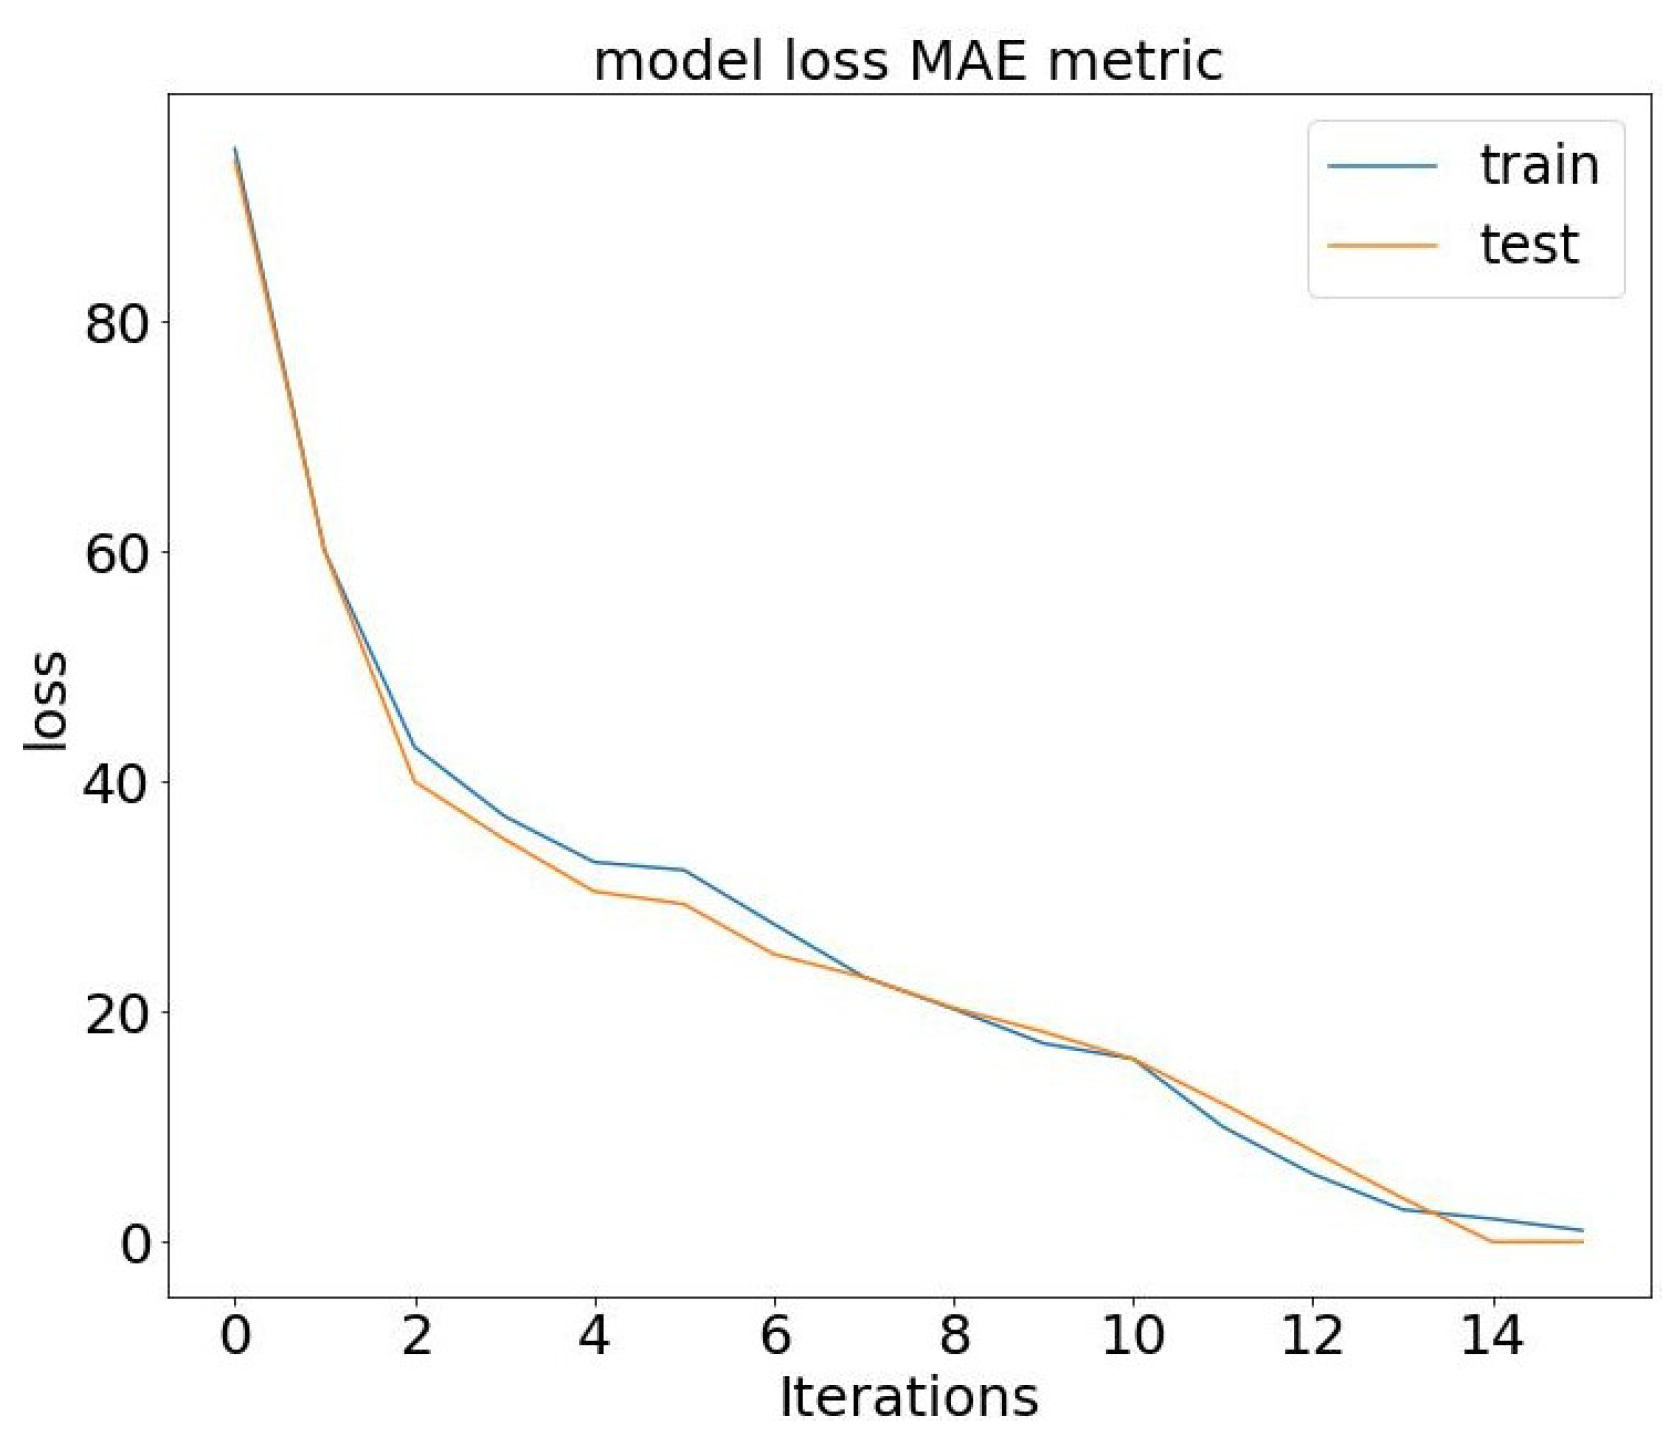
 Figure 6 and Figure 7. In our conceptual model, we observe a compelling trend: As the number of epochs increases, our model’s accuracy demonstrates significant improvement while the loss steadily decreases. This pattern reinforces the effectiveness of our approach, highlighting the positive correlation between training epochs and enhanced model performance.
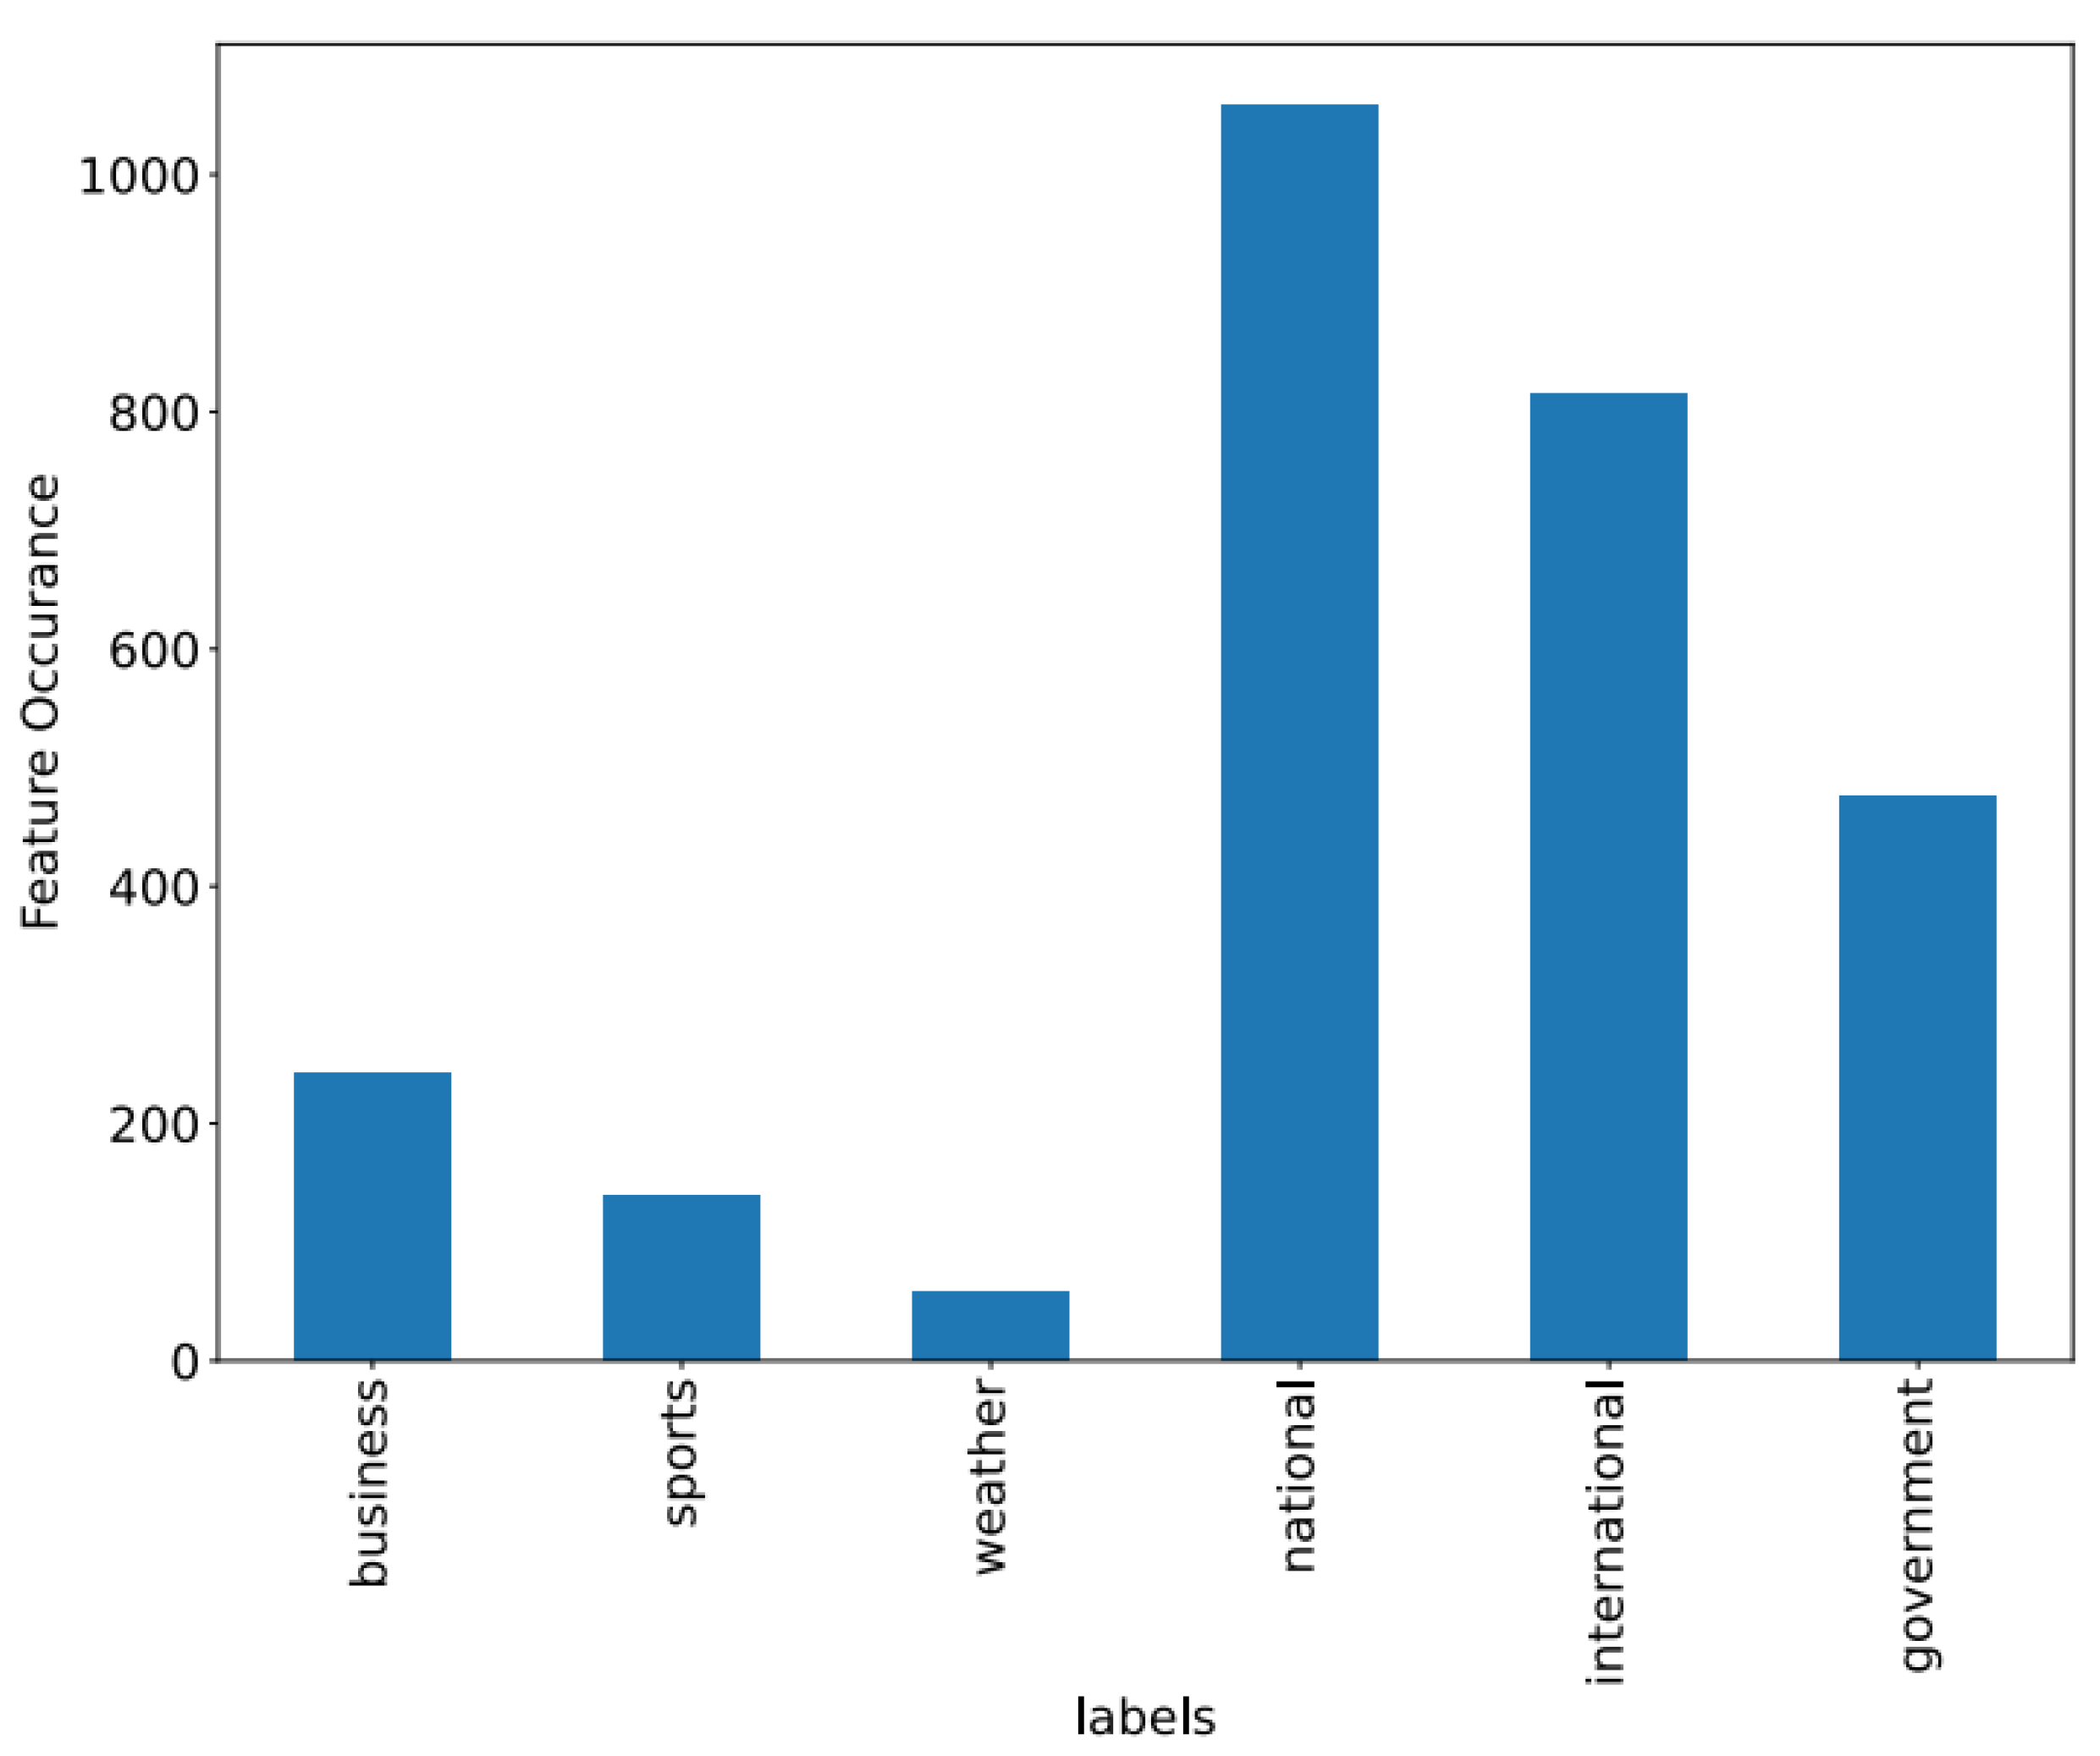
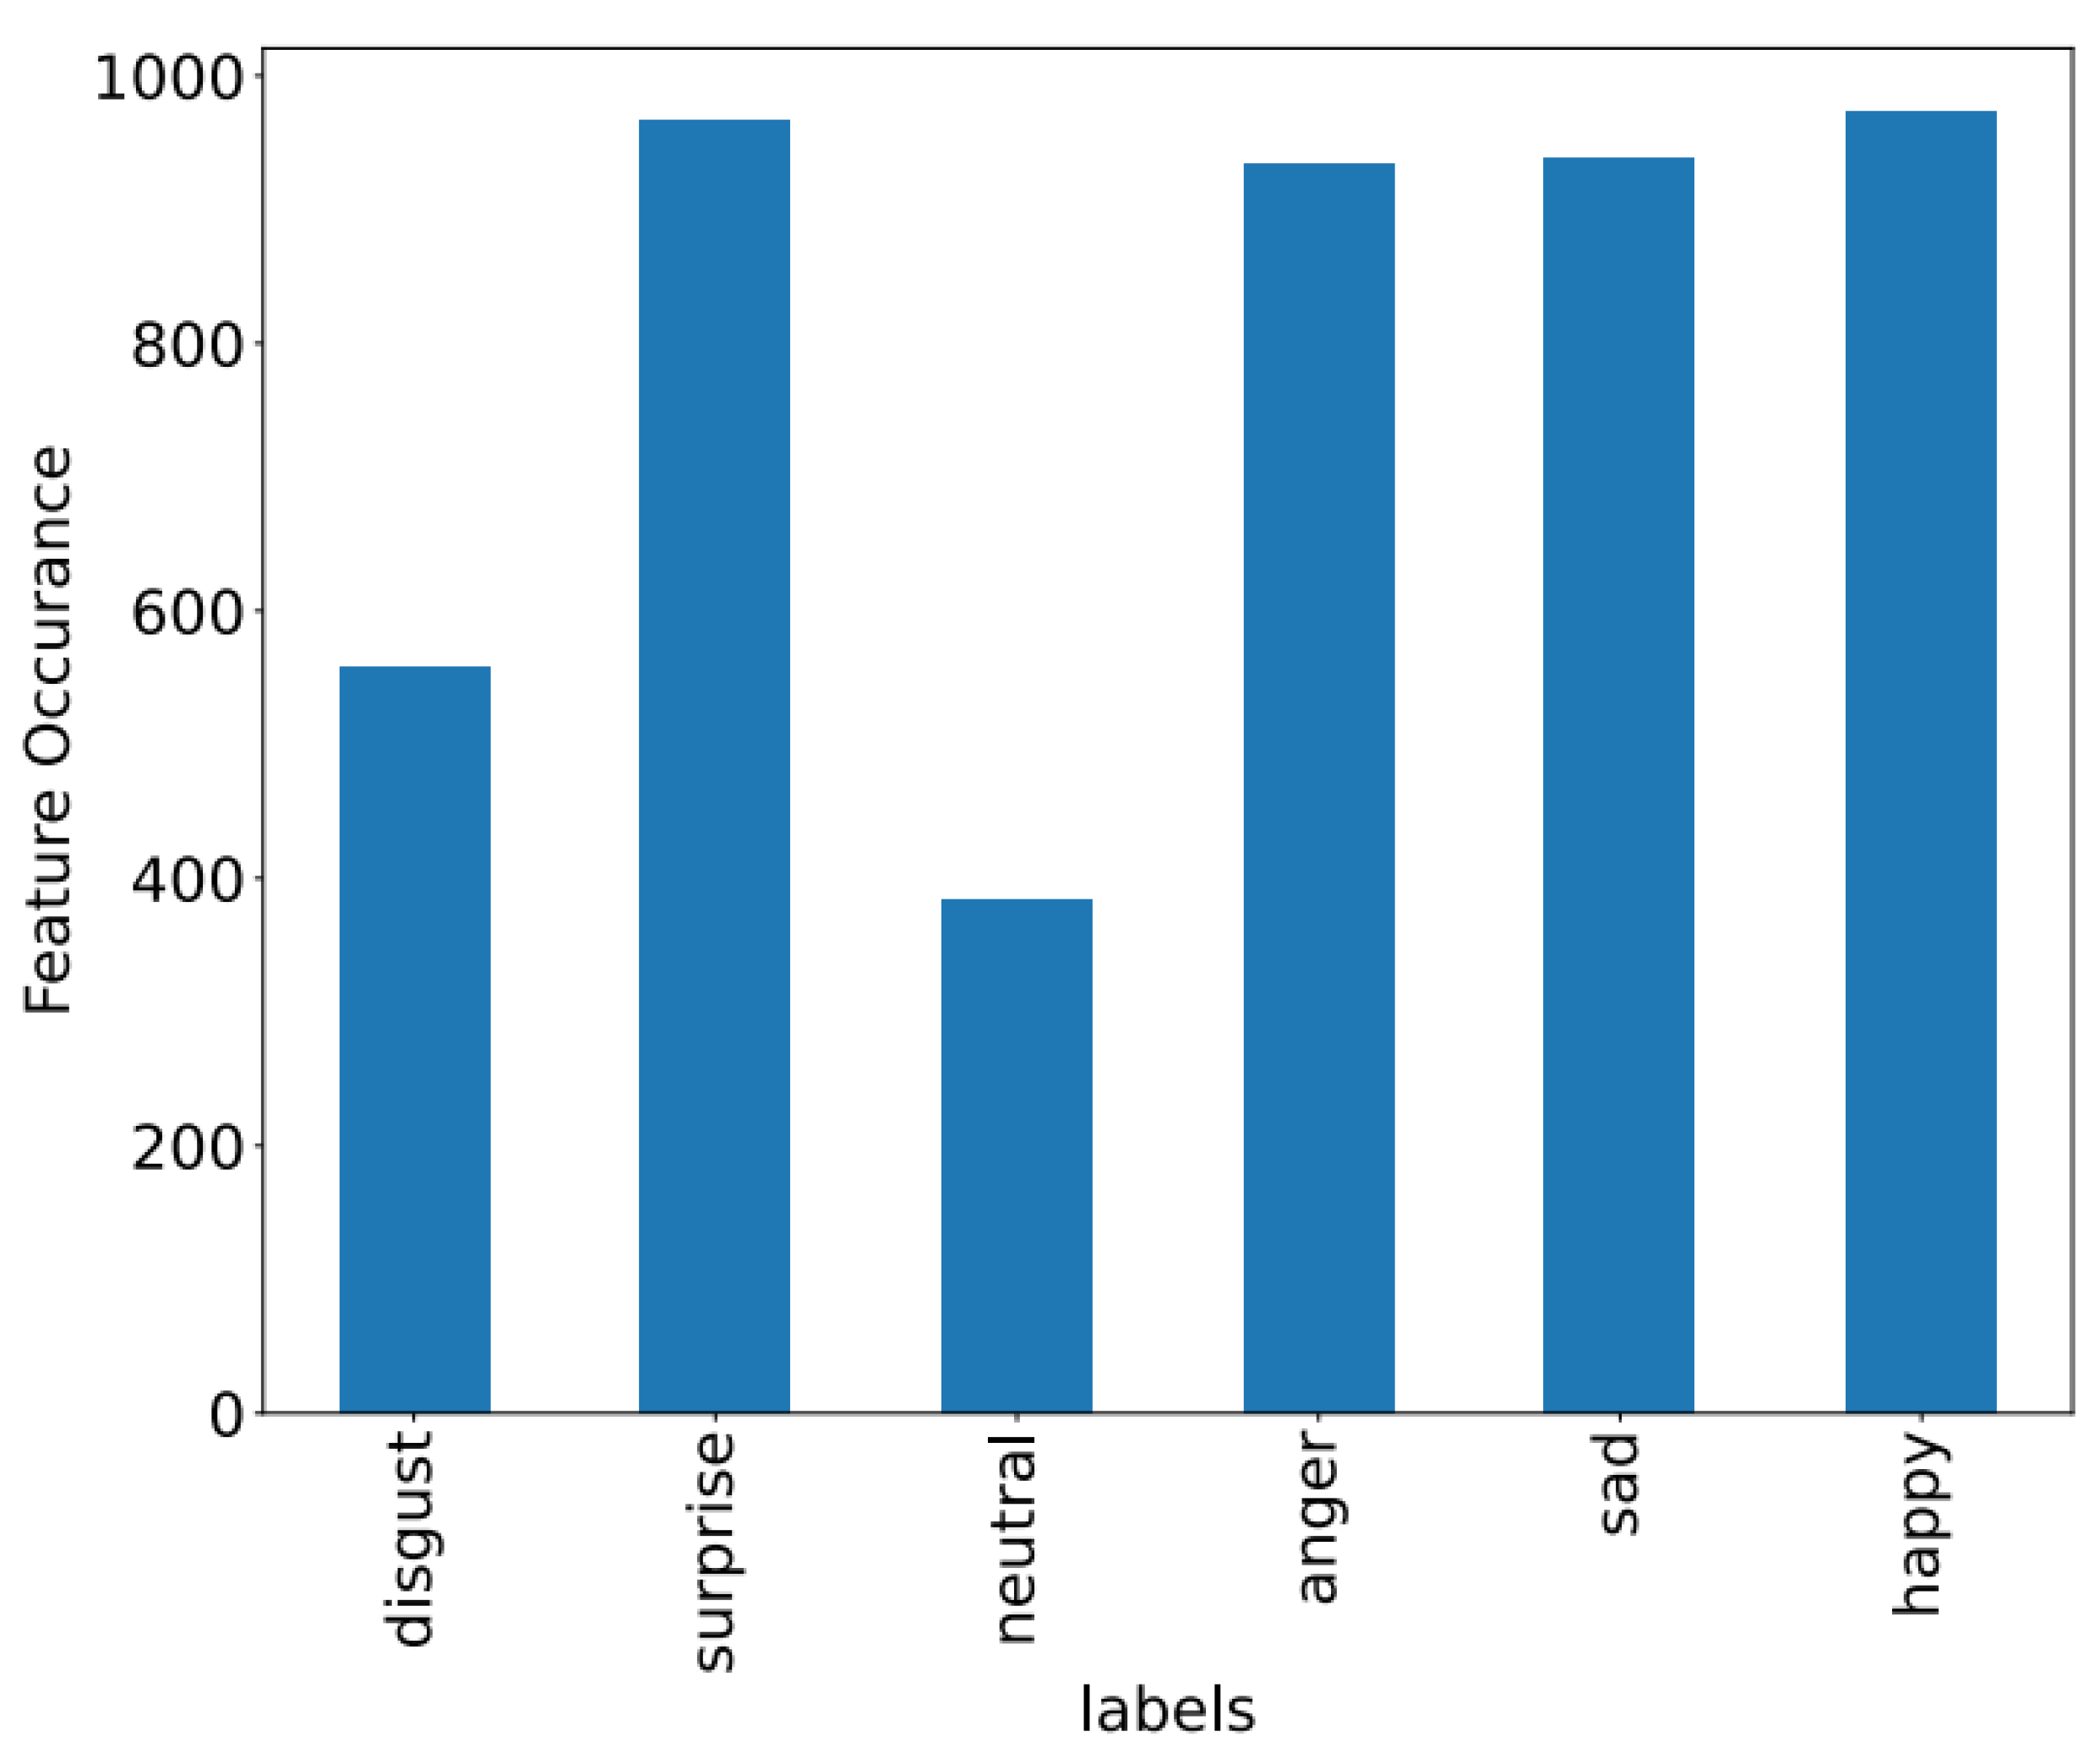
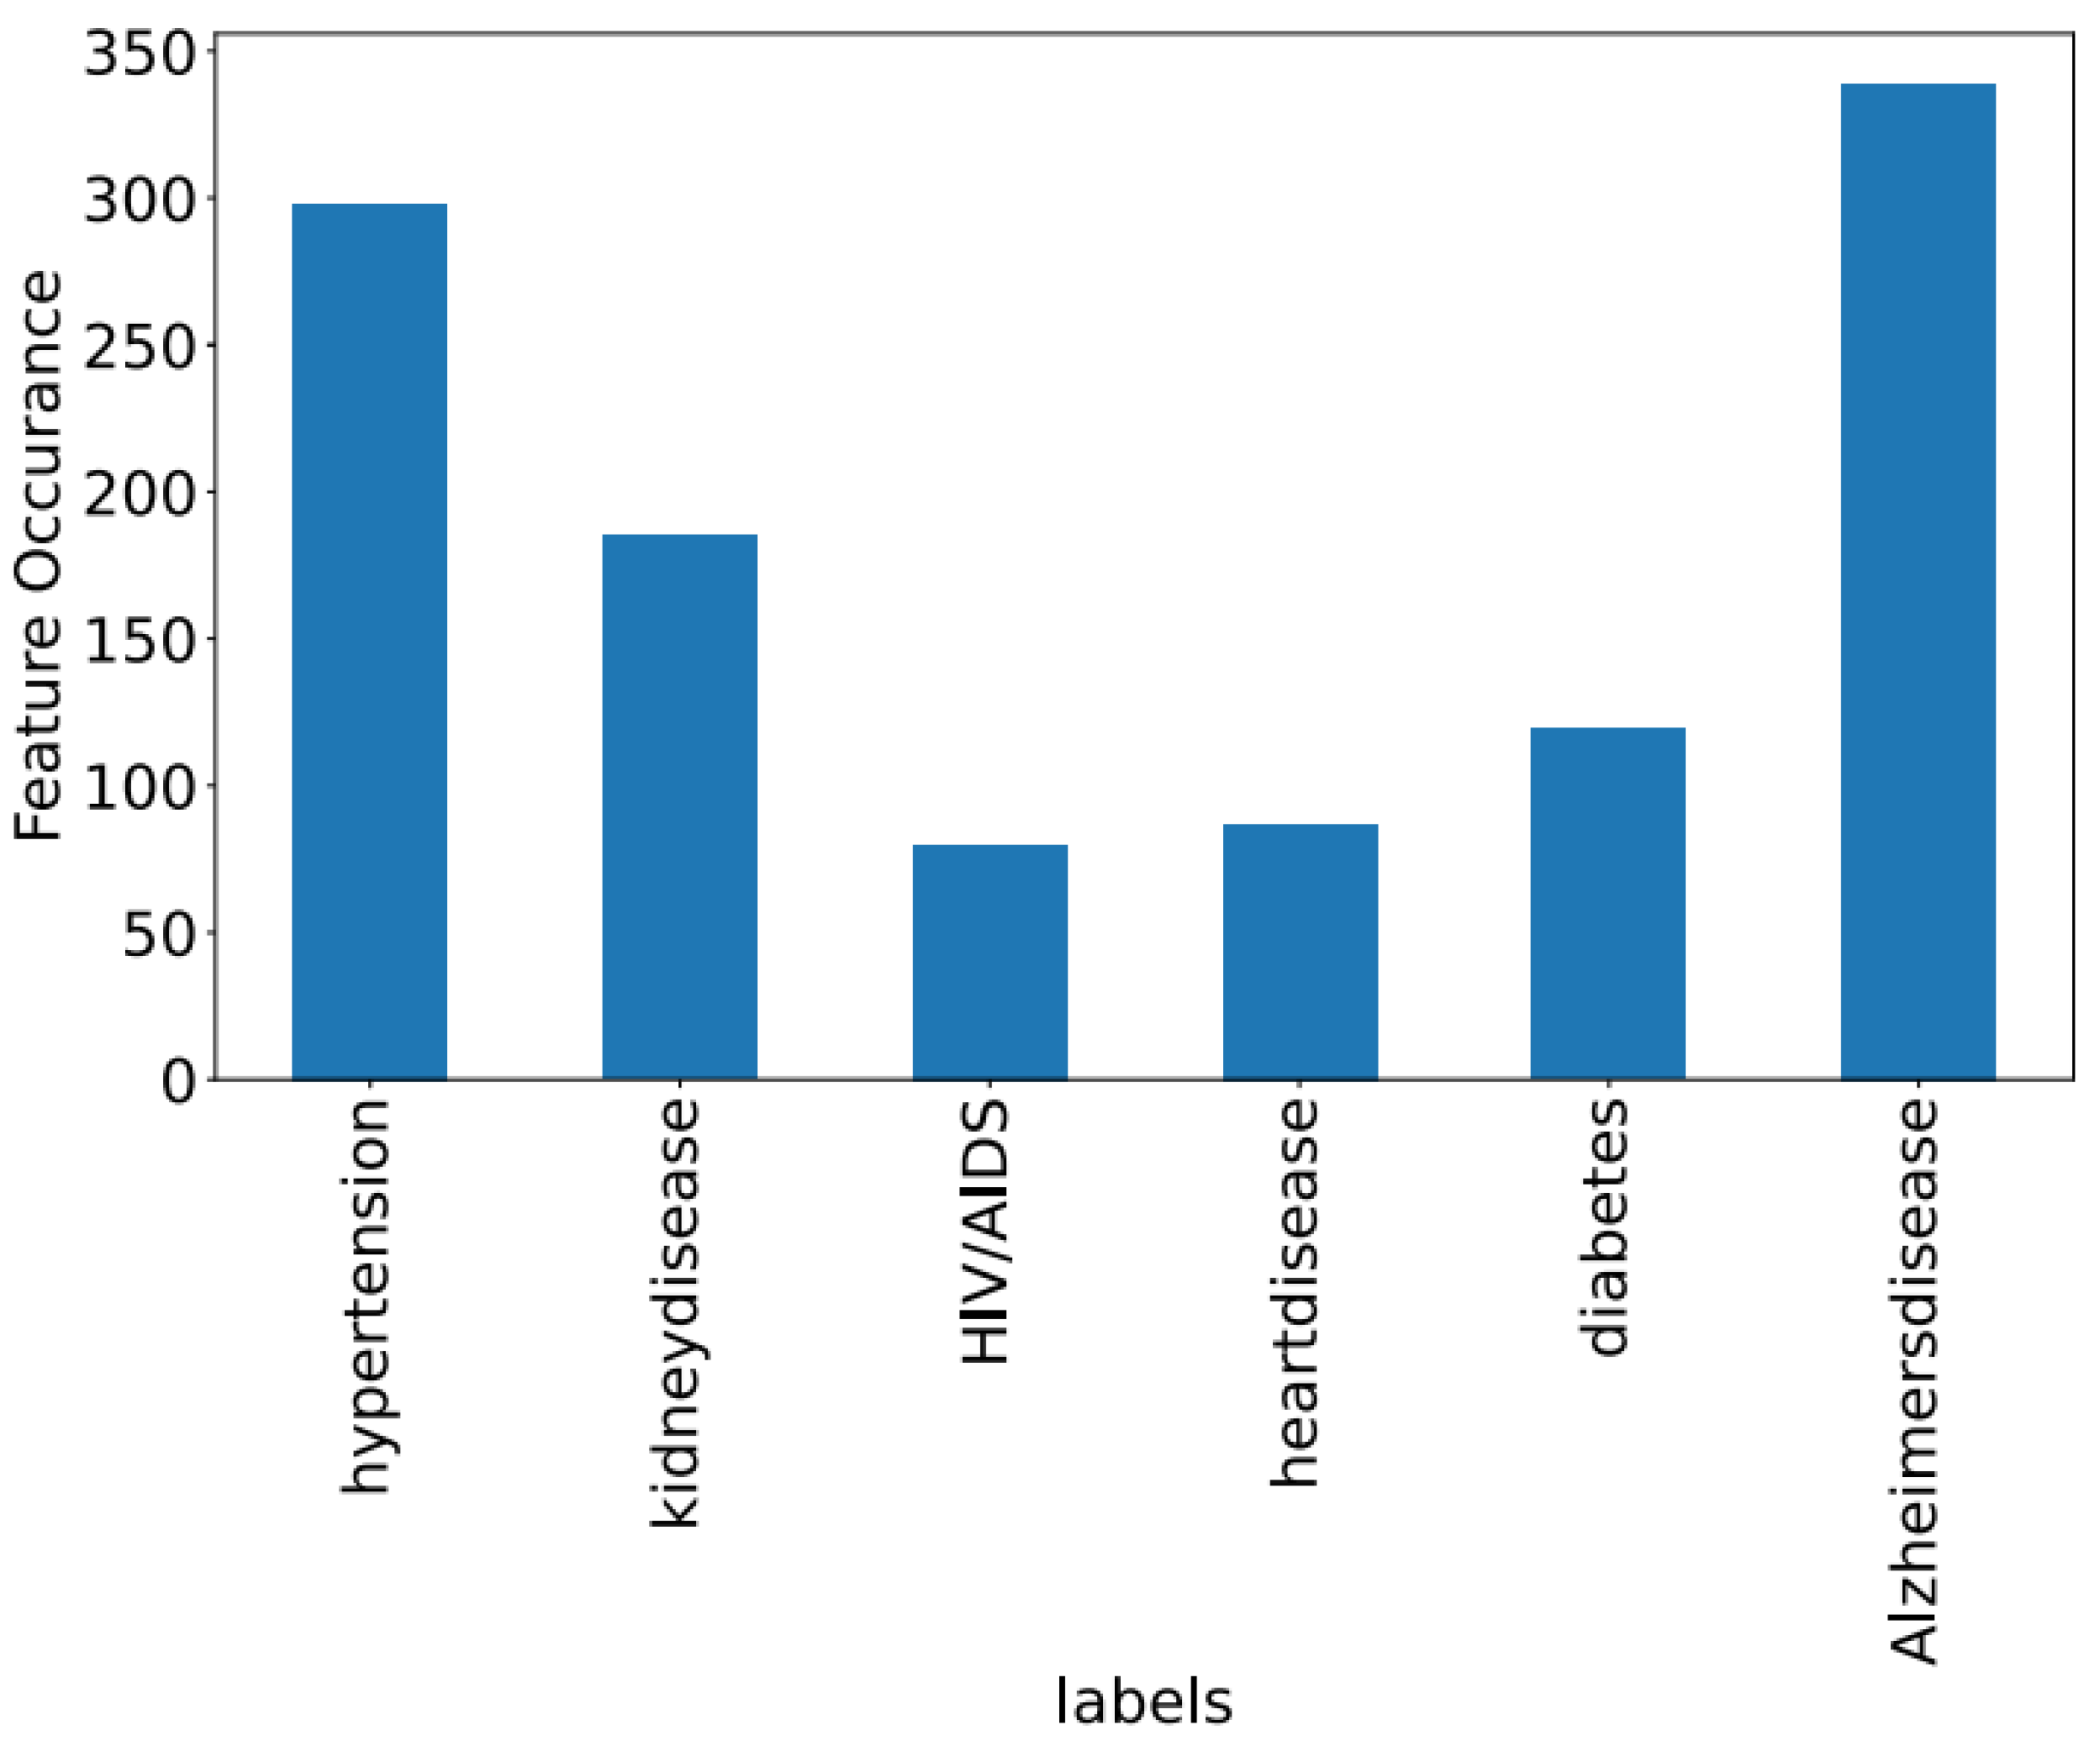
Figure 8, Figure 9 and Figure 10 showcase the features of specific datasets. Performance measures such as F1-score, accuracy, precision, and recall are employed to evaluate productivity across diverse datasets. 
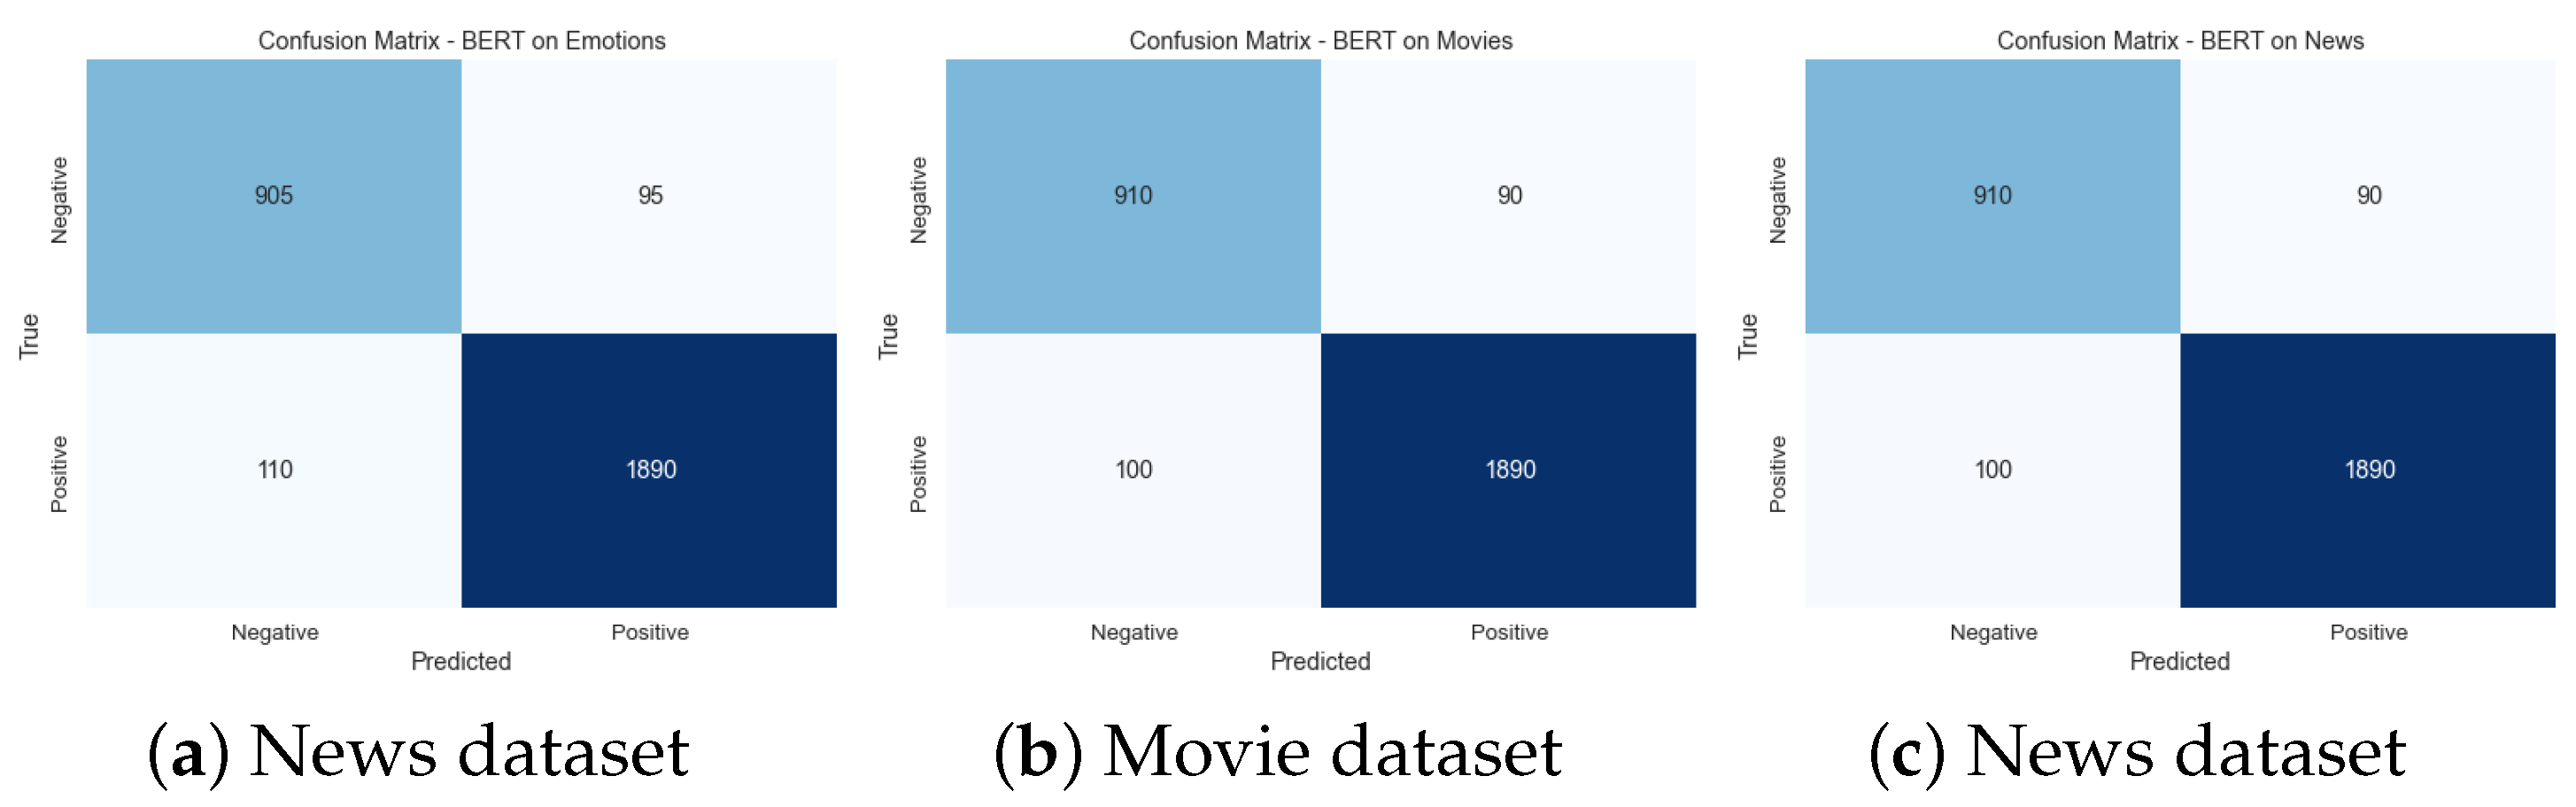
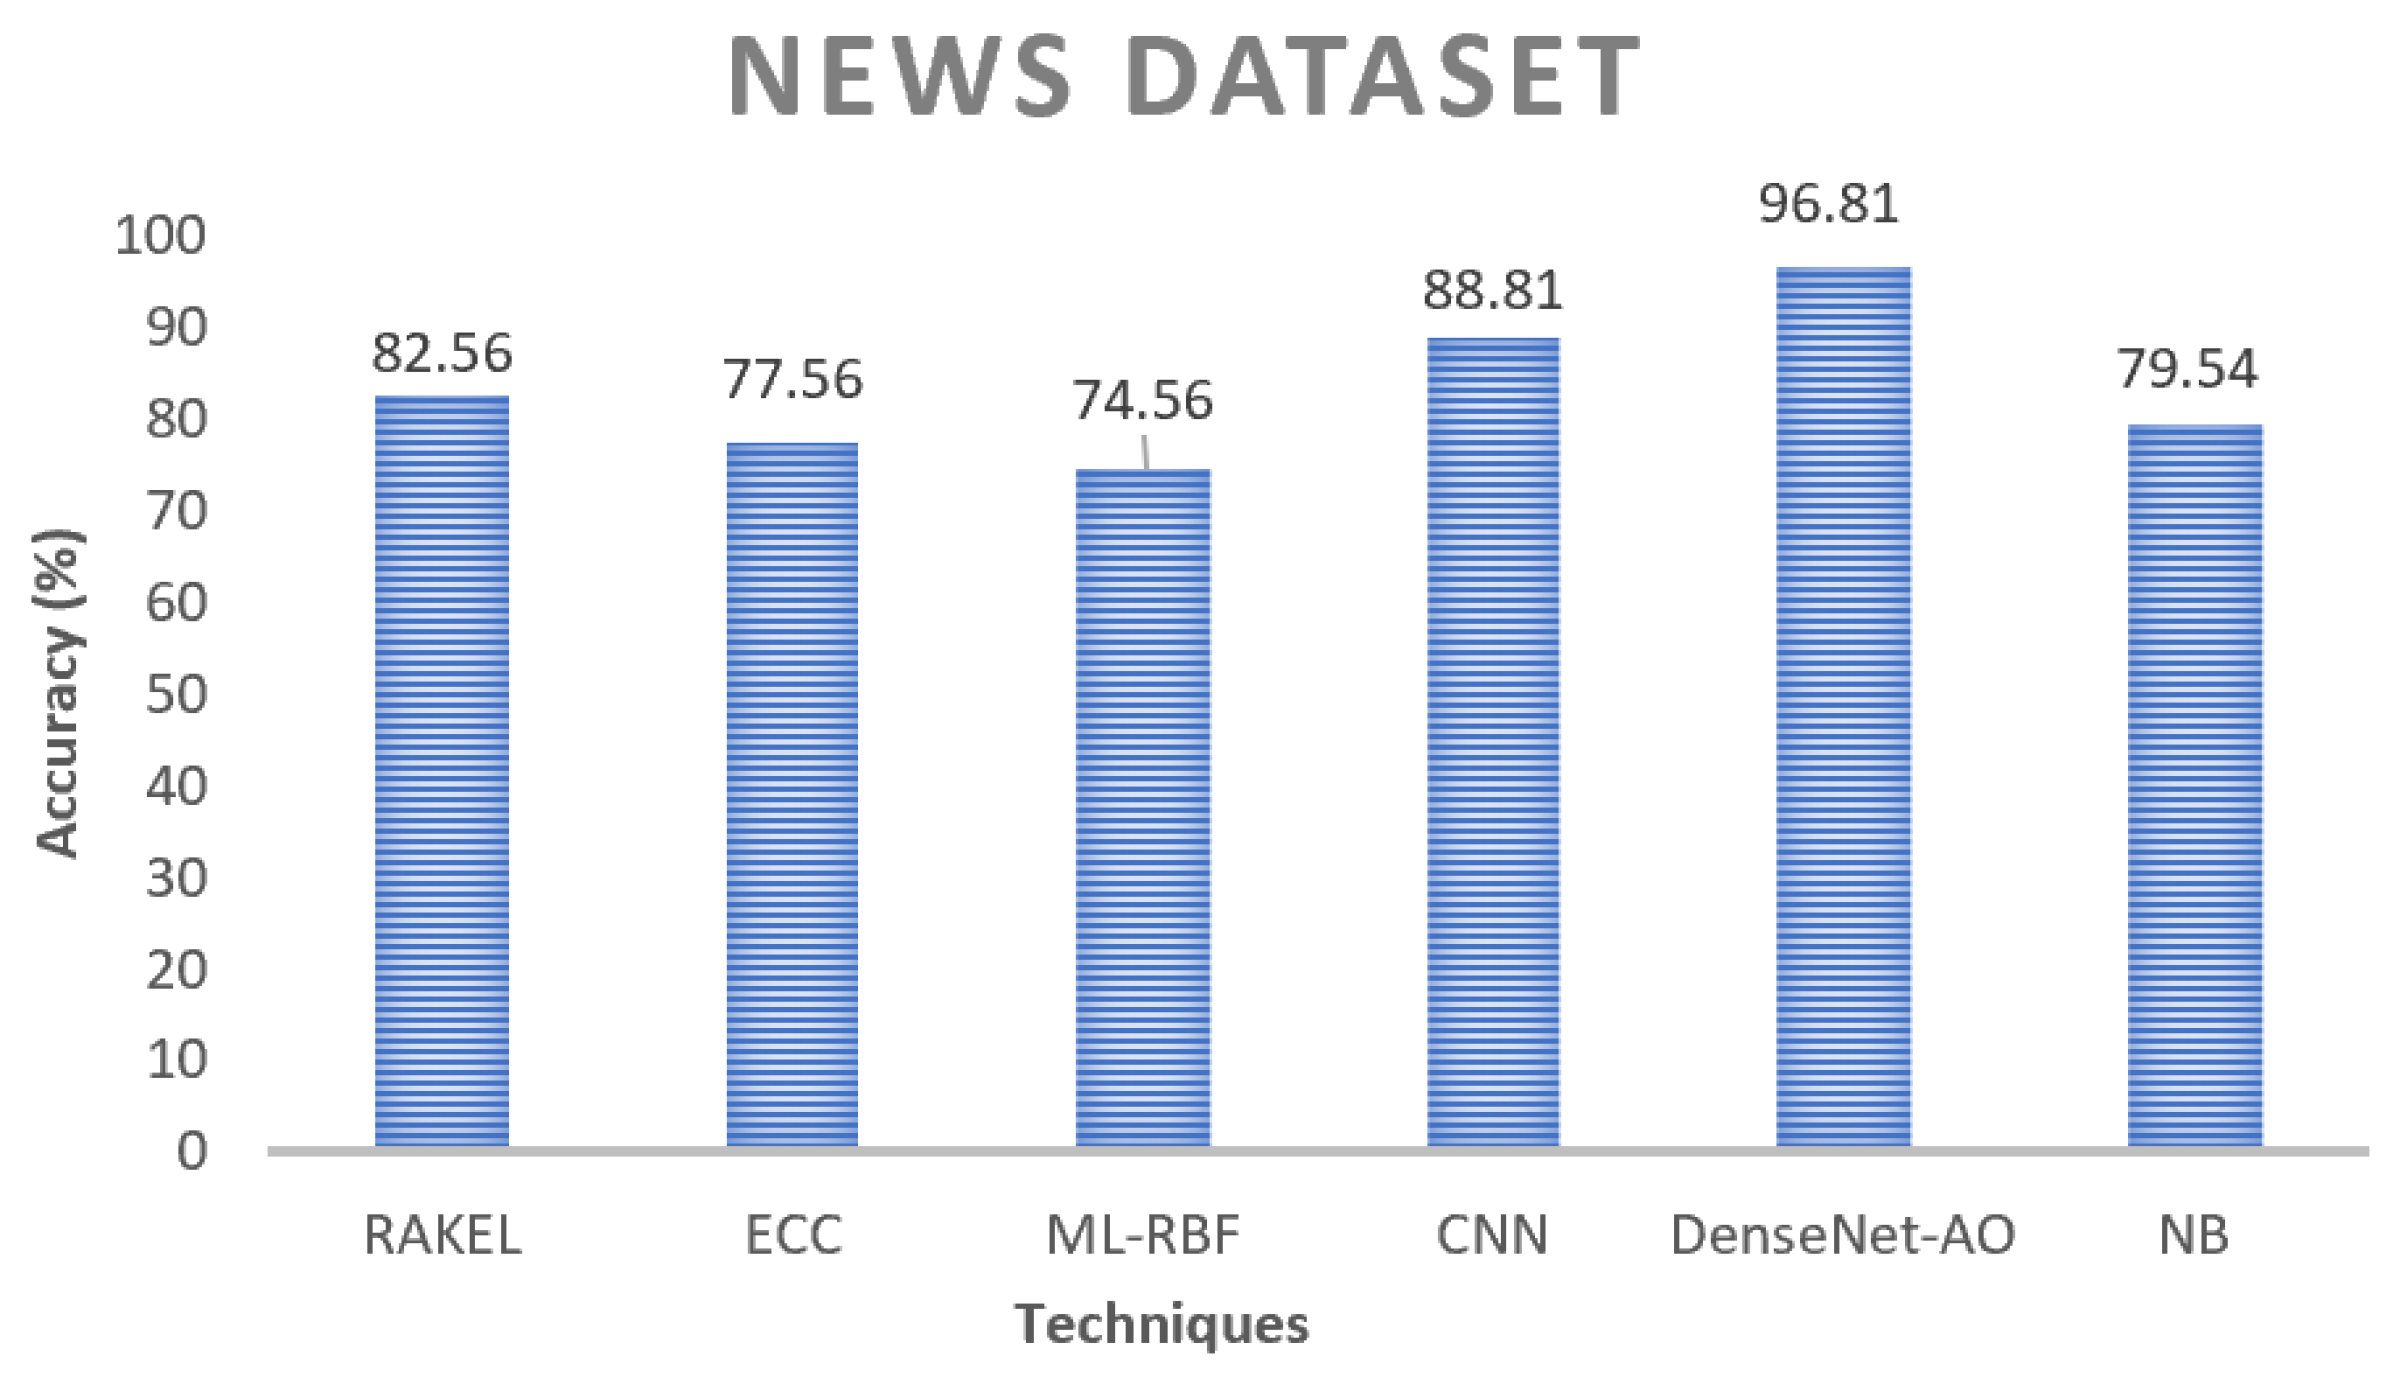
Figure 11 presents an illustrative example of the findings derived from the news dataset. Regarding accuracy, the suggested model EDAO exhibits superior performance compared to other contrasting approaches. Specifically, CNN-CHIO demonstrates higher accuracy on the news dataset than ML-RBF and NB. Notably, NB yields the lowest accuracy ratings among the five models.
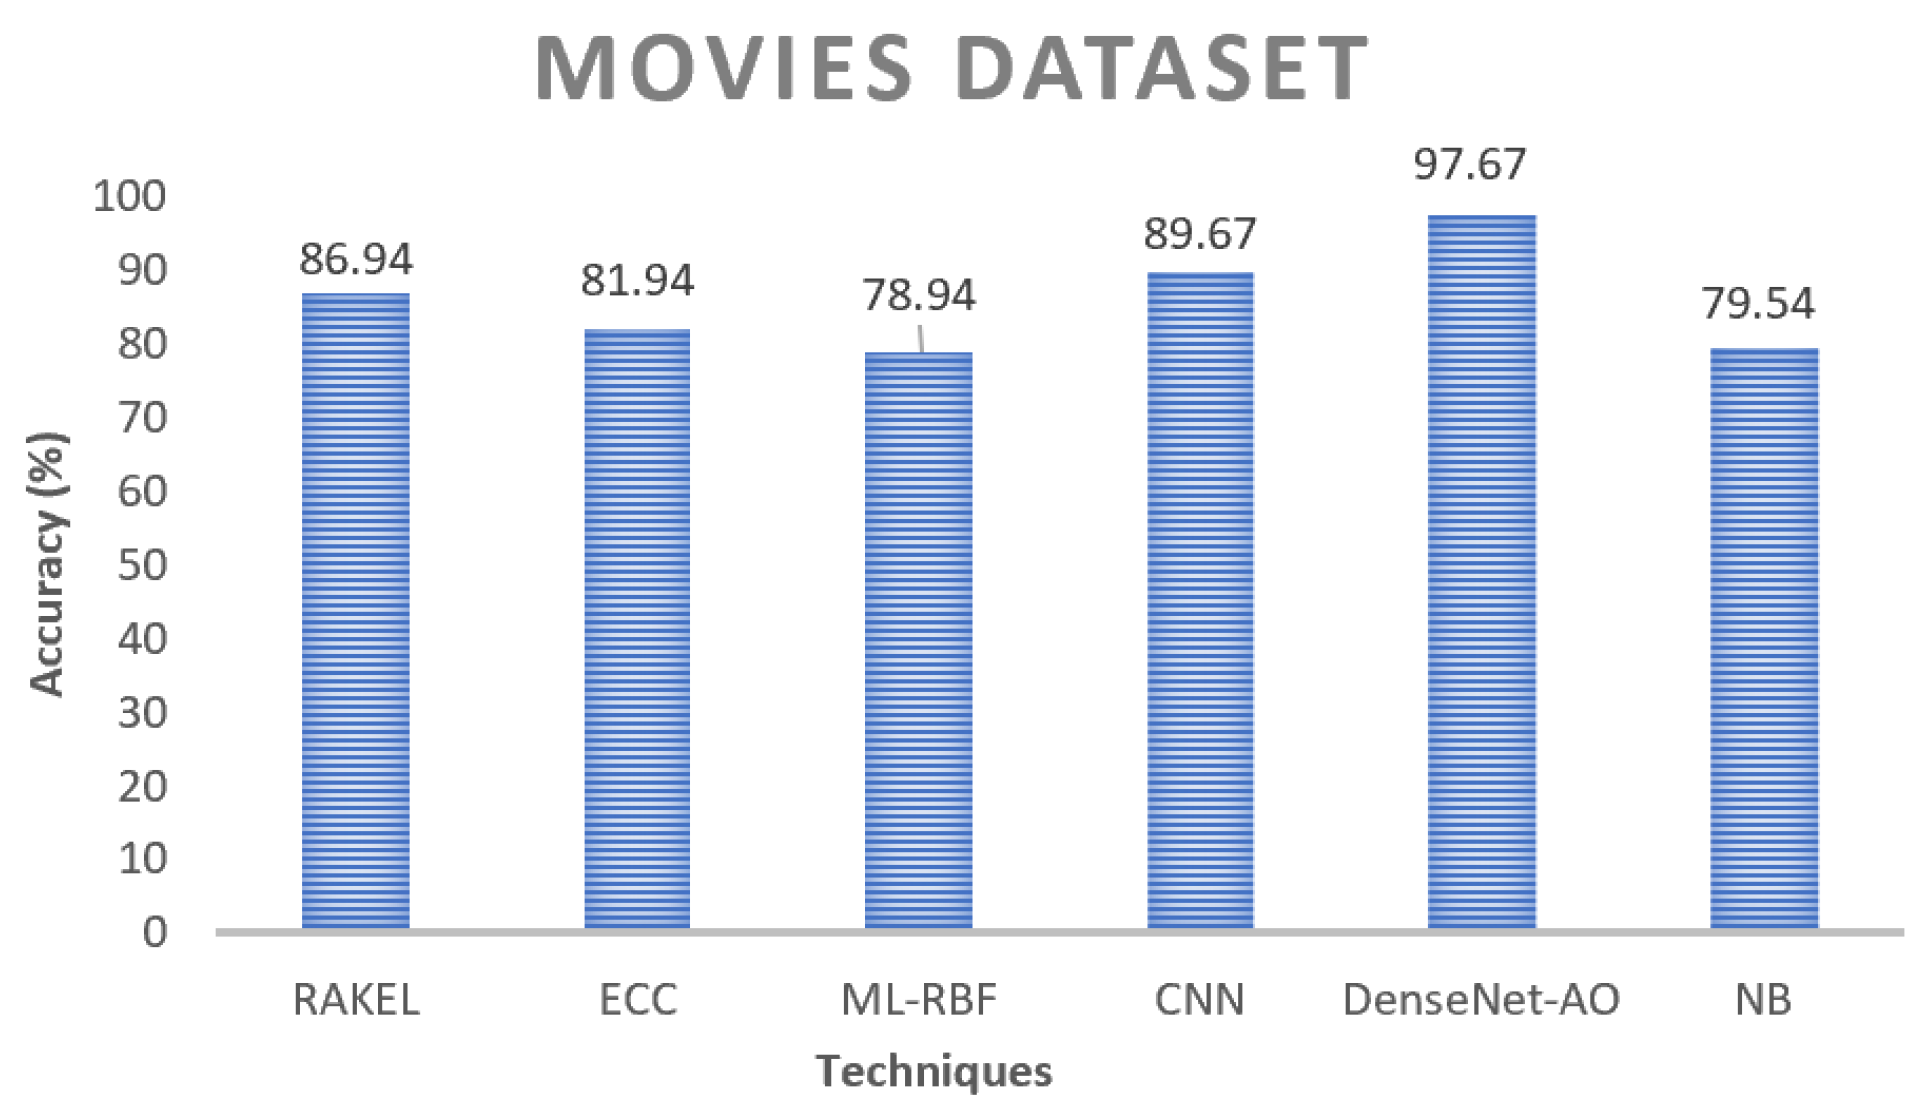
The proposed ensembler achieves a higher overall score on the movie dataset, as seen in Figure 12. Although it is a multi-labeling dataset, even the most complex method performs well. The proposed ensembler outperforms other techniques in terms of precision, f-measurement, accuracy, and recall, as depicted in
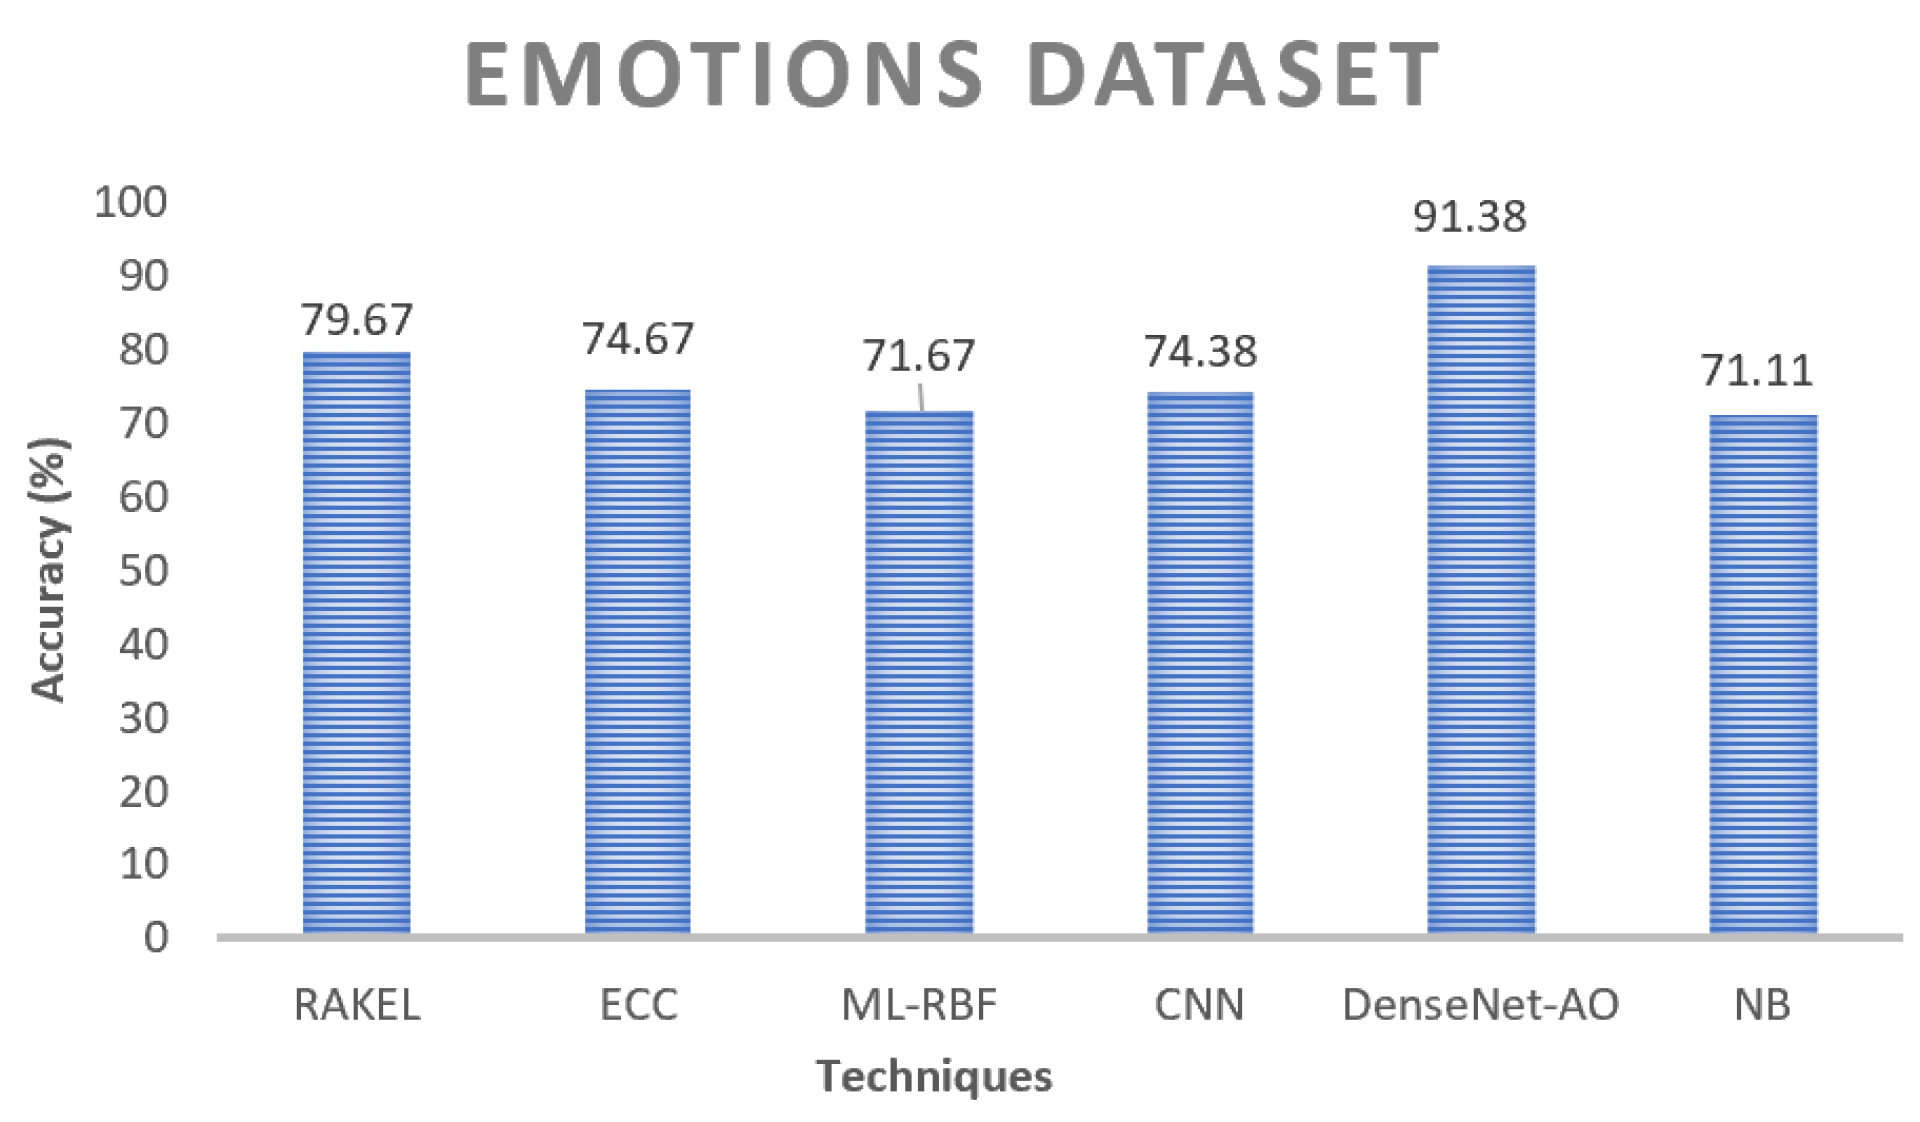
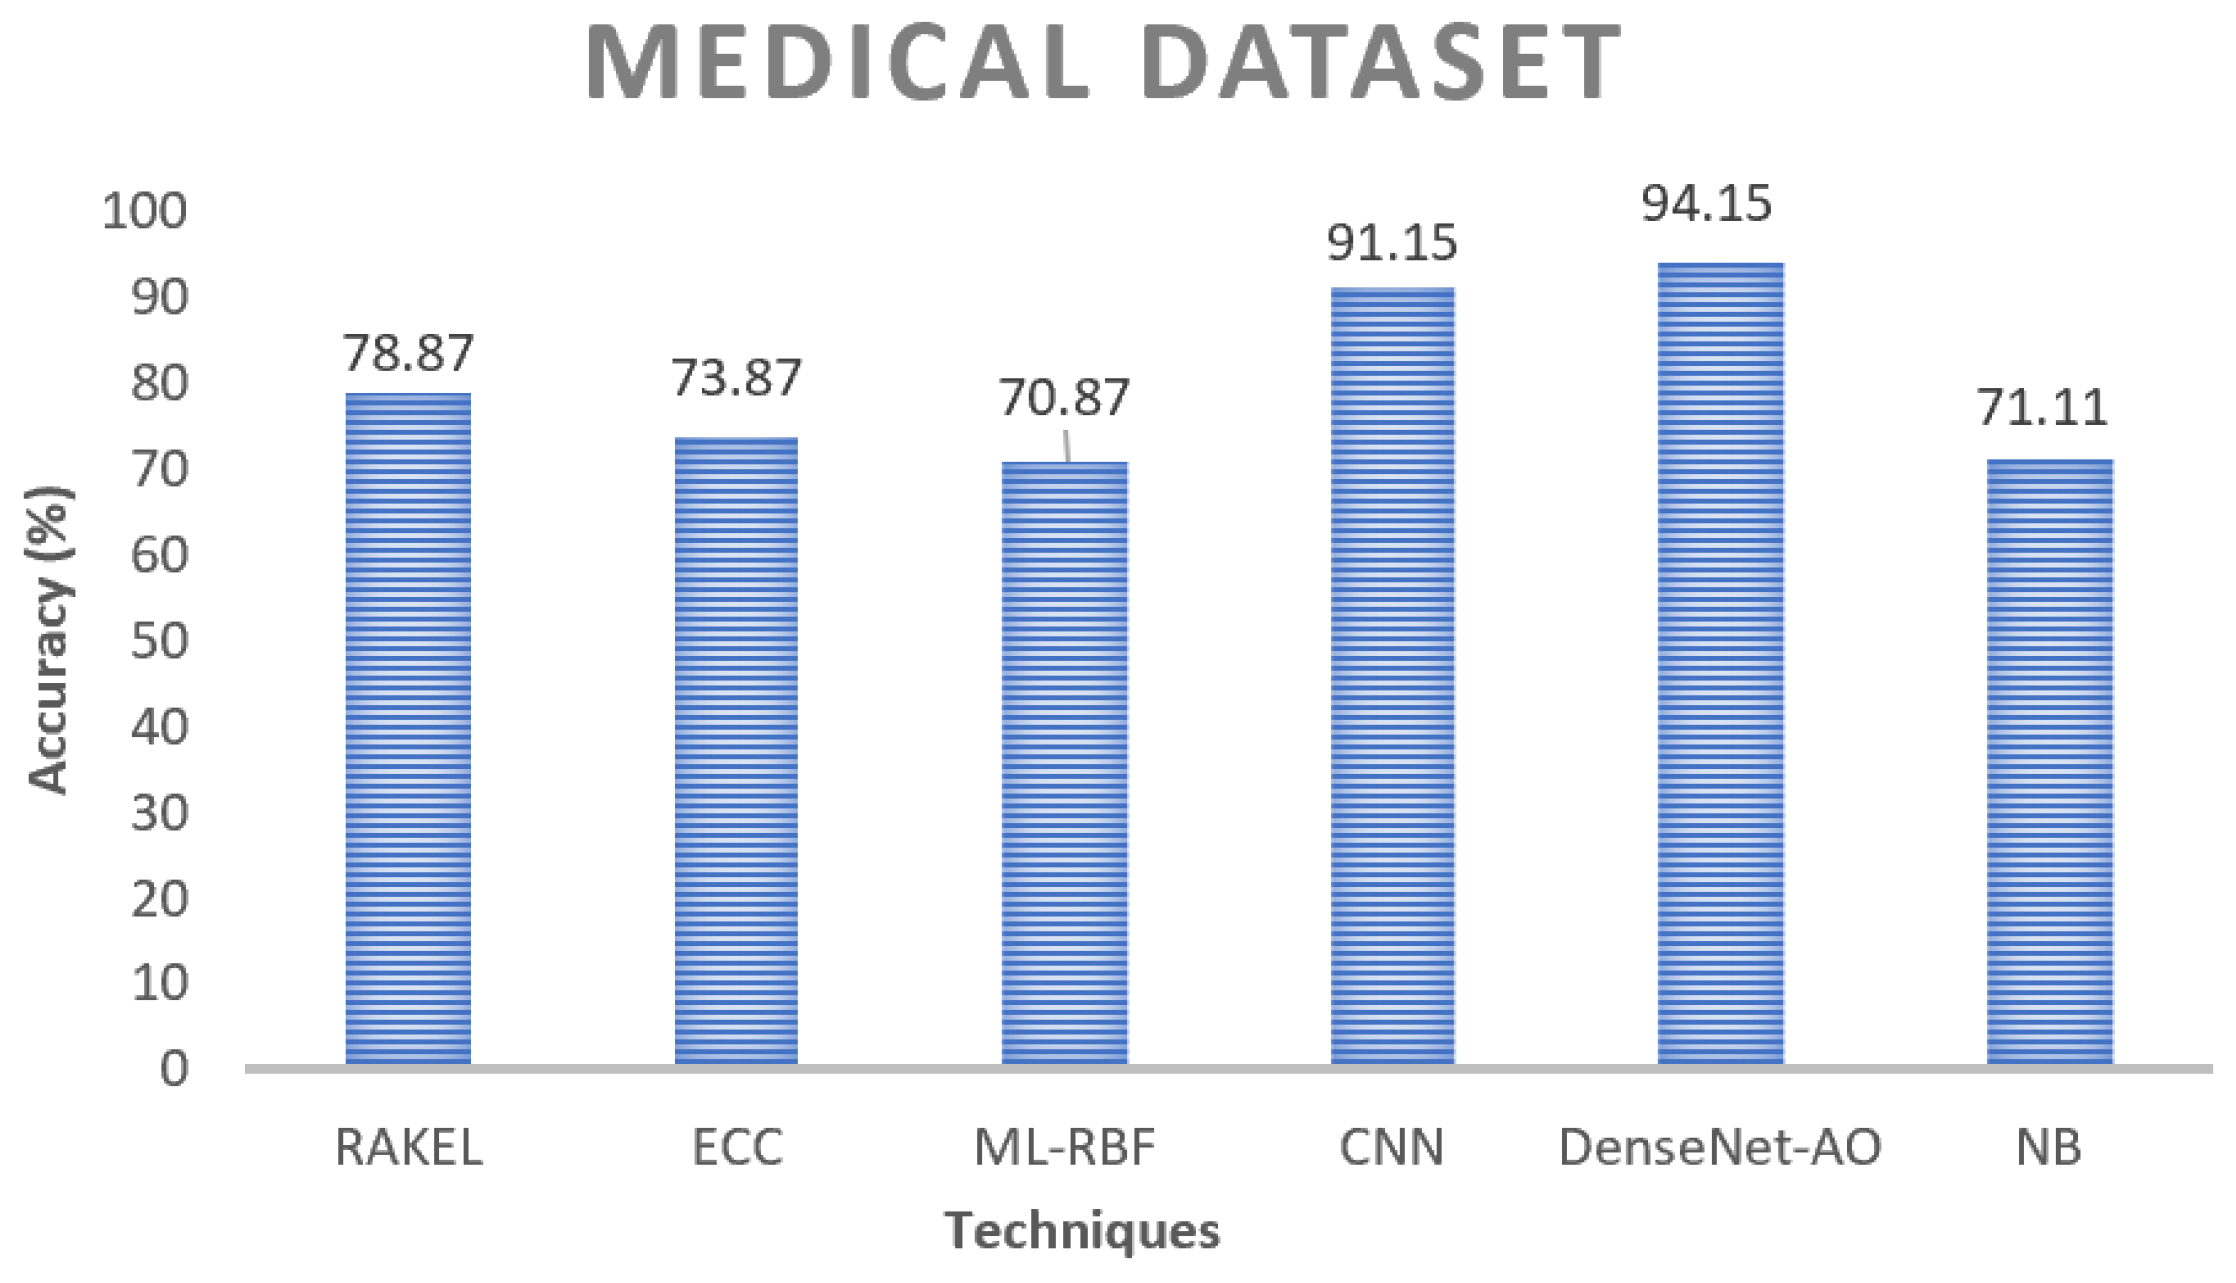
 Figure 13 and Figure 14. The great accuracy implies that the proposed ensembler would produce unexpectedly strong results with multi-labeling data, which is a promising sign. ML-RBF decreases as the running output increases in Figure 11, Figure 12, Figure 13 and Figure 14. From Figure 11, Figure 12, Figure 13 and Figure 14, we can conclude that EDAO is improving. The divergent trends of both aims indicate that they are inherently at odds. It should not come as a surprise. Predicted baseline learner labels intersect with the labels correctly due to the ML-RBF optimization. As a result, all of these fundamental learners appear to be the same.
In contrast, ECC maximization enables base learners to exhibit maximum flexibility in terms of training error. In most situations, the stated goals are opposed to one another. The conflict allows ML-RBF to use population optimization to balance the two goals. It is crucial to note that in this situation, NB and ECC assess the basic learners’ diversity and correctness, not the ensemble’s overall performance. The decrease in ML-RBF does not suggest that there has been a decline in the ensemble. Despite this, the increase in EDAO implies that base learners are becoming more varied, improving group performance. An optimization technique is used to fine-tune the tuning parameters of the ensembler. The precision of multi-labeling is improved as a result of these discoveries. As a result, EDAO consistently enhances a multi-label ensemble’s ability to generalize, enhancing multi-label categorization competence.
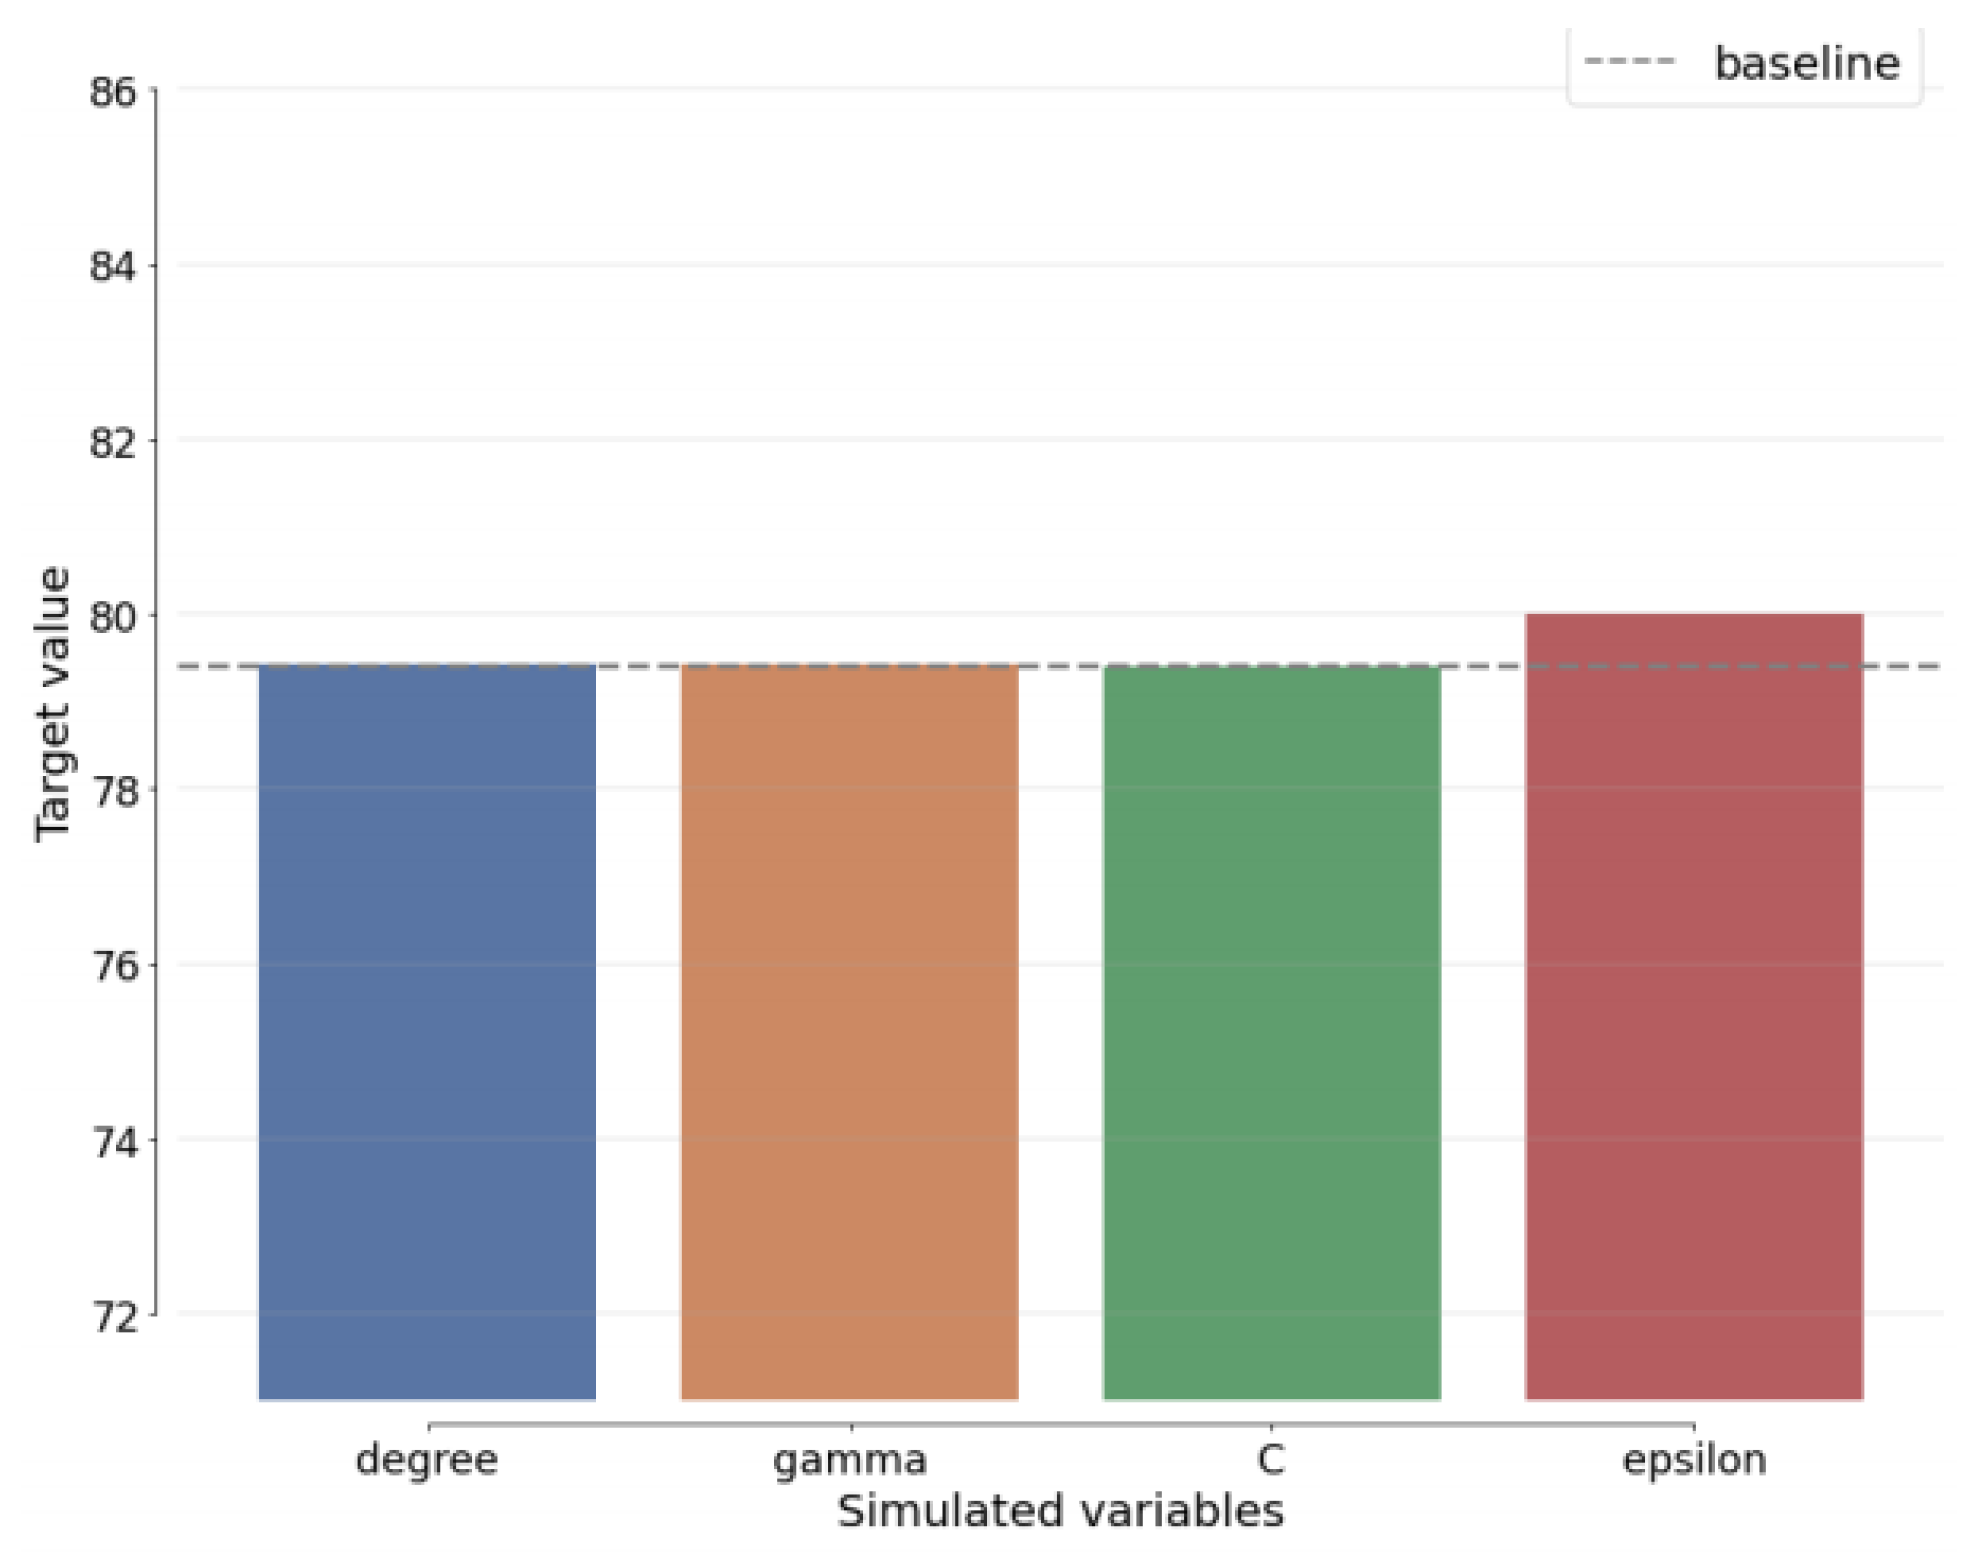
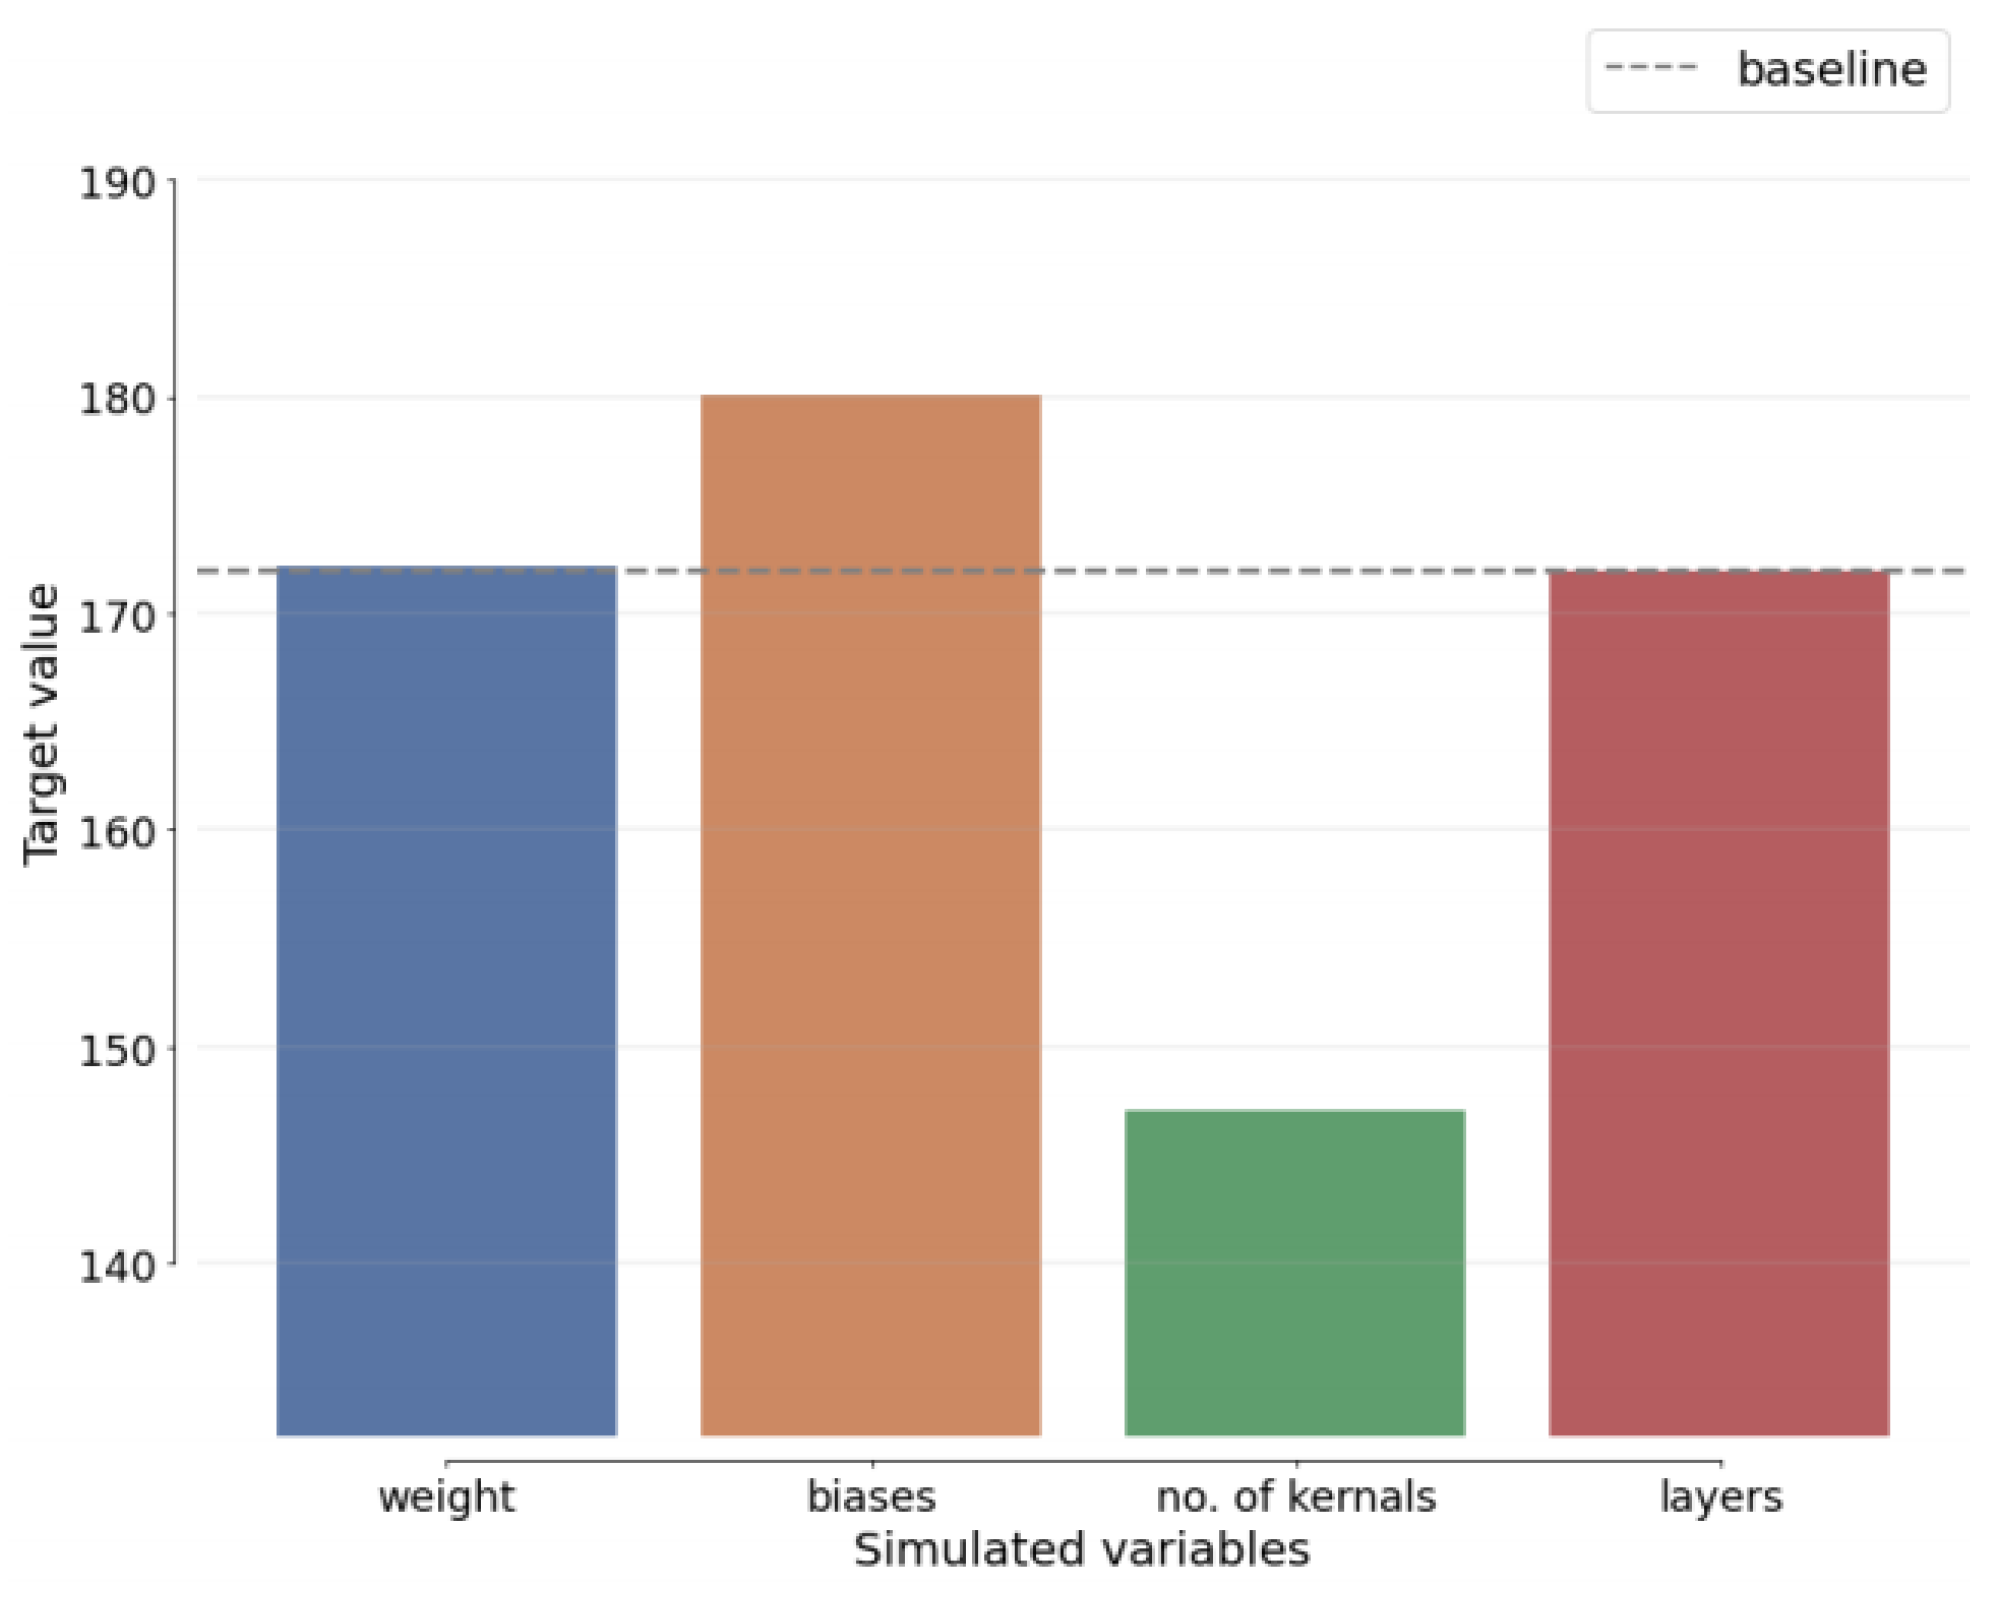
The sensitivity analysis (SA) is a critical aspect of our study as it introduces the element of uncertainty into our evaluation of both benchmark schemes and our proposed algorithm. SA involves calculating the extent of change required for each uncertain element before altering the initial decision. This analysis provides valuable insights into the robustness and stability of our proposed approach.
In Figure 15, we present the results of the sensitivity analysis specific to our recommended technique, DenseNet-AO. This figure showcases the best estimates for each variable within our approach, highlighting how they deviate from the baseline estimate. By visualizing these variations, we gain a deeper understanding of how our proposed method responds to uncertain component changes, further strengthening our approach’s reliability and effectiveness. The SA in Figure 15 serves as a vital component of our study, allowing us to assess the impact of uncertainties on our proposed method’s performance and providing valuable insights for optimizing our approach.
Furthermore, Figure 16 depicts the SA of the most recent benchmark methods. Through SA comparisons, it is evident that the EDAO variables exhibit the least variation among the baseline-related variables, surpassing benchmark algorithms.
Figure 17, Figure 18, Figure 19 and Figure 20 show the confusion matrix of DenseNet-AO and other existing models, which demonstrates the best performance among the models.
Table 9 determines the limitations the EDAO approach addresses, highlighting its significant advancements in multi-label sentiment analysis. EDAO offers distinct advantages over existing methods through its integration of accuracy and diversity, the utilization of DenseNet-AO, improved generalization efficiency, robust decision-making, and efficient label space transformation. These features contribute to EDAO’s effectiveness in capturing sentiment variations, enhancing performance, and handling complex multi-label datasets.
Table 10 compares execution times in seconds for various techniques used in different domains. These values represent approximate execution times based on real-world scenarios. The DenseNet-AO technique stands out with notably lower execution times across all domains, ranging from 20 to 35. It indicates its efficient computational complexity, making it a promising choice for tasks in the news, emotion, medical, bird, hotel, automobile, movie, and protein domains.
On the other hand, the RAKEL technique demonstrates varying execution times, with some domains taking longer than others. For example, it requires around 120 s for emotions and automobiles. The ECC technique also exhibits variability in execution times, with the medical domain having the longest execution time of 180. The ML-RBF and CNN techniques generally show execution times in the 70 s to 120 s range, while the NB technique requires approximately 180s for the medical domain. BERT, LSTM, Transformer, GAT, ResNet, SVM, Logistic Regression, and random forest techniques also display varying execution times across domains from the 70 s to 200 s range.
Table 11 presents the Pearson correlation coefficients between various techniques and domains. The coefficients serve as gauges that measure the intricate connection between two variables, spanning a scale from −1 to 1. A coefficient that gravitates towards 1 signifies a robust positive correlation, while a coefficient approaching −1 indicates a compelling negative correlation. Delving into the tabulated data, we discover that DenseNet-AO consistently showcases remarkable positive correlations across various domains. Its values gracefully range from 0.86 to 0.92, portraying unwavering strength and cohesion. It indicates a strong linear relationship between DenseNet-AO and the respective domains, implying that DenseNet-AO performs consistently well across different data types.
Other techniques such as RAKEL, ECC, ML-RBF, CNN, BERT, LSTM, Transformer, and ResNet also exhibit positive correlations ranging from 0.70 to 0.85, indicating a moderate to strong linear relationship with the domains. These techniques show promising performance in various domains. Conversely, NB reveals negative correlations from −0.32 to −0.35 across most domains. It implies a weak negative linear relationship between NB and the domains, suggesting that NB may not be well-suited for these datasets.
Table 12 presents the results obtained from a comprehensive analysis of variance (ANOVA) conducted on the execution times of various techniques across multiple domains. ANOVA is a robust statistical tool used to determine whether significant differences exist among the means of different groups. Central to this research is the F-value, which indicates the ratio between the observed variability across groups and the variability observed within groups. A higher F-value signifies a more pronounced distinction between the means of these groups. Equally crucial is the p-value, which plays a pivotal role in assessing the statistical significance of the F-value, offering insights into the probability of obtaining such results purely by chance.
Upon a thorough examination of the table, a notable finding emerges. DenseNet-AO stands out prominently, boasting a substantial F-value of 15.24 and an impressively low p-value of 0.001. It indicates that the execution times of DenseNet-AO exhibit significant variations across the diverse domains considered in our analysis. Similarly, techniques such as CNN, Transformer, and random forest display noteworthy F-values ranging from 5.99 to 7.92, coupled with relatively low p-values ranging from 0.006 to 0.012. It suggests these techniques demonstrate substantial differences in execution times across the analyzed domains. However, it is worth noting that certain techniques, including NB, GAT, SVM, and Logistic Regression, exhibit non-significant F-values and relatively higher p-values. This implies that the execution times of these techniques do not vary significantly across the diverse domains considered in our study.

5. Conclusions

A new ensembler based on an optimization approach is created to handle the problem of multi-labeling. SEn, an integrated multi-objective optimization approach, dynamically optimizes two objective functions to measure the accuracy and variety of multi-label learners simultaneously. By generating a diverse collection of exact multi-label base learners, EDAO enhances the prediction capabilities of the system. The primary goal of this project is to improve the efficiency of the MLL system by incorporating accurate and diverse ML-based learners. To tackle the challenges of multi-labeling, we have developed a novel form of ensembler that leverages optimal algorithms. EDAO combines a swarm multi-objective optimization technique with ML to optimize the two objective functions dynamically, quantifying the accuracy and variety of learners and generating accurate and diverse predictions. Extensive studies have demonstrated that EDAO significantly enhances the generalization capabilities of multi-label classification systems while improving the model’s prediction performance.

Author Contributions

Conceptualization, N.A.; Methodology: N.A. and T.; Formal analysis and investigation, S.H. and J.I.; Writing—original draft preparation, N.A.; Writing—review and editing, S.S.U. and S.H.; Funding acquisition, S.S.U.; Resources: N.A.; Supervision: S.H. and S.S.U. All authors have read and agreed to the published version of the manuscript.

Funding

This research received no external funding.

Institutional Review Board Statement

Not applicable.

Informed Consent Statement

Not applicable.

Data Availability Statement

Publicly available datasets were analyzed in this study. The data can be found here: [51,52,53].

Conflicts of Interest

The authors declare no conflict of interest.

Abbreviations

The following abbreviations are used in this manuscript:
AOAquila Optimizer
BRBinary Relevance
CCClassifier Chain
CNNConvolutional NN
EDAOEnsemble of DenseNet based on Aquila Optimizer
LBLabel Combination
MLMachine Learning
MLLMulti-Label Learner
NN Neural Networks
SA Sensitivity Analysis
SVM Support Vector Machine

References

  1. Singh, P. Money Laundering and Abuse of the Financial System. Indian JL & Legal Rsch. 2023, 5, 1. [Google Scholar]
  2. Wu, C.; Xiong, Q.; Yi, H.; Yu, Y.; Zhu, Q.; Gao, M.; Chen, J. Multiple-element joint detection for aspect-based sentiment analysis. Knowl.-Based Syst. 2021, 223, 107073. [Google Scholar] [CrossRef]
  3. Sun, J.; Lang, J.; Fujita, H.; Li, H. Imbalanced enterprise credit evaluation with DTE-SBD: Decision tree ensemble based on SMOTE and bagging with differentiated sampling rates. Inf. Sci. 2018, 425, 76–91. [Google Scholar] [CrossRef]
  4. Piri, S.; Delen, D.; Liu, T. A synthetic informative minority over-sampling (SIMO) algorithm leveraging support vector machine to enhance learning from imbalanced datasets. Decis. Support Syst. 2018, 106, 15–29. [Google Scholar] [CrossRef]
  5. Zhang, C.; Tan, K.C.; Li, H.; Hong, G.S. A cost-sensitive deep belief network for imbalanced classification. IEEE Trans. Neural Netw. Learn. Syst. 2018, 30, 109–122. [Google Scholar] [CrossRef]
  6. Collell, G.; Prelec, D.; Patil, K.R. A simple plug-in bagging ensemble based on threshold-moving for classifying binary and multiclass imbalanced data. Neurocomputing 2018, 275, 330–340. [Google Scholar] [CrossRef] [PubMed]
  7. Yu, H.; Sun, D.; Xi, X.; Yang, X.; Zheng, S.; Wang, Q. Fuzzy one-class extreme autoencoder. Neural Process. Lett. 2019, 50, 701–727. [Google Scholar] [CrossRef]
  8. Ben, X.; Zhang, P.; Lai, Z.; Yan, R.; Zhai, X.; Meng, W. A general tensor representation framework for cross-view gait recognition. Pattern Recogn. 2019, 90, 87–98. [Google Scholar] [CrossRef]
  9. Ben, X.; Gong, C.; Zhang, P.; Jia, X.; Wu, Q.; Meng, W. Coupled Patch Alignment for Matching Cross-view Gaits. IEEE Trans. Image Process. 2019, 28, 3142–3157. [Google Scholar] [CrossRef]
  10. Wang, S.; Yang, L.Y. Adaptive bi-weighting toward automatic initialization and model selection for HMM-based hybrid meta-clustering ensembles. IEEE Trans. Cybern. 2019, 49, 1657–1668. [Google Scholar]
  11. Moyano, J.M.; Gibaja, E.L.; Cios, K.J.; Ventura, S. Review of ensembles of multi-label classifiers: Models, experimental study, and prospects. Inform. Fusion 2018, 44, 33–45. [Google Scholar] [CrossRef]
  12. García-Pablos, A.; Cuadros, M.; Rigau, G. W2VLDA: Almost unsupervised system for aspect-based sentiment analysis. Expert Syst. Appl. 2018, 91, 127–137. [Google Scholar] [CrossRef]
  13. Kumar, V.; Pujari, A.K.; Padmanabhan, V.; Kagita, V.R. Group preserving label embedding for multi-label classification. Pattern Recognit. 2019, 90, 23–34. [Google Scholar] [CrossRef]
  14. Deng, M.; Wang, C.; Tang, M.; Zheng, T. Extracting cardiac dynamics within ECG signal for human identification and cardiovascular diseases classification. Neural Netw. 2018, 100, 70–83. [Google Scholar] [CrossRef] [PubMed]
  15. Szymánski, P.; Kajdanowicz, T. Scikit-multilearn: A scikit-based Python environment for performing multi-label classification. J. Mach. Learn. Res. 2019, 20, 209–230. [Google Scholar]
  16. Cevikalp, H.; Benligiray, B.; Gerek, O.N. Semi-supervised robust deep neural networks for multi-label image classification. Pattern Recognit. 2020, 100, 107164. [Google Scholar] [CrossRef]
  17. Charte, F.; Rivera, A.J.; Charte, D.; del Jesus, M.J.; Herrera, F. Tips, guidelines and tools for managing multi-label datasets: The mldr.datasets R package and the cometa data repository. Neurocomputing 2018, 289, 68–85. [Google Scholar] [CrossRef]
  18. Ning, F.; Delhomme, D.; LeCun, Y.; Piano, F.; Bottou, L.; Barbano, P.E. Toward automatic phenotyping of developing embryos from videos. IEEE Trans. Image Process. 2005, 14, 1360–1371. [Google Scholar] [CrossRef]
  19. Mohamed, A.; Dahl, G.E.; Hinton, G. Acoustic modeling using deep belief networks. IEEE Trans. Audio Speech Lang. Process. 2012, 20, 14–22. [Google Scholar] [CrossRef]
  20. Banbhrani, S.K.; Xu, B.; Soomro, P.D.; Jain, D.K.; Lin, H. TDO-Spider Taylor ChOA: An Optimized Deep-Learning-Based Sentiment Classification and Review Rating Prediction. Appl. Sci. 2022, 12, 10292. [Google Scholar] [CrossRef]
  21. Liao, S.; Wang, J.; Yu, R.; Sato, K.; Cheng, Z. CNN for situations understanding based on sentiment analysis of Twitter data. Procedia Comput. Sci. 2016, 111, 376–381. [Google Scholar] [CrossRef]
  22. Severyn, A.; Moschitti, A. Twitter sentiment analysis with deep convolutional neural networks. In Proceedings of the SIGIR ’15: The 38th International ACM SIGIR Conference on Research and Development in Information Retrieval, Santiago, Chile, 9–13 August 2015; pp. 959–962. [Google Scholar]
  23. Ouyang, X.; Zhou, P.; Li, C.H.; Liu, L. Sentiment analysis using convolutional neural network. In Proceedings of the 2015 IEEE International Conference on Computer and Information Technology; Ubiquitous Computing and Communications; Dependable, Autonomic and Secure Computing; Pervasive Intelligence and Computing, Liverpool, UK, 26–28 October 2015; pp. 2359–2364. [Google Scholar]
  24. Liu, S.M.; Chen, J.H. A multi-label classification-based approach for sentiment classification. Expert Syst. Appl. 2015, 42, 1083–1093. [Google Scholar] [CrossRef]
  25. Montañes, E.; Senge, R.; Barranquero, J.; Quevedo, J.R.; del Coz, J.J.; Hüllermeier, E. Dependent binary relevance models for multi-label classification. Pattern Recognit. 2014, 47, 1494–1508. [Google Scholar] [CrossRef]
  26. Wu, G.; Zheng, R.; Tian, Y.; Liu, D. Joint Ranking SVM and Binary Relevance with robust Low-rank learning for multi-label classification. Neural Netw. 2020, 122, 24–39. [Google Scholar] [CrossRef] [PubMed]
  27. Lin, X.; Chen, X.W. Mr.KNN: Soft relevance for multi-label classification. In Proceedings of the 19th ACM International Conference on Information and Knowledge Management, Virtual, 19–23 October 2010; pp. 349–358. [Google Scholar]
  28. Wu, G.; Tian, Y.; Zhang, C. A unified framework implementing linear binary relevance for multi-label learning. Neurocomputing 2018, 289, 86–100. [Google Scholar] [CrossRef]
  29. Yan, Y.; Wang, Y.; Gao, W.C.; Zhang, B.W.; Yang, C.; Yin, X.C. LSTM: Multi-Label Ranking for Document Classification. Neural Process. Lett. 2018, 47, 117–138. [Google Scholar] [CrossRef]
  30. Azarbonyad, H.; Dehghani, M.; Marx, M.; Kamps, J. Learning to rank for multi-label text classification: Combining different sources of Information. Nat. Lang. Eng. 2020, 27, 89–111. [Google Scholar] [CrossRef]
  31. Nguyen, T.T.; Dang, M.T.; Luong, A.V.; Liew, A.W.-C.; Liang, T.; McCall, J. Multi-label classification via incremental clustering on an evolving data stream. Pattern Recognit. 2019, 95, 96–113. [Google Scholar] [CrossRef]
  32. Nguyen, T.T.T.; Nguyen, T.T.; Luong, A.V.; Nguyen, Q.V.H.; Liew, A.W.-C.; Stantic, B. Multi-label classification via label correlation and first order feature dependence in a data stream. Pattern Recognit. 2019, 90, 35–51. [Google Scholar] [CrossRef]
  33. Reyes, O.; Ventura, S. Evolutionary strategy to perform batch-mode active learning on multi-label data. ACM Trans. Intell. Syst. Tech. 2018, 6, 46:1–46:26. [Google Scholar] [CrossRef]
  34. Wang, R.; Wang, X.-Z.; Kwong, S.; Xu, C. Incorporating diversity and informativeness in multiple-instance active learning. IEEE Trans. Fuzzy Syst. 2018, 25, 1460–1475. [Google Scholar] [CrossRef]
  35. Wang, X.-Z.; Wang, R.; Xu, C. Discovering the relationship between generalization and uncertainty by incorporating complexity of classification. IEEE Trans. Cybern. 2018, 48, 703–715. [Google Scholar] [CrossRef]
  36. Wei, X.; Yu, Z.; Zhang, C.; Hu, Q. Ensemble of label specific features for multi-label classification. In Proceedings of the 2018 IEEE International Conference on Multimedia and Expo (ICME), San Diego, CA, USA, 23–27 July 2018. [Google Scholar]
  37. Yapp, E.K.; Li, X.; Lu, W.F.; Tan, P.S. Comparison of base classifiers for MLL. Neurocomputing 2020, 394, 51–60. [Google Scholar] [CrossRef]
  38. Zhang, M.L.; Li, Y.K.; Liu, X.Y.; Geng, X. Binary relevance for MLL: An overview. Front. Comput. Sci. 2018, 12, 191–202. [Google Scholar] [CrossRef]
  39. Zhou, J.-P.; Chen, L.; Guo, Z.-H. iATC-NRAKEL: An efficient multi-label classifier for recognizing anatomical therapeutic chemical classes of drugs. Bioinformatics 2020, 36, 1391–1396. [Google Scholar] [CrossRef]
  40. Xie, M.-K.; Huang, S.-J. Partial MLL. In Proceedings of the AAAI, New Orleans, LA, USA, 2–7 February 2018; pp. 4302–4309. [Google Scholar]
  41. Zhou, Z.-H. A brief introduction to weakly supervised learning. Nat. Sci. Rev. 2018, 5, 44–53. [Google Scholar] [CrossRef]
  42. Al-Smadi, M.; Qawasmeh, O.; Al-Ayyoub, M.; Jararweh, Y.; Gupta, B. Deep recurrent neural network vs. support vector machine for aspect-based sentiment analysis of Arabic hotels’ reviews. J. Comput. Sci. 2018, 27, 386–393. [Google Scholar] [CrossRef]
  43. Ghosh, S.; Ekbal, A.; Bhattacharyya, P. A multitask framework to detect depression, sentiment and multi-label emotion from suicide notes. Cogn. Comput. 2022, 14, 110–129. [Google Scholar] [CrossRef]
  44. Al-Smadi, M.; Al-Ayyoub, M.; Jararweh, Y.; Qawasmeh, O. Enhancing aspect-based sentiment analysis of Arabic hotels’ reviews using morphological, syntactic and semantic features. Inf. Process. Manag. 2019, 56, 308–319. [Google Scholar] [CrossRef]
  45. Da’u, A.; Salim, N.; Rabiu, I.; Osman, A. Recommendation system exploiting aspect-based opinion mining with deep learning method. Inf. Sci. 2020, 512, 1279–1292. [Google Scholar]
  46. Kumar, J.A.; Trueman, T.E.; Cambria, E. Gender-based multi-aspect sentiment detection using multilabel learning. Inf. Sci. 2022 606, 453–468. [CrossRef]
  47. Fu, X.; Wei, Y.; Xu, F.; Wang, T.; Lu, Y.; Li, J.; Huang, J.Z. Semi-supervised aspect-level sentiment classification model based on variational autoencoder. Knowl.-Based Syst. 2019, 171, 81–92. [Google Scholar] [CrossRef]
  48. Gu, X.; Gu, Y.; Wu, H. Cascaded convolutional neural networks for aspect-based opinion summary. Neural Process. Lett. 2017, 46, 581–594. [Google Scholar] [CrossRef]
  49. Gargiulo, F.; Silvestri, S.; Ciampi, M.; De Pietro, G. Deep neural network for hierarchical extreme multi-label text classification. Appl. Soft Comput. 2019, 79, 125–138. [Google Scholar] [CrossRef]
  50. Dahou, A.; Ewees, A.A.; Hashim, F.A.; Al-Qaness, M.A.; Orabi, D.A.; Soliman, E.M.; Abd Elaziz, M. Optimizing fake news detection for Arabic context: A multitask learning approach with transformers and an enhanced Nutcracker Optimization Algorithm. Knowl.-Based Syst. 2023, 280, 111023. [Google Scholar] [CrossRef]
  51. MultiLabel Dataset. Available online: http://www.uco.es/kdis/mllresources/ (accessed on 15 June 2023).
  52. MultiLabel Dataset. Available online: www.booking.com/hotel-reviews (accessed on 16 June 2023).
  53. MultiLabel Dataset. Available online: https://sci2s.ugr.es/keel/multilabel.php (accessed on 17 June 2023).
  54. Abualigah, L.; Yousri, D.; Abd Elaziz, M.; Ewees, A.A.; Al-Qaness, M.A.; Gandomi, A.H. Aquila optimizer: A novel meta-heuristic optimization algorithm. IEEE Access 2021, 9, 107250. [Google Scholar] [CrossRef]
  55. Charte, F. A comprehensive and didactic review on multi-label learning software tools. IEEE Access 2020, 8, 50330–50354. [Google Scholar] [CrossRef]
  56. Mai, L.; Le, B. Aspect-based sentiment analysis of Vietnamese texts with deep learning. In Proceedings of the Asian Conference on Intelligent Information and Database Systems, Dong Hoi City, Vietnam, 19–21 March 2018; Springer: Cham, Switzerland, 2018; pp. 149–158. [Google Scholar] [CrossRef]
Figure 1. Virtualization of multi-labeling [12].
Algorithms 16 00548 g001
Figure 2. Proposed System Model for multi-labeling.
Algorithms 16 00548 g002
Figure 3. DenseNet model.
Algorithms 16 00548 g003
Figure 4. Flow of DenseNet.
Algorithms 16 00548 g004
Figure 5. AO’s working flow.
Algorithms 16 00548 g005
Figure 6. Proposed model accuracy.
Algorithms 16 00548 g006
Figure 7. Proposed model loss.
Algorithms 16 00548 g007
Figure 8. Frequency-based features of the emotion dataset.
Algorithms 16 00548 g008
Figure 9. Frequency-based features of the medical dataset.
Algorithms 16 00548 g009
Figure 10. Frequency-based features of the news dataset.
Algorithms 16 00548 g010
Figure 11. Classifier accuracy on the news dataset.
Algorithms 16 00548 g011
Figure 12. Classifier accuracy on the movie dataset.
Algorithms 16 00548 g012
Figure 13. Classifier accuracy on the emotion dataset.
Algorithms 16 00548 g013
Figure 14. Accuracy of classifiers on medical dataset.
Algorithms 16 00548 g014
Figure 15. Proposed ensembler sensitivity analysis.
Algorithms 16 00548 g015
Figure 16. CNN sensitivity analysis.
Algorithms 16 00548 g016
Figure 17. Confusion matrix of DenseNet-AO.
Algorithms 16 00548 g017
Figure 18. Confusion matrix of NB.
Algorithms 16 00548 g018
Figure 19. Confusion matrix of BERT.
Algorithms 16 00548 g019
Figure 20. Confusion matrix of CNN.
Algorithms 16 00548 g020
Table 1. Summary of transformation techniques.
NameDescription of Algorithms
IPFInterior Function of Penalty
FIMFForeword Sequence + Label Combination Limited Mutual Information Interaction Sequence
MAMFSSequential Forward Selection + High-Order Label Combination + Mutual Information
MDMROne by One + Mutual Information Selecting Forward Sequences
MFNMIn Forward Sequence Selection + Mutual Information Determined Locally
MIFSOptimization Alternative
PSO-MMIParticle Swarm Optimization
mRMROne by One + Mutual Information + Next Sequence
PMUForward Sequence + Label Combination Second Order + Mutual Information
Table 2. Comparison of multi-label text classification approaches.
ApproachAdvantagesDisadvantages
BRSimple and fastDoes not model label correlations, affected by class imbalance, requires complete labeled data
Pairwise (PW)Conceptually straightforwardTime complexity concerns, ineffective for overlapping labels, needs complete labeled data
Power Set LabelAccounts for label correlationsComputational complexity issues, prone to overfitting
Pruned Sets MethodHandles irregular labeling, operates quickly, considers label correlationsRelies on predictive confidence function, challenges with unlabeled data
Ensembles of Pruned Sets (EPS)Efficient predictive performance, parallel processingDoes not utilize unlabeled data
C4.5Allows attribute selection, enhances learnabilityDoes not consider class correlations, cannot use unlabeled data
AdaBoost-MRAdaBoost-MH and minimize hamming loss errors, improve accuracyPoor performance, does not use unlabeled data
ML-kNNEnhances performance works well with text and image dataDoes not exploit unlabeled data
BP-MLLProvides optimal generalization capabilitiesHigh computational complexity during training, does not use unlabeled data
CNN-HFConsiders correlations between data and classesReduces accuracy with unlabeled data
Table 3. Characteristics of datasets.
DomainNumber of LabelsNumber of FeaturesDomain Type
Hotel719,000Text
Medical79000Biology
Movies712,000Textual
Proteins710,000Textual
Automobiles714,000Textual
Emotions719,000Textual
Birds78000Textual
News714,000Media
Table 4. Key aspects and benefits of EDAO in multi-label classification and sentiment analysis.
AspectDescriptionBenefitsNotable FeaturesDataset ApplicationsMain ContributionDirect Relevance
Optimization ApproachEDAO employs an ensemble methodology based on an optimization algorithm to optimize two objective functions dynamically.- Generates accurate and diverse base learnersDynamic optimization of objective functionsMulti-label classification tasksEnhanced generalization efficiency of DNN modelsMulti-objective optimization
Integration of Accuracy and DiversityEDAO integrates accuracy and diversity within the optimization process, ensuring the ensemble consists of precise and diverse learners.- Captures subtle sentiment variations effectivelyAccurate and diverse base learnersSentiment analysisImproved accuracy and variation in sentiment analysisEnsembling techniques
Improved Accuracy and Variation in Sentiment AnalysisEDAO enhances accuracy and variation in sentiment analysis, particularly in multi-label datasets.- Provides more precise and comprehensive sentiment analysis resultsCaptures sentiment nuances and variationsText classificationEnhanced sentiment analysis performanceMulti-label sentiment analysis
Utilization of DenseNet-AOEDAO leverages DenseNet-AO, a variant of DenseNet that targets diversity-related objectives, to capture a wider range of sentiment nuances.- Increases the diversity of predictions, improving performanceDenseNet-AO for capturing sentiment variationsSentiment analysis, image classificationImproved sentiment diversity in predictionsDeep learning architectures, sentiment analysis
Superior PerformanceEDAO consistently outperforms other benchmark schemes and individual learning methods regarding precision, recall, and accuracy.- Enhances the generalization efficiency and prediction performance of multi-label classification tasksImproved precision, recall, and accuracyVarious multi-label classification tasksState-of-the-art performance on benchmark datasetsMulti-label classification, evaluation metrics
Sensitivity AnalysisEDAO provides a sensitivity analysis to quantify uncertainty and variability, demonstrating its reliability in handling uncertain elements.- Offers insights into the robustness and stability of the decision-making processQuantifies uncertainty and variability in decision-makingModel evaluation and uncertainty analysisRobustness and stability analysis of the proposed methodUncertainty analysis, decision-making process
Table 5. Dataset details.
Characteristic# of Labels# of FeaturesDomain
Hotels719,000Text
Medical79000Biology
Movies712,000Textual
Proteins710,000Textual
Automobiles714,000Textual
Emotions719,000Textual
Birds78000Textual
News714,000Media
Table 6. Benchmark scheme vs EDAO (precision).
TechniquesDatasets (%)
News (%)Emotions (%)Medical (%)Birds (%)Hotel (%)Automobiles (%)Movies (%)Proteins (%)
DenseNet-AO92.2794.2290.2392.2494.6694.2393.8490.77
NB80.972.3480.5361.3462.3467.3482.0958.34
ECC72.1272.867.6770.8870.0373.1170.7873.69
RAKEL77.1277.872.6775.8875.0378.1175.7878.69
CNN85.2788.0286.2384.5685.7486.1186.8481.57
ML-RBF69.1269.864.6767.8867.0370.1167.7870.69
BERT88.6779.5684.7887.4588.2189.5690.1285.32
LSTM79.2374.3276.4578.3278.4579.6781.5677.89
Transformer87.5481.4579.5676.4577.8979.3482.6775.67
GAT81.3278.2375.3272.5673.2175.7880.2372.34
ResNet84.2179.8778.2175.3276.4578.5681.3475.89
SVM78.9575.3472.4570.3471.5673.8977.5670.67
Logistic Regression83.6777.8975.6773.2174.3276.4580.4574.21
Random Forest86.3280.5677.3276.5677.4579.2383.2177.56
Table 7. Recall comparison of benchmark scheme vs. SEn.
TechniquesDatasets (%)
News (%)Emotions (%)Medical (%)Birds (%)Hotel (%)Automobiles (%)Movies (%)Proteins (%)
DenseNet-AO96.3492.3493.4795.5696.6697.4496.3492.54
ML-RBF88.3488.3491.4789.6690.0189.4688.3491.28
RAKEL75.2182.7780.2478.7980.5678.7982.683.78
ECC67.2174.7772.2470.7972.5670.7974.675.78
CNN70.2177.7775.2473.7975.5673.7977.678.78
NB39.0769.3450.5162.7963.3476.3482.6170.34
BERT84.5682.4487.5685.2388.1286.2183.7889.12
LSTM79.1277.8980.6781.3482.7780.2479.6679.66
Transformer87.3485.1288.3486.2189.5687.1286.6788.34
GAT83.5681.2385.1282.5686.2384.3482.3485.12
ResNet91.3489.1292.3490.4591.5690.6789.2392.34
SVM88.1285.5689.5687.1288.3487.5686.7889.56
Logistic Regression86.7883.2187.1284.5686.2185.2384.7887.12
Random Forest89.2387.3490.0188.6789.7888.1287.8990.01
Table 8. Benchmark scheme vs. EDAO (F1-score).
TechniquesDatasets (%)
News (%)Emotions (%)Medical (%)Birds (%)Hotel (%)Automobiles (%)Movies (%)Proteins (%)
DenseNet-AO96.8191.3894.1595.592.3494.4497.6792.22
RAKEL82.5679.6778.8783.9483.6784.4586.9486.34
ECC77.5674.6773.8778.9478.6779.4581.9481.34
ML-RBF74.5671.6770.8775.9475.6776.4578.9478.34
CNN88.8174.3891.1588.5691.3489.4589.6787.76
NB52.5671.1160.6475.5569.6775.5679.5469.11
BERT90.2275.5687.4586.7789.1288.6792.3383.45
LSTM86.1272.3481.3480.5584.5682.3388.2277.67
Transformer93.4578.4590.3489.1292.4591.5694.1588.89
GAT84.5670.7879.1282.3481.5680.8985.4575.67
ResNet89.1275.1286.4584.6788.6786.1289.7882.56
SVM82.4568.5677.5676.4580.4578.5681.6773.22
Logistic Regression78.5665.4571.8972.5676.3474.7879.1268.91
Random Forest89.3478.3485.6785.2288.1287.4588.8984.56
Table 9. Comparative analysis of limitations and solutions in multi-label sentiment analysis with EDAO approach.
RefLimitations of Existing MethodsChallenges Addressed by EDAOHow EDAO Addresses the LimitationsRelated BenefitsProposed Advancements Addressed by EDAO
[1,2,3,4]Narrow focus on accuracyLimited ability to capture sentiment variations and nuancesIntegrates accuracy and diversity through an optimization algorithmImproved sentiment analysis accuracyImproved ensemble learning techniques
[5]Difficulty in handling multi-label datasetsHandling multiple sentiments or emotions associated with a given textLeverages DenseNet-AO to capture subtle variations in sentiment across different textsEffective handling of multi-label datasetsAdvanced deep learning architectures
[6]Limited generalization efficiencyInability to effectively generalize to new or unseen data.Enhances generalization efficiency by dynamically optimizing accuracy and varietyEnhanced generalization efficiencyNovel optimization algorithms
[7,8,9]Lack of robustness and stabilitySensitivity to uncertain elements and variability in decision-makingOffers sensitivity analysis to assess reliability and stabilityImproved robustness and stabilityComprehensive sensitivity analysis
[10,11,13]Computational complexityHigh computational costs in transforming label spacesImplements an efficient and scalable approach to label space transformation using the LP methodEfficient label space transformationEfficient label space transformation methods
[14,15,16,55,56]Insufficient consideration of label dependenciesInability to capture complex relationships between labelsIncorporates classifier chains to capture interdependencies between labelsImproved modeling of label dependenciesEnhanced modeling of label dependencies
[17,18,19,20]Lack of interpretabilityDifficulty understanding and explaining the decision-making processIntroduces a sensitivity analysis to assess the reliability and stability of the decision-making processImproved interpretability and explainabilityComprehensive sensitivity analysis
[21,22,23,24]Limited scalabilityInability to handle large-scale datasets efficientlyUtilizes scalable optimization algorithms and parallel processing techniquesEnhanced scalability and efficiencyScalable optimization algorithms and parallel processing
Table 10. Comparison of execution times (in seconds) for various techniques.
TechniquesDatasets
NewsEmotionsMedicalBirdsHotelAutomobilesMoviesProteins
DenseNet-AO3020352530283222
RAKEL751209085701508075
ECC180758570200808575
ML-RBF70180758070757065
CNN752008012075708085
NB657018080657075120
BERT807585200808515080
LSTM120758085707520075
Transformer85807015085807080
GAT751208075701508075
ResNet120807585702008075
SVM758020075807570120
Logistic Regression701508020070758075
Random Forest858012075857075200
Table 11. Pearson correlation coefficients (statistical analysis).
TechniquesDatasets
NewsEmotionsMedicalBirdsHotelAutomobilesMoviesProteins
DenseNet−AO0.860.920.780.810.900.870.820.91
RAKEL0.700.640.720.680.710.760.690.63
ECC0.450.510.590.470.530.540.580.49
ML−RBF0.600.560.570.620.610.580.630.59
CNN0.780.820.750.770.810.800.790.84
NB−0.32−0.29−0.35−0.29−0.26−0.31−0.28−0.34
BERT0.730.790.700.750.780.770.740.81
LSTM0.680.710.650.670.700.720.660.73
Transformer0.800.830.770.790.820.840.760.85
GAT0.550.580.520.540.570.590.510.61
ResNet0.720.760.690.710.750.740.680.77
SVM0.500.450.490.480.460.470.500.44
Logistic Regression0.650.670.630.640.660.690.620.68
Random Forest0.740.770.710.730.760.780.700.79
Table 12. One-way ANOVA (statistical analysis).
TechniqueF-Valuep-Value
DenseNet-AO15.240.001
RAKEL4.560.028
ECC2.890.076
ML-RBF3.150.061
CNN6.720.012
NB1.050.422
BERT5.360.020
LSTM3.980.034
Transformer7.920.006
GAT2.250.122
ResNet4.860.023
SVM1.420.285
Logistic Regression3.540.045
Random Forest5.990.009
Disclaimer/Publisher’s Note: The statements, opinions and data contained in all publications are solely those of the individual author(s) and contributor(s) and not of MDPI and/or the editor(s). MDPI and/or the editor(s) disclaim responsibility for any injury to people or property resulting from any ideas, methods, instructions or products referred to in the content.

