


A Multi-Class Deep Learning Approach for Early Detection of Depressive and Anxiety Disorders Using Twitter Data
Abstract
:1. Introduction
1.1. Overview of Depression and Anxiety Disorders
1.2. Detection of Depression and Anxiety Disorders on the Twitter Platform
1.3. Paper Structure
2. Related Works
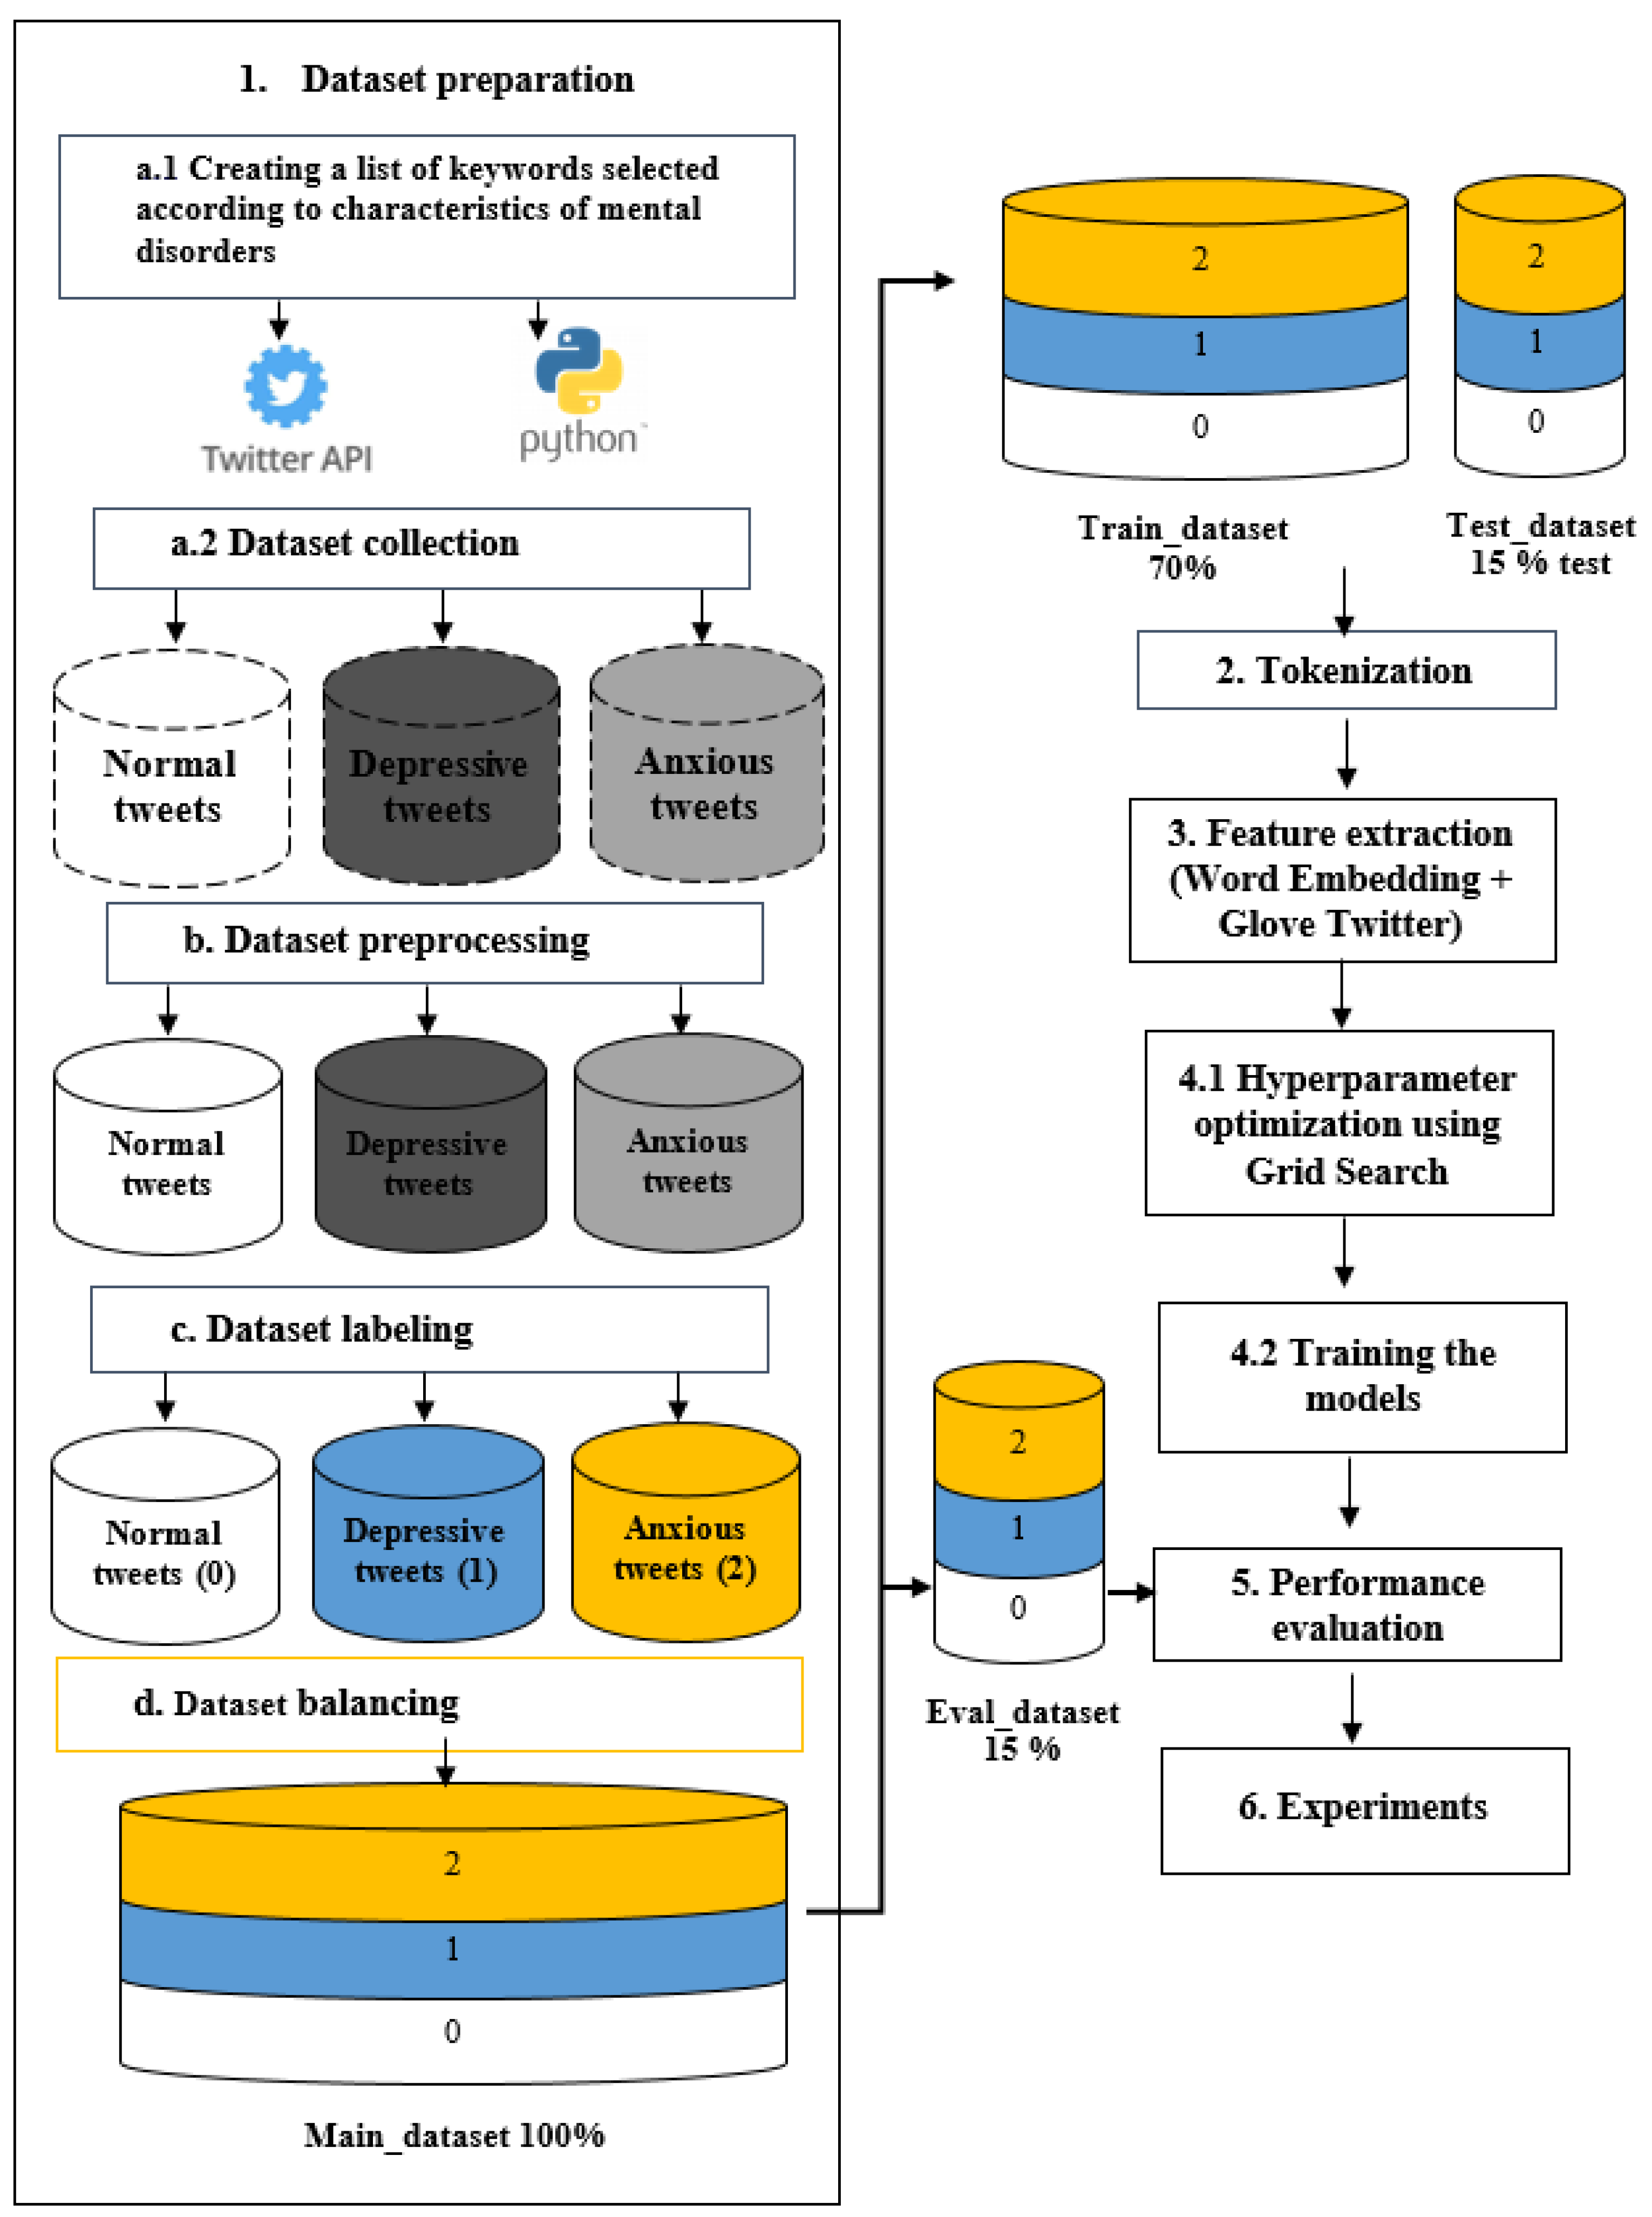
3. Research Methodology
3.1. Preparation Dataset
3.1.1. Data Collection
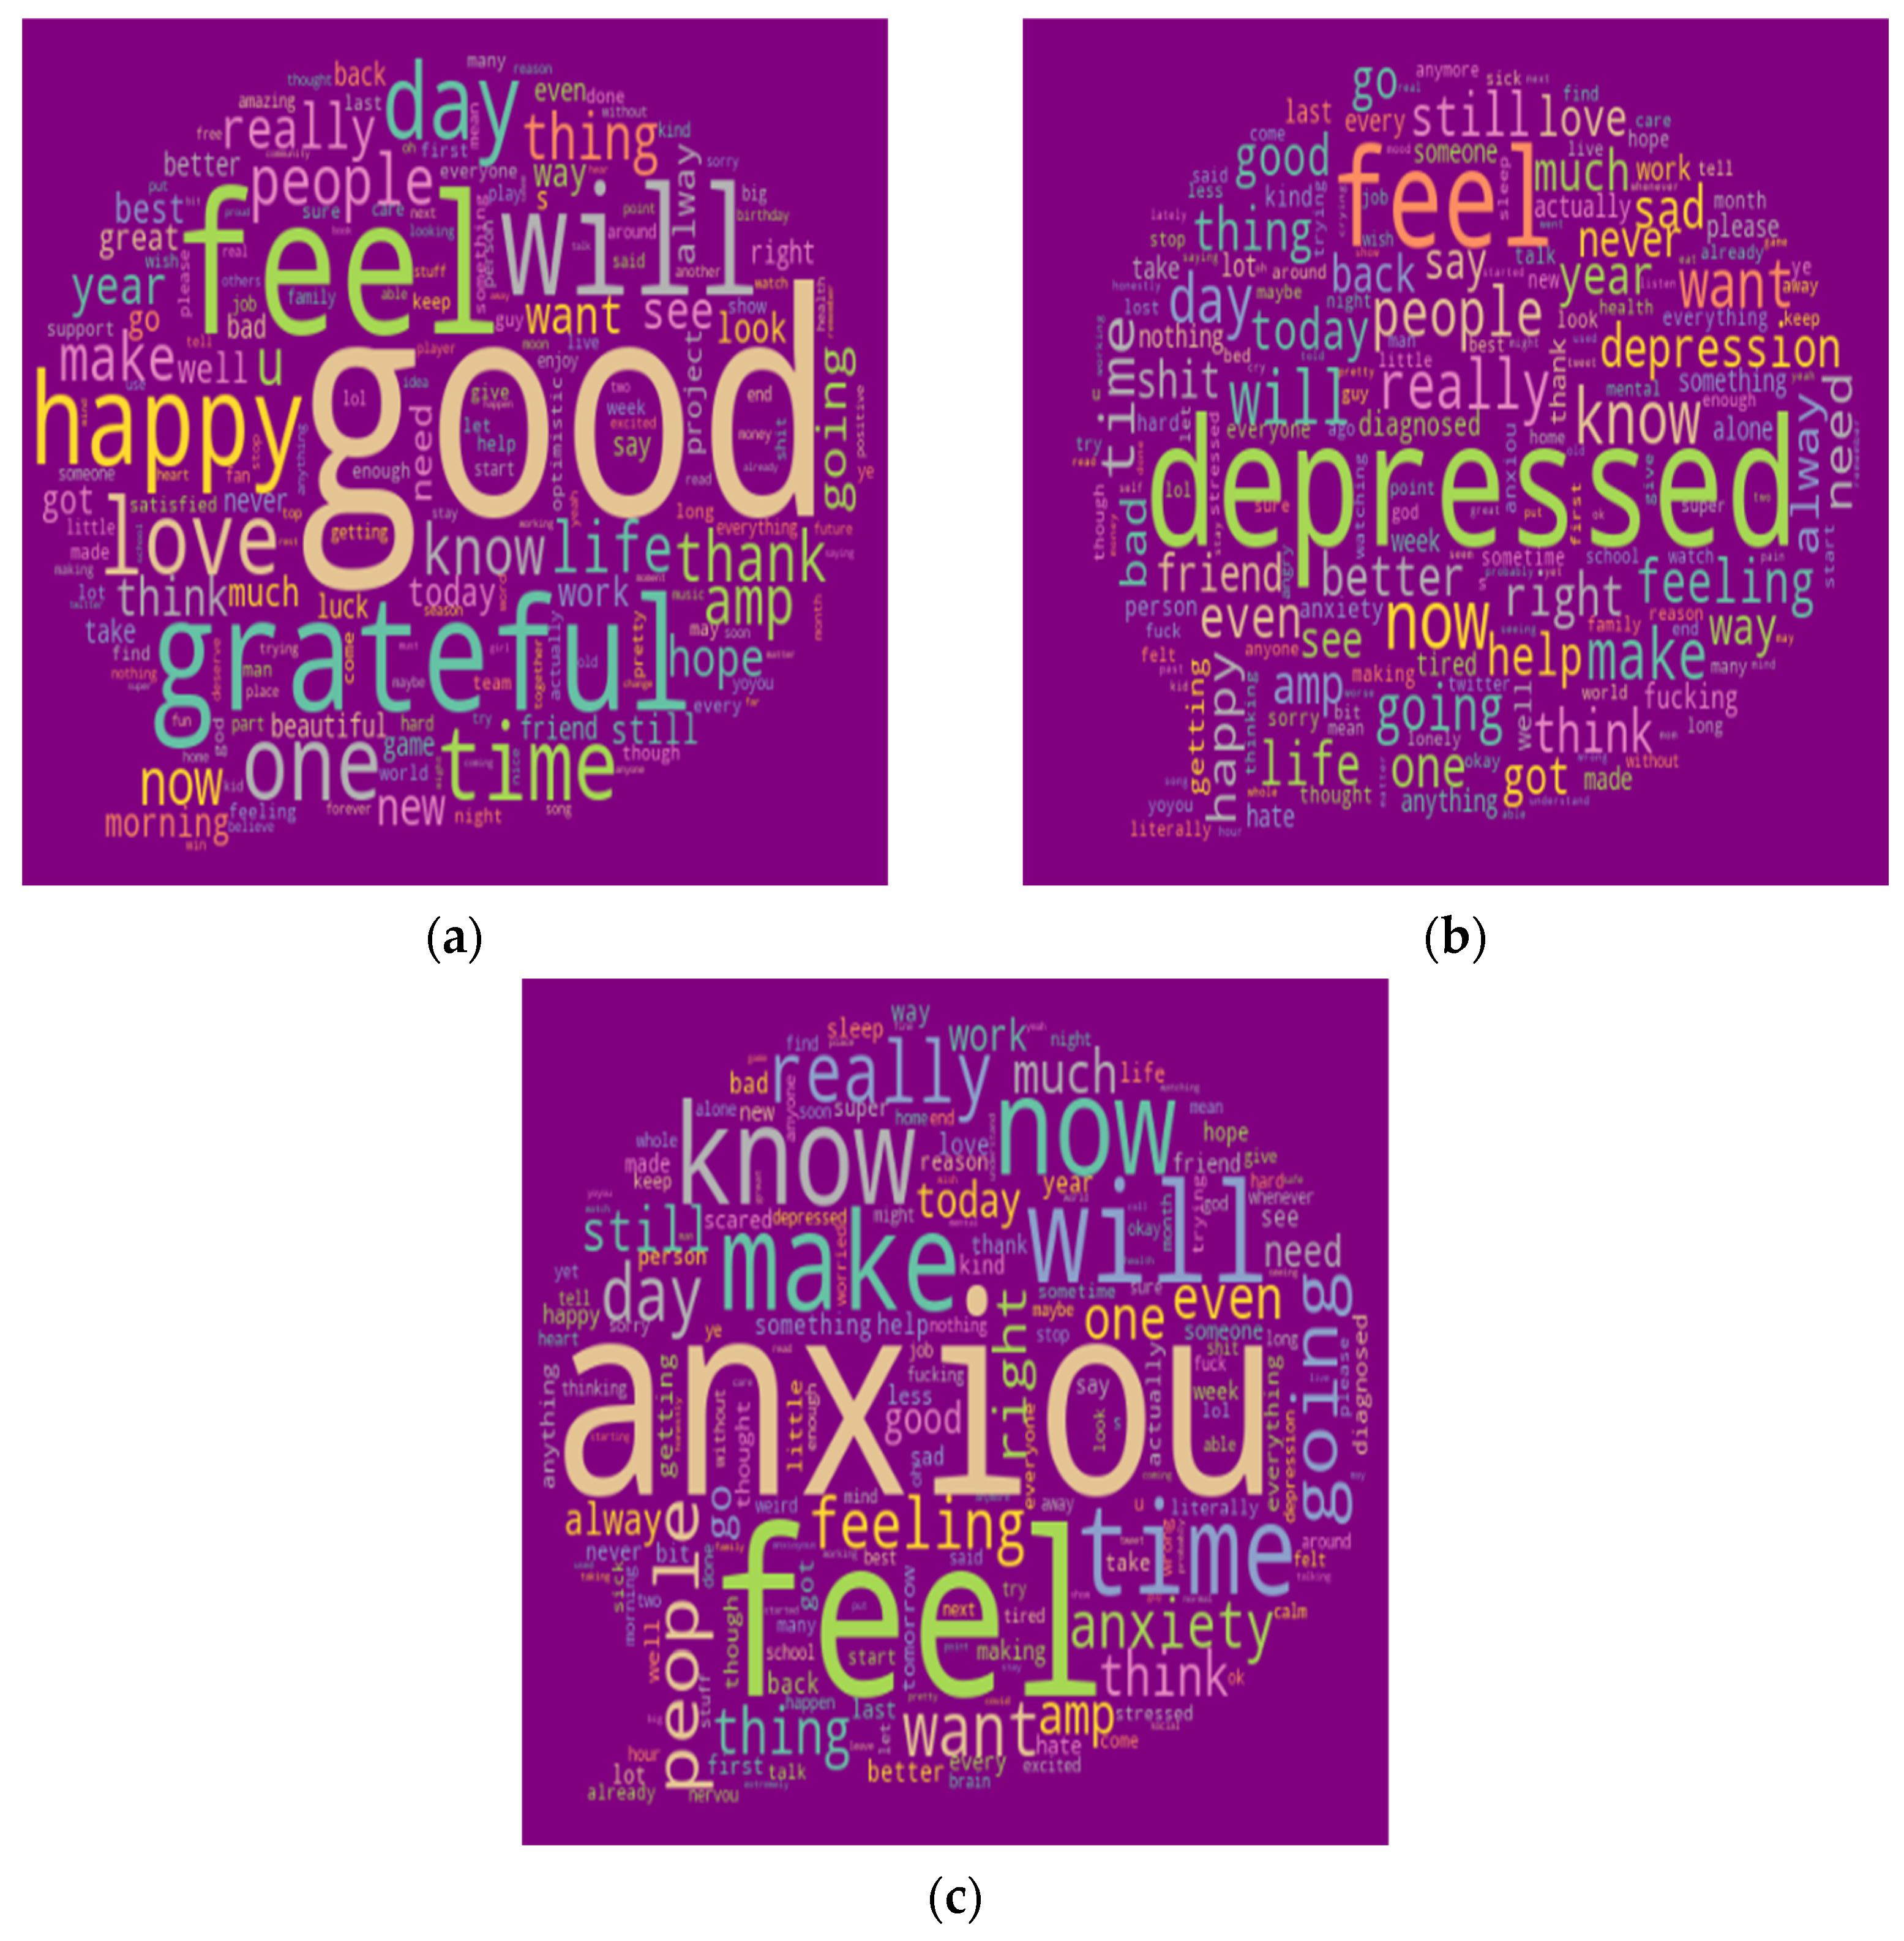
3.1.2. Preprocessing of Data
3.1.3. Data Labeling
3.1.4. Balancing Data
3.2. Tokenization
3.3. Feature Extraction
3.4. Training the Models
- An efficient hybridization that combines CNN model with other types of neural networks to take advantage of the strengths that characterize them such as (1) Simple RNN, (2) LSTM, (3) GRU, (4) Bidirectional RNN (BiRNN), (5) BiLSTM and (6) BiGRU. Subsequently, we build hybrid multi-class classifier models according to our multi-labeled dataset of tweets;
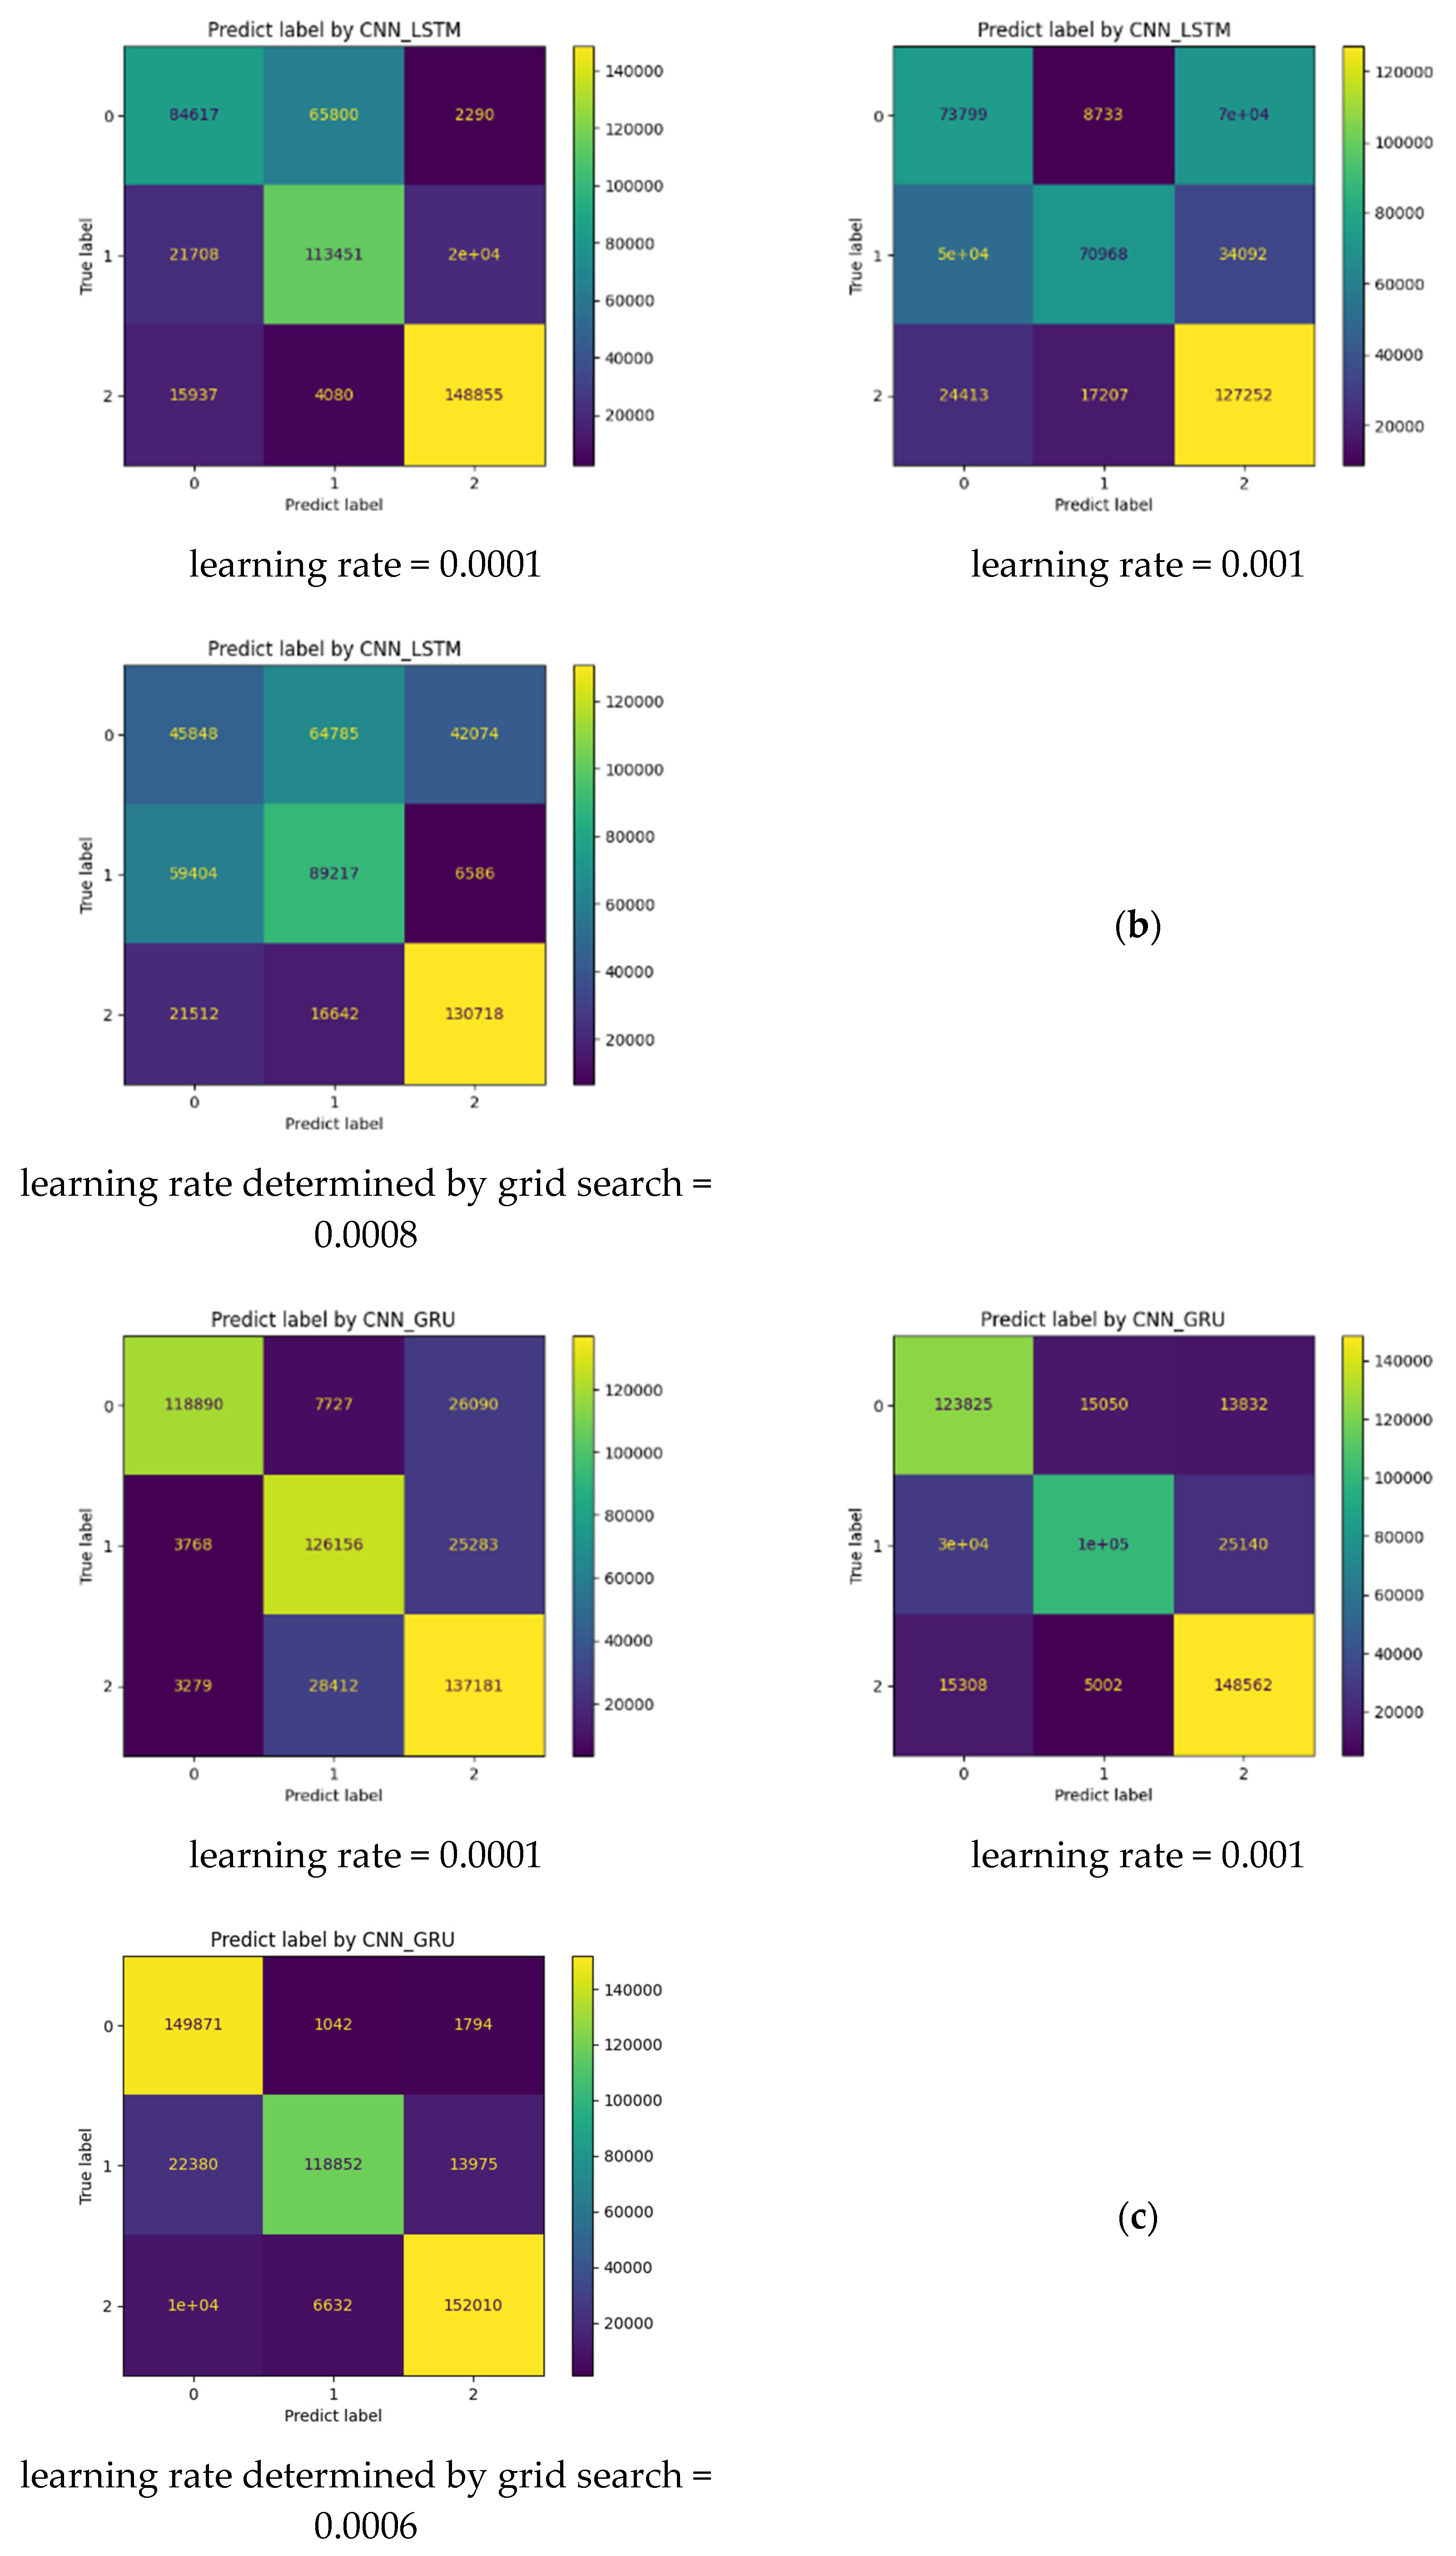
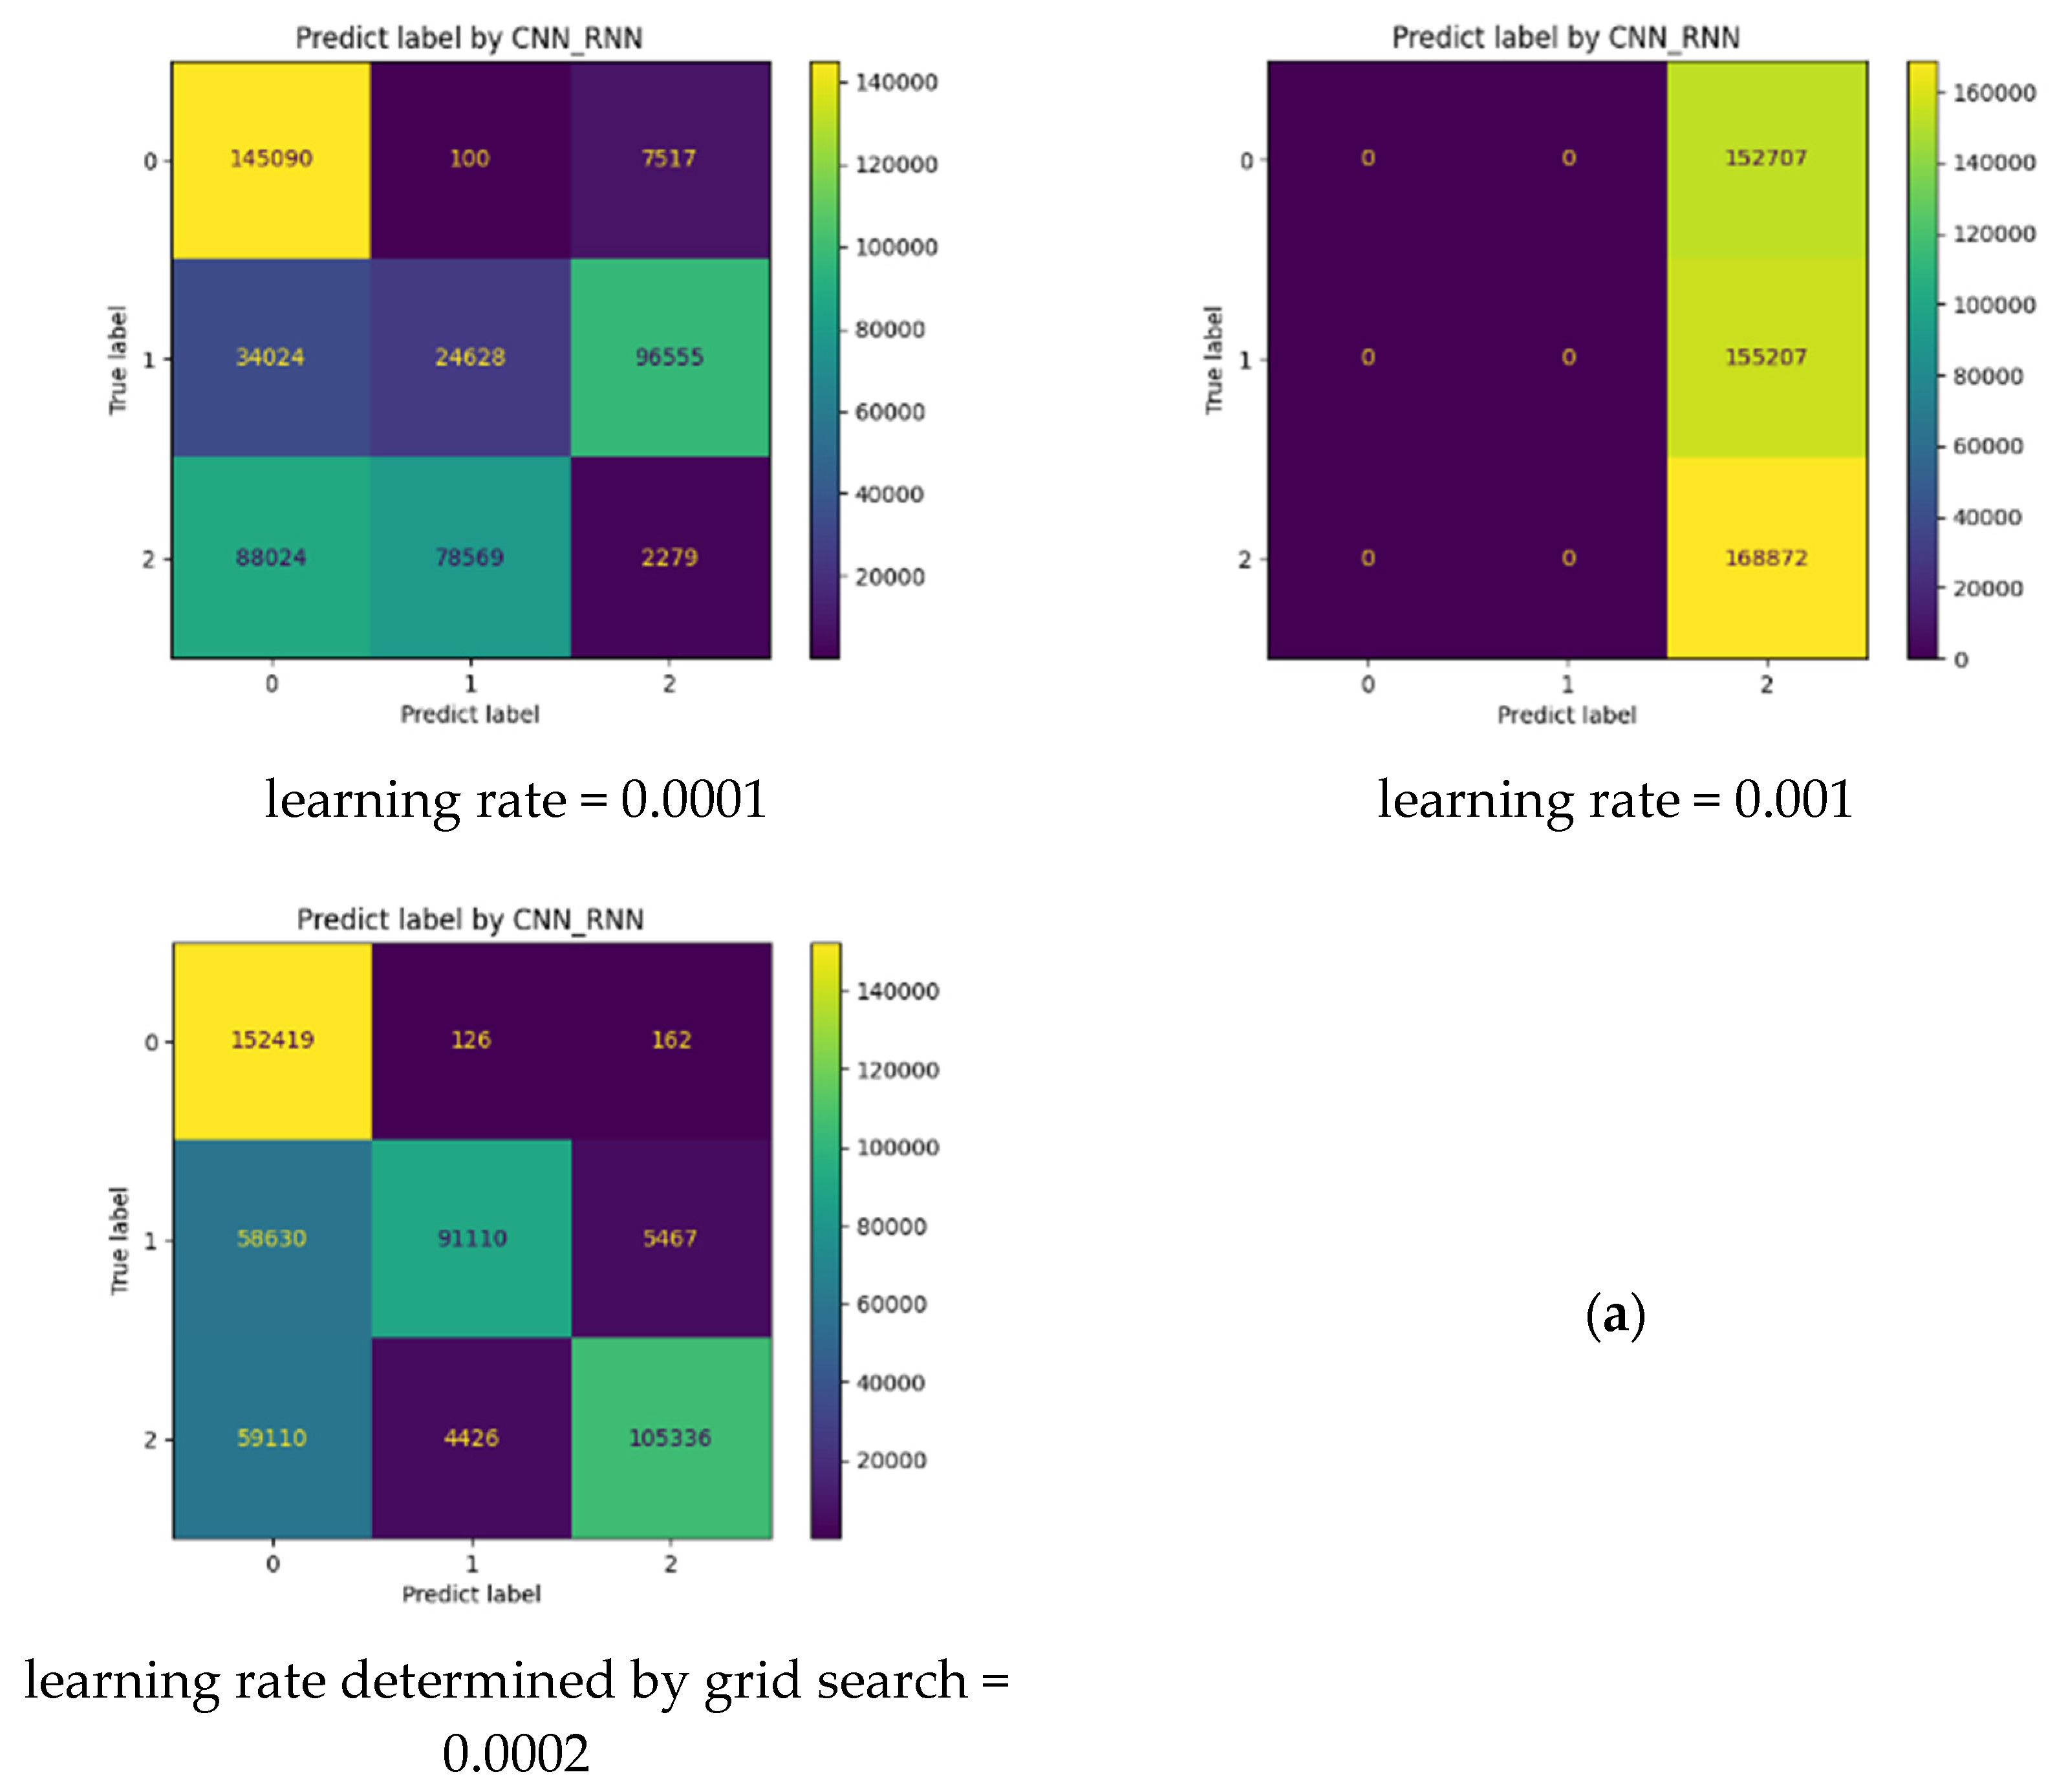
- Dealing with the optimization of the learning rate parameter, which is considered one of the most important parameters in deep learning-based tasks. To do so, we first adopt the Adam optimizer while initializing the learning rate parameter with 0.0001 (the smallest value). Then, we call up the technique of Grid Search Optimization to find the best learning rate value for each model in the interval [0.0001, 0.001].
3.5. Evaluation of Models
| N: Negative, P: Positive, T: True, F: False | N | P | |
| N | TN | FP | |
| P | FN | TP |
- (1)
- True Positives: when current and predicted values are positive with respect to a given class (i.e., both the current label and the label output by the model match the class label);
- (2)
- True Negatives: when current and predicted values are negative with respect to a given class (i.e., both the current label and the label output by the model does not match the class label);
- (3)
- False Positives: when the current value is negative while the predicted value is positive with respect to a given class;
- (4)
- False Negatives: when the current value is positive while the predicted value is negative with respect to a given class.
4. Experiments, Numerical Results and Discussion
4.1. Software and Hardware Configuration
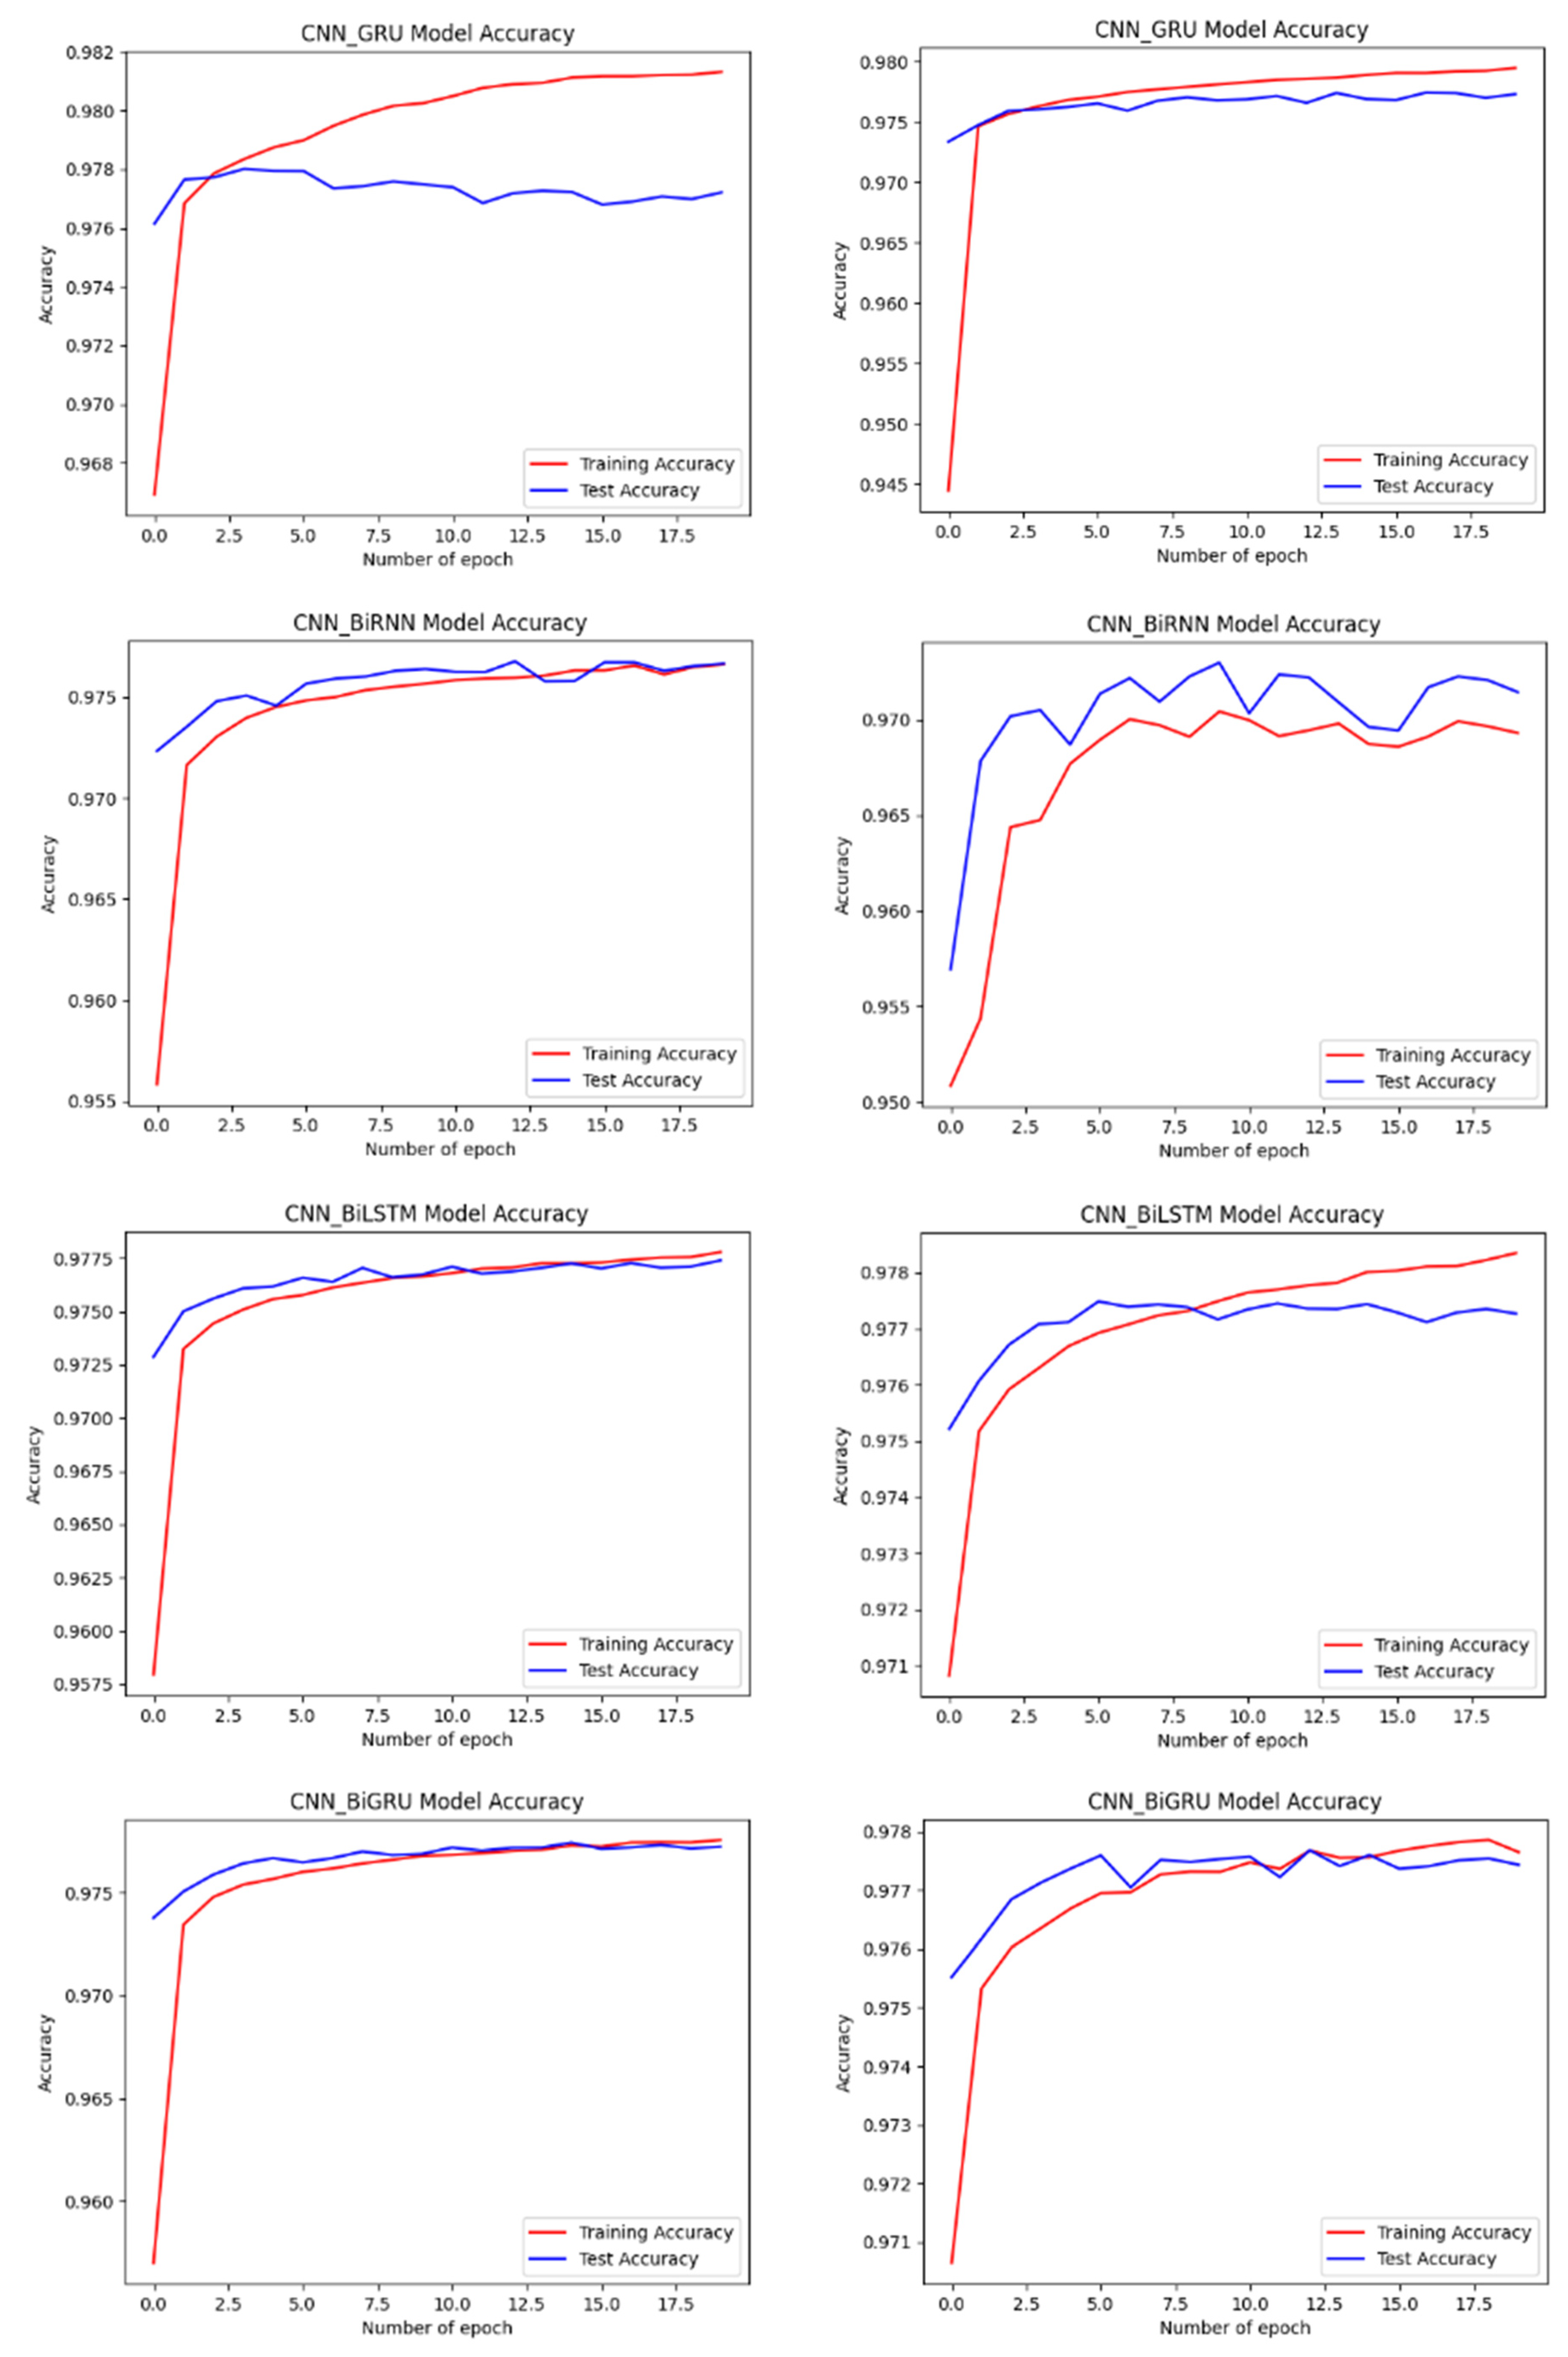
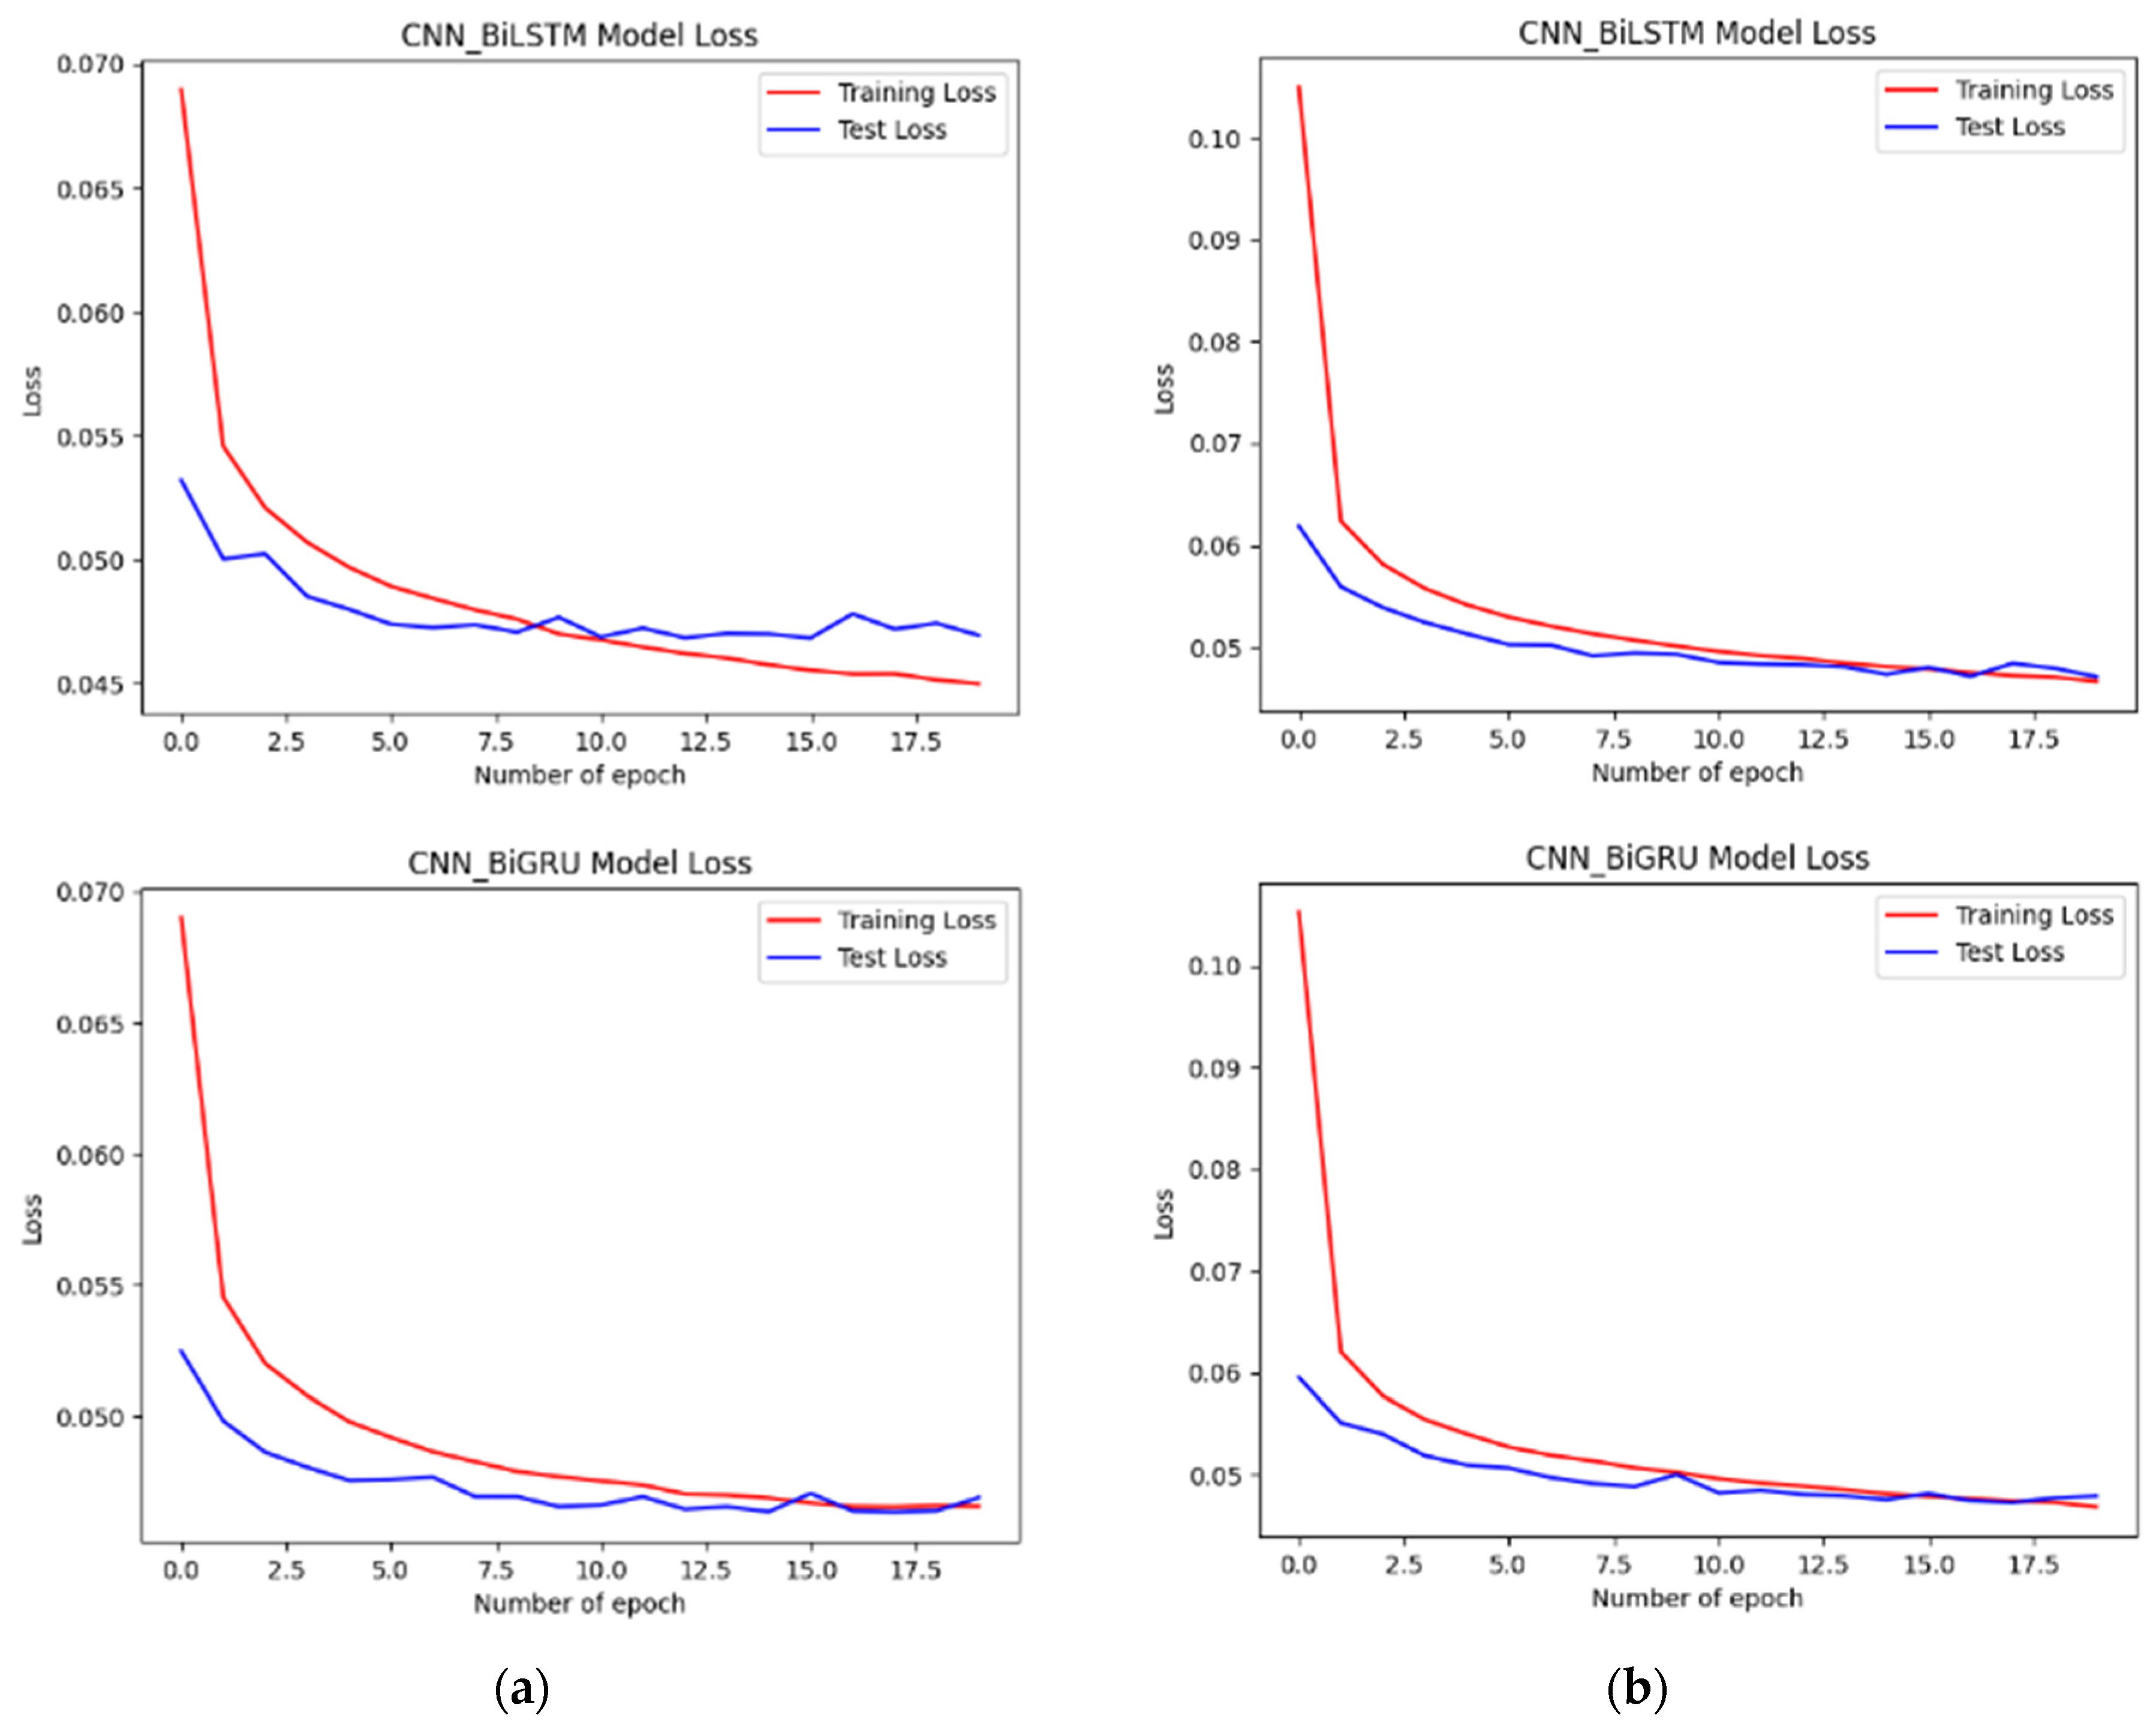
4.2. Performance of the Developed Models
4.3. Evaluation and Analysis of the Well-Performing Models
- The source of the improved accuracy of the studied models comes from the way the data were collected by relying on both common and non-common symptoms instead of only using keywords related to common symptoms between depressive and anxiety disorders.
- Our multi-class models seem to be more effective than the corresponding binary class models as they can resolve ambiguities. Indeed, as depressive and anxiety disorders present certain intersections, binary models most likely classify them as positive tweets (i.e., either depressive or anxious tweets) regardless of the model used (see for instance the results of using Model_2).
4.4. Assessment of Our Proposal
- C1.
- Mental disorder: this refers to the mental disorder studied, which can be either depression (denoted as Dep) or anxiety (denoted as Anx) disorders.
- C2.
- Data collection: this refers to whether the training data were collected using keywords (e.g., symptoms, usernames, etc.) or reused from other datasets.
- C3.
- Dataset size: this refers to the total number of tweets used to train the models.
- C4.
- Type of learning model: this refers to whether the well-performing classifier adopts simple variants (denoted as S) or hybridization (denoted as H) of models.
- C5.
- Type of classification: this refers to whether the well-performing classifier is a binary (denoted as B) or a multi-class (denoted as M) model.
- C6.
- Accuracy achieved: this refers to the accuracy achieved by the well-performing classifier (measured as a percentage).
- In contrast to many related works that rely on binary classification, our approach is based on multi-class models;
- Our study showed that multi-classification may be more efficient than binary class models as it could better resolve ambiguities issues, although this cannot be generalized;
- The data were collected based on assumptions involving both common and non-common symptoms between depression and anxiety disorders.
- Although the data were generated according to a well-defined process, we still lack for more efficient methods for collecting data and labelling them (tweets). This still remains a big challenge for large volumes of data, in contrast to small volumes of data that can be processed and annotated within a reasonable time. As an ongoing work, we are currently studying the use of semantics to help collect and label the data through ontology-computing while considering emoji, emoticons and related contents.
- In fact, many researchers have embarked on a frantic race to design/improve classification models for the detection of mental disorders through the Twitter platform. Undoubtedly, this is very important, but it should not be an end in itself because what is more important is to leverage these models in order to perform useful tasks. In this line of thinking, we are currently working to deploy our models within a syndromic surveillance system, in order to improve public health systems. At this level, our classification models are only used to classify the tweets as potentially positive toward depression and anxiety mental disorders or not. If so, the concerned users will be taken into account to study and monitor their behaviors on social media platforms through the syndromic surveillance system that further processes user data (tweets) in order to make some decisions and thus to perform the required actions. Indeed, it is far from easy to decide whether a given user is affected by a mental disorder by analyzing only one or a few tweets. Therefore, such models help make an early detection of both the affection of some people with mental disorders, on the one hand, and the start of mental disorders episodes for those already affected, on the other hand. In both cases, early identification helps minimize the damage. In addition, we also plan to study the ways the future syndromic surveillance system may help building labelled datasets with relevant data as in this stage, user behaviors undergo deeper analysis.
5. Conclusions
Author Contributions
Funding
Data Availability Statement
Acknowledgments
Conflicts of Interest
List of Abbreviations
| WHO | World Health Organization | LR | Logistic Regression |
| AI | Artificial Intelligent | SVM | Support Vector Machine |
| NLP | Natural Language Preprocessing | SVM-NB | Support Vector Machine-Naive Bayes |
| ML | Machine Learning | GBDT | Gradient-Boosted Decision Trees |
| DL | Deep Learning | AdaBoostM1 | Adaptive Boosting M1 |
| CNN | Convolution Neural Network | Liblinear | Library linear |
| RNN | Recurrent Neural Network | KNN | K-Nearest Neighbors |
| LSTM | Long Short-Term Memory | DT | Decision Tree |
| GRU | Gated Recurrent Unit | LDA | Linear Discriminant Analysis |
| Bi | Bidirectional | GNB | Gaussian Naive Bayes |
| MNB | Multinomial Naive Bayes | MDL | Minimum Description Length |
| SVR | Support Vector Regression | BERT | Bidirectional Encoder Representations from Transformers |
| LogReg | Logistic regression | USE | Universal Sentence Encoder |
| H, M, L | High, Medium, Low | MDHAN | Multi-Aspect Depression Detection with Hierarchical Attention Network |
| N, Mi, Mo, S | Normal, Mild, Moderate, Severe | ||
| ECG | Electrocardiogram | ||
| XGBoost | eXtreme Gradient Boosting | ||
| RFT | Random Forest Tree | ||
| GBC | Gradient Boosting Classifier |
References
- Mental Disorders. Available online: https://www.who.int/news-room/fact-sheets/detail/mental-disorders (accessed on 1 June 2023).
- American Psychiatric Association. Diagnostic and Statistical Manual of Mental Disorders, 5th ed.; Text Revision DSM-5-TR™; American Psychiatric Association: Washington, DC, USA, 2022; pp. 178–181, 218, 250. [Google Scholar]
- Jain, S.; Narayan, S.P.; Dewang, R.K.; Bhartiya, U.; Meena, N.; Kumar, V. A machine learning based depression analysis and suicidal ideation detection system using questionnaires and twitter. In Proceedings of the 2019 IEEE Students Conference on Engineering and Systems (SCES), Allahabad, India, 29–31 May 2019. [Google Scholar] [CrossRef]
- Victor, D.B.; Kawsher, J.; Labib, M.S.; Latif, S. Machine learning techniques for depression analysis on social media-case study on bengali community. In Proceedings of the 4th International Conference on Electronics, Communication and Aerospace Technology (ICECA), Coimbatore, India, 5–7 November 2020. [Google Scholar] [CrossRef]
- Skaik, R.; Inkpen, D. Using twitter social media for depression detection in the canadian population. In Proceedings of the 2020 3rd Artificial Intelligence and Cloud Computing Conference, Kyoto, Japan, 18–20 December 2020. [Google Scholar] [CrossRef]
- Azam, F.; Agro, M.; Sami, M.; Abro, M.H.; Dewani, A. Identifying depression among twitter users using sentiment analysis. In Proceedings of the 2021 International Conference on Artificial Intelligence (ICAI), IEEE, Islamabad, Pakistan, 5–7 April 2021. [Google Scholar] [CrossRef]
- de Jesús Titla-Tlatelpa, J.; Ortega-Mendoza, R.M.; Montes-y-Gómez, M.; Villaseñor-Pineda, L. A profile-based sentiment-aware approach for depression detection in social media. EPJ Data Sci. 2021, 10, 1–18. [Google Scholar] [CrossRef]
- Musleh, D.A.; Alkhales, T.A.; Almakki, R.A.; Alnajim, S.E.; Almarshad, S.K.; Alhasaniah, R.S.; Aljameel, S.S.; Almuqhim, A.A. Twitter arabic sentiment analysis to detect depression using machine learning. CMC 2022, 71, 3463–3477. [Google Scholar] [CrossRef]
- Mustafa, R.U.; Ashraf, N.; Ahmed, F.S.; Ferzund, J.; Shahzad, B.; Gelbukh, A. A multiclass depression detection in social media based on sentiment analysis. In Proceedings of the 17th International Conference on Information Technology—New Generations (ITNG 2020), Las Vegas, NV, USA, 5–8 April 2020; Springer International Publishing: Cham, Switzerland, 2020. [Google Scholar] [CrossRef]
- Ziwei, B.Y.; Chua, H.N. An application for classifying depression in tweets. In Proceedings of the 2nd International Conference on Computing and Big Data, Taichung, Taiwan, 18–20 October 2019. [Google Scholar] [CrossRef]
- Uddin, A.H.; Bapery, D.; Arif, A.S.M. Depression analysis of bangla social media data using gated recurrent neural network. In Proceedings of the 2019 1st International Conference on Advances in Science, Engineering and Robotics Technology (ICASERT), Dhaka, Bangladesh, 3–5 May 2019. [Google Scholar] [CrossRef]
- Pintelas, E.G.; Kotsilieris, T.; Livieris, I.E.; Pintelas, P. A review of machine learning prediction methods for anxiety disorders. In Proceedings of the 8th International Conference on Software Development and Technologies for Enhancing Accessibility and Fighting Info-Exclusion, Thessaloniki, Greece, 20–22 June 2018; pp. 8–15. [Google Scholar] [CrossRef]
- Gual-Montolio, P.; Jaén, I.; Martínez-Borba, V.; Castilla, D.; Suso-Ribera, C. Using Artificial Intelligence to Enhance Ongoing Psychological Interventions for Emotional Problems in Real- or Close to Real-Time: A Systematic Review. Int. J. Environ. Res. Public Health 2022, 19, 7737. [Google Scholar] [CrossRef] [PubMed]
- Stephen, J.J.; Prabu, P. Detecting the magnitude of depression in Twitter users using sentiment analysis. IJECE 2019, 9, 3247–3255. [Google Scholar] [CrossRef]
- Al Asad, N.; Pranto, M.A.M.; Afreen, S.; Islam, M.M. Depression detection by analyzing social media posts of user. In Proceedings of the 2019 IEEE International Conference on Signal Processing, Information, Communication & Systems (SPICSCON), Dhaka, Bangladesh, 28–30 November 2019. [Google Scholar] [CrossRef]
- Almouzini, S.; Alageel, A. Detecting arabic depressed users from Twitter data. Procedia Comput. Sci. 2019, 163, 257–265. [Google Scholar] [CrossRef]
- Arora, P.; Arora, P. Mining twitter data for depression detection. In Proceedings of the 2019 International Conference on Signal Processing and Communication (ICSC), Noida, India, 7–9 March 2019. [Google Scholar] [CrossRef]
- Zhou, J.; Zogan, H.; Yang, S.; Jameel, S.; Xu, G.; Chen, F. Detecting community depression dynamics due to COVID-19 pandemic in Australia. IEEE Trans. Comput. Soc. Syst. 2021, 8, 982–991. [Google Scholar] [CrossRef]
- AlSagri, H.; Ykhlef, M. Quantifying feature importance for detecting depression using random forest. IJACSA 2020, 11, 628–635. [Google Scholar] [CrossRef]
- Kamite, S.R.; Kamble, V.B. Detection of depression in social media via twitter using machine learning approach. In Proceedings of the 2020 International Conference on Smart Innovations in Design, Environment, Management, Planning and Computing (ICSIDEMPC), Aurangabad, India, 30–31 October 2020. [Google Scholar] [CrossRef]
- Safa, R.; Bayat, P.; Moghtader, L. Automatic detection of depression symptoms in twitter using multimodal analysis. J. Supercomput. 2021, 78, 4709–4744. [Google Scholar] [CrossRef]
- Shetty, N.P.; Muniyal, B.; Anand, A.; Kumar, S.; Prabhu, S. Predicting depression using deep learning and ensemble algorithms on raw Twitter data. IJECE 2020, 10, 3751–3756. [Google Scholar] [CrossRef]
- Kelley, S.W.; Mhaonaigh, C.N.; Burke, L.; Whelan, R.; Gillan, C.M. Machine learning of language use on Twitter reveals weak and non-specific predictions. NPJ Digit. Med. 2022, 5, 35. [Google Scholar] [CrossRef]
- Kim, J.; Lee, J.; Park, E.; Han, J.; Kim, J.J.; Parker, S.L.; Doty, J.R.; Cunnington, R.; Gilbert, P.; Kirby, J.N. A deep learning model for detecting mental illness from user content on social media. Sci. Rep. 2020, 10, 1–6. [Google Scholar] [CrossRef]
- Lin, C.; Hu, P.; Su, H.; Li, S.; Mei, J.; Zhou, J.; Leung, H. Sense-mood: Depression detection on social media. In Proceedings of the 2020 International Conference on Multimedia Retrieval, Dublin, Ireland, 8–11 June 2020. [Google Scholar] [CrossRef]
- Ghosh, S.; Anwar, T. Depression intensity estimation via social media: A deep learning approach. IEEE Trans. Comput. Soc. Syst. 2021, 8, 1465–1474. [Google Scholar] [CrossRef]
- Basiri, M.E.; Nemati, S.; Abdar, M.; Asadi, S.; Acharrya, U.R. A novel fusion-based deep learning model for sentiment analysis of COVID-19 tweets. Knowl.-Based Syst. 2021, 228, 107242. [Google Scholar] [CrossRef] [PubMed]
- Almars, A.M. Attention-based Bi-LSTM model for Arabic depression classification. CMC-Comput. Mater. Contin. 2022, 71, 3091–3106. [Google Scholar] [CrossRef]
- Pradhan, R.; Sharma, D.K. An ensemble deep learning classifier for sentiment analysis on code-mix Hindi–English data. Soft Comput. 2022, 27, 11053. [Google Scholar] [CrossRef] [PubMed]
- Kute, R. Mental health analyzer for depression detection based on textual analysis. J. Adv. Inf. Technol. 2022, 13, 67–77. [Google Scholar] [CrossRef]
- Ma, L.; Wang, Y. Constructing a semantic graph with depression symptoms extraction from twitter. In Proceedings of the 2019 IEEE Conference on Computational Intelligence in Bioinformatics and Computational Biology (CIBCB), Siena, Italy, 9–11 July 2019. [Google Scholar] [CrossRef]
- Zogan, H.; Razzak, I.; Wang, X.; Jameel, S.; Xu, G. Explainable depression detection with multi-aspect features using a hybrid deep learning model on social media. World Wide Web 2022, 25, 281–304. [Google Scholar] [CrossRef] [PubMed]
- Bendebane, L.; Laboudi, Z.; Saighi, A. Mental Disorders Prediction from Twitter Data: Application to Syndromic Surveillance Systems. In Proceedings of the Novel & Intelligent Digital Systems Conferences, Athens, Greece, 28–29 September 2023. [Google Scholar] [CrossRef]
- Govindasamy, K.A.; Palanichamy, N. Depression detection using machine learning techniques on twitter data. In Proceedings of the 2021 5th international conference on intelligent computing and control systems (ICICCS), Madurai, India, 6–8 May 2021. [Google Scholar] [CrossRef]
- Santos, W.R.D.; de Oliveira, R.L.; Paraboni, I. SetembroBR: A social media corpus for depression and anxiety disorder prediction. Lang. Resour. Eval. 2023, 1–28. [Google Scholar] [CrossRef]
- Shen, G.; Jia, J.; Nie, L.; Feng, F.; Zhang, C.; Hu, T.; Chua, T.-S.; Zhu, W. Depression detection via harvesting social media: A multimodal dictionary learning solution. In Proceedings of the Twenty-Sixth International Joint Conference on Artificial Intelligence, Melbourne, Australia, 19–25 August 2017. [Google Scholar] [CrossRef]
- Kour, H.; Gupta, M.K. An hybrid deep learning approach for depression prediction from user tweets using feature-rich CNN and bi-directional LSTM. Multimed. Tools Appl. 2022, 81, 23649–23685. [Google Scholar] [CrossRef]
- Shen, T.; Jia, J.; Shen, G.; Feng, F.; He, X.; Luan, H.; Tang, J.; Tiropanis, T.; Chua, T.S.; Hall, W. Cross-domain depression detection via harvesting social media. In Proceedings of the International Joint Conferences on Artificial Intelligence, Stockholm, Sweden, 13–19 July 2018. [Google Scholar]
- Chang, C.H.; Saravia, E.; Chen, Y.S. Subconscious Crowdsourcing: A feasible data collection mechanism for mental disorder detection on social media. In Proceedings of the 2016 IEEE/ACM International Conference on Advances in Social Networks Analysis and Mining (ASONAM), San Francisco, CA, USA, 18–21 August 2016. [Google Scholar] [CrossRef]
- Wang, Y.; Zhao, Y.; Bian, J.; Zhang, R. Detecting signals of associations between dietary supplement use and mental disorders from Twitter. In Proceedings of the 2018 IEEE International Conference on Healthcare Informatics Workshop (ICHI-W), New York, NY, USA, 4–7 June 2018. [Google Scholar] [CrossRef]
- Tyagi, S.; Mittal, S. Sampling approaches for imbalanced data classification problem in machine learning. In Proceedings of the ICRIC 2019: Recent Innovations in Computing, Jammu & Kashmir, India, 8–9 March 2019; Springer International Publishing: Berlin/Heidelberg, Germany, 2019. [Google Scholar] [CrossRef]
- Pennington, J.; Socher, R.; Manning, C.D. Glove: Global vectors for word representation. In Proceedings of the 2014 conference on empirical methods in natural language processing (EMNLP), Doha, Qatar, 25–29 October 2014. [Google Scholar]
- Pennington, J.; Socher, R.; Manning, C.D. “GloVe: Global Vectors for Word Representation”. Available online: https://nlp.stanford.edu/projects/glove/ (accessed on 18 June 2023).
- Gruda, D.; Hasan, S. Feeling anxious? Perceiving anxiety in tweets using machine learning. Comput. Hum. Behav. 2019, 98, 245–255. [Google Scholar] [CrossRef]
- Leung, J.; Chung, J.Y.C.; Tisdale, C.; Chiu, V.; Lim, C.C.W.; Chan, G. Anxiety and Panic Buying Behaviour during COVID-19 Pandemic—A Qualitative Analysis of Toilet Paper Hoarding Contents on Twitter. Int. J. Environ. Res. Public Health 2021, 18, 1127. [Google Scholar] [CrossRef] [PubMed]
- Al-Laith, A.; Alenezi, M. Monitoring People’s Emotions and Symptoms from Arabic Tweets during the COVID-19 Pandemic. Information 2021, 12, 86. [Google Scholar] [CrossRef]


| Type of Symptoms | Depressive Disorder | Anxiety Disorder | |
|---|---|---|---|
| Physical Diagnoses | Age | - | 35–45 |
| Duration of the disorder | 15 days | 6 months | |
| Gender | Women > Male | ||
| In common with the same degree | Disturbed sleep, fluctuations in appetite or weight, agitation, anxiety, isolation (absenteeism) and sexual inhibition. | ||
| In common but of different degree | Intense fatigue (loss of energy) *** Suicidal thoughts *** | Intense fatigue (loss of energy) * Suicidal thoughts * | |
| Which are not common points | - | Dizziness, heart palpitations. | |
| Psychological diagnoses | In common with the same degree | Difficultly concentrating, fear, excessive worry and nightmares. | |
| In common but of different degree | Sad/melancholy *** | Sad/melancholy * | |
| Which are not common points | Loss of interest (loss of pleasure = anhedonia, despair about the future), feelings of guilt or failure, low self-esteem, | Panic attack | |
| Ref. | Year | Data Source | Language | Prediction | ML Approaches | Accuracy (%) | F1-Score (%) |
|---|---|---|---|---|---|---|---|
| [3] | 2019 | Questionnaire (D1) Twitter (D2) | English | 5 Levels of Depression | [RFT, XGBoost, LR, SVM] | D1: [76.34, 83.87, 59.22, 76.50] D2: [82.05, 84.02, 86.45, 85.44] | - |
| [4] | 2020 | Bengali | Depression | [DT, RF, SVM, LR, NB, KNN] | [90.0, 90.3, 90.1, 90.2, 90.2, 90.2] | [90.1, 90.3, 90.3, 90.3, 90.3, 90.2] | |
| [5] | 2020 | English | Depression | [SVM, LR, RF, GBDT, XGBoost] | D1: [91.2, 92.7, 94.4, 96.0, 96.4] D2: [84.8, 87.9, 89.3, 91.1, 86.4] | D1: [89.9, 91.6, 93.5, 96.1, 95.8] D2: [80.0, 78.4, 77.9, 81.1, 88.7] | |
| [6] | 2021 | English | Depression | [RF, SVM] | [77.0, 73.0] | - | |
| [8] | 2022 | Arabic | Depression | [SVM, RF, LR, KNN, AdaBoost, NB] | RF: [82.39] | RF: [82.53] | |
| [9] | 2020 | English | Depression | SVM [H, M, L] | [86, 91, 86] | [84, 85, 85] | |
| RF [H, M, L] | [80, 83, 83] | [72, 66, 84] | |||||
| [11] | 2019 | Bangla | Depression | GRU | 75.7 | - | |
| [15] | 2019 | Twitter + Facebook | English | 6 Level of Depression | SVM-NB | 74 | - |
| [16] | 2019 | Twitter + Patient Health Questionnaire (PHQ-9) | Arabic | Depression | [RF, NB, AdaBoostM1, Liblinear] | [83, 75.6, 55.2, 87.5] | [82.8, 75.6, 53.2, 87.5] |
| [17] | 2019 | English | Depression | [MNB, SVR] | [78, 79.7] | - | |
| [18] | 2021 | English | Depression | Multi Model + TF-IDF feature: [LR, LDA, GNB] | [90.3, 90.4, 87.9] | [90.2, 90.3, 87.8] | |
| [19] | 2020 | English | Depression | RF | 84.7 | 66.7 | |
| [20] | 2021 | English | Depression | [NB, RF] | - | [94.87, 99.89] | |
| [21] | 2022 | English | Depression | GBC | 91 | 89 | |
| [22] | 2020 | English | Depression | [LSTM, CNN] | [93, 95] | - | |
| [23] | 2023 | English | Depression | [SVM, RF] | [59, 57] | [54, 53] |
| Ref. | Year | Source | Language | Prediction | DL Approach | Accuracy (%) | F1-Score (%) |
|---|---|---|---|---|---|---|---|
| [24] | 2020 | English | Depression and Non-Depression | [XGBoost, CNN] | [71.69, 75.13] | (depression, N-depression) [(58.02, 78.65), (79.49, 68.41)] | |
| Anxiety and Non-Anxiety | [XGBoost, CNN] | [70.41, 77.81] | (Anxiety, N-Anxiety) [(55.92, 77.73), (56.25, 85.14)] | ||||
| Bipolar and Non-Bipolar | [XGBoost, CNN] | [85.53, 90.20] | (Bipolar, N-Bipolar) [(53.59, 91.43), (52.95, 94.53)] | ||||
| BPD and Non-BPD | [XGBoost, CNN] | [85.14, 90.49] | (BPD, N-BPD) [(46.43, 91.37), (48.21, 94.76)] | ||||
| Schizophrenia and Non-Schizophrenia | [XGBoost, CNN] | [86.72, 94.33] | (Schizo, N-Schizo) [(40.97, 92.52), (38.07, 97.03)] | ||||
| [25] | 2020 | English | Depression | SenseMood system | 88.39 | 93.60 | |
| [26] | 2021 | English | Depression | LSTM-MDL-fine tuner | 87.14 | - | |
| [27] | 2022 | Twitter + Google trends | English | Positive or Negative Opinions about COVID-19 | [Proposed Model, CNN, BiGRU, FastText, NBSVM, DistilBERT] | [85.8, 81.6, 79.7, 79.6, 79.8, 85.5] | [85.8, 81.5, 79.7, 79.6, 79.8, 85.5] |
| [28] | 2022 | Arabic | Depression | Attention-based Bi-LSTM | 83 | - | |
| [29] | 2022 | Hindi-English | Depression | [LSTM, BERT, USE, Proposal] | [65, 60, 60, 67] | - | |
| [30] | 2022 | Indian | Depression | [CNN, LSTM, Bi-LSTM] | [98.00, 94.84, 97.10] | - |
| Ref | Year | Data Source | Language | Prediction | Hybrid Approach | Accuracy (%) | F1-Score (%) |
|---|---|---|---|---|---|---|---|
| [32] | 2022 | English | Depression | MDHAN | 89.5 | 89.3 | |
| [33] | 2023 | English | Normal, Depression and Anxiety | CNN-BiLSTM | 88.93 | [Normal, Dep, Anx]: [86, 90, 91] | |
| [34] | 2021 | English | Depression | [NB, NBTree] | D1: [92.34, 97.31] D2: [92.34, 97.31] | - | |
| [35] | 2023 | Portuguese | Depression and Anxiety | [LogReg, LSTM, CNN, BERT] | - | Dep: [58, 53, 52, 63] Anx [55, 50, 47, 61] |
| Normal Tweets (D0) | Depressed Tweets (D1) | Anxious Tweets (D2) |
|---|---|---|
| To be full of the joys of spring. Feel relaxed/good/excited/alright/buzzing/in love. Enjoy my life. Walking on air. On top of the world. Over the moon. I am happy. Beautiful life. Peaceful mind. | I am/was/have been diagnosed with depression. I am/was/have been identified as depressed. I am depressed. I feel depressed. People do not die from suicide they die from sadness. Sometimes I am sad tired miserable for no reason at all. Nothing more depressing. I feel lost inside of myself. | I am/was/have been diagnosed with anxiety. I am/was/have been identified as anxious. I am anxious. I feel anxious. I am/feel scared. I am terrified. I have had dizziness for more than six months. I have had heart palpitations for more than six months. |
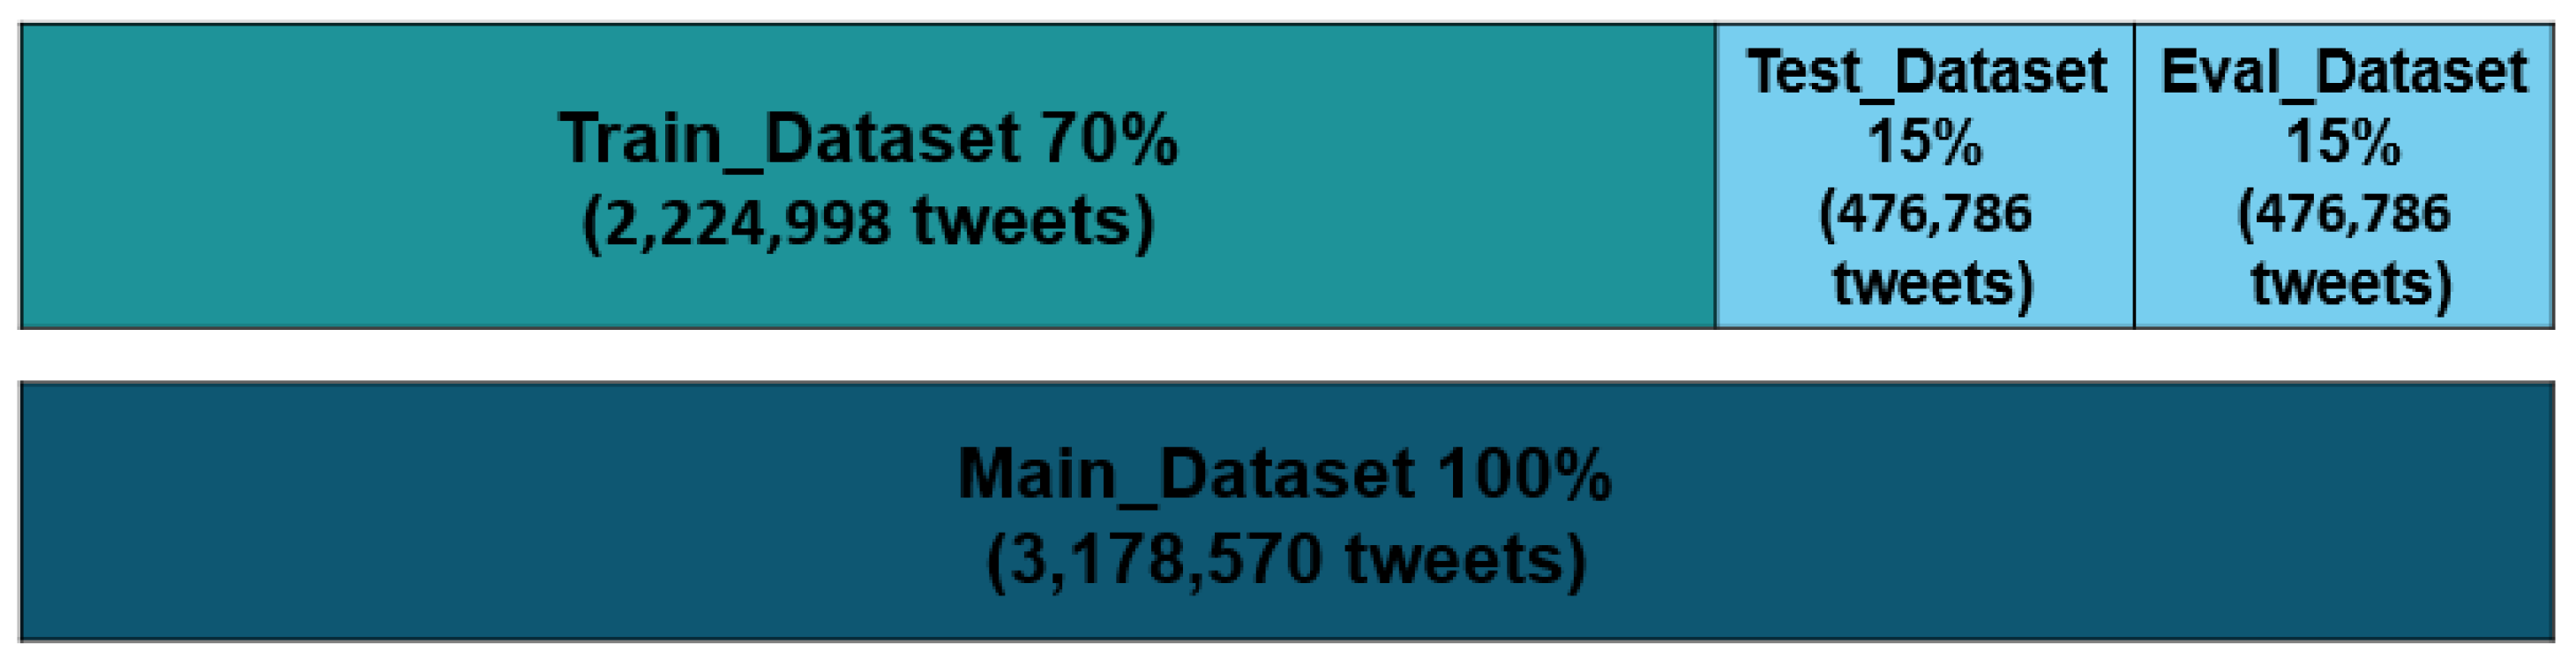
| Datasets | Tweets before Preprocessing | Tweets after Preprocessing | Percentage of Data after Preprocessing (%) |
|---|---|---|---|
| D0 (Normal) | 2,892,049 | 1,017,101 | 32.00 |
| D1 (Depressed) | 2,295,038 | 1,037,050 | 32.63 |
| D2 (Anxious) | 1,996,568 | 1,124,419 | 35.37 |
| Total Dataset | 7,183,655 | 3,178,570 | 100.00 |
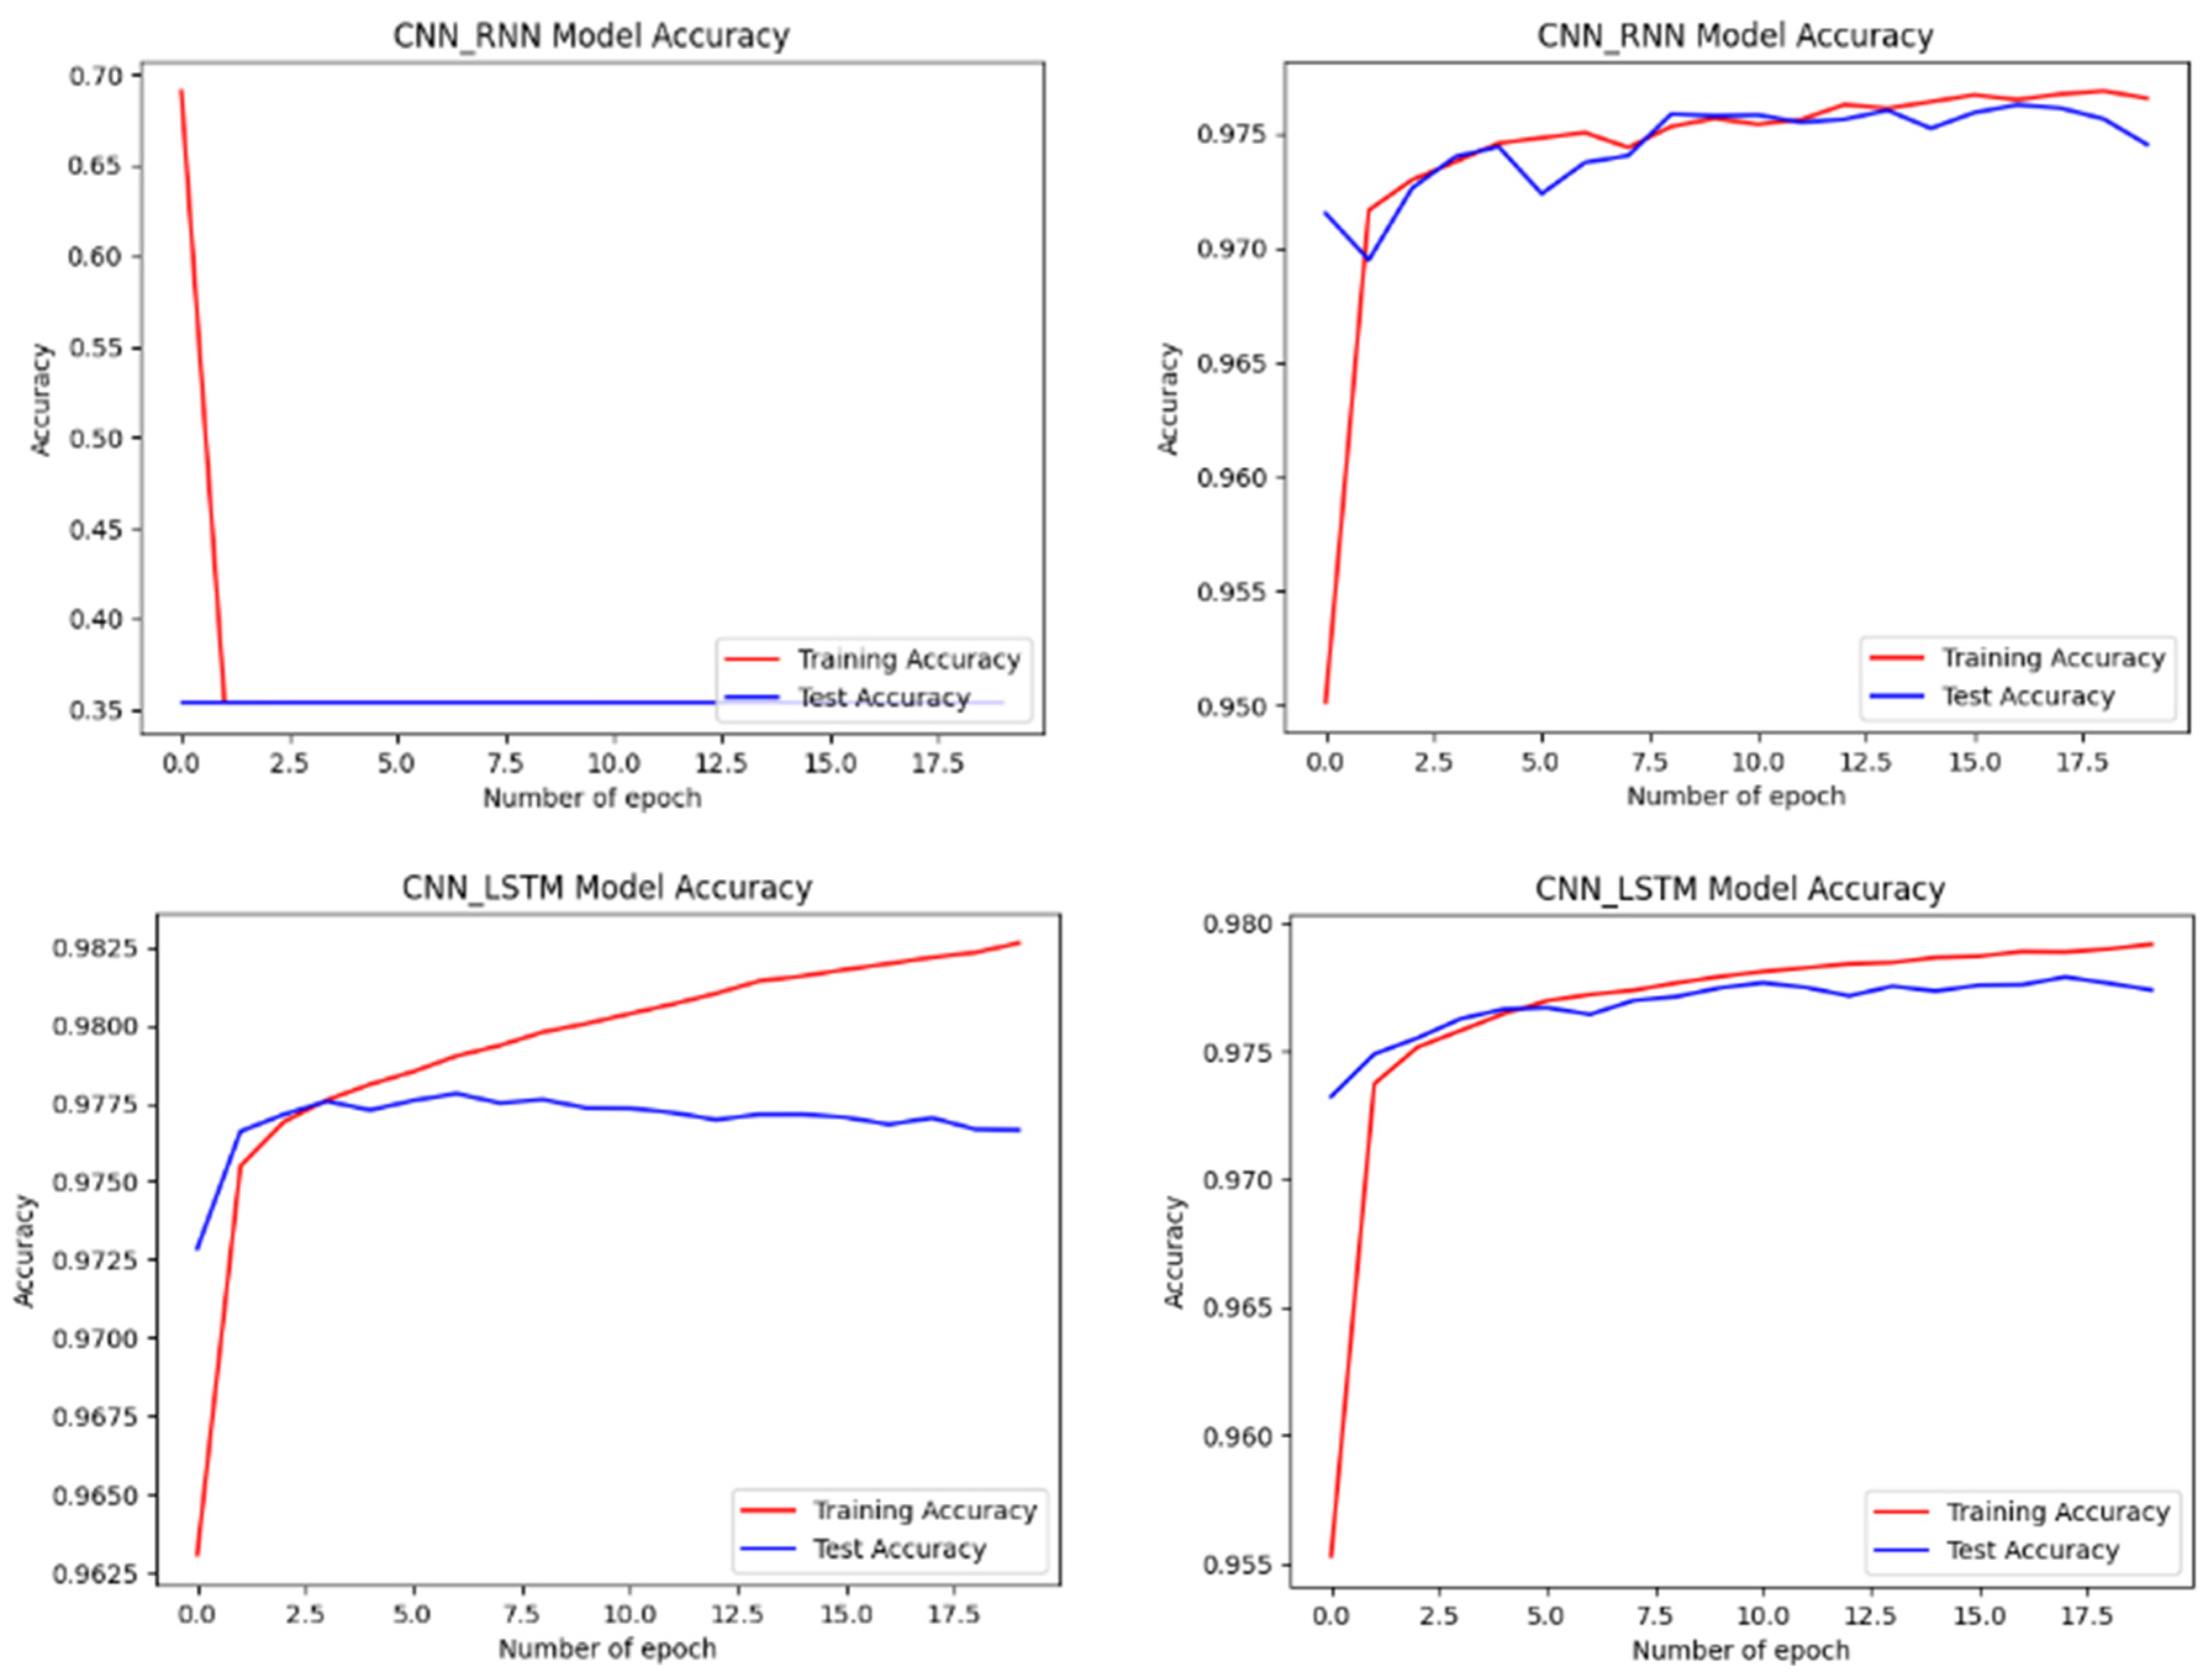
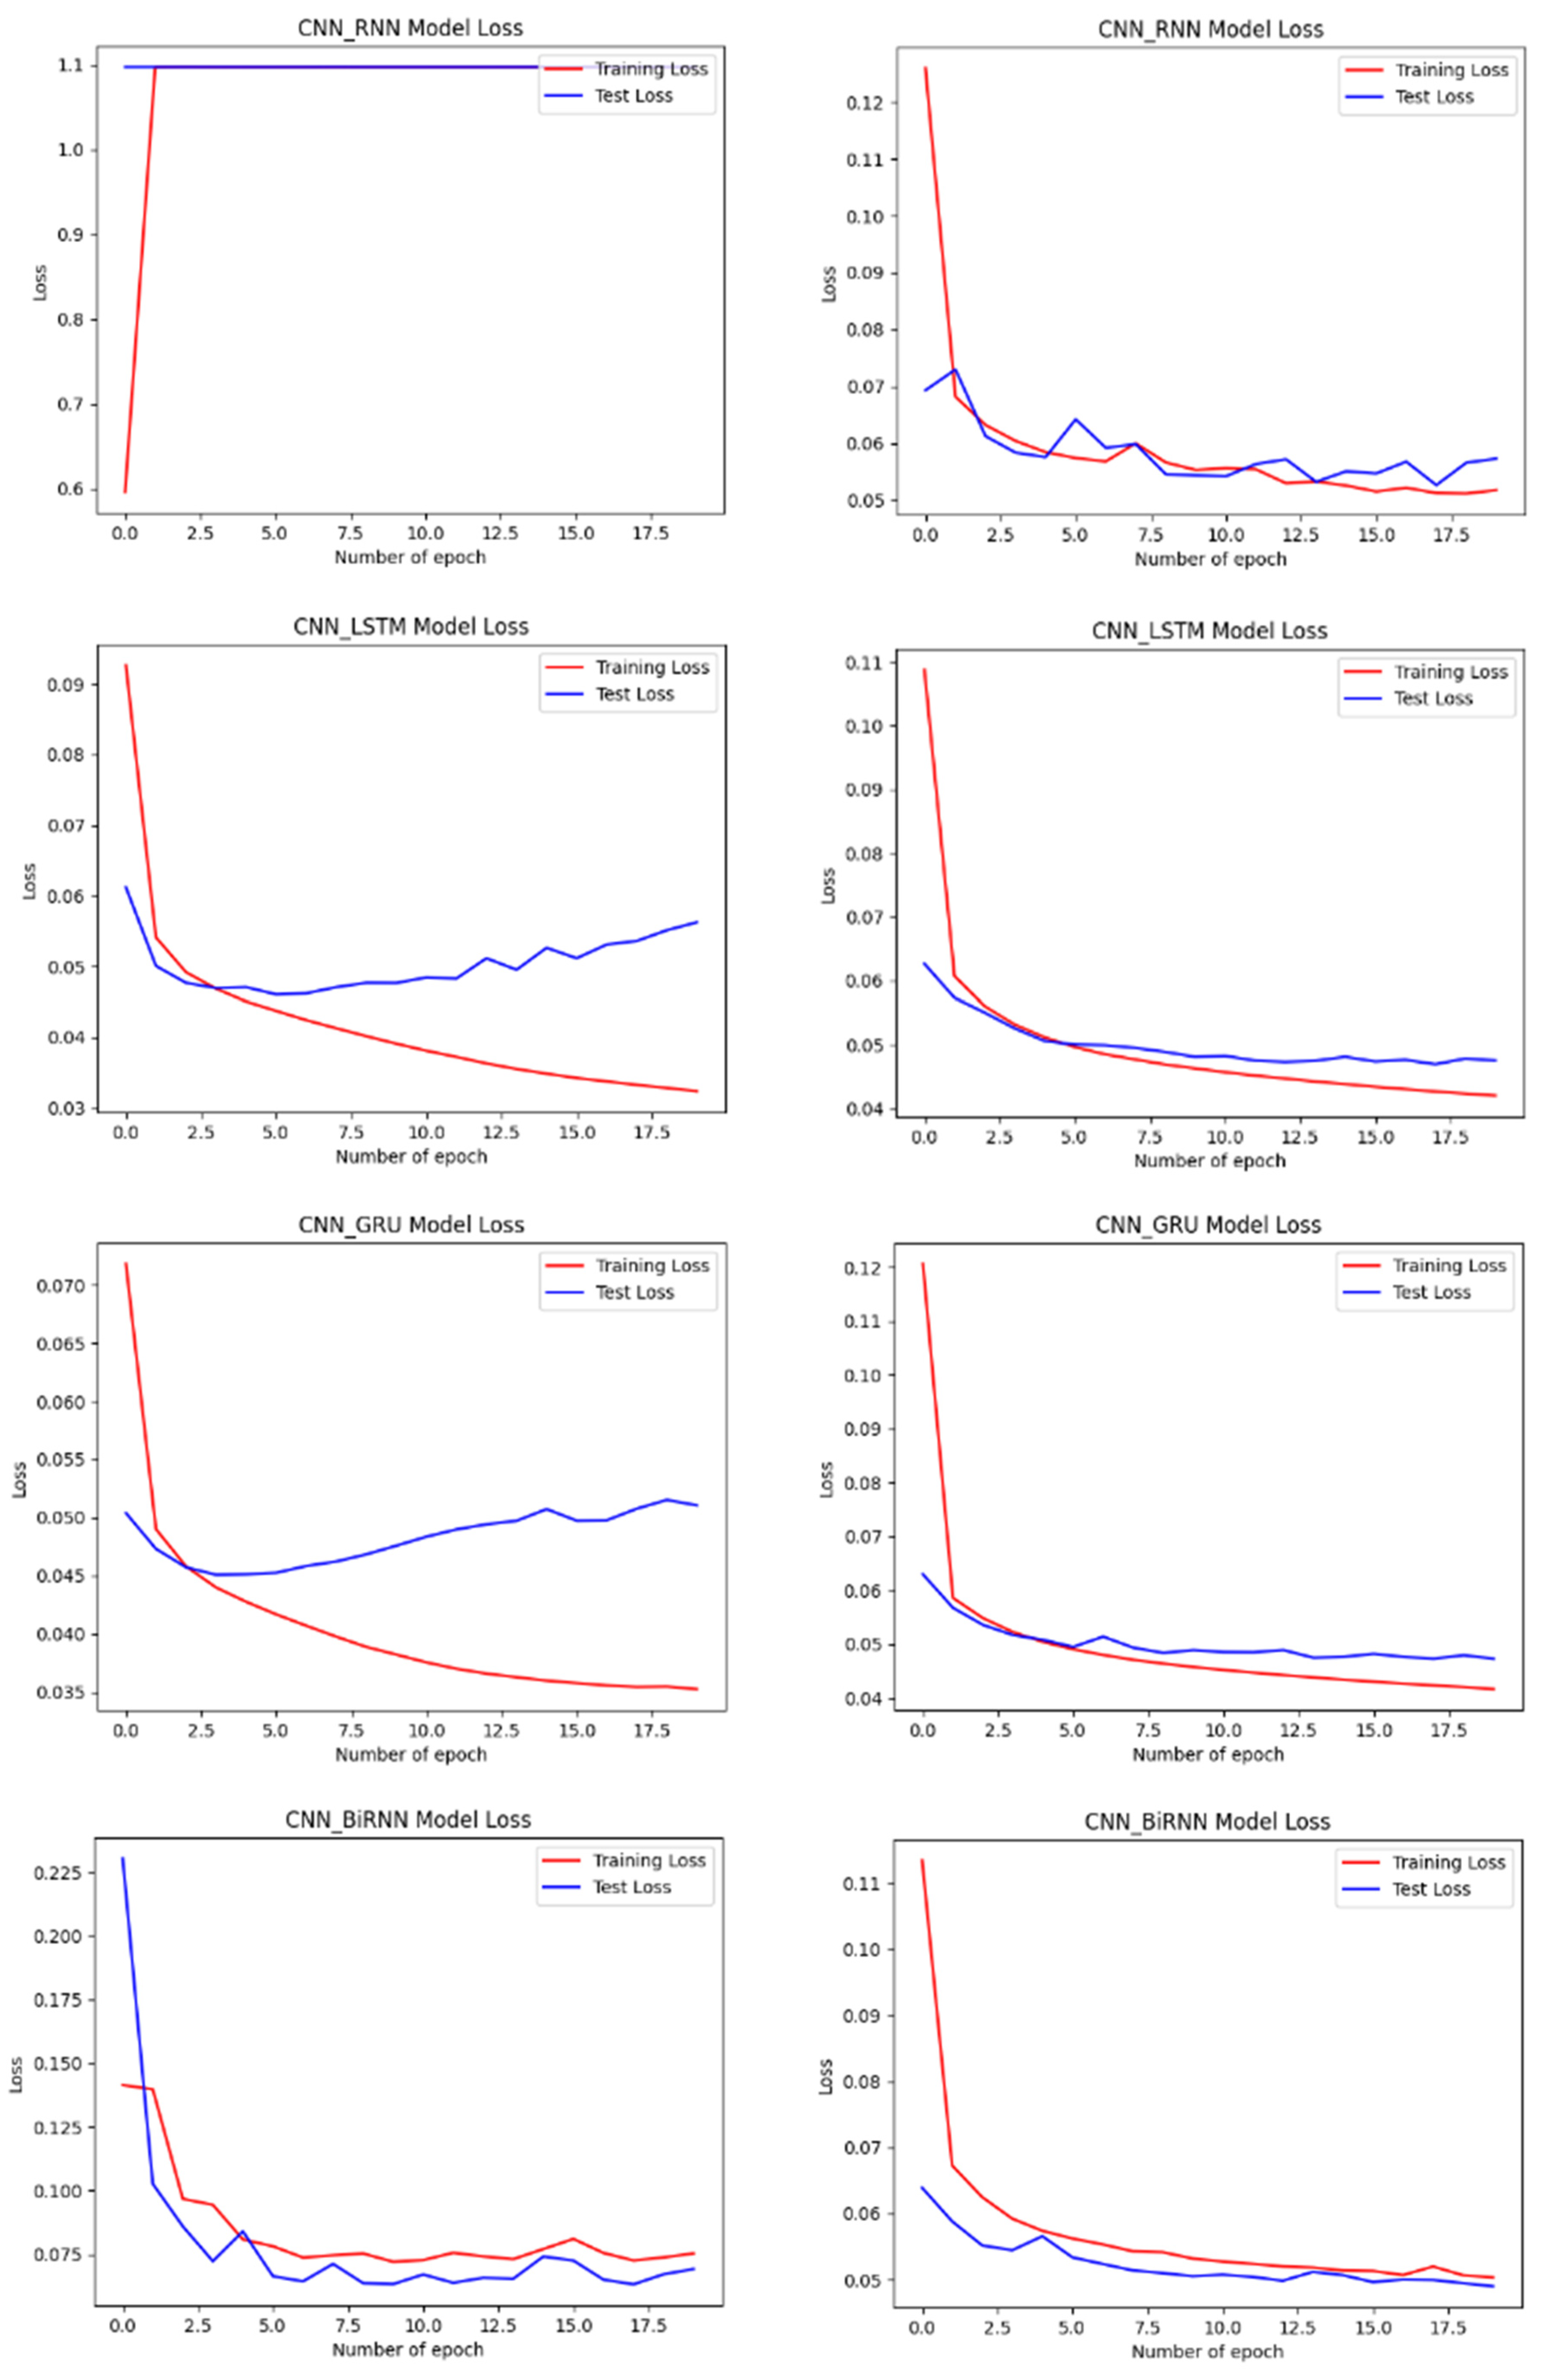
| N° | Models | Fixed Learning Rate | Accuracy (%) | F1-Score Class 0 (%) | F1-Score Class 1 (%) | F1-Score Class 2 (%) |
|---|---|---|---|---|---|---|
| 1 | CNN_RNN [33] | 0.0001 | 36.07 | 69.00 | 19.00 | 2.00 |
| 2 | CNN_LSTM [33] | 0.0001 | 72.76 | 62.00 | 67.00 | 88.00 |
| 3 | CNN_GRU [33] | 0.0001 | 80.17 | 85.00 | 79.00 | 77.00 |
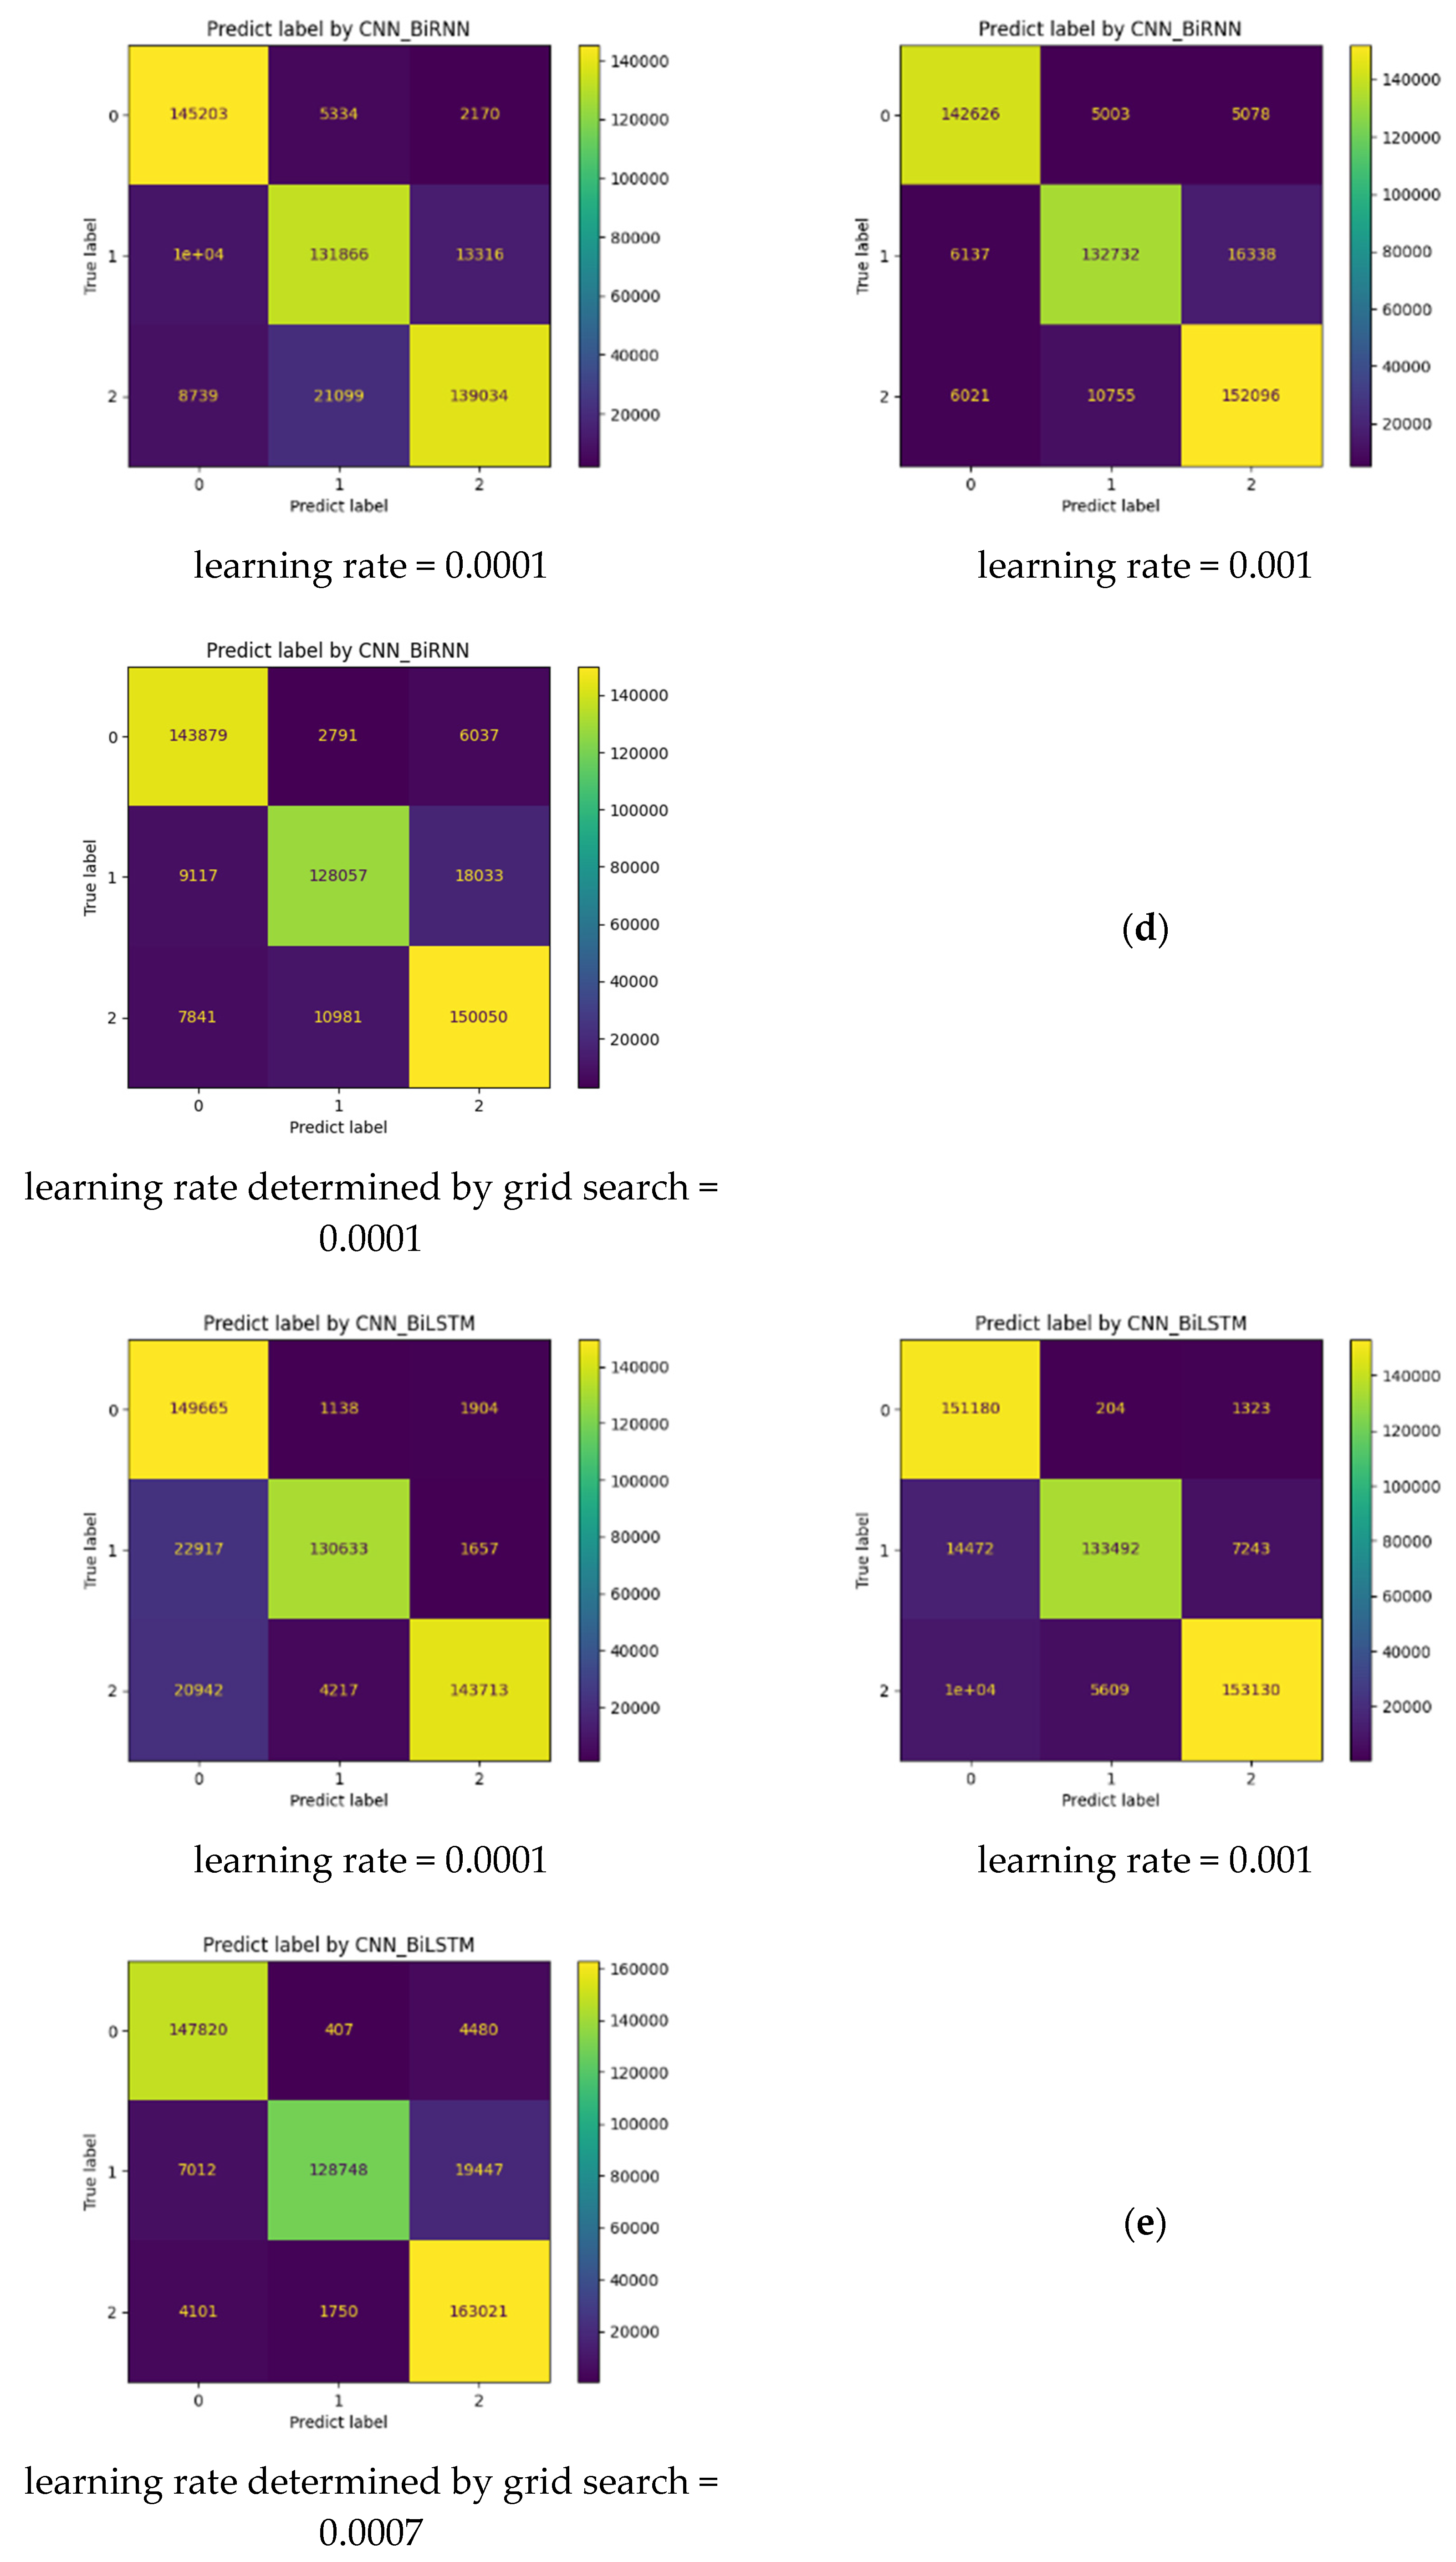
| 4 | CNN_BiRNN [33] | 0.0001 | 87.27 | 92.00 | 84.00 | 86.00 |
| 5 | CNN_BiLSTM [33] | 0.0001 | 88.93 | 86.00 | 90.00 | 91.00 |
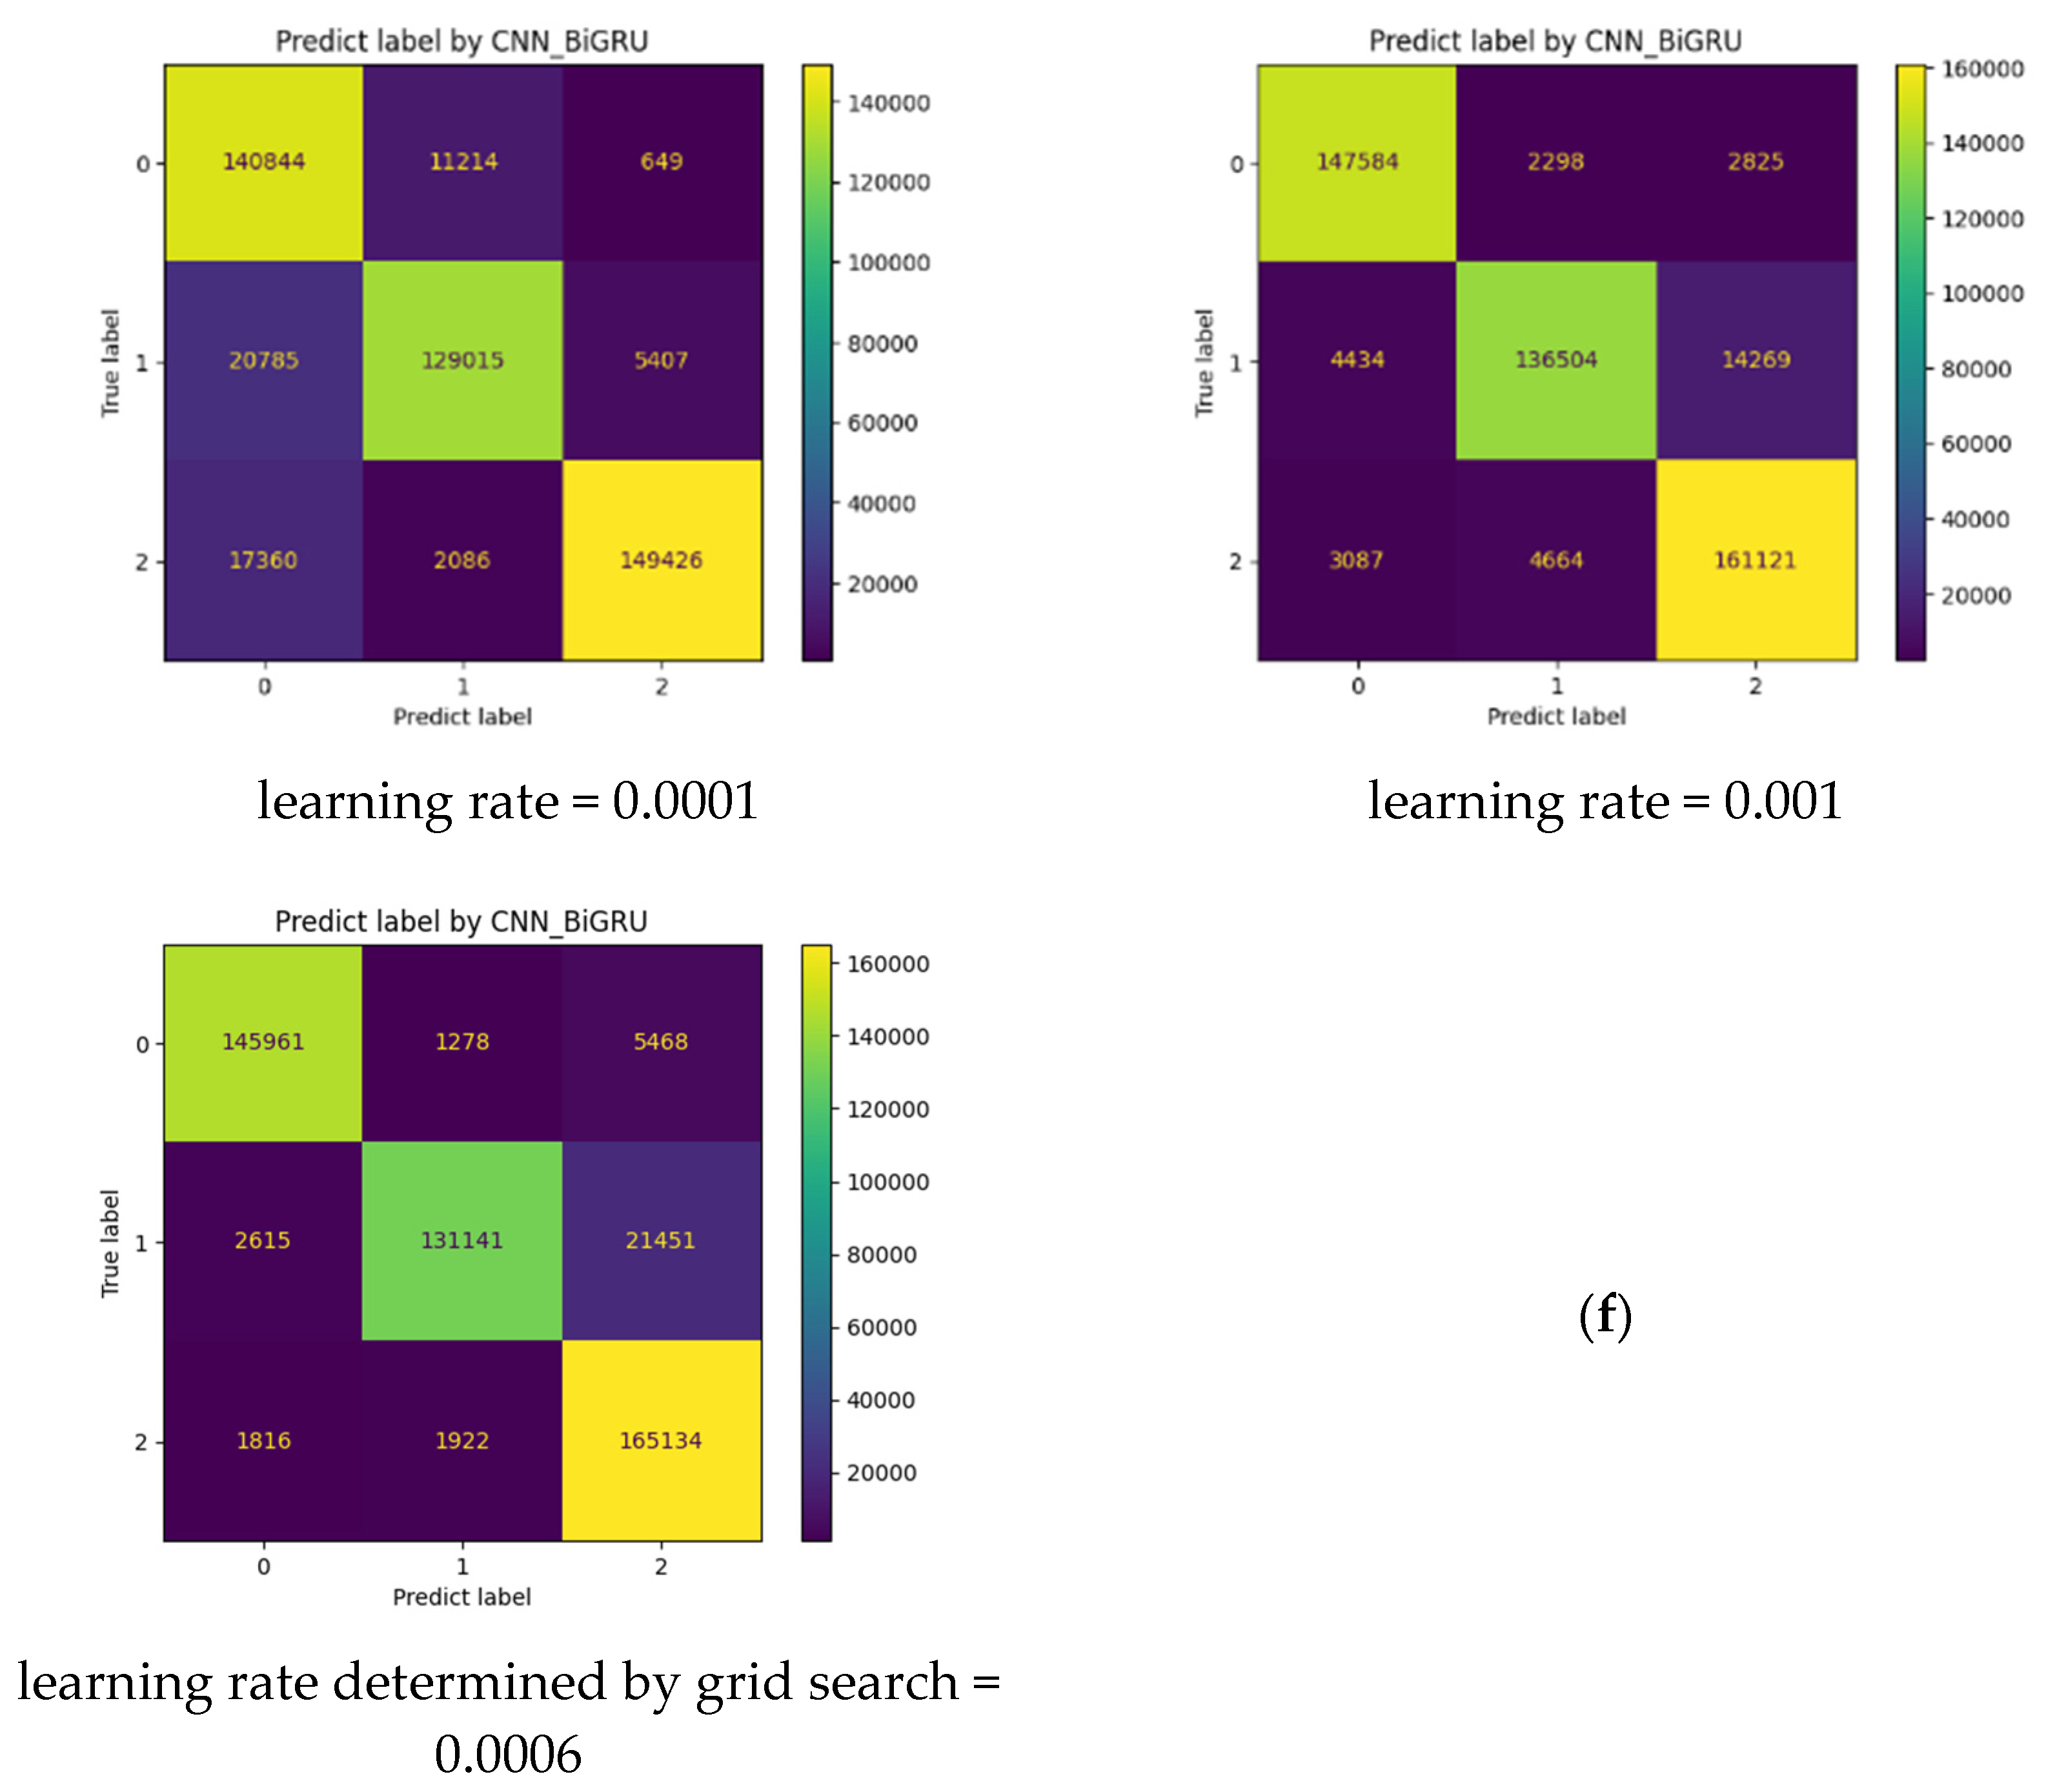
| 6 | CNN_BiGRU [33] | 0.0001 | 87.94 | 85.00 | 87.00 | 92.00 |
| 7 | CNN_RNN | 0.001 | 35.42 | 0.00 | 0.00 | 52.00 |
| 8 | CNN_LSTM | 0.001 | 57.02 | 49.00 | 56.00 | 64.00 |
| 9 | CNN_GRU | 0.001 | 78.22 | 77.00 | 73.00 | 83.00 |
| 10 | CNN_BiRNN | 0.001 | 89.65 | 93.00 | 87.00 | 89.00 |
| 11 | CNN_BiLSTM | 0.001 | 91.82 | 92.00 | 91.00 | 93.00 |
| 12 | CNN_BiGRU | 0.001 | 93.38 | 96.00 | 91.00 | 93.00 |
| N° | Models | Fixed Learning Rate | Accuracy (%) | F1-Score Class 0 (%) | F1-Score Class 1 (%) | F1-Score Class 2 (%) |
|---|---|---|---|---|---|---|
| 13 | CNN_RNN_gs | 0.0002 | 73.17 | 72.00 | 73.00 | 75.00 |
| 14 | CNN_LSTM_gs | 0.0008 | 55.74 | 33.00 | 55.00 | 75.00 |
| 15 | CNN_GRU_gs | 0.0006 | 88.24 | 89.00 | 84.00 | 90.00 |
| 16 | CNN_BiRNN_gs | 0.0001 | 88.51 | 92.00 | 86.00 | 87.00 |
| 17 | CNN_BiLSTM_gs | 0.0007 | 92.20 | 95.00 | 90.00 | 92.00 |
| 18 | CNN_BiGRU_gs | 0.0006 | 92.75 | 96.00 | 91.00 | 92.00 |
| N° | Models | Accuracy (%) | Predict Class 0 (Tweets) | Predict Class 1 (Tweets) | Predict Class 2 (Tweets) | Correct Prediction | Convergence Ratio (%) |
|---|---|---|---|---|---|---|---|
| 15 | CNN_GRU_gs | 88.24 | 2241 | 4778 | 1261 | 6832 | 82.51 |
| 16 | CNN_BiRNN_gs | 88.51 | 1740 | 2771 | 3769 | 4259 | 51.44 |
| 17 | CNN_BiLSTM_gs | 92.20 | 1884 | 3630 | 2766 | 5410 | 65.34 |
| 18 | CNN_BiGRU_gs | 92.75 | 1474 | 4002 | 2804 | 5213 | 62.96 |
| Models | Training Dataset | Type of Classification | Prediction | Evaluation Dataset | Accuracy (%) |
|---|---|---|---|---|---|
| Model_1 | Train_Dataset | Multi-class | Normal, Depressed and Anxiety | Eval_dataset | 92.75 |
| Shen_dataset | 62.96 | ||||
| Model_2 | Dataset1 | Binary-class | Normal and Depressed | Dataset2 | 86.35 |
| Shen_dataset | 95.34 | ||||
| Model_3 | Dataset2 | Binary-class | Normal and Anxiety | Dataset1 | 69.97 |
| Shen_dataset | 94.84 |
| Work | C1 | C2 | C3 | C4 | C5 | C6 | ||||
|---|---|---|---|---|---|---|---|---|---|---|
| Dep | Anx | Keyword-Based | Reused | S | H | B | M | (%) | ||
| [5] | X | - | from [36] | D1: 292,564 | X | X | 96.40 | |||
| [6] | X | Diagnosis | - | 89,776 | X | X | 77.00 | |||
| [8] | X | Diagnosis | - | 4542 | X | X | 82.39 | |||
| [9] | X | Not mentioned | - | 156,511 | X | X | 91.00 | |||
| [15] | X | Tweets of specific users | - | 2832 | X | X | 74.00 | |||
| [18] | X | Tweets during COVID-19 | - | 94,707,264 | X | X | 90.40 | |||
| [19] | X | Diagnosis | - | 1 million | X | X | 84.70 | |||
| [25] | X | - | from [36] | D1: 292,564 D2: 10 billion D3: 35 million | X | X | 88.39 | |||
| [26] | X | - | from [36] | D1: 292,564 | X | X | 87.14 | |||
| [36] | X | Diagnosis | - | D1: 292,564 D2: >10 billion D3: 35,067,677 | X | X | 85.00 | |||
| [44] | X | Work and feeling | - | D1: 600 | X | X | - | |||
| 1418 users | D2: >3 million | |||||||||
| [45] | X | Hashtags on toilet paper (COVID-19) | - | 255,171 | X | X | - | |||
| [46] | X | Hashtags on COVID-19 | - | 300,000 | X | X | 75.00 | |||
| Our proposal | X | X | Diagnosis and symptoms | - | 3,178,570 | X | X | 93.38 | ||
Disclaimer/Publisher’s Note: The statements, opinions and data contained in all publications are solely those of the individual author(s) and contributor(s) and not of MDPI and/or the editor(s). MDPI and/or the editor(s) disclaim responsibility for any injury to people or property resulting from any ideas, methods, instructions or products referred to in the content. |
© 2023 by the authors. Licensee MDPI, Basel, Switzerland. This article is an open access article distributed under the terms and conditions of the Creative Commons Attribution (CC BY) license (https://creativecommons.org/licenses/by/4.0/).
Share and Cite
Bendebane, L.; Laboudi, Z.; Saighi, A.; Al-Tarawneh, H.; Ouannas, A.; Grassi, G. A Multi-Class Deep Learning Approach for Early Detection of Depressive and Anxiety Disorders Using Twitter Data. Algorithms 2023, 16, 543. https://doi.org/10.3390/a16120543
Bendebane L, Laboudi Z, Saighi A, Al-Tarawneh H, Ouannas A, Grassi G. A Multi-Class Deep Learning Approach for Early Detection of Depressive and Anxiety Disorders Using Twitter Data. Algorithms. 2023; 16(12):543. https://doi.org/10.3390/a16120543
Chicago/Turabian StyleBendebane, Lamia, Zakaria Laboudi, Asma Saighi, Hassan Al-Tarawneh, Adel Ouannas, and Giuseppe Grassi. 2023. "A Multi-Class Deep Learning Approach for Early Detection of Depressive and Anxiety Disorders Using Twitter Data" Algorithms 16, no. 12: 543. https://doi.org/10.3390/a16120543
APA StyleBendebane, L., Laboudi, Z., Saighi, A., Al-Tarawneh, H., Ouannas, A., & Grassi, G. (2023). A Multi-Class Deep Learning Approach for Early Detection of Depressive and Anxiety Disorders Using Twitter Data. Algorithms, 16(12), 543. https://doi.org/10.3390/a16120543