
Fast Local Laplacian Filter Based on Modified Laplacian through Bilateral Filter for Coronary Angiography Medical Imaging Enhancement

Abstract
:1. Introduction
2. Literature Study

| Study | Data Type | Techniques | Descriptions | Performance Metrics | Results |
|---|---|---|---|---|---|
| [15] | CT images | Fuzzy employed dynamic histogram equalization | Contrast enhancement is considered a significant aspect of medical analysis because diagnosis error can be minimized only by utilizing a better-quality image. | Average Pixel Intensity, Standard Deviation, Average gradient, Entropy, Mutual Information | |
| [16] | MRI images | Contrast stretching | An effective data hiding technique that enhances the visual quality of watermarked images while ensuring efficient concealment of the embedded data. | PSNR, SSIM | 16.24 0.9932 |
| [17] | Digital images | Dynamic Histogram Equalization | Enhancing the quality of MRI-generated images is crucial, as the complexity of these images often poses challenges for specialists during their analysis and interpretation. | PSNR, SSIM, MSE | 32.00 0.9000 0.300 |
| [18] | X-ray Image | Modified shark smell optimization | The main idea here is to introduce an optimization problem by considering both global and local enhancement to achieve a strong image enhancement method | Contrast, CNR, EME, WPSNR, Homogeneity | 0.89, 78.12 32.41 17.13, 0.85 |
| [19] | X-ray image | Fuzzy gray-level difference histogram equalization algorithm | The gray-level difference of an input image is calculated using the binary similar patterns. | Entropy, PSNR | 7.01, 38.15 |
| [20] | MRI images | Piecewise linear histogram equalization | The primary function involves ensuring a uniform distribution of histogram components across the entire grayscale range | Entropy, edge enhancement index (EHI) | 5.2001 5040 |
| [23] | MRI image | Limited Dynamic Weighted Histogram Equalization | The proposed reversible data hiding-based limited dynamic weighted histogram equalization technique for abnormal tumor regions improves the contrast and transmits hidden secret information. | PSNR | 34.65 |
| [21] | Digital images | Adaptive Histogram Equalization | The algorithm’s efficacy extends beyond enhancing medical images; it also caters to the enhancement of ordinary images captured under both low-light and daylight conditions. | PSNR, NAE | 53.4047 1.0267 |
| [24] | MRI images | Histogram equalization, adaptive gamma correction | Extracting pertinent information from low-contrast and poor-quality MRI images proves to be a formidable task. | PSNR, MSE | 29.07 80.92 |
| [22] | CT and MRI images | Chaos-based optimization | Medical images often exhibit characteristics such as low contrast, significant noise, and compact dimensions. The accurate identification of anomalies within these images heavily relies on their quality and level of clarity. | Entropy, edge contents | 6.65 0.19 |
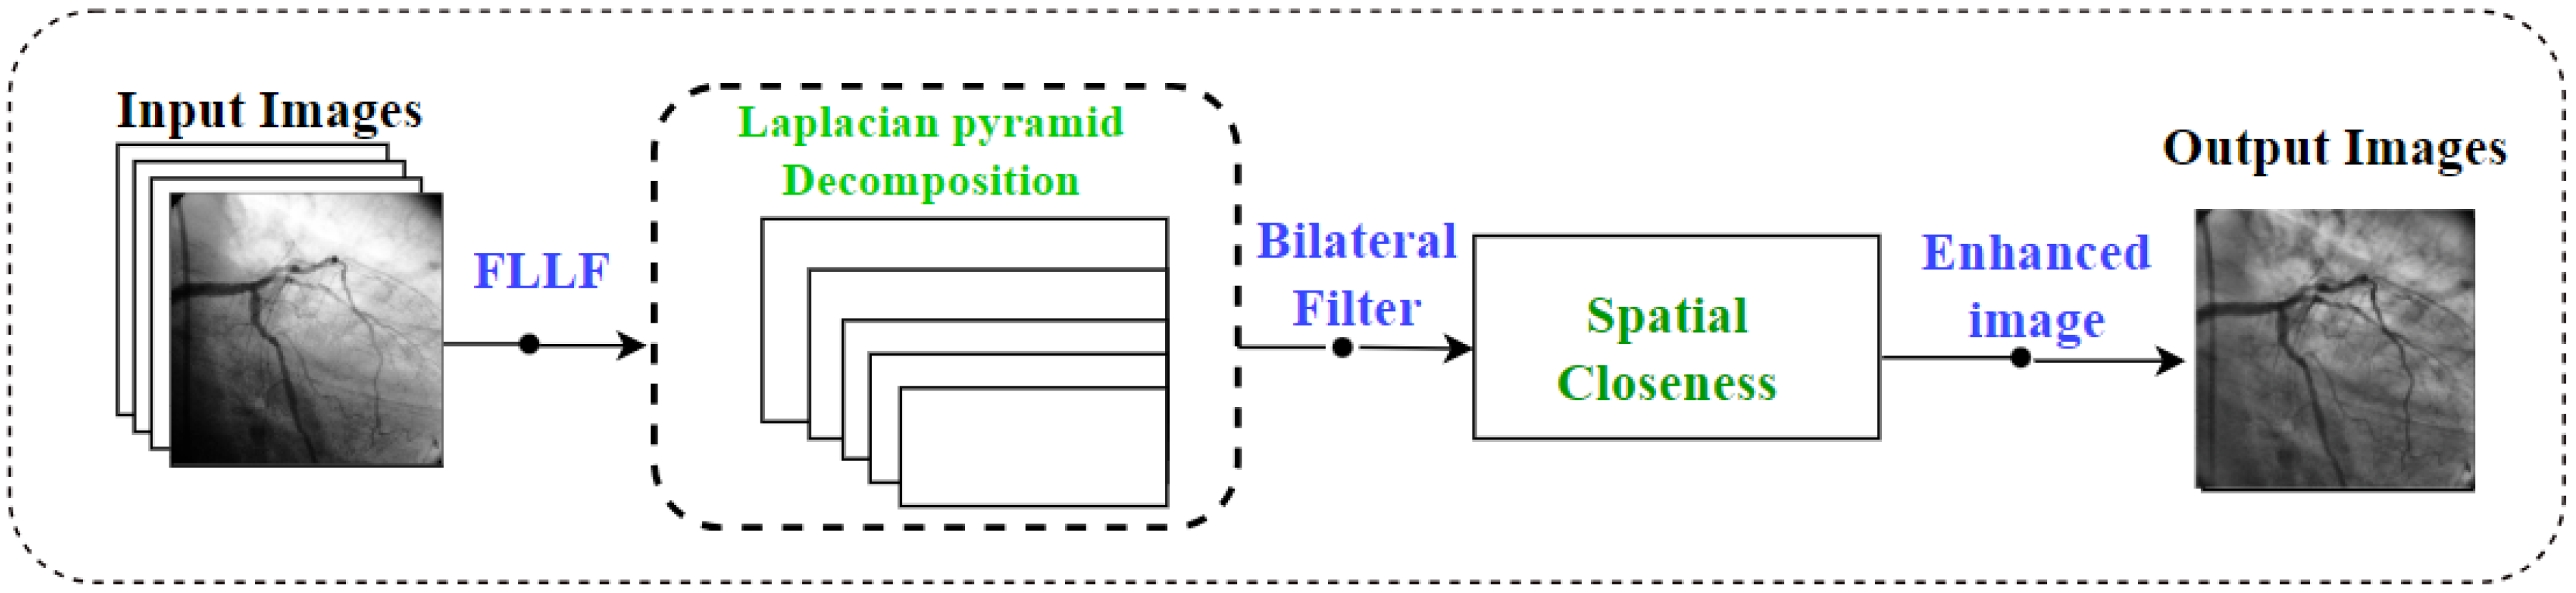
3. Proposed Methodology
3.1. Fast Local Laplacian Filter
- E: This is the enhanced image to be created, which will have improved contrast and details.
- : This represents the base image, which is typically the original input image to be enhanced.
- : The modified Laplacian at the top level of the pyramid is resized to match the dimensions of the base image (). This means ensuring that the and have the same width and height.
- : The sum () is taken over all levels (i) of the Laplacian pyramid from 1 to ‘n’. For each level, the corresponding modified Laplacian is resized to match the dimensions of the base image () and then added to the result.
- The original base image .
- The modified Laplacian at the top level of the Laplacian pyramid (), ensuring that it matches the dimensions of .
- The sum of the modified Laplacian levels from all levels of the pyramid (), where each level has been resized to match .
| Algorithm 1: Fast Local Laplacian Filter (FLLF) |
| Input: Image Mathematical Symbols: Gaussian Blur: Resizing: Laplacian: Bilateral Filter: Resizing: Enhanced Image: Parameters: Step 1. Generate Gaussian Pyramid: Create an empty Gaussian pyramid list Append to (base level) // Now this is a for-loop For Loop i in range Apply Gaussian blur to with kernel size proportional to Append the blurred image to End For Loop Step 2. Generate Laplacian Pyramid: Create an empty Laplacian pyramid list // Now this is a for-loop For Loop in range Resize to the dimensions of // Compute Laplacian pyramid using Equation (1) Append End For Loop Step 3. Enhance using Modified Laplacian: Create an empty modified Laplacian pyramid list // Now this is a for-loop For Loop each level Apply Bilateral filter to with spatial distance and range similarity Append the filtered result to End For Loop Step 4. Reconstruct Enhanced Image: Create an empty list // Now this is a for-loop For Loop in range ): //Compute modified Laplacian Resize to the dimensions of using Equation (2) Append the resized to using Equation (3) Sum all elements of and element-wise The reconstructed enhanced image is obtained End For Loop Output: Enhanced Image E |
3.2. Advantages of Fast Local Laplacian Filter
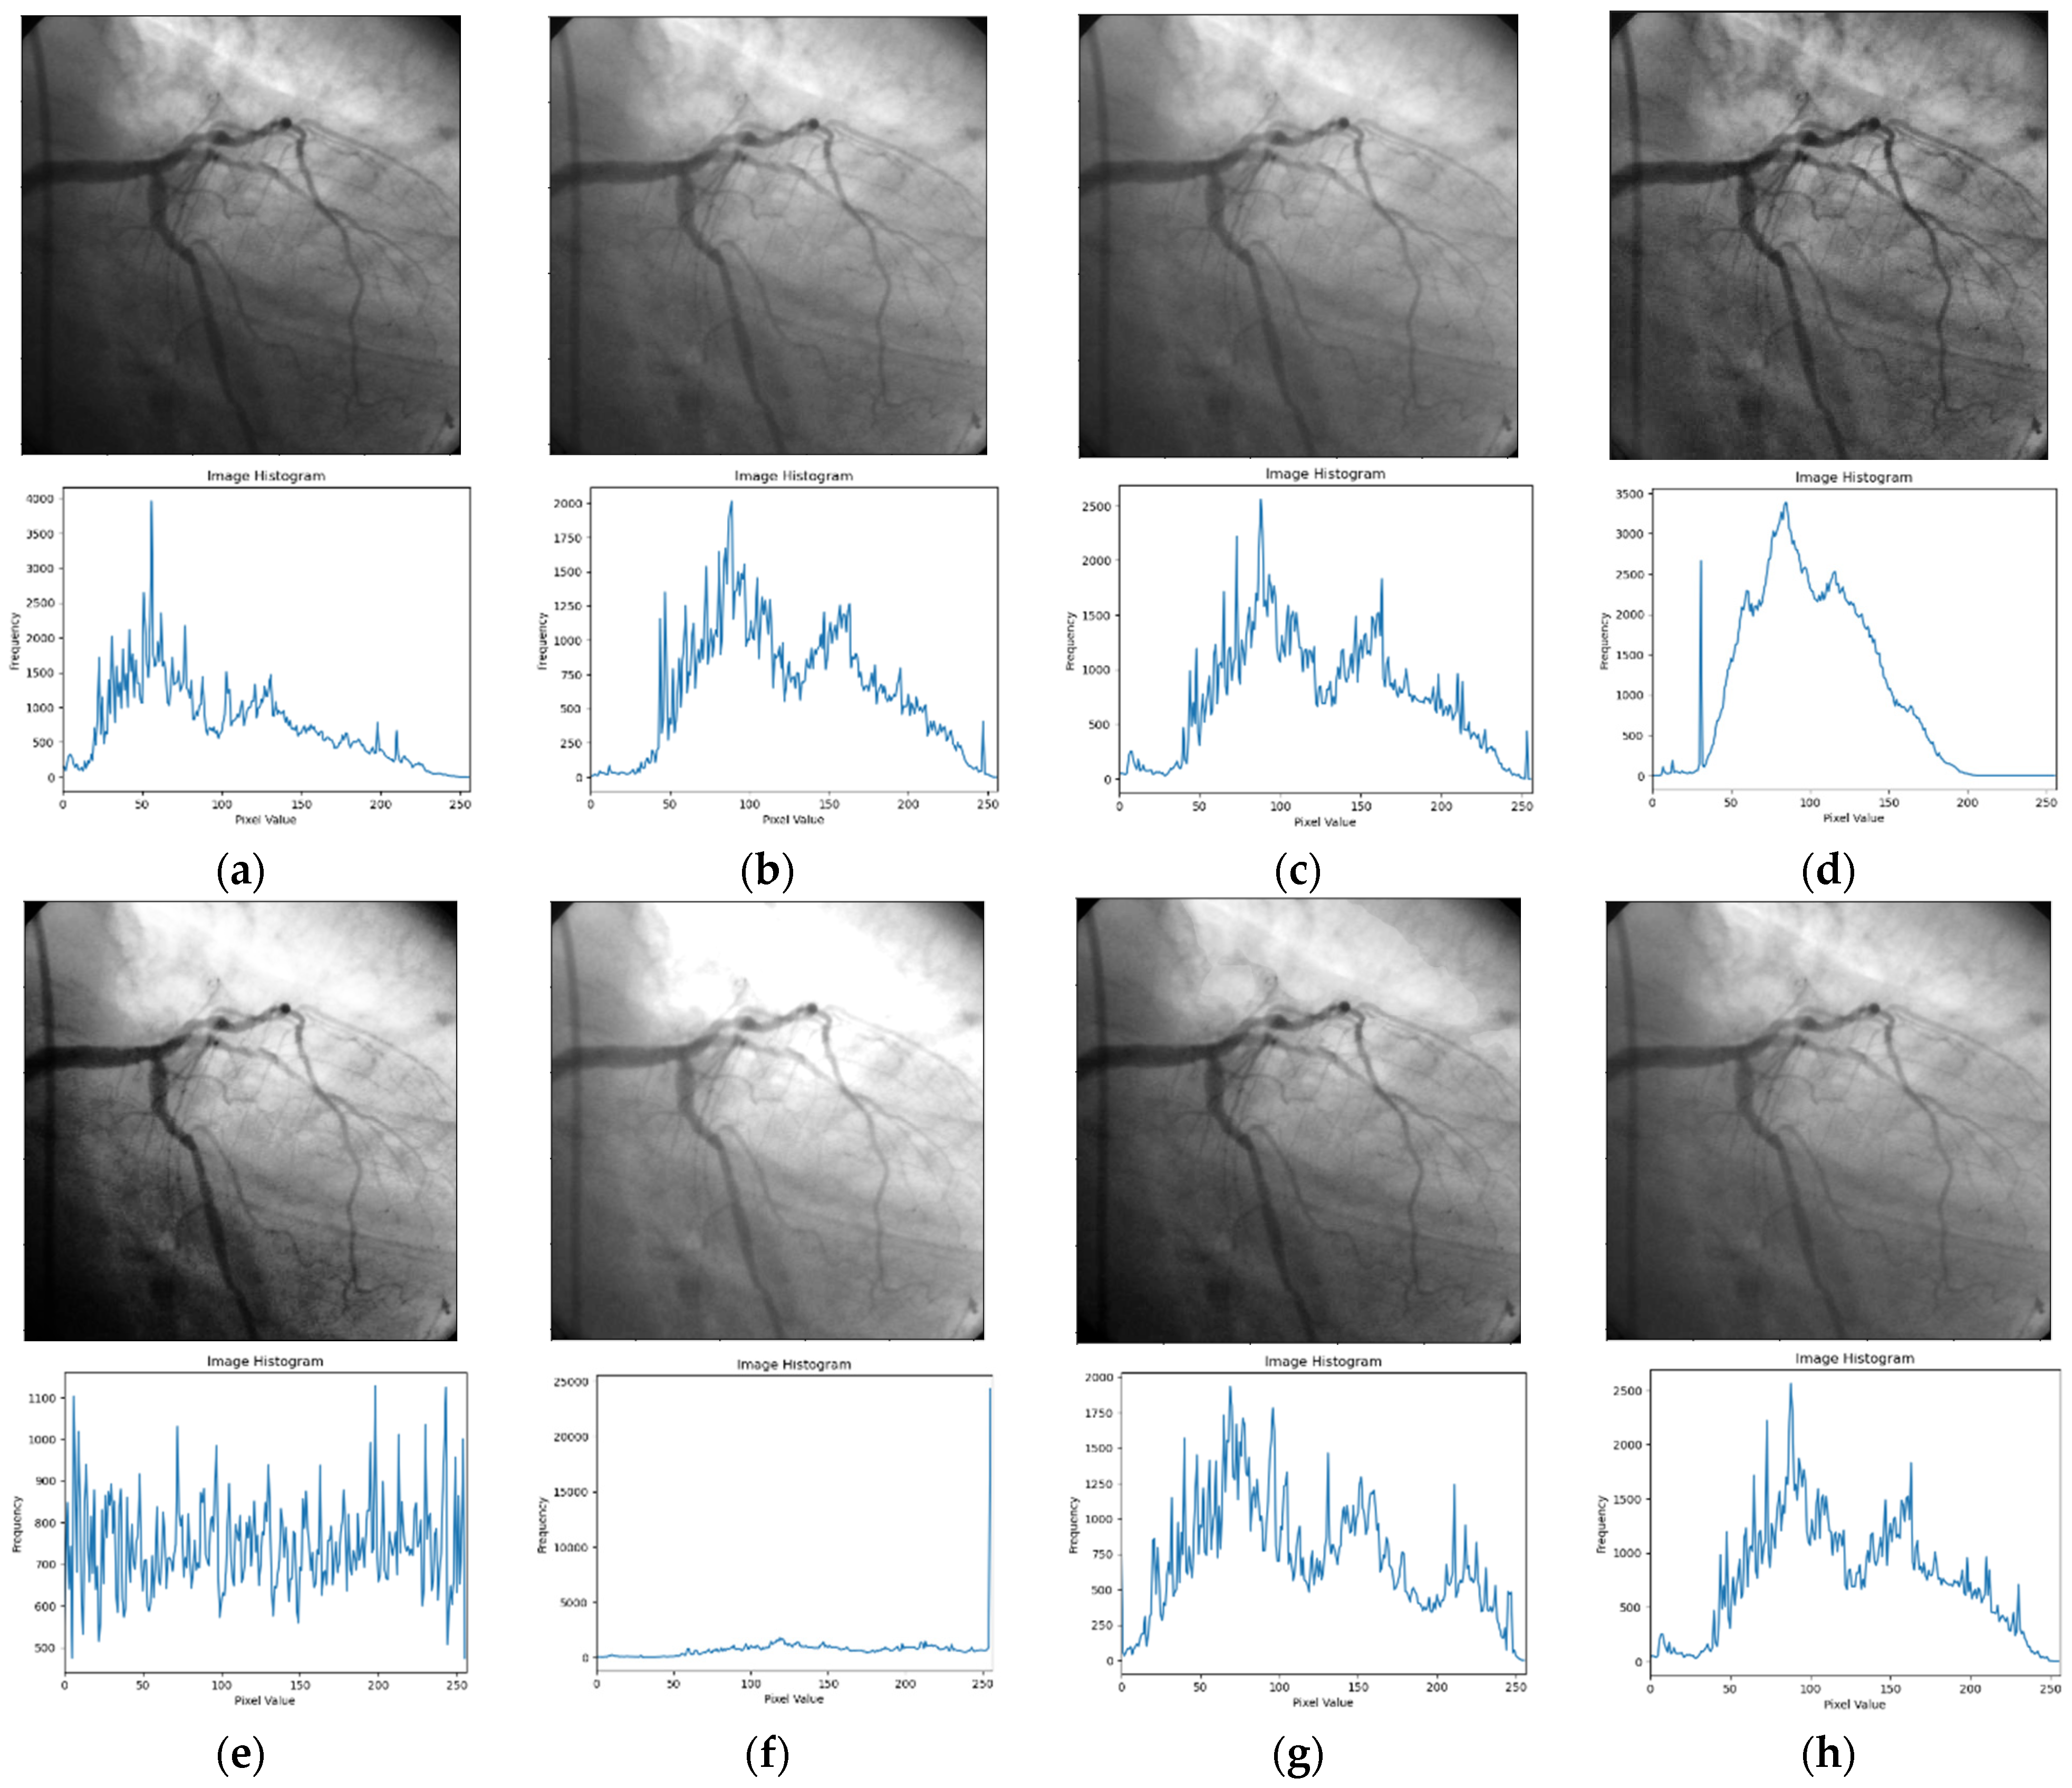
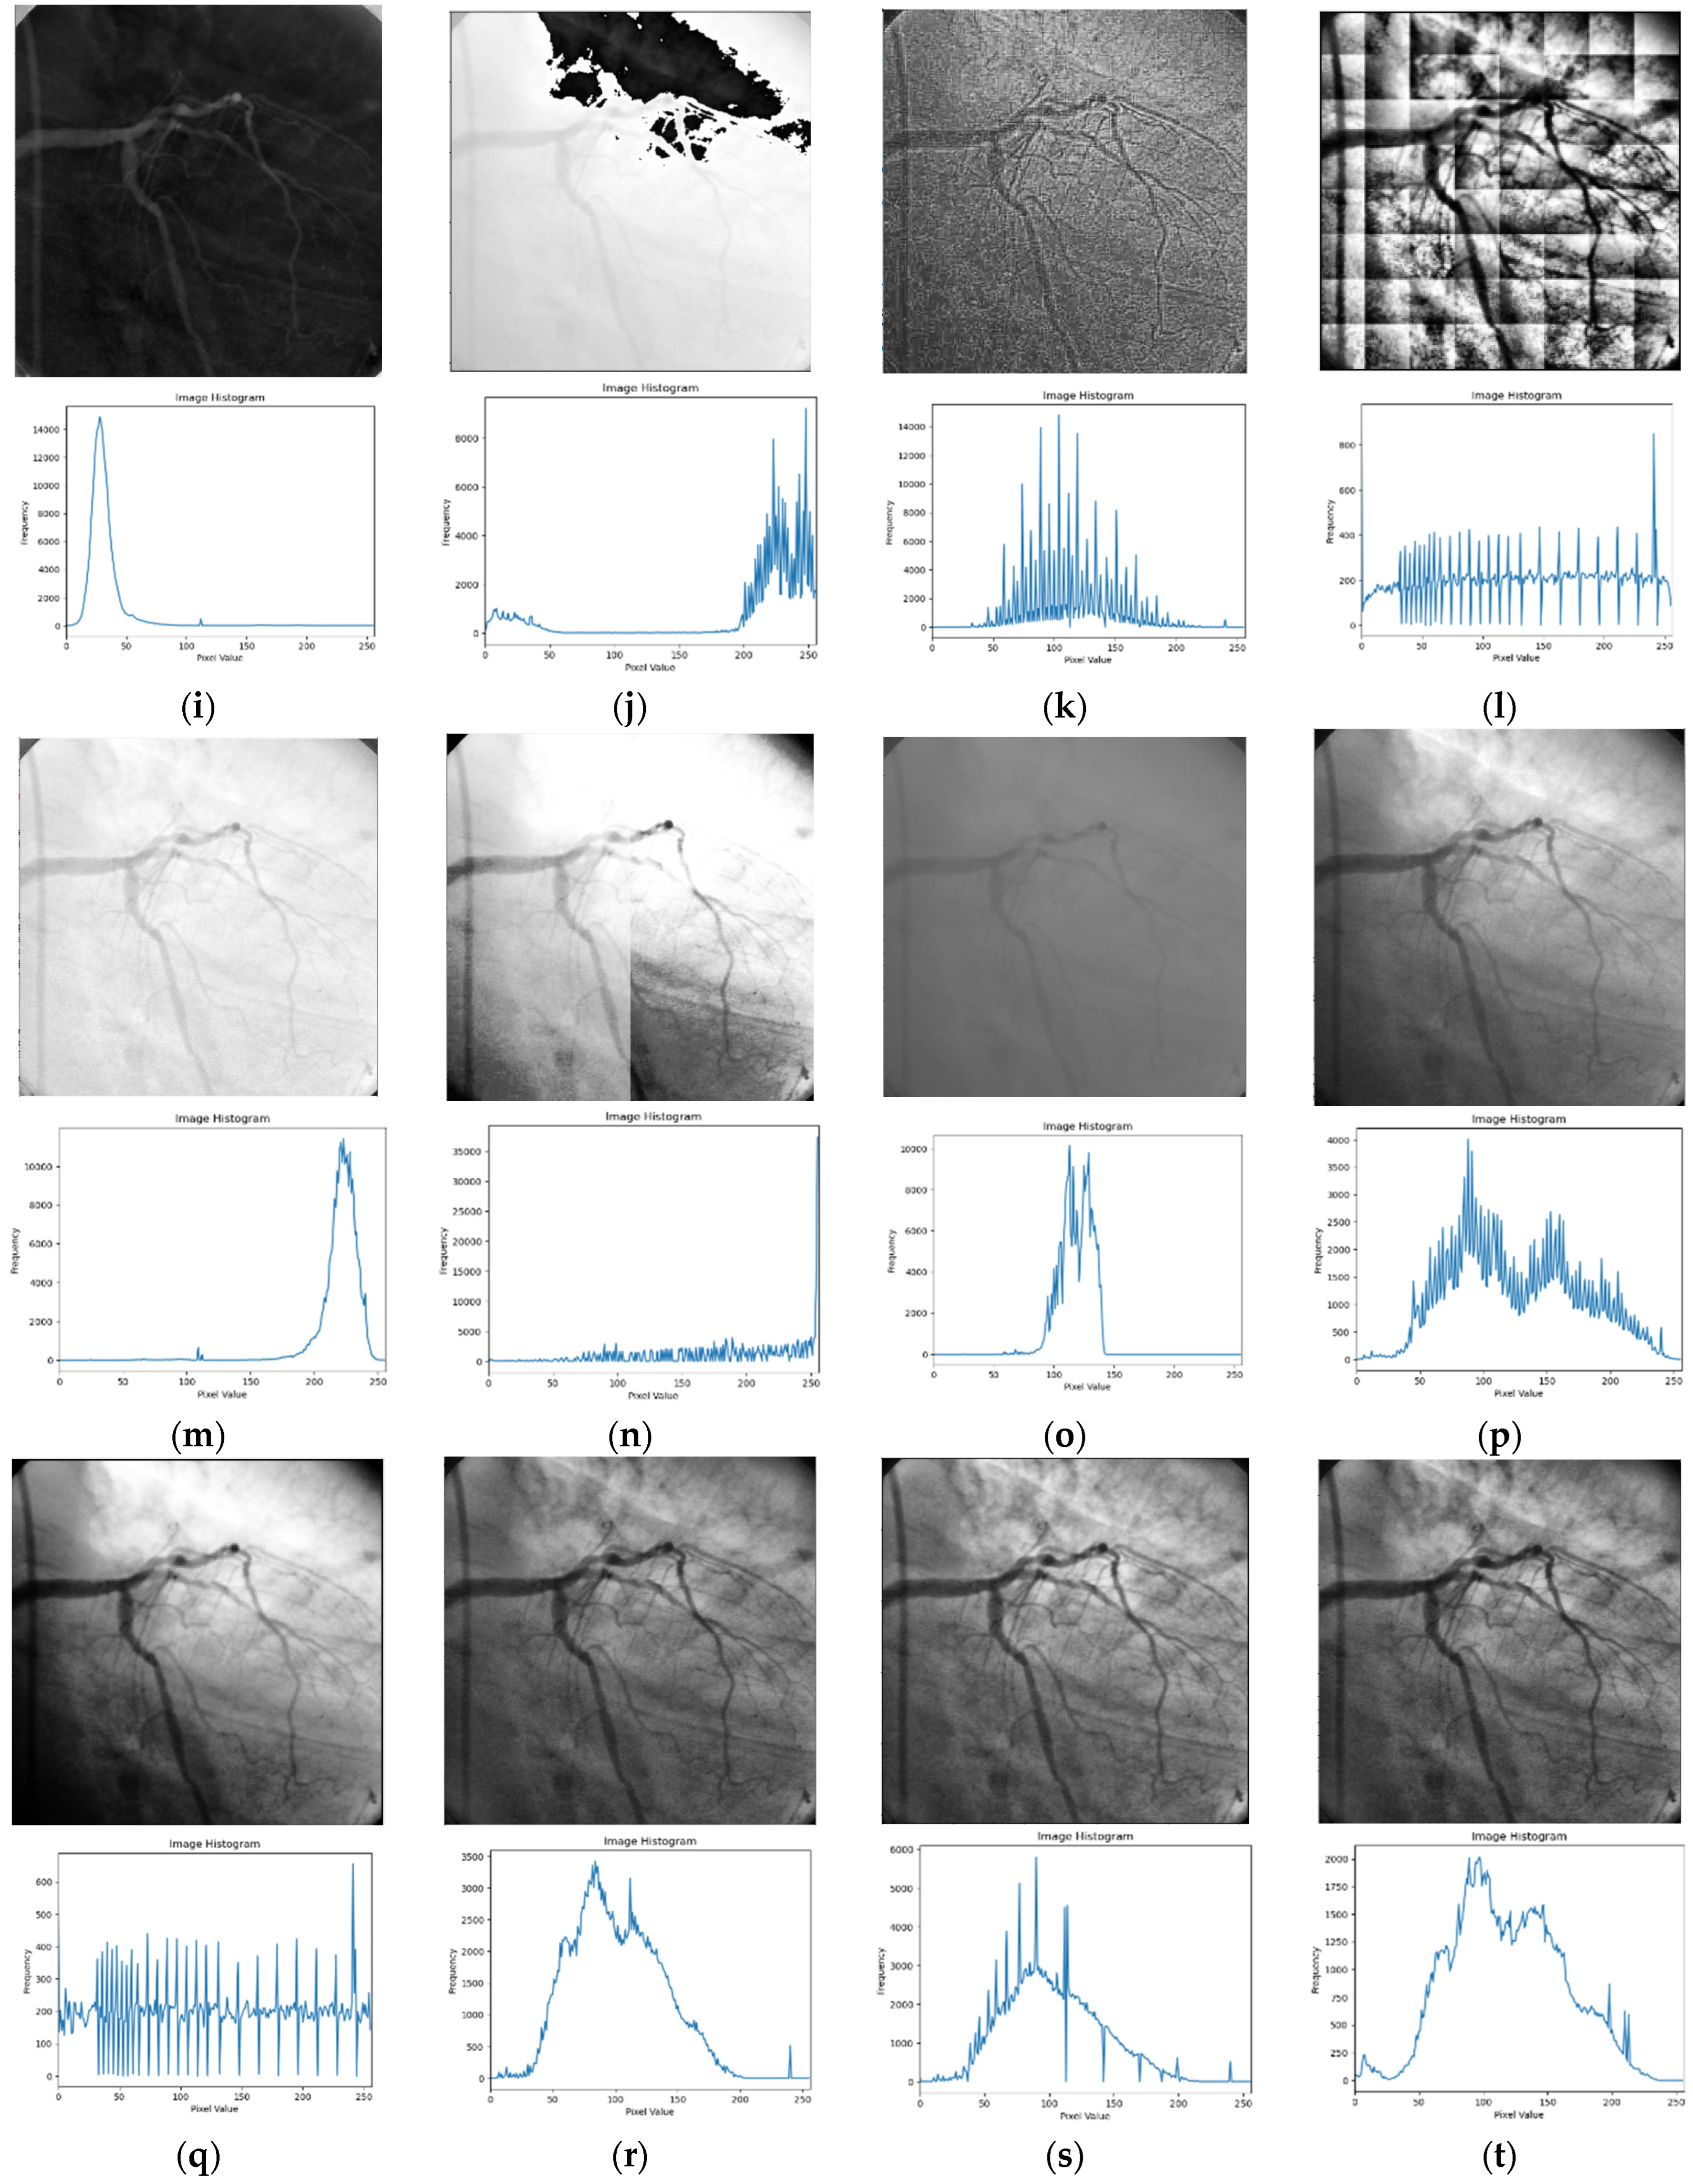
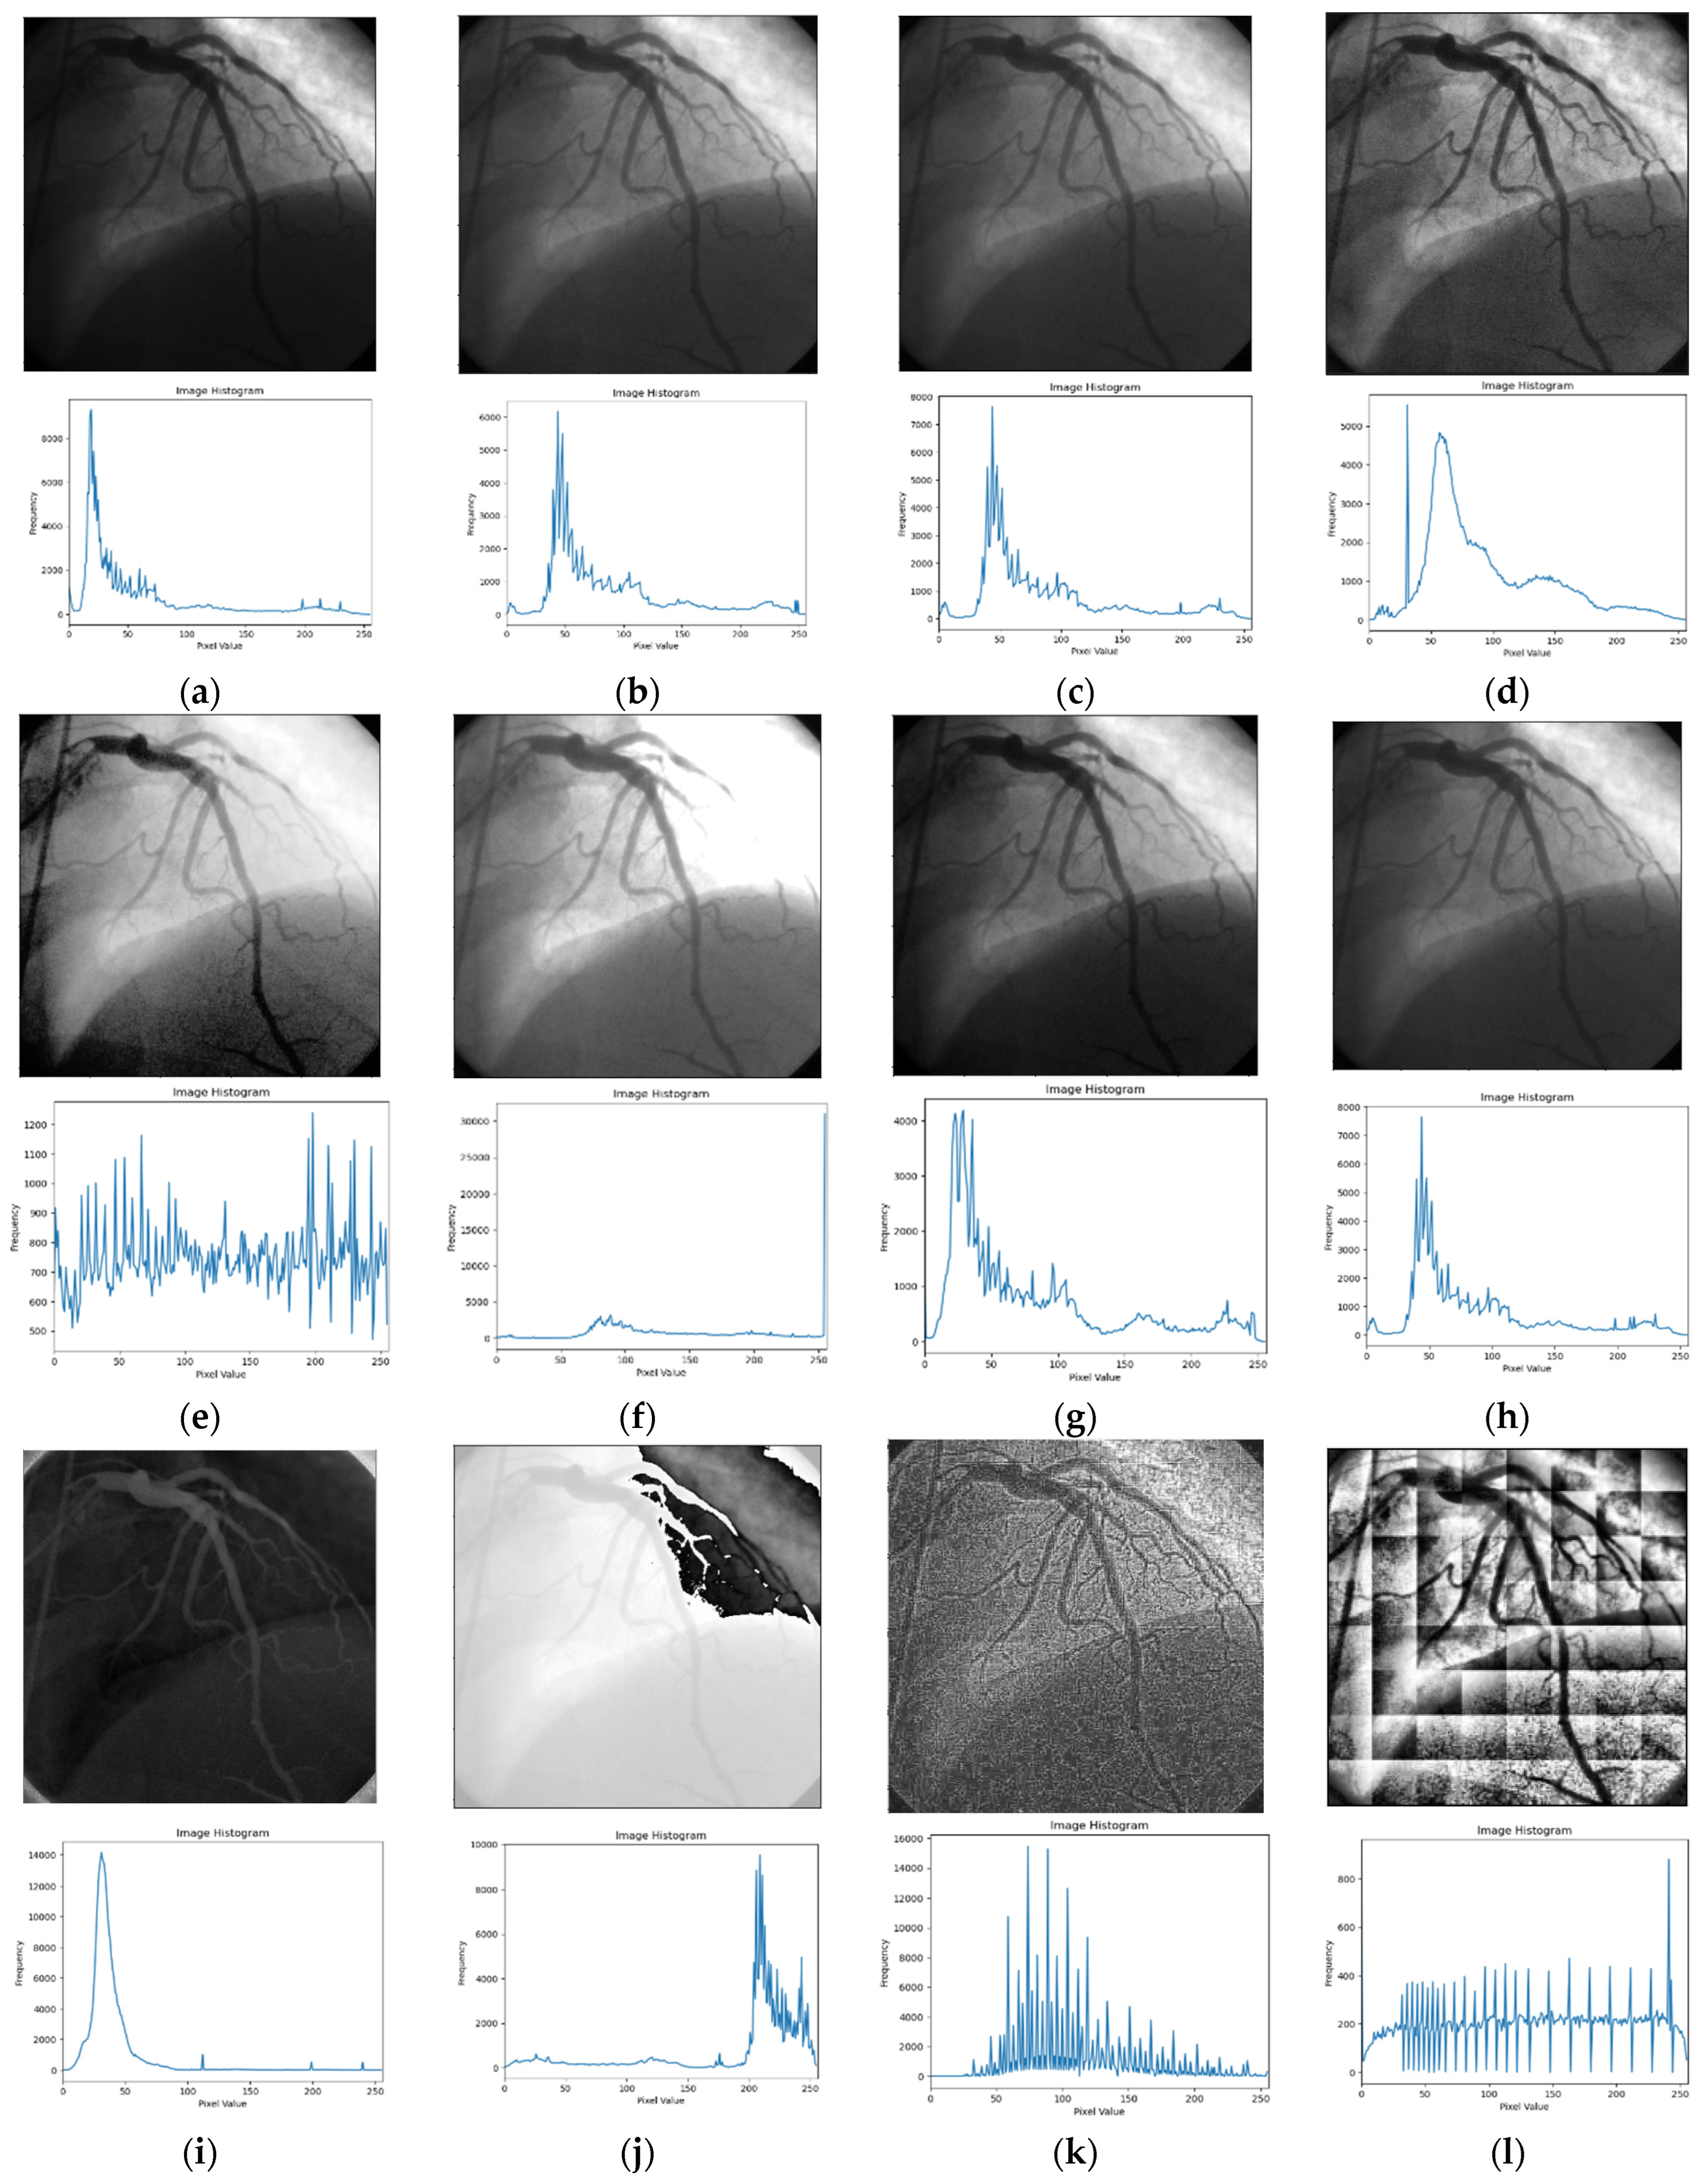
4. Experimentation
4.1. Performance Measures
4.2. Results and Discussion
4.3. Simulation Setup
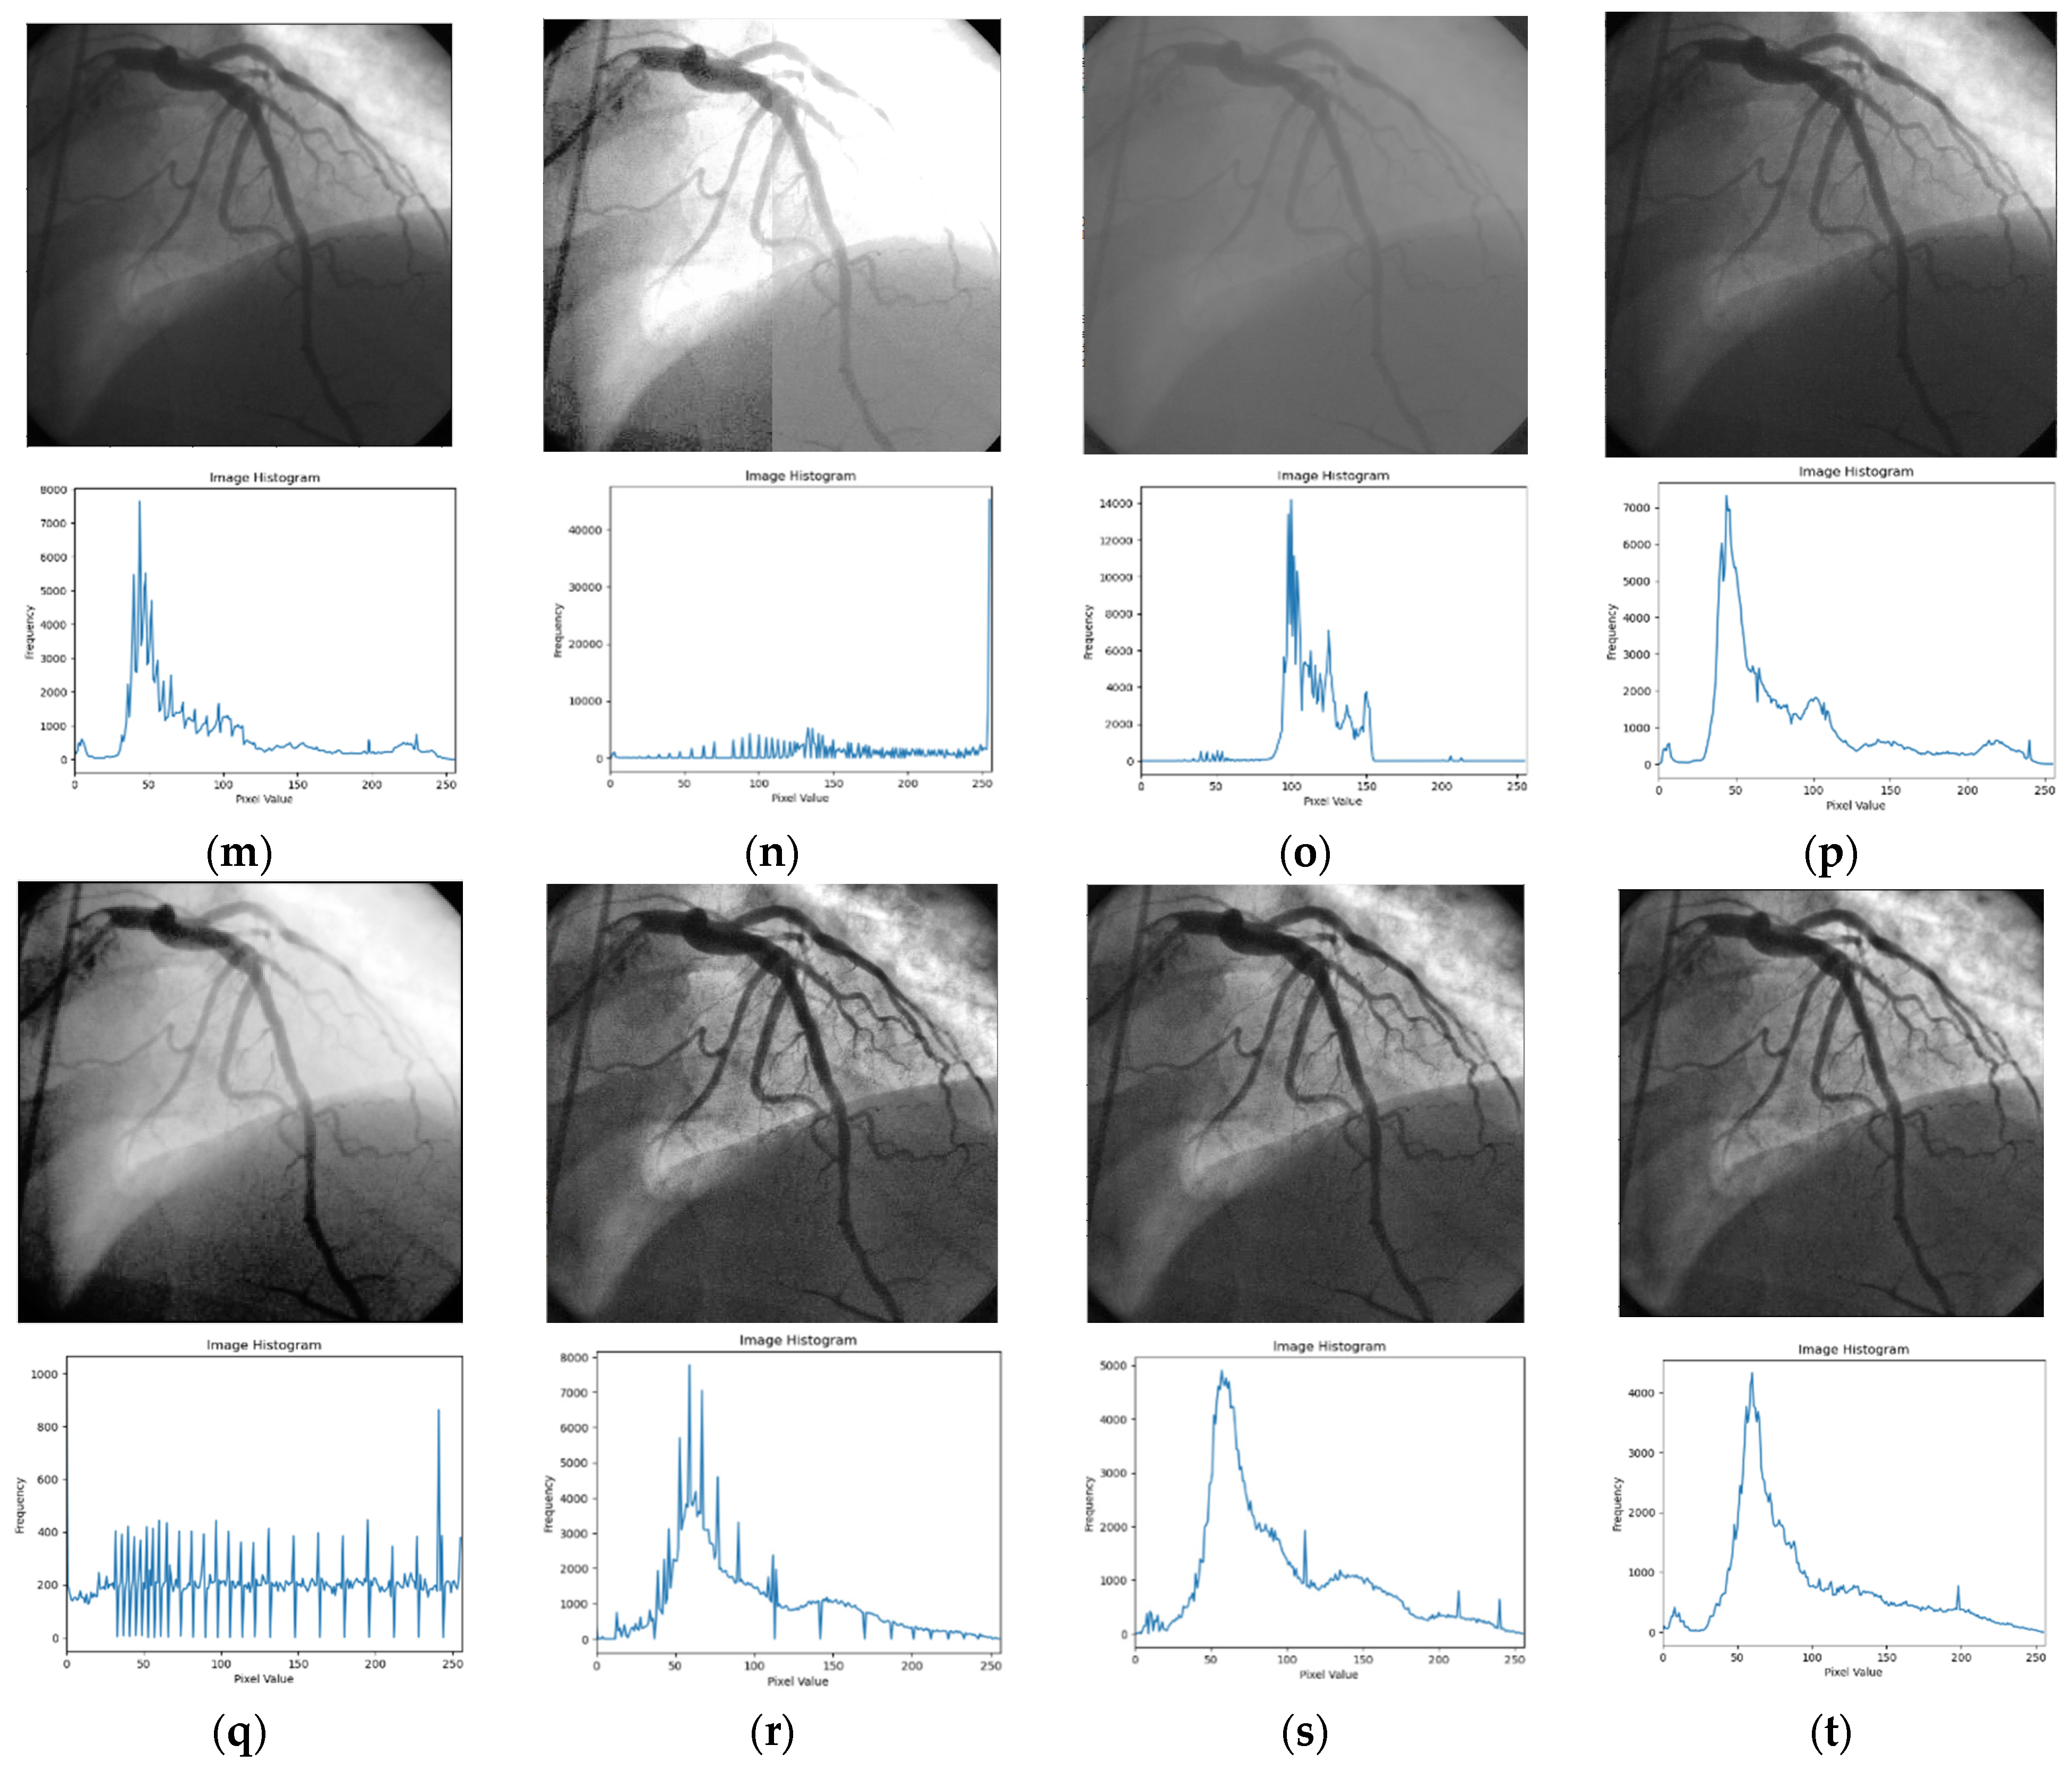
4.4. Visual Analysis
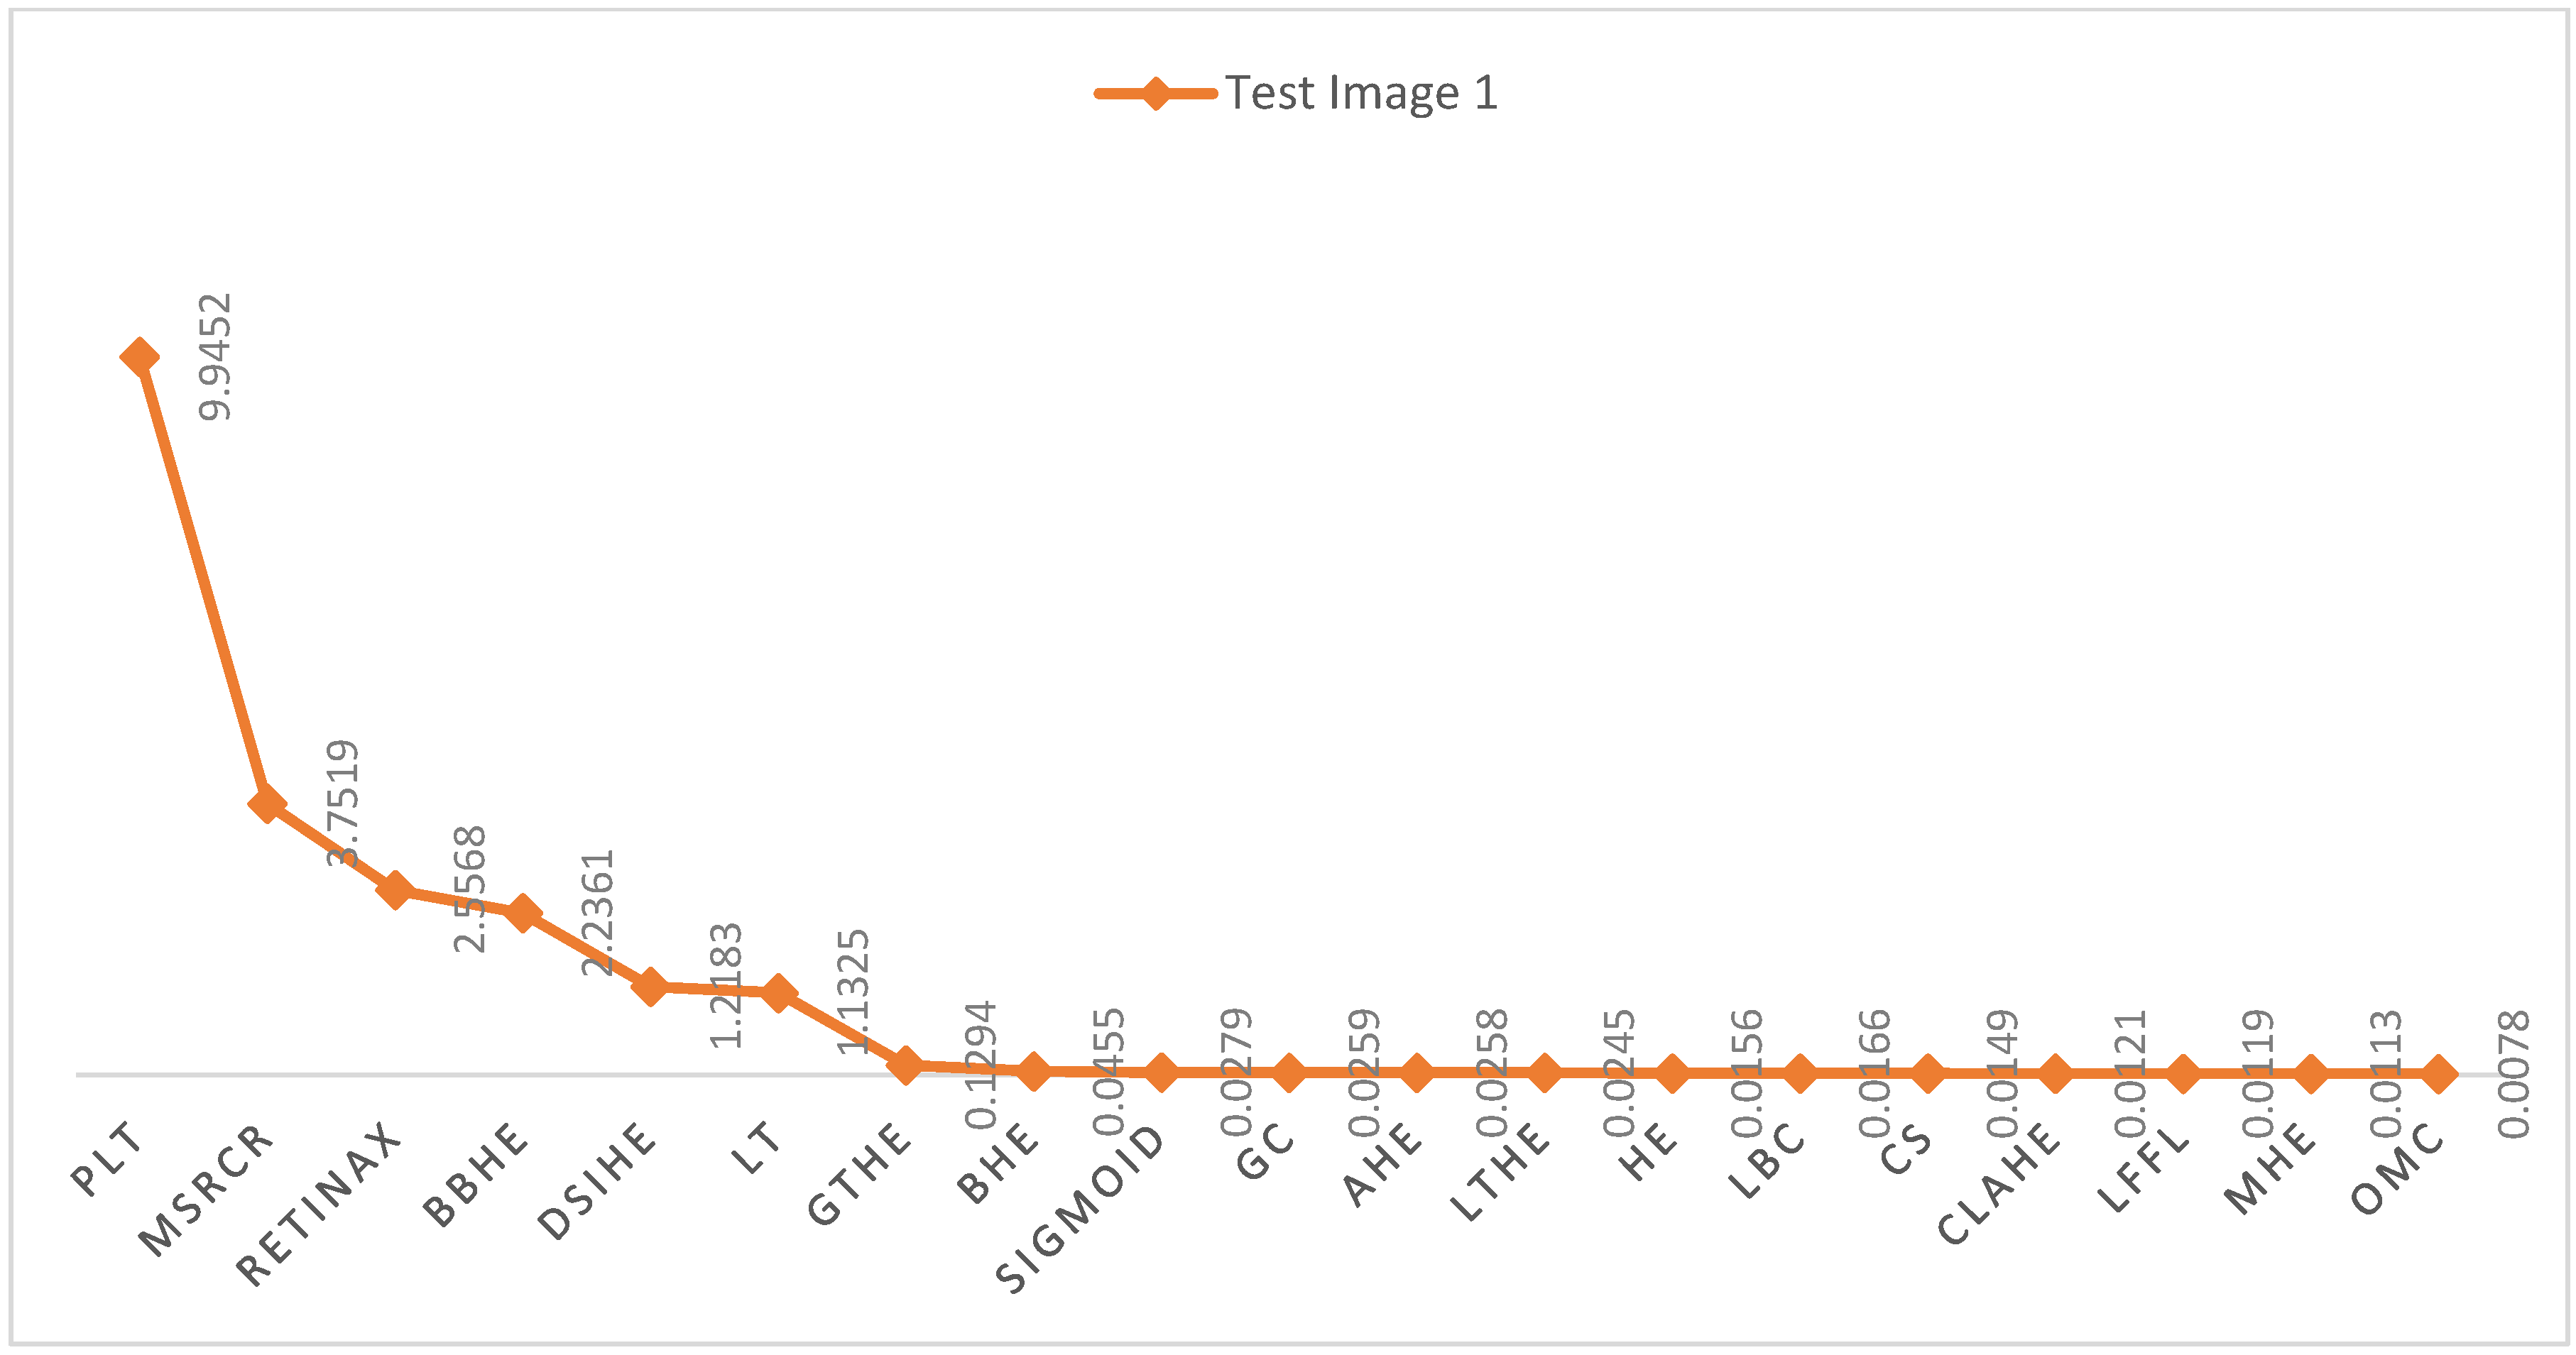
4.5. Statistical Analysis
5. Conclusions
Author Contributions
Funding
Data Availability Statement
Conflicts of Interest
References
- Mustapha, M.T.; Uzun, B.; Ozsahin, D.U.; Ozsahin, I. A comparative study of X-ray based medical imaging devices. In Applications of Multi-Criteria Decision-Making Theories in Healthcare and Biomedical Engineering; Elsevier: Amsterdam, The Netherlands, 2021; pp. 163–180. [Google Scholar]
- Wood, M.L. Variability and standardization of quantitative imaging. Investig. Radiol. 2020, 55, 617–618. [Google Scholar] [CrossRef]
- Garland, L.M.; Holdsworth, D.W.; Cunningham, I.A. Enhancing bare metal stent visibility using multi-energy subtraction X-ray imaging. In Proceedings of the Medical Imaging 2023: Physics of Medical Imaging, SPIE, San Diego, CA, USA, 19–23 February 2023; Volume 12463, pp. 442–447. [Google Scholar]
- Aubry, M.; Paris, S.; Hasinoff, S.W.; Kautz, J.; Durand, F. Fast local Laplacian filters: Theory and applications. ACM Trans. Graph. 2014, 33, 167. [Google Scholar] [CrossRef]
- Gao, Z.; Wang, L.; Soroushmehr, R.; Wood, A.; Gryak, J.; Nallamothu, B.; Najarian, K. Vessel segmentation for X-ray coronary angiography using ensemble methods with deep learning and filter-based features. BMC Med. Imaging 2022, 22, 10. [Google Scholar] [CrossRef]
- Jalili, M.H.; Yu, T.; Hassani, C.; Prosper, A.E.; Finn, J.P.; Bedayat, A. Contrast-enhanced MR Angiography without Gadolinium-based contrast material: Clinical applications using ferumoxytol. Radiol. Cardiothorac. Imaging 2022, 4, e210323. [Google Scholar] [CrossRef]
- Burger, W.; Burge, M.J. Digital Image Processing: An Algorithmic Introduction; Springer Nature: Berlin/Heidelberg, Germany, 2022. [Google Scholar]
- Liu, M.; Mei, S.; Liu, P.; Gasimov, Y.; Cattani, C. A New X-ray Medical-Image-Enhancement Method Based on Multiscale Shannon–Cosine Wavelet. Entropy 2022, 24, 1754. [Google Scholar] [CrossRef]
- Gao, F.; Wang, K.; Yang, Z.; Wang, Y.; Zhang, Q. Underwater image enhancement based on local contrast correction and multi-scale fusion. J. Mar. Sci. Eng. 2021, 9, 225. [Google Scholar] [CrossRef]
- Ullah, H.; Zhao, Y.; Abdalla, F.Y.O.; Wu, L. Fast local Laplacian filtering based enhanced medical image fusion using parameter-adaptive PCNN and local features-based fuzzy weighted matrices. Appl. Intell. 2022, 52, 7965–7984. [Google Scholar] [CrossRef]
- Zhang, Y.; Dong, Z. Medical imaging and image processing. Technologies 2023, 11, 54. [Google Scholar] [CrossRef]
- Zhang, Q.; Jiang, H.; Nie, Y.; Zheng, W.-S. Pyramid Texture Filtering. arXiv 2023, arXiv:2305.06525. [Google Scholar] [CrossRef]
- Zhang, G.; Lin, J.; Cao, E.; Pang, Y.; Sun, W. A medical endoscope image enhancement method based on improved weighted guided filtering. Mathematics 2022, 10, 1423. [Google Scholar] [CrossRef]
- Otgonbaatar, C.; Ryu, J.-K.; Shin, J.; Woo, J.Y.; Seo, J.W.; Shim, H.; Hwang, D.H. Improvement in image quality and visibility of coronary arteries, stents, and valve structures on CT angiography by deep learning reconstruction. Korean J. Radiol. 2022, 23, 1044. [Google Scholar] [CrossRef]
- Sunitha, T.O.; Rajalakshmi, R.; Sujatha, S.S. Fuzzy based dynamic histogram equalization for enhancing quality of registered medical image. J. Curr. Sci. Technol. 2022, 12, 243–264. [Google Scholar] [CrossRef]
- Showkat, S.; Parah, S.A.; Gull, S. Embedding in medical images with contrast enhancement and tamper detection capability. Multimed. Tools Appl. 2021, 80, 2009–2030. [Google Scholar] [CrossRef]
- Rao, B.S. Dynamic Histogram Equalization for contrast enhancement for digital images. Appl. Soft Comput. J. 2020, 89, 106114. [Google Scholar] [CrossRef]
- Zhou, Y.; Ye, J.; Du, Y.; Sheykhahmad, F.R. New Improved Optimized Method for Medical Image Enhancement Based on Modified Shark Smell Optimization Algorithm. Sens. Imaging 2020, 21, 20. [Google Scholar] [CrossRef]
- Subramani, B.; Veluchamy, M. Fuzzy Gray Level Difference Histogram Equalization for Medical Image Enhancement. J. Med. Syst. 2020, 44, 103. [Google Scholar] [CrossRef]
- Abdul-Adheem, W.R. Enhancement of magnetic resonance images through piecewise linear histogram equalization. J. Eng. Sci. Technol. 2020, 15, 2023–2039. [Google Scholar]
- Dar, K.A.; Mittal, S. An enhanced adaptive histogram equalization based local contrast preserving technique for HDR images. IOP Conf. Ser. Mater. Sci. Eng. 2021, 1022, 012119. [Google Scholar] [CrossRef]
- Wang, C.; Liu, W.; Jimenez, G. Using chaos world cup optimization algorithm for medical images contrast enhancement. Concurr. Comput. Pract. Exp. 2020, 32, e5428. [Google Scholar] [CrossRef]
- Abbasi, R.; Chen, J.; Al-Otaibi, Y.; Rehman, A.; Abbas, A.; Cui, W. RDH-based dynamic weighted histogram equalization using for secure transmission and cancer prediction. Multimed. Syst. 2021, 27, 177–189. [Google Scholar] [CrossRef]
- Agarwal, M.; Rani, G.; Dhaka, V.S. Optimized contrast enhancement for tumor detection. Int. J. Imaging Syst. Technol. 2020, 30, 687–703. [Google Scholar] [CrossRef]
- Khan, S.S.; Khan, M.; Ran, Q. Multi-focus color image fusion using laplacian filter and discrete fourier transformation with qualitative error image metrics. In Proceedings of the 2nd International Conference on Control and Computer Vision, Jeju, Republic of Korea, 15–18 June 2019; pp. 41–45. [Google Scholar] [CrossRef]
- Khan, S.S.; Ran, Q.; Khan, M. Image pan-sharpening using enhancement based approaches in remote sensing. Multimed. Tools Appl. 2020, 79, 32791–32805. [Google Scholar] [CrossRef]
- Kaur, R.; Kaur, S. Comparison of Contrast Enhancement Techniques for Medical Image. In Proceedings of the 2016 Conference on Emerging Devices and Smart Systems (ICEDSS), Namakkal, India, 4–5 March 2016; pp. 155–159. [Google Scholar] [CrossRef]
- Shah, M.; Technology, I.; Khan, S.S.; Technology, I.; Khan, M.; Technology, S.; Ali, S. Multi-Focus Image Fusion using Unsharp Masking with Discrete Cosine Transform. In Proceedings of the 1st International Conference on Computing Technologies, Tools and Applications (ICTA PP-23), Peshawar, Pakistan, 9–11 May 2023; pp. 1–5. [Google Scholar]
- Khan, S.S.; Khan, M.; Alharbi, Y. Multi focus image fusion using image enhancement techniques with wavelet transformation. Int. J. Adv. Comput. Sci. Appl. 2020, 11, 414–420. [Google Scholar] [CrossRef]
- Daway, E.G.; Abdulameer, F.S.; Daway, H.G. X-ray Image Enhancement Using Retinex Algorithm Based On Color Restoration. J. Eng. Sci. Technol. 2022, 17, 1276–1286. [Google Scholar]
- Almalki, Y.E.; Jandan, N.A.; Soomro, T.A.; Ali, A.; Kumar, P.; Irfan, M.; Keerio, M.U.; Rahman, S.; Alqahtani, A.; Alqhtani, S.M. Enhancement of Medical Images through an Iterative McCann Retinex Algorithm: A Case of Detecting Brain Tumor and Retinal Vessel Segmentation. Appl. Sci. 2022, 12, 8243. [Google Scholar] [CrossRef]
- Lei, X.; Wang, H.; Shen, J.I.E.; Chen, Z.H.E.; Zhang, W. A novel intelligent underwater image enhancement method via color correction and contrast stretching. Microprocess. Microsyst. 2021, 10, 4040. [Google Scholar] [CrossRef]
- Acharya, A.; Giri, A.V. Contrast improvement using local gamma correction. In Proceedings of the 2020 6th International Conference on Advanced Computing and Communication Systems (ICACCS), Coimbatore, India, 6–7 March 2020; pp. 110–114. [Google Scholar]
- Agrawal, S.; Panda, R.; Mishro, P.K.; Abraham, A. A novel joint histogram equalization based image contrast enhancement. J. King Saud Univ. Inf. Sci. 2022, 34, 1172–1182. [Google Scholar] [CrossRef]
- Tung, T.-C.; Fuh, C.-S. ICEBIN: Image contrast enhancement based on induced norm and local patch approaches. IEEE Access 2021, 9, 23737–23750. [Google Scholar] [CrossRef]
- Zhang, W.; Jin, S.; Zhuang, P.; Liang, Z.; Li, C. Underwater image enhancement via piecewise color correction and dual prior optimized contrast enhancement. IEEE Signal Process. Lett. 2023, 30, 229–233. [Google Scholar] [CrossRef]
- Khan, S.A.; Hussain, S.; Yang, S. Contrast enhancement of low-contrast medical images using modified contrast limited adaptive histogram equalization. J. Med. Imaging Health Inform. 2020, 10, 1795–1803. [Google Scholar] [CrossRef]
- Huang, Z.; Wang, Z.; Zhang, J.; Li, Q.; Shi, Y. Image enhancement with the preservation of brightness and structures by employing contrast limited dynamic quadri-histogram equalization. Optik (Stuttg) 2021, 226, 165877. [Google Scholar] [CrossRef]
- Ezhilraja, K.; Shanmugavadivu, P. Contrast Enhancement of Lung CT Scan Images using Multi-Level Modified Dualistic Sub-Image Histogram Equalization. In Proceedings of the 2022 International Conference on Automation, Computing and Renewable Systems (ICACRS), Pudukkottai, India, 13–15 December 2022; pp. 1009–1014. [Google Scholar]
- Zhou, J.; Yao, J.; Zhang, W.; Zhang, D. Multi-scale retinex-based adaptive gray-scale transformation method for underwater image enhancement. Multimed. Tools Appl. 2022, 81, 1811–1831. [Google Scholar] [CrossRef]
- Khan, S.S.; Khan, M.; Khan, R.S. Automatic Segmentation and Classification to Diagnose Coronary Artery Disease (AuSC-CAD) Using Angiographic Images: A Novel Framework. In Proceedings of the IEEE International Conference on Emerging Technologies (ICET), Peshawar, Pakistan, 6–7 November 2023. [Google Scholar]


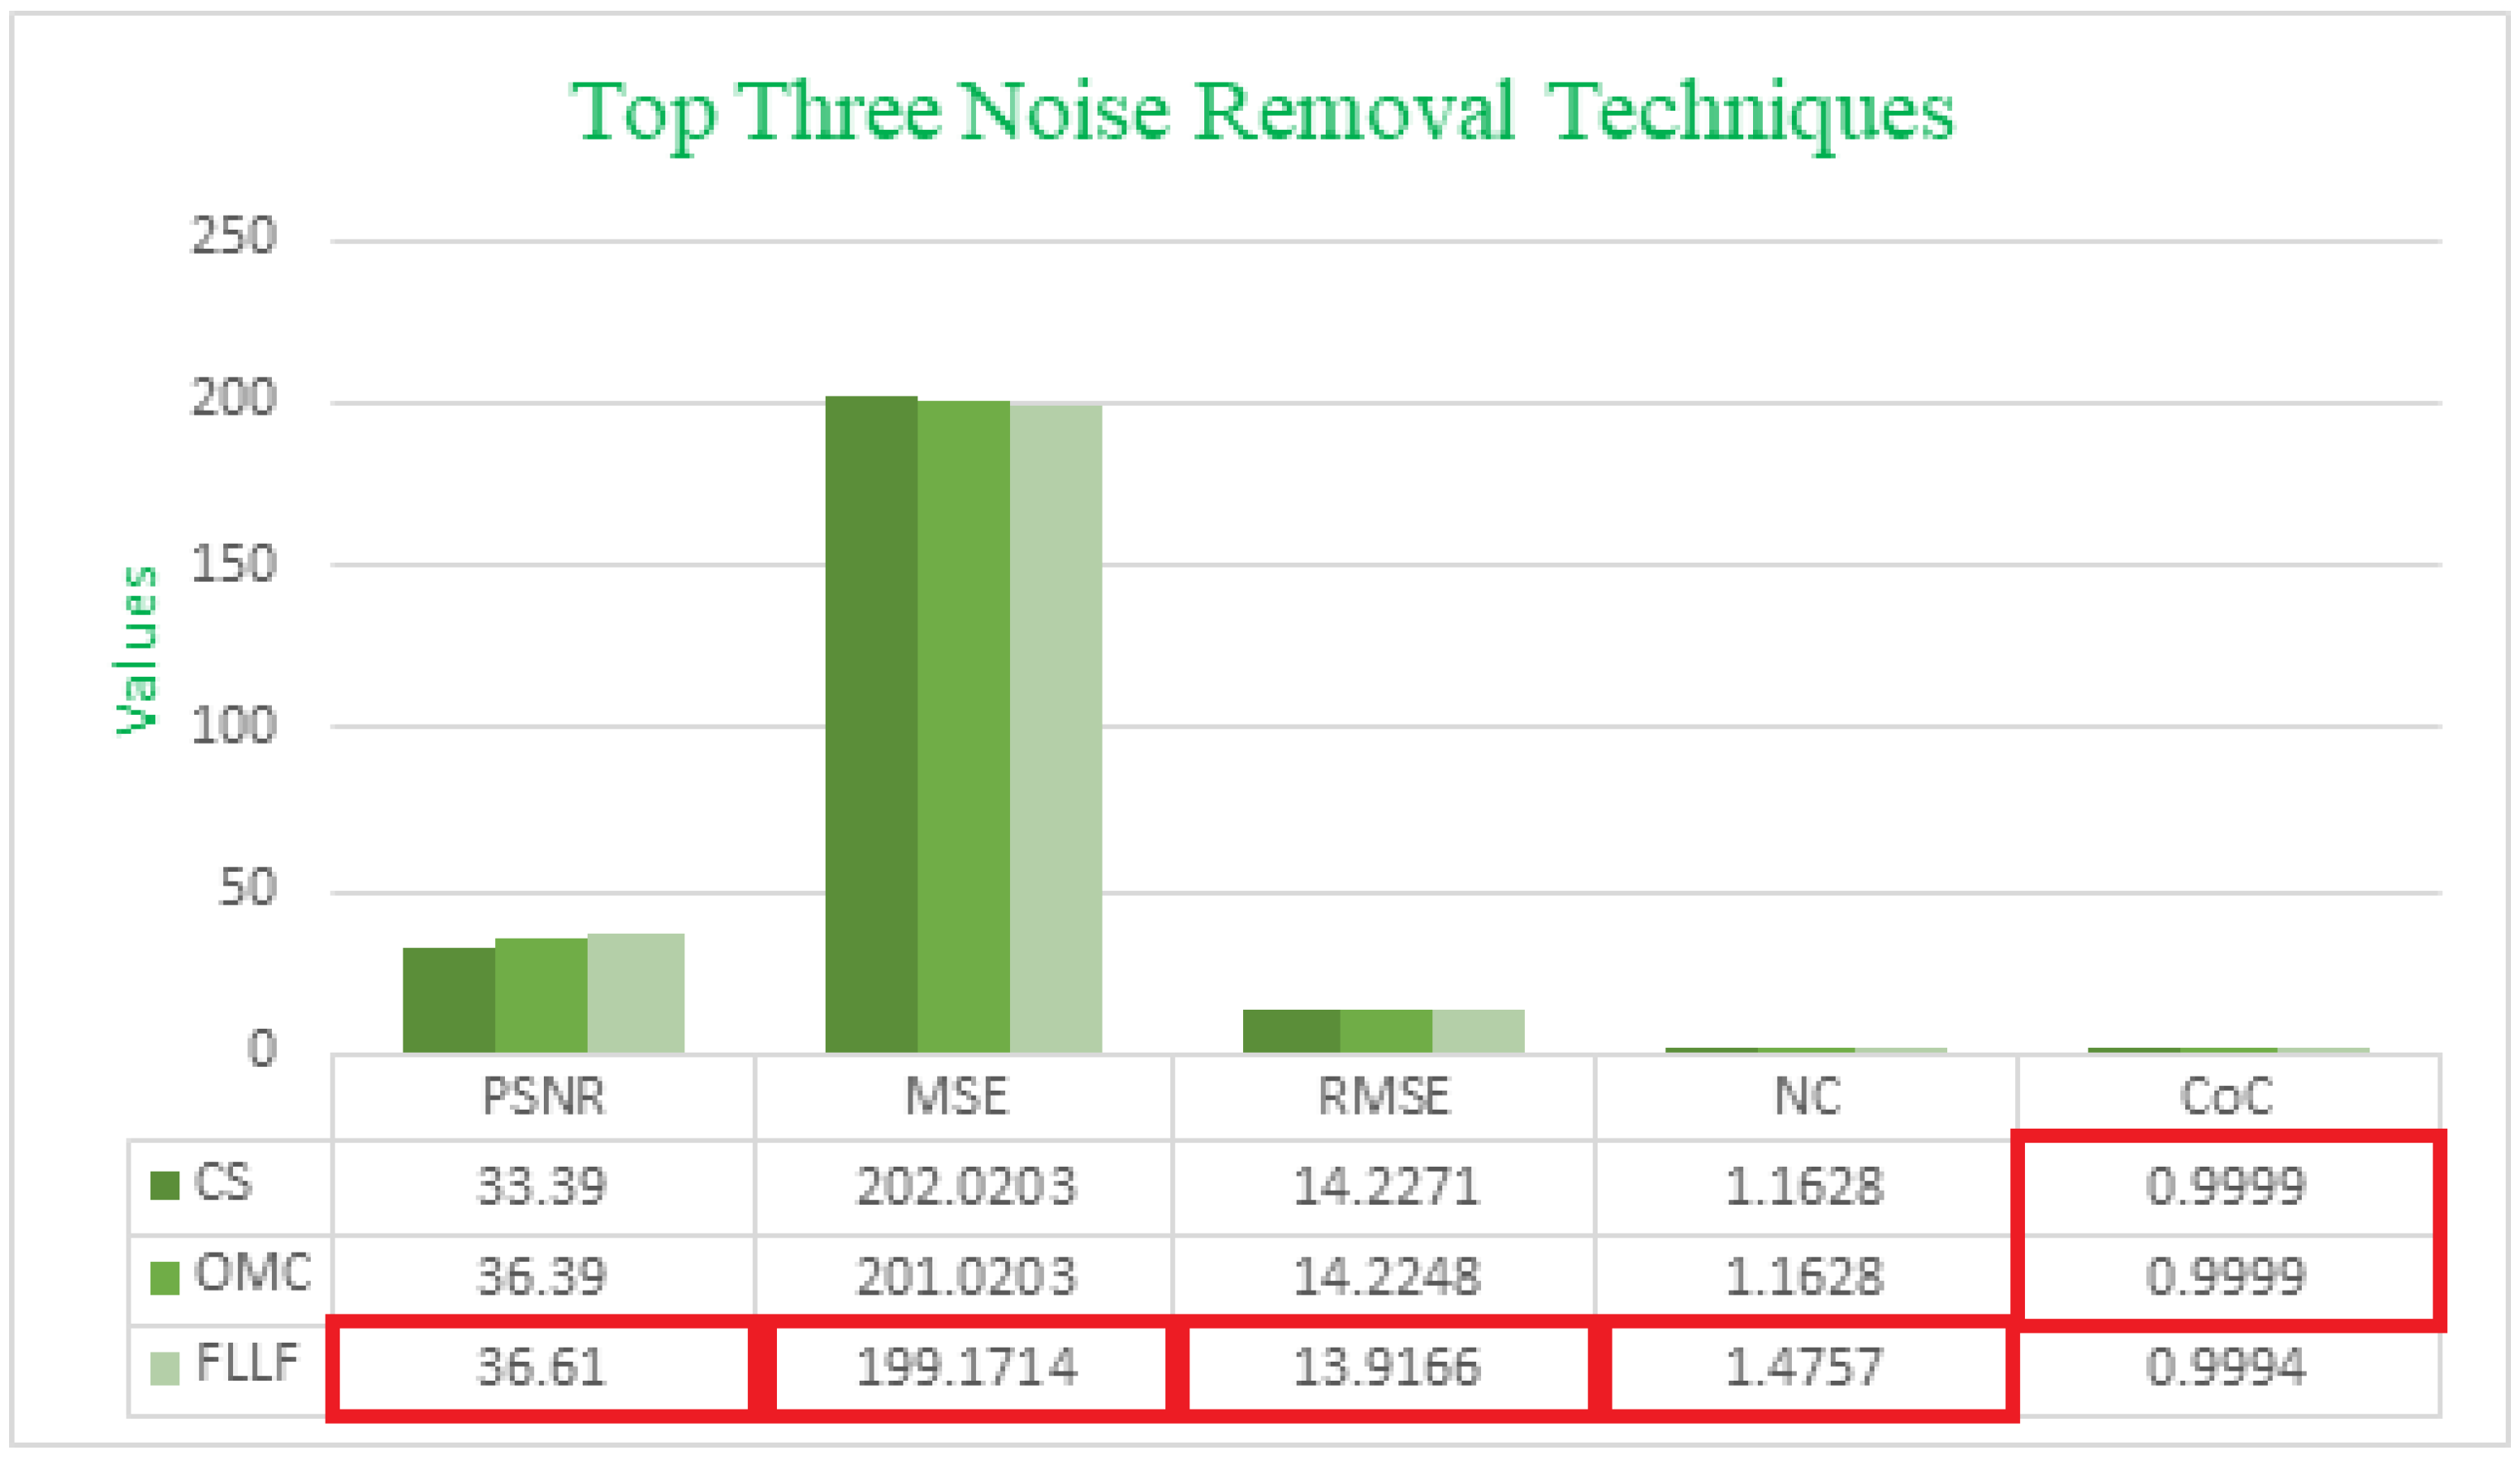
| Contrast Techniques | PSNR | MSE | RMSE | NC | CoC |
|---|---|---|---|---|---|
| Retinax | 33.03 | 18,333.3601 | 135.4007 | 1.1377 | 0.6950 |
| CS | 33.39 | 202.0203 | 14.2271 | 1.1628 | 0.9999 |
| GC | 27.44 | 1189.6561 | 34.4913 | 1.1287 | 0.9954 |
| HE | 27.58 | 3416.8531 | 58.4538 | 1.0514 | 0.9910 |
| LBC | 27.76 | 7060.3217 | 84.0257 | 1.2837 | 0.9871 |
| LTHE | 28.55 | 261.2856 | 16.1643 | 1.2102 | 0.9471 |
| OMC | 36.39 | 201.0203 | 14.2248 | 1.1628 | 0.9999 |
| PLT | 28.59 | 202.4859 | 14.2297 | 1.1092 | 0.9987 |
| Sigmoid | 28.82 | 18,690.0791 | 136.7116 | 1.0525 | 0.4992 |
| AHE | 28.45 | 312.3480 | 17.6733 | 1.1981 | 0.9390 |
| BHE | 29.44 | 12,334.8630 | 111.0624 | 1.1844 | 0.8451 |
| BBHE | 28.37 | 1353.1227 | 36.7848 | 1.2041 | 0.8897 |
| CLAHE | 31.45 | 312.3480 | 17.6733 | 1.1981 | 0.9390 |
| DSIHE | 27.89 | 3307.2439 | 57.5086 | 1.2546 | 0.7789 |
| GTHE | 27.58 | 3416.8531 | 58.4538 | 1.0514 | 0.9910 |
| LT | 27.54 | 1335.1442 | 36.5396 | 1.4988 | 0.9759 |
| MHE | 27.95 | 7390.1161 | 85.9657 | 1.1611 | 0.2412 |
| MSRCR | 27.64 | 13,659.7440 | 116.8749 | 1.1412 | 0.1630 |
| FLLF | 36.61 | 199.1714 | 13.9166 | 1.4757 | 0.9994 |
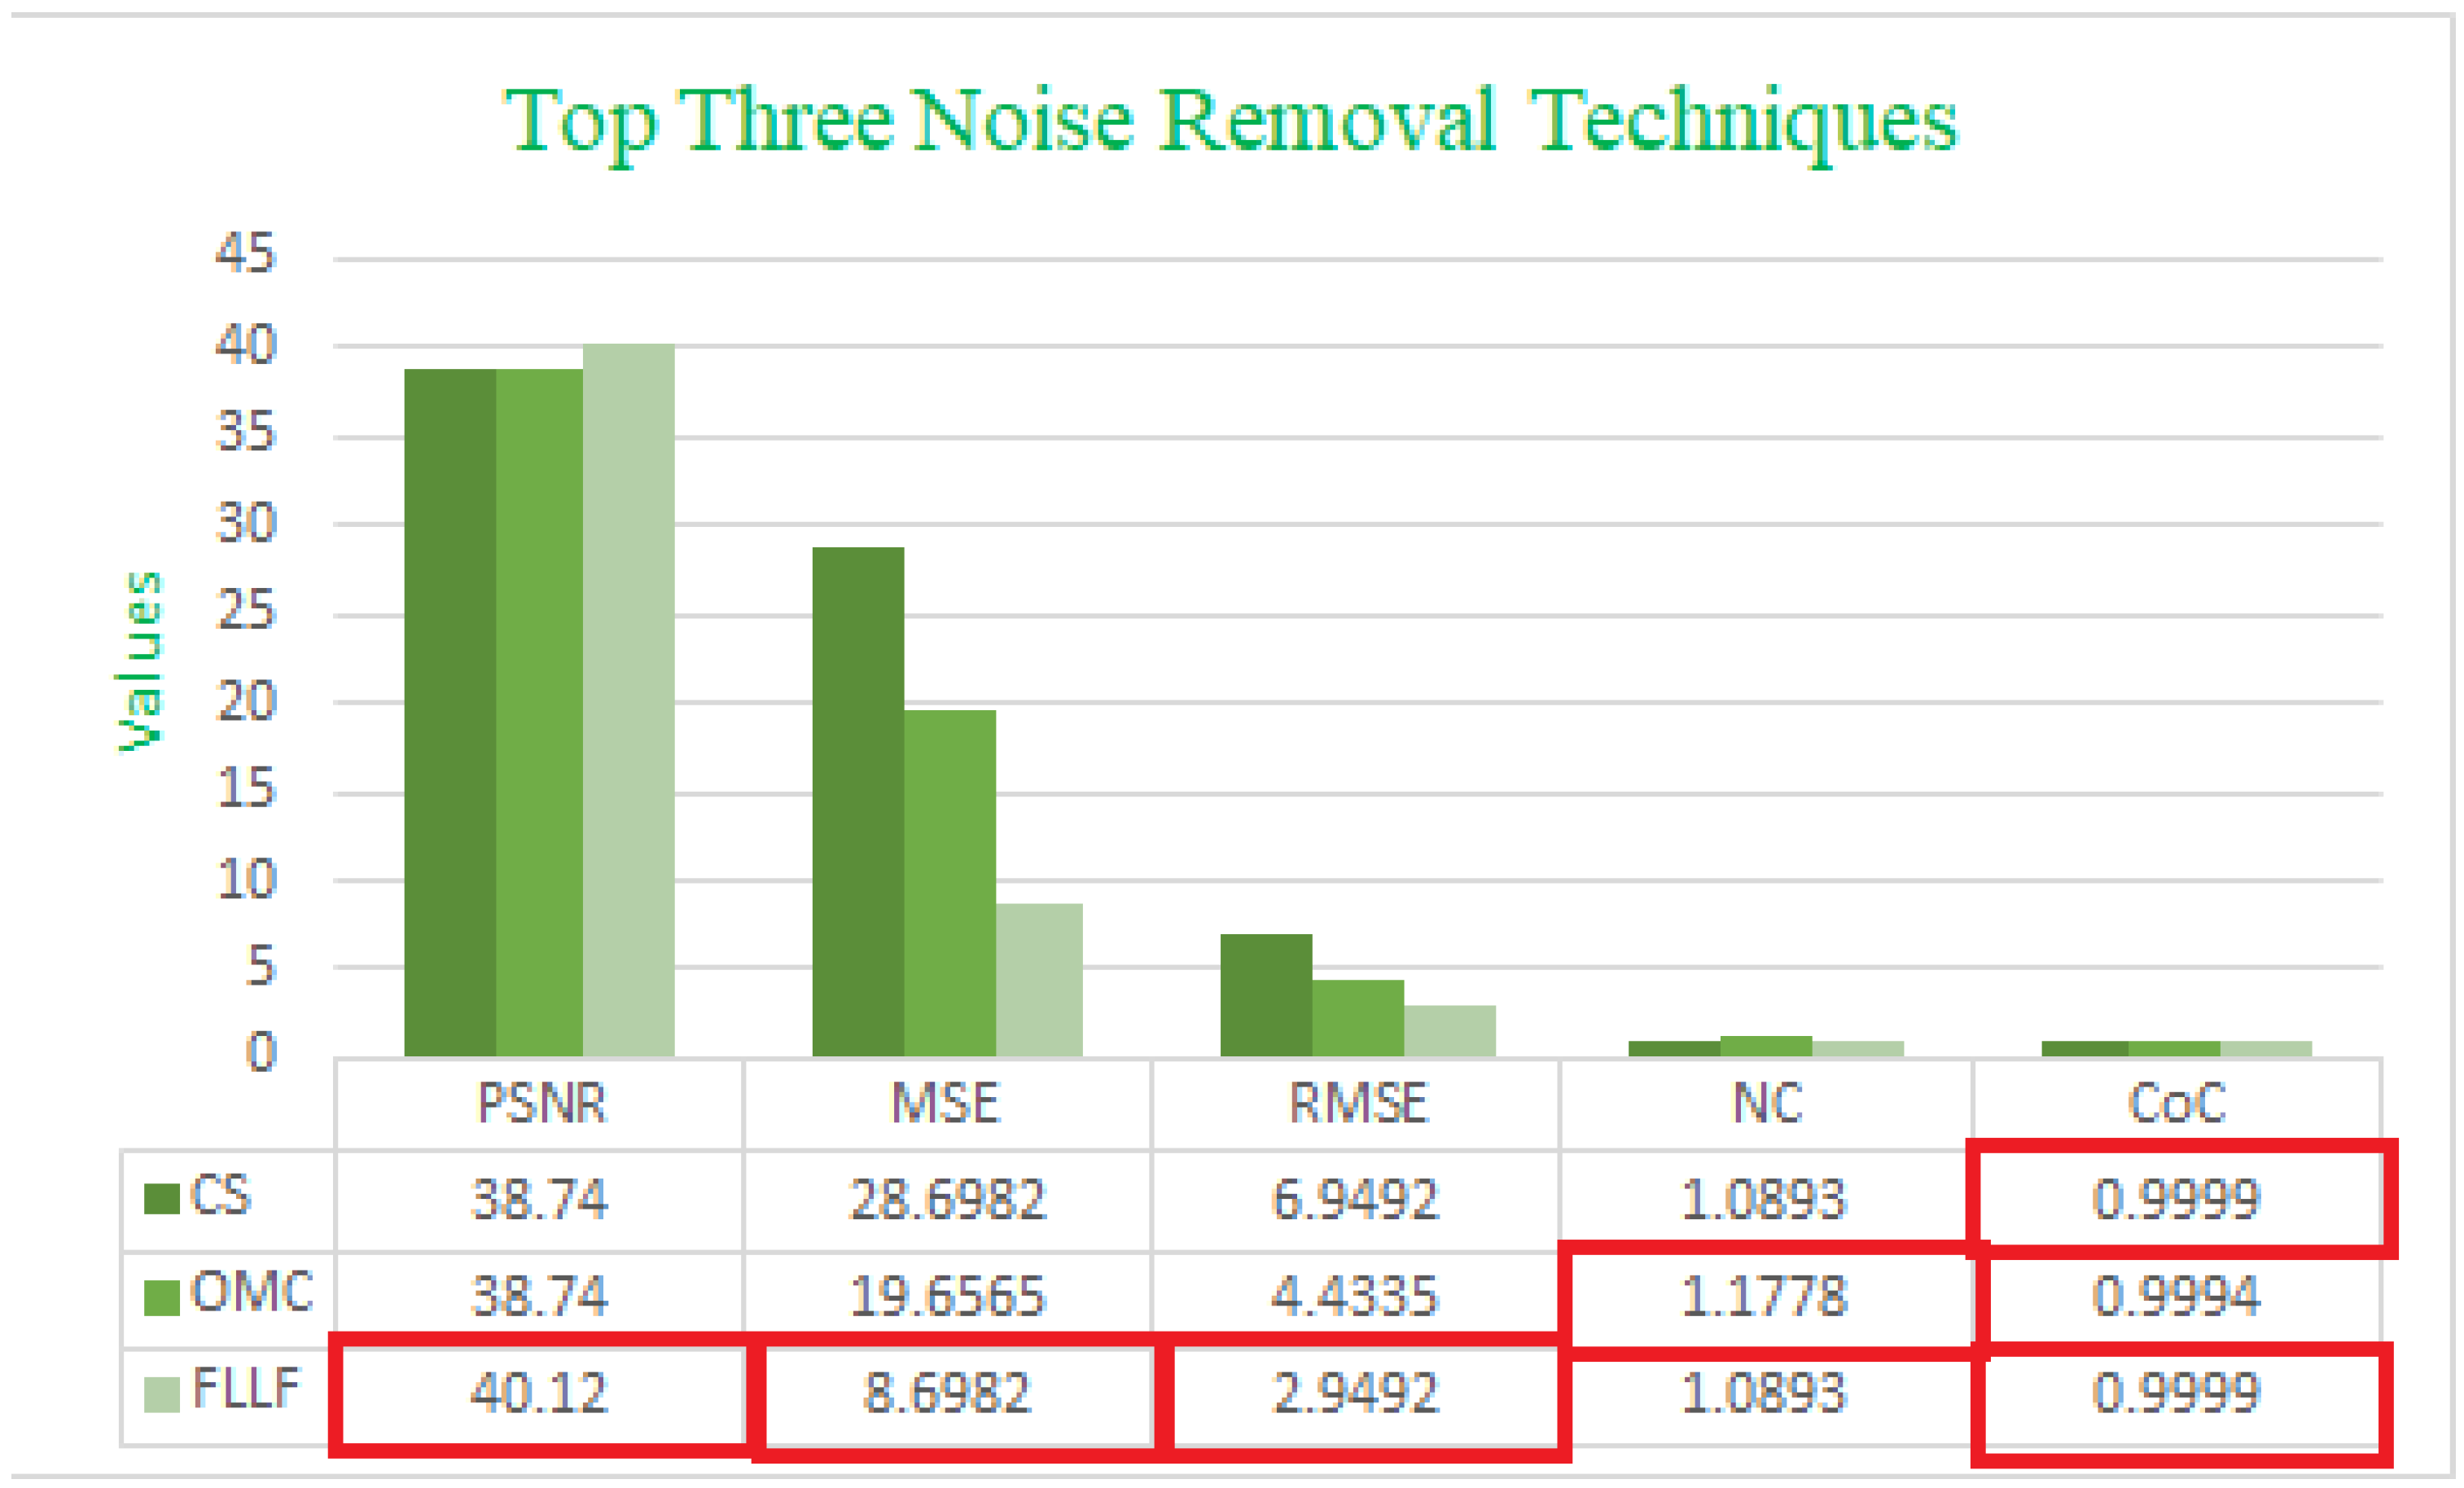
| Contrast Techniques | PSNR | MSE | RMSE | NC | CoC |
|---|---|---|---|---|---|
| Retinax | 27.84 | 19,574.1926 | 139.9078 | 1.0635 | 0.6025 |
| CS | 38.74 | 28.6982 | 6.9492 | 1.0893 | 0.9999 |
| GC | 28.49 | 951.7033 | 30.8496 | 1.0696 | 0.9920 |
| HE | 27.70 | 3311.7610 | 57.5479 | 1.0670 | 0.8954 |
| LBC | 27.40 | 4757.5027 | 68.9746 | 1.1396 | 0.9270 |
| LTHE | 28.11 | 342.0377 | 18.4942 | 1.1190 | 0.9570 |
| OMC | 38.74 | 19.6565 | 4.4335 | 1.1778 | 0.9994 |
| PLT | 27.35 | 280.9360 | 16.7611 | 1.0063 | 0.9957 |
| Sigmoid | 27.90 | 20,859.4069 | 144.4278 | 0.9840 | 0.6008 |
| AHE | 28.37 | 462.4049 | 21.5036 | 1.1114 | 0.9311 |
| BHE | 27.93 | 9313.0024 | 96.5038 | 1.1138 | 0.8288 |
| BBHE | 28.16 | 2071.5758 | 45.5145 | 1.1194 | 0.8842 |
| CLAHE | 28.37 | 462.4049 | 21.5036 | 1.1114 | 0.9311 |
| DSIHE | 27.80 | 4582.7375 | 67.6959 | 1.1626 | 0.8087 |
| GTHE | 27.70 | 3311.7610 | 57.5479 | 1.0670 | 0.8954 |
| LT | 27.13 | 2107.6280 | 45.9089 | 1.1695 | 0.9433 |
| MHE | 27.90 | 8906.9083 | 94.3764 | 1.1457 | 0.2114 |
| MSRCR | 27.86 | 16,128.0107 | 126.9961 | 1.0900 | 0.1889 |
| FLLF | 40.12 | 8.6982 | 2.9492 | 1.0893 | 0.9999 |
Disclaimer/Publisher’s Note: The statements, opinions and data contained in all publications are solely those of the individual author(s) and contributor(s) and not of MDPI and/or the editor(s). MDPI and/or the editor(s) disclaim responsibility for any injury to people or property resulting from any ideas, methods, instructions or products referred to in the content. |
© 2023 by the authors. Licensee MDPI, Basel, Switzerland. This article is an open access article distributed under the terms and conditions of the Creative Commons Attribution (CC BY) license (https://creativecommons.org/licenses/by/4.0/).
Share and Cite
Khan, S.S.; Khan, M.; Alharbi, Y. Fast Local Laplacian Filter Based on Modified Laplacian through Bilateral Filter for Coronary Angiography Medical Imaging Enhancement. Algorithms 2023, 16, 531. https://doi.org/10.3390/a16120531
Khan SS, Khan M, Alharbi Y. Fast Local Laplacian Filter Based on Modified Laplacian through Bilateral Filter for Coronary Angiography Medical Imaging Enhancement. Algorithms. 2023; 16(12):531. https://doi.org/10.3390/a16120531
Chicago/Turabian StyleKhan, Sarwar Shah, Muzammil Khan, and Yasser Alharbi. 2023. "Fast Local Laplacian Filter Based on Modified Laplacian through Bilateral Filter for Coronary Angiography Medical Imaging Enhancement" Algorithms 16, no. 12: 531. https://doi.org/10.3390/a16120531
APA StyleKhan, S. S., Khan, M., & Alharbi, Y. (2023). Fast Local Laplacian Filter Based on Modified Laplacian through Bilateral Filter for Coronary Angiography Medical Imaging Enhancement. Algorithms, 16(12), 531. https://doi.org/10.3390/a16120531