Article

Extending Process Discovery with Model Complexity Optimization and Cyclic States Identification: Application to Healthcare Processes

by
Liubov O. Elkhovskaya
1,
Alexander D. Kshenin
1,
Marina A. Balakhontceva
1,
Mikhail V. Ionov
2 and
Sergey V. Kovalchuk
1,*
1
Faculty of Digital Transformations, ITMO University, Saint Petersburg 197101, Russia
2
Research Laboratory for Arterial Hypertension Pathogenesis and Treatment, Almazov National Medical Research Center, Saint Petersburg 197341, Russia
*
Author to whom correspondence should be addressed.
Algorithms 2023, 16(1), 57; https://doi.org/10.3390/a16010057
Submission received: 12 November 2022 / Revised: 24 December 2022 / Accepted: 13 January 2023 / Published: 15 January 2023
(This article belongs to the Special Issue Machine Learning in Healthcare and Biomedical Application II)

Abstract

:
Within process mining, discovery techniques make it possible to construct business process models automatically from event logs. However, results often do not achieve a balance between model complexity and fitting accuracy, establishing a need for manual model adjusting. This paper presents an approach to process mining that provides semi-automatic support to model optimization based on the combined assessment of model complexity and fitness. To balance complexity and fitness, a model simplification approach is proposed, which abstracts the raw model at the desired granularity. Additionally, we introduce a concept of meta-states, a cycle collapsing in the model, which can potentially simplify the model and interpret it. We aim to demonstrate the capabilities of our technological solution using three datasets from different applications in the healthcare domain. These are remote monitoring processes for patients with arterial hypertension and workflows of healthcare workers during the COVID-19 pandemic. A case study also investigates the use of various complexity measures and different ways of solution application, providing insights on better practices in improving interpretability and complexity/fitness balance in process models.

1. Introduction

Process mining (PM) is a relatively new discipline that adopts a data-driven approach and a classical model-based process analysis. It is becoming popular because there is a demand for better insight into what happens within an organization. PM is a promising approach to reveal and analyse real processes existing in all companies today. There are three types of PM: process discovery, conformance checking, and process enhancement [1]. With discovery algorithms, one can automatically obtain a (business) process model from routinely recorded data, an event log. This type of PM is the research topic of most interest [2]. The results of process discovery techniques can be further used in conformance checking and enhancement. An a priori process model (retrieved from a log or elaborated “by hand”) is evaluated by its compliance with the data by conformance checking techniques, and its enhancement can be proposed after an analysis of process performance measures. In this study, we address a problem within process discovery. One of the main issues is constructing a model which would both be simple and reflect actual process behaviour. This often results in the trade-off between quality measures of a model [3]. Ideally, a process model should be understandable and interpretable for both analysts and common users and capture the principal way of process execution (if there is no mandate to find all possible realizations). The problem is most acute when dealing with complex and heterogeneous processes, making it possible to discover a so-called spaghetti-like process model [1].
Processes in the healthcare sector are highly variable and distributed because they are ad hoc and healthcare information systems are usually not process-aware [4]. That is why healthcare is the most researched application domain of process discovery techniques [2,5,6]. Moreover, healthcare organizations need to improve their processes to achieve high-quality care standards in a cost-effective way; therefore, they may benefit from PM solutions. The PM community, in turn, needs to generate a ‘unique value proposition’, providing actionable tools which are aware of domain-specific peculiarities and aimed at solving real-world problems [7]. For example, process model structuring often requires domain knowledge. So, an automatic interpretation and structure analysis of the model are necessary. While there are endeavours and some success in defining and standardizing interpretability in other modelling fields, complex processes with non-trivial domain interpretation are still challenging.
Taking into account the complex nature of real-world processes (where healthcare processes are considered as an example), we see multi-aspect problems in the optimization of process model structure and parameters. First, a certain balance between case coverage and interpretability of a process needs to be achieved, considering event logs which are often imperfect. Second, domain-specific (interpretable) states often span multiple events in event logs, causing implicit structures (loops, sub-processes) to be presented in a process model. Third, human interpretation as a frequent target of PM needs to reveal such structures and present them explicitly. In this paper, we propose an approach for model interpretability based on a meta-states concept and present a technology which extends a PM algorithm with semi-automatic support to model optimization for higher complexity control. We demonstrate our solution applicability within the healthcare domain, where processes are best suited for model comprehension enhancement and from which the idea of the concept originates. While we provide a case study example, we believe the approach is adaptable to other domains, and is broadly considered as an extension of the process discovery technique.

2. Related Works

2.1. What Are Complexity and Interpretability in PM?

In different system modeling domains, research and development are mainly aimed at a high accuracy of model fit, i.e., capturing dependencies in data, while interpretation receives little attention. It is believed that interpretation can increase model trust, which is particularly acute for black-box models, even though it may affect predictive accuracy. This sparked a new line in machine learning [8] and artificial intelligence [9], in which models can already learn complicated data patterns and make precise forecasts. However, there is no strict definition of interpretability. When it comes to the domain of PM, the interpretability of the process model is usually considered as human interpretation and understanding [10] or as semantic mapping of process models [11]. In both cases, the interpretation refers to domain knowledge containing implicitly in the operators’ expertise or explicitly in semantic knowledge bases (furtherly mentioned as “domain interpretation”).
When it comes to system insight, one can also reason about its complexity. Like interpretability, complexity is context-sensitive and can hardly be defined universally. There are many definitions and meanings of complex systems and complexity measures. The latter can be divided into two major classes: computational and system-related complexity measures [12]. Interpretability and complexity are closely related: a more straightforward description produced by the system tends to be better construed. On the other hand, higher complexity leads to lower interpretability. Such contradiction is observed in multiple research studying various measures in PM [10,13,14].
The comprehensive nature of a human or of a business process model can be influenced by many factors, ranging from personal characteristics to elements of Gestalt theory [15]. Such factors include process modelling notation and its features (visual expressiveness, semantic transparency, etc.), model size (number of elements, diameter), modularity and structuredness (use of constructions with split/join usually improves model understanding), decomposition (ways to hide unimportant information from the user, thereby improving the quality of the model), etc. Within PM studies, Mendling et al. [10] investigated aspects that may influence process model comprehension. The authors used questionnaires with several process models that were filled by students at three universities. The students were taking or had completed classes on PM and had different levels of subject knowledge. The study revealed that in addition to personal factors, model size is correlated to its comprehension. A similar result was obtained in another empirical study [16]: the larger the distance of a process structure tree, the more challenging the process behavior to perceive it. Statistical analysis also indicated that cognitive difficulty can be ranked when understanding different relationships between model elements. In [17], process model complexity was defined as the degree to which a process is difficult to analyze, understand, or explain. Model structure, therefore, can serve as strong evidence of its complexity. In PM, the complexity term is often associated with logical blocks, such as AND-, XOR-, OR-splits, and loops presented in the model. These split constructs can be evaluated and quantified using different measures, e.g., control-flow complexity [17], entropy-based uncertainty [18], and others [19]. Their sum is the overall architectural complexity or uncertainty. Other measures of complexity can be derived if one considers process models from the perspective of neighboring disciplines [20]. In this study, we look at a process model as a graph structure and exploit several network complexity measures to find an understandable and interpretable model.

2.2. Towards Process Model Optimization

To addressing the problem of an optimal process model, we intend to construct a model that is simultaneously simple for understanding and accurately captures process behaviours. Ideally, finding a balance between these quality components should be as automated as possible, and the simplicity of the model can be achieved through its elements’ abstraction/aggregation. Table 1 contains studies which reflect these issues to a different extent. Most of the papers are from the last 6 years, and several earlier works are presented as baselines. The proposed solutions are classified on the type of approach used and evaluated on the degree of its applicability to the aspect in question.
Log pre-processing is a good starting point for enhancing both process visualization and model precision. This category of model enhancing techniques is applied before the discovery directly retrieving log information. Suriadi et al. [21] demonstrate a systematic approach to event log preparation based on imperfection records patterns. Common quality issues compose such patterns. They are form-based event capture, unanchored event, inadvertent time travel, etc. The authors describe each pattern and show real-life cases, proposing possible solutions and potential limitations. For example, distorted labels, the most frequently observed pattern, negatively impact the readability and validity of process mining results, according to the questionnaire results. Activities that have the same semantics but do not match due to incorrect data entry or ununified recording systems should be treated as one. This could be done by letters capitalization agreement, similarity string search, or manual interventions (e.g., using a knowledge base [21] or rule base ontology [22]). More intelligent techniques, such as topic modelling [23] or conditional random fields [24], can facilitate moving from low-level to high-level events, aiding the comprehensibility of discovered process models. In [25], the authors propose an interval-based selection method to filter outliers, which are repeated events within the specified time period. Event outliers are defined based on the distribution of time intervals of consecutive events of the same activity. The time perspective regard has potential for the log pre-processing step; the proposed method has improved model precision without reducing its fitness. The opposite option, namely, mining repeated activities based on contextual information is proposed in [26]. The reason for mining duplicate tasks is enhancing model understandability and clarity, e.g., by its unbranching. These approaches only facilitate the discovery of a better-quality model but do not guarantee its optimization.
The second type of approach is to simplify process models during or after their discovery by behaviour filtering. These approaches are mostly implemented with manual methods. It is common to allow the user to inspect some threshold-fixed model first and then adjust its parameters manually. The Fuzzy [27] and Skip [28] miners are prime examples of the discovery algorithms adopting this strategy. This technique is commonly used in discovery algorithms whose output is a directly follows model to reduce its complexity through abstraction and aggregation [30]. Fodina [26] and BPMN Miner [29] also incorporate dependency information; for example, Heuristics Miner [49] filters infrequent activities and arcs and deals with split/join constructions and binary conflicts. Additionally, the authors [29] utilize both originator and control-flow perspectives in the discovery of group activities in swim lanes, which can be collapsed for more abstraction. Self-loops and short loops can cause problems while analysing concurrency relations between tasks. This can affect not only the correctness of the discovery, but also model complexity. Approaches which deal with such structures are proposed in [32,33]. The proposed algorithms are also able to produce simple models while balancing fitness and precision. In [34], the authors addressed the issue of mixed-paradigm process mining, which aims to discover a precise and comprehensible process model at the same time. They introduced Fusion Miner and proposed a new metric called activity entropy. Activity entropy captures activities connected with most other activities, i.e., identifies weak dependencies. This way, considering behavior types that an event log contains, one can change an input parameter of the miner to achieve the balance between procedural and declarative constructs in a model. The approaches described above address both optimization and abstraction issues of process discovery, but with manual methods. They usually require many parameter configurations with several trials to adjust a model to the desired level of granularity.
Since the number of model elements influences its comprehensibility, reducing the variety of events is necessary. For example, collateral events, which are multiple events referring to one process step, may noise the data, and they need to be aggregated [21]. The time perspective should be regarded to merge activities occurring together within a specified time period. The same applies to events captured by the form and affected by the same timestamps, such as a set of patient blood tests. The relation of two subsequent events can be measured by correlation metrics. Correlation may be determined with respect to the timeframe within which events occur one after another, originator or activity names similarity, and data perspectives. The approach proposed in [27] groups highly correlated and less-significant nodes into clusters, therefore abstracting them into one logical or high-level activity. A discovery technique proposed in [31] captures data hierarchies, which are present in software systems. Within these systems, logged execution calls or code architecture itself can be utilized in the designed hierarchy. The hierarchy can be reflected in the model at different levels of depth, i.e., having its parts hidden or unfolded interactively by the user, therefore simplifying or complicating the discovered model. The technique with different heuristics is evaluated on the examples of software event logs; it has overall positive impact on the model quality. The hierarchy can also be seen in healthcare events represented as ICD-10 codes [35]. Aggregation as a post-processing step is demonstrated in [36]. Here, the authors merge similar behaviour after an alternative using folding equivalence. This typically generalizes the behaviour of the net and reduces its complexity. So, aggregation techniques are good options to abstract a process model and possibly simplify it at the price of losing some information.
Unsupervised learning has found uses in different tasks and fields including PM. It is common for trace clustering to be applied in a discovery step. In this regard, the event log is divided into sub-logs to produce more accurate process models for each cluster. However, the clustering techniques need a robust similarity metric [37]. They also should incorporate PM quality measures since data mining criteria only assume the improvement of discovery results. Thus, the authors in [38] propose a semi-supervised method with a selection step for a greedy accuracy optimization for each cluster. Despite the high computational complexity, the novel approach performed better than MRA-based clustering in terms of accuracy. A “slice-mine-dice” technique is proposed in [39] to cluster traces reaching the specified complexity threshold. The results showed improvement in the number of clusters and process model cumulative size in comparison to three existing trace clustering methods. Contextual information is utilized in [40] in a modified k-medoids clustering algorithm. Standard process is assumed to be more frequent and stable in a time perspective. So, occurrence frequencies and overall cycle times are included to support grouping of similar process variants. Using the first k most frequent processes as medoids has improved the clustering quality in several heterogeneous cases. However, identifying the proper value for k is still an open issue. In [41], the coefficient of variation is used to determine the number of clusters of clinical pathways represented as state (department in a hospital) sequences. The clusters with an insufficient number of sequences were discarded before the discovery, where identification of typical pathways is based on an alignment algorithm from bioinformatics. Clustering can be performed not only for traces but for events, too. A two-level clustering approach is proposed in [42] to categorize complex events first and to group obtained processes after, as well as to distill clinical pathways in real cases. Such approaches aid the abstraction of undesired details and, therefore, simplify models, but mostly in an uncontrolled manner.
The automated control of finding a simple and/or precise process model can be explicitly defined as an optimization problem. For example, Camargo et al. [44] optimized the accuracy of a business process simulation model discovered by the Split Miner. They searched for optimal hyper-parameters of the miner to maximize the accuracy measured using a timed string-edit distance between the original and the one simulated by the model event logs. However, there is always the trade-off between several quality dimensions [3], where the most common one is between model complexity and its fitness/precision. Within integer linear programming, the authors in [35] define the process model optimization problem mathematically, where a linear constraint is a complexity threshold (a maximum number of nodes and arcs) and a replayability score aimed to be maximized. They solve the optimization task with a tabu search algorithm utilizing element frequencies to quickly identify promising moves. The approach outperforms commercial tool results in terms of replayability for small and middle complexity (from 1 to 50 nodes). A similar problem is formulated in [45] but including time-related information in the replayability score of discovered grid process models. The tabu search with optimized edges is shown to be more efficient than other methods for a small event diversity. In [46], rule discovery hybrid particle swarm optimization is proposed to find near-optimal process models. Here, the simulated annealing is applied on each particle position when it is updated. Additionally, the authors apply rule discovery to obtain the top particles which meet the criteria and, therefore, formulate an optimization problem. The proposed method has the best results in terms of average fitness and number of iterations in comparison with a classical particle swarm optimization method and a hybrid one. It also has the potential to obtain the higher comprehensibility performance due to a rule discovery task. A multi-objective optimization via Pareto optimality is addressed in [47]. The reason for a Pareto front is that the quality dimensions are mutually non-dominating, and the user can choose the desired trade-off visually (for three dimensions and less). In [48], the authors propose a modified genetic algorithm for process discovery, called ProDiGen. It deploys a hierarchical fitness function to evaluate individuals in a population. The fitness function incorporates both completeness, precision, and simplicity of a mined model. ProDiGen correctly mined the original models in most cases; the obtained models are simple, complete, and precise. It has a better performance than other PM algorithms and has computational times comparable to Genetic miner’s [50] for balanced and unbalanced logs with different workflow patterns and levels of noise. We believe, therefore, that objectives clearly formulated as an optimization task are the best option to automate and control the discovery step.

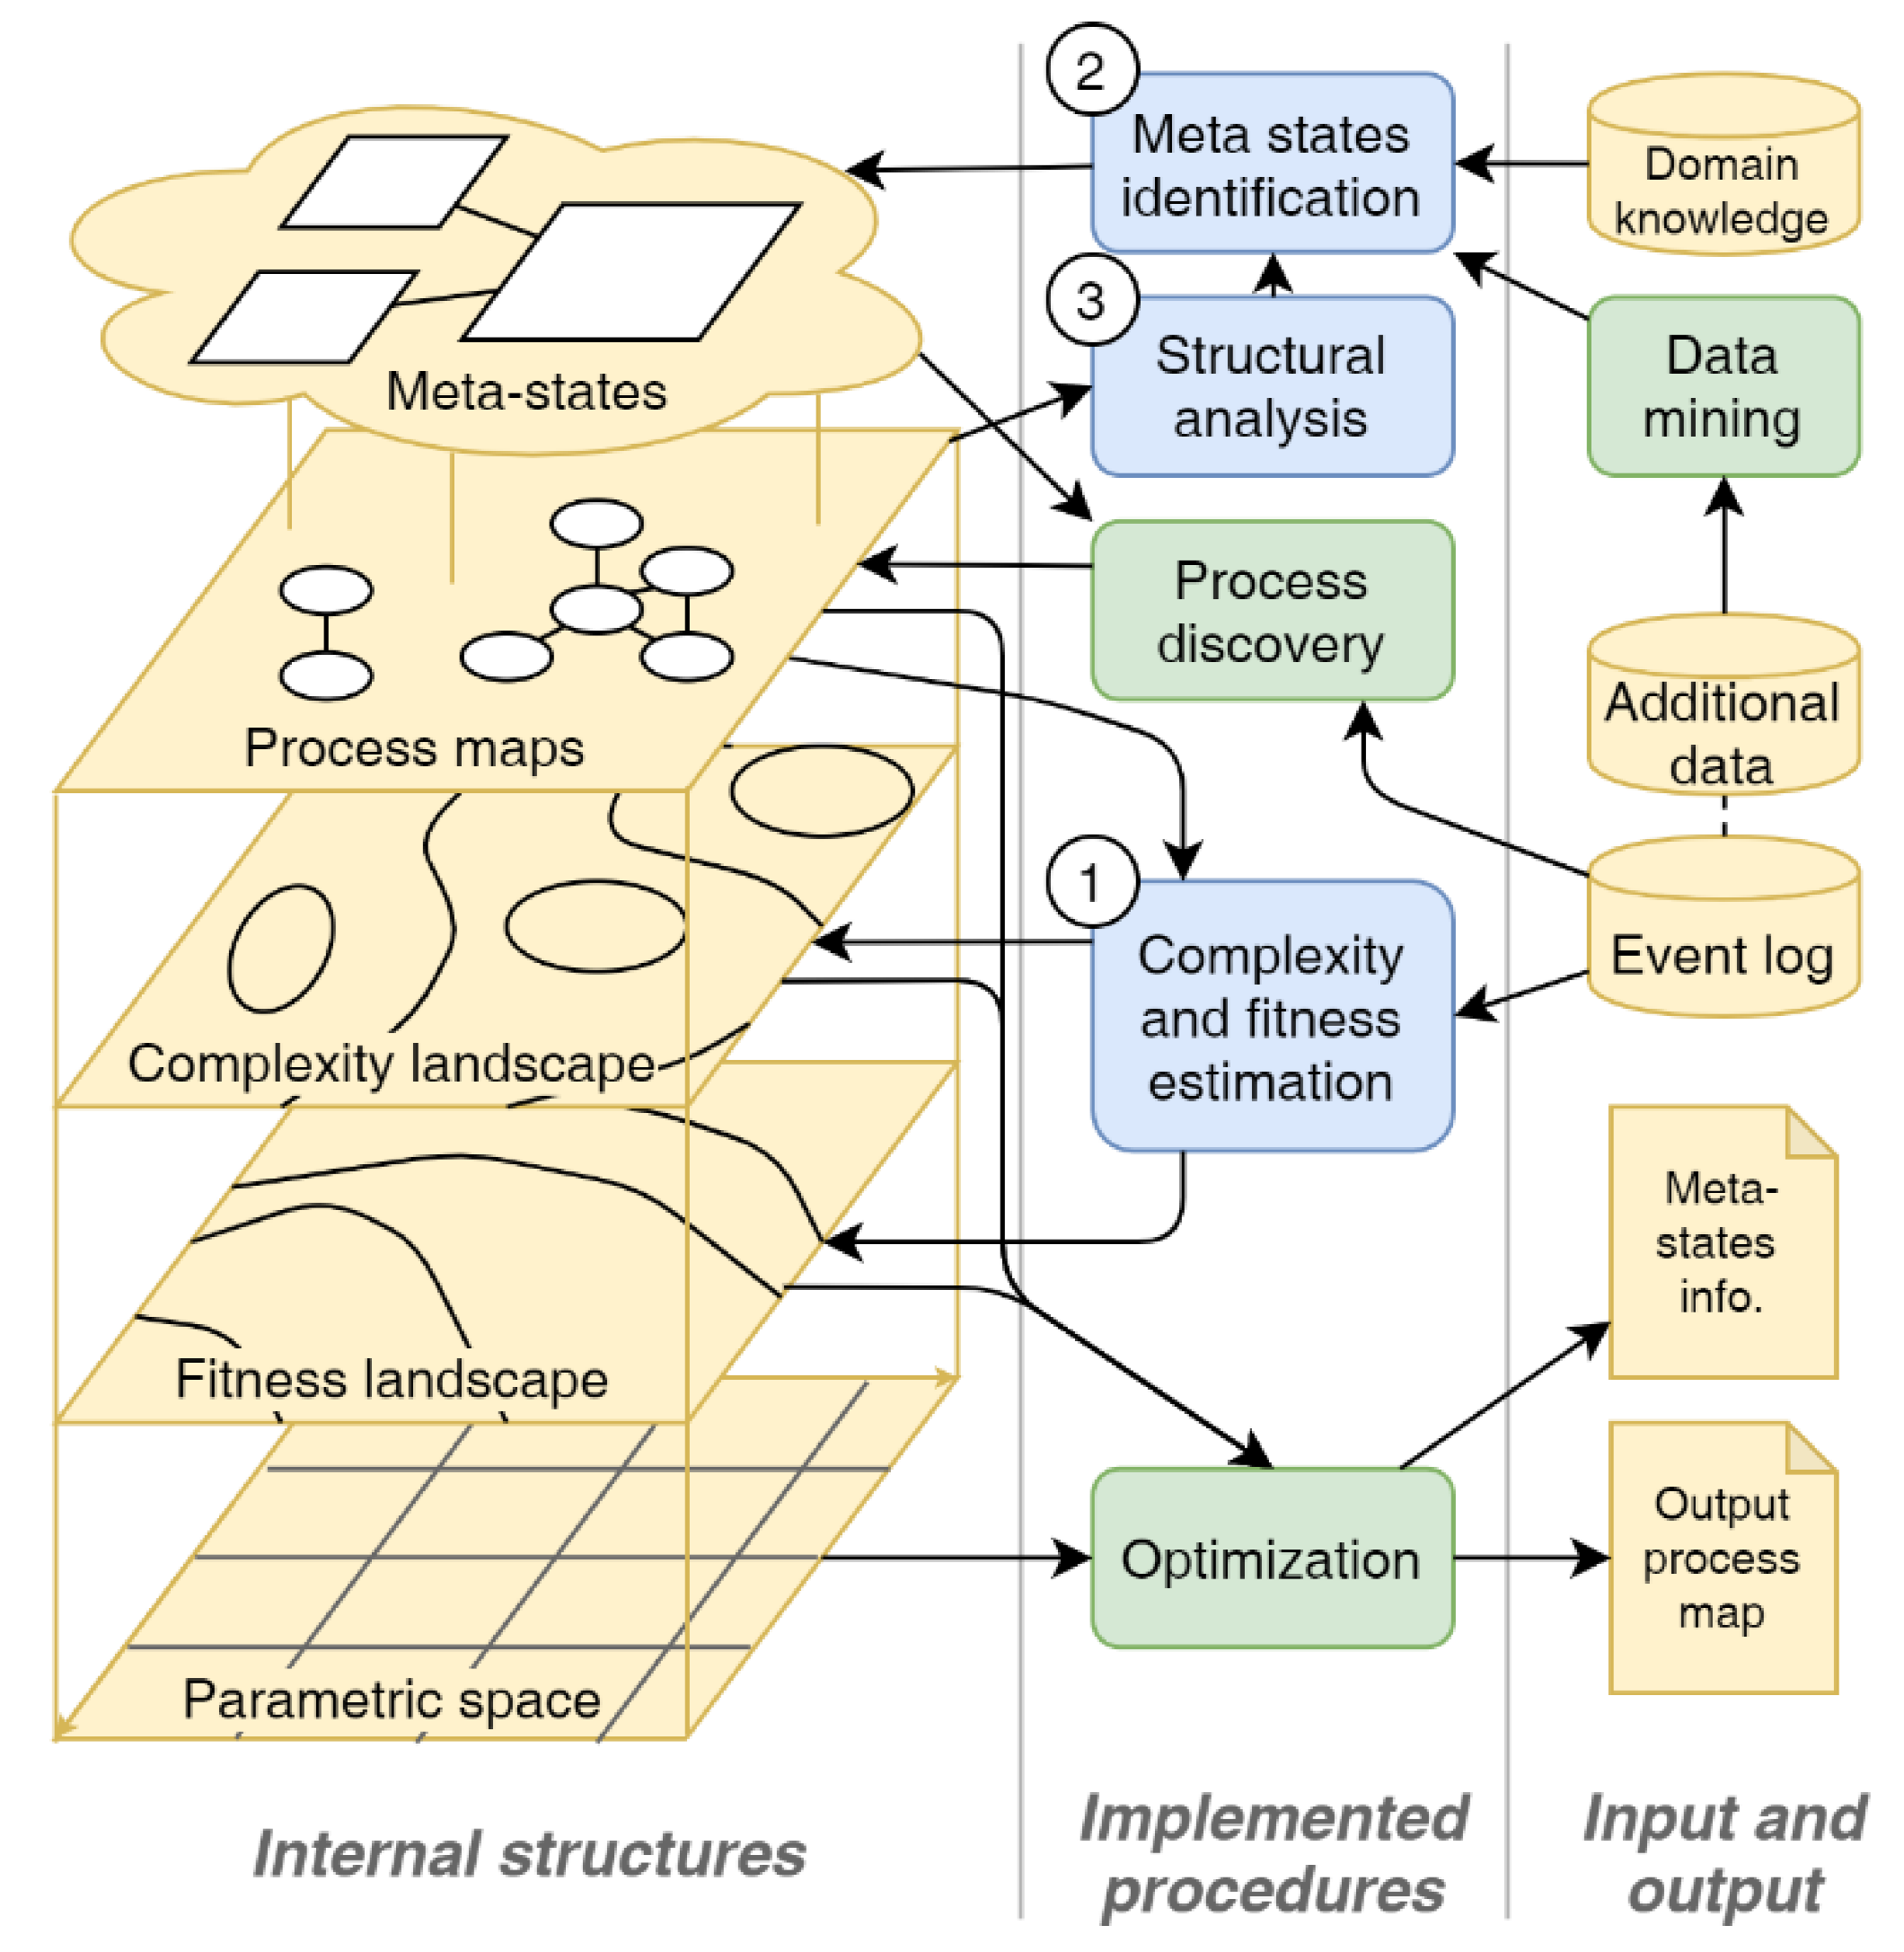
3. Conceptual Approach

3.1. Basic Idea

The proposed approach is based on the extension of PM techniques with several procedures, which are illustrated in Figure 1 and discussed in further detail in this section. Process discovery is followed by complexity and fitness estimation procedures (“1” in Figure 1). The complexity level is estimated using structural and representative characteristics of the identified process model. The value of fitness is estimated through a comparison of event log coverage with a particular process model.
The estimated values are used to perform optimization within a parametric space for a process identification algorithm. In general, the optimization problem is a multi-objective problem where objectives contradict each other in most cases, and higher complexity corresponds to better fitness.
To introduce higher-level interpretable states, we propose the procedures for meta-state identification. The meta-states identification (“2” in Figure 1) has various sources of knowledge available for use during the identification problem. The primary source is a structural analysis of process maps (“3” in Figure 1) with the identification of cyclic states, which are often collapsible to a single meta-state. Second, we can exploit the data available in event logs (event attributes, case parameters, etc.) to identify states of the process. Usually, the data can be analyzed using data mining techniques. Finally, domain knowledge can be applied as well to introduce information on states specific to a particular process or system where the process evolves.
The meta-states identification could be used extensively for analysis and interpretation of a process model. However, within the presented work, we are focused on the explicit introduction of meta-states into the process model to bring more expressive power with lower model complexity.

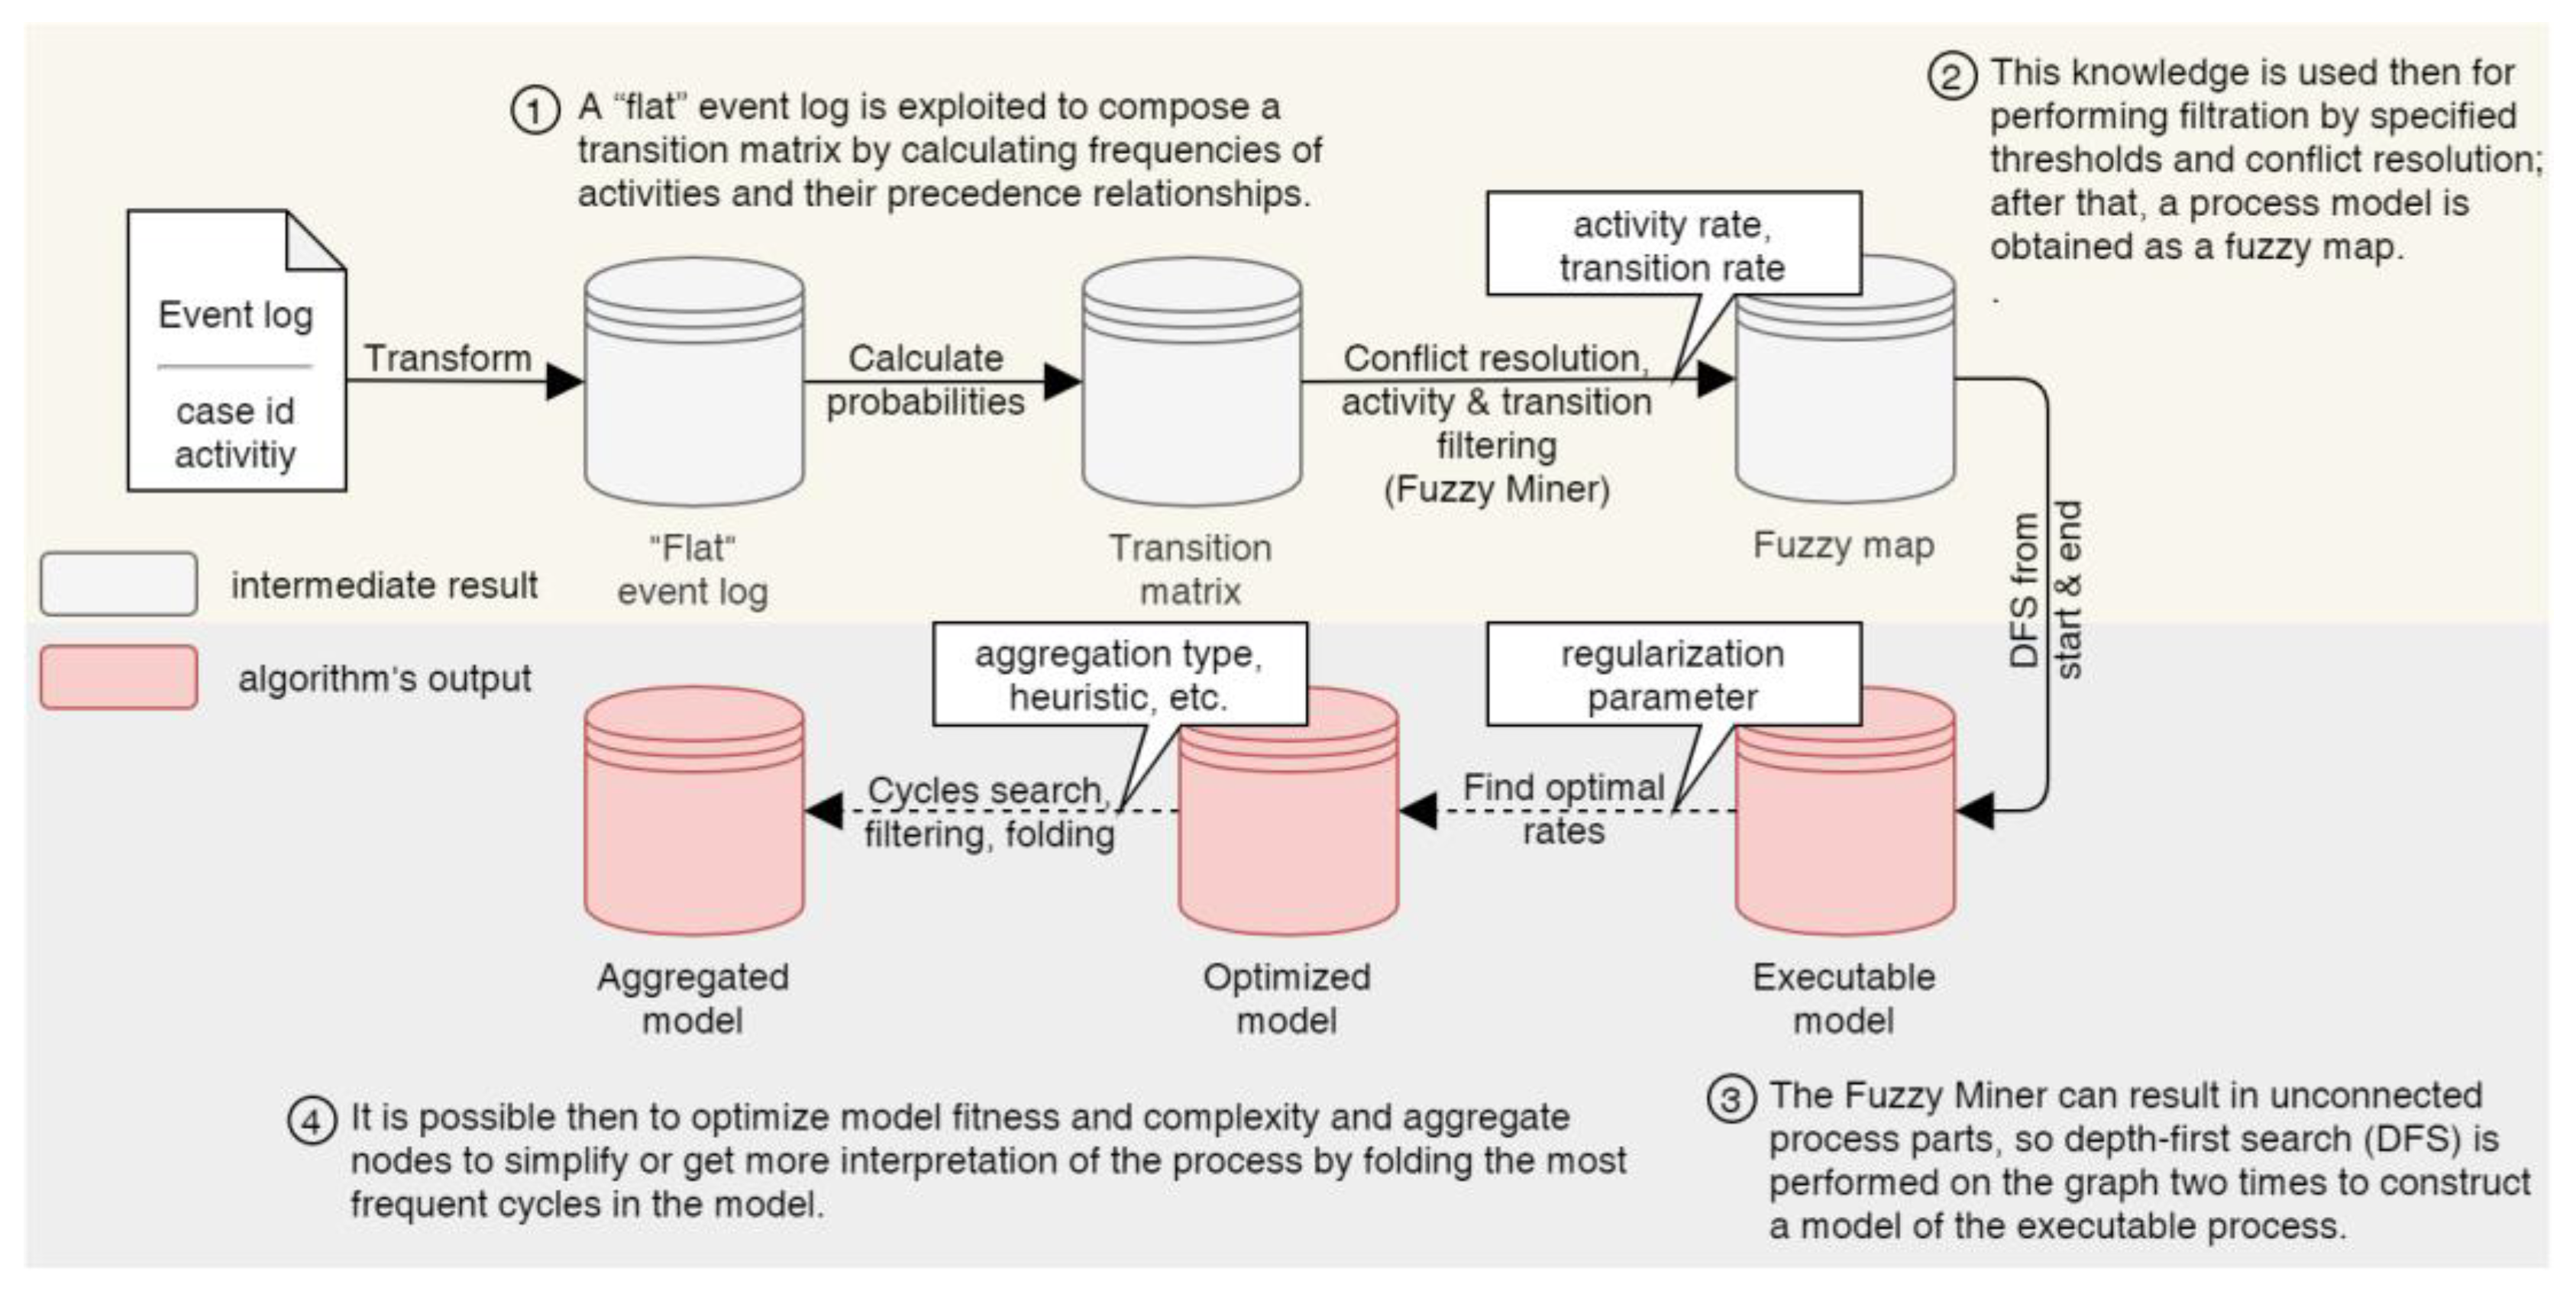
3.2. Process Discovery Algorithm

In this subsection, we introduce an extended algorithm for process model discovery. First, it is necessary to provide basic definitions and an overview of the task. Every process-aware information system that records run-time behavior has an event log. An event log is a file that contains information about process execution. Each record is an event with associated data: a timestamp of its start and completion, an activity and resource that executes this activity, and a process case id (instance) the record belongs to. They are the minimal items for compiling a log. However, if activities are considered to be atomic, i.e., have no duration, the last item is only needed for defining the order of activities and can be skipped if we know a priori that data are stored according to a timeline. We group an ordered set of events only containing activity names into cases that represent single process runs. This “flat” event log is used as an input for process mining in our discovery algorithm.
While an event log is an input, the algorithm’s output is a (business) process model, or a process map. In our case, a process model represents a formal graphical description of the actual process flow, i.e., the precedence of events, where nodes are activities, and edges are ordered relationships between them. In Figure 2, we provide a scheme of the solution for obtaining such a result, where dashed arrows are optional discovery steps, and main parameters are listed in callouts.
The next section presents the precise details of the proposed algorithm implementation. Steps 1–3 are the basics of the algorithm’s workflow and described in the following Section 4.1. Within step four, we define an optimization problem in Section 4.2 and propose an approach to model abstraction by folding significant cycles in Section 4.3.

4. Implementation of the Extended Algorithm

4.1. Model Discovery

The proposed algorithm for discovering process models includes the basics of the Fuzzy Miner [27], which, in turn, originates from one of the first discovery techniques by Markov. The main idea is to use the Markov theory of discrete random processes to find the most probable transitions between events. The fundamental metric is significance, which can be determined for event classes (i.e., activities) and binary precedence relations over them (i.e., transitions). Significance is the absolute or case frequency of activities or transitions that occur in the event flow. It measures the relative importance of the behavior; events or precedence relations that are observed more frequently are deemed more significant. We use case frequency in conflict resolution, when two events may follow each other in any order in the event log, and process simplification, i.e., activity and transition filtering, and absolute frequency for statistics visualization.
The algorithm constructs a directly follows graph (DFG) such as a finite state automaton, but with activities represented in nodes rather than in edges, i.e., Fuzzy map. Although this representation has known limitations [51,52], it is more intuitive and understandable and can be easily transformed into other notations such as BPMN [32] or Petri Net [53]. Within the used visual notation, the green node (“start”) indicates the beginning of the process and shows the total number of cases presented in the log, and the red node (“end”) is related to a terminal state. The graph’s internal nodes and edges show the absolute frequencies of events and transitions, respectively: the more value, the darker or thicker the element.
However, fuzzy logic does not guarantee a reachable graph (see example in Figure 3), which is desired to see the complete behaviors of process traces. So, we modify model construction by performing the depth-first search (DFS) to check whether each node of the DFG is a descendant of the initial state (“start”) and a predecessor of the terminal state (“end”). If the model does not match these conditions, we add edges with respect to their significance to the model until we obtain a reachable graph. This way, we overcome the possibility of discovering an unsound model (without the option to complete the process). Despite other DFG limitations [52], it permits cycles, which are crucial in our concept of meta-states, and is suitable for unstructured and complex processes, which exist in healthcare, due to constructing models with different levels of details.
We show an example of a process model obtained by the proposed algorithm, adjusted manually, and resulting in 100% and 5% of activity and transition rates, respectively, in Figure 4. It means that only activities and transitions with significance more than or equal to 0.0 and 0.95, respectively, are included in the model. In other words, we aim to see only the main paths with all event variations. We attribute rates to the model as r a / r t , where r a is an activity rate, and r t is a transition rate. The process model was discovered from the event data of a remote monitoring program for patients suffering from hypertension. More details about this and other datasets and process models for these event logs are given in Section 6.

4.2. Model Optimization

In initial uses of an algorithm, one can change process model detail by tuning activity and transition rates and move from the simplest model to complex and complete one. However, it is preferable to obtain a model automatically when it comes to the tool’s adaptiveness and massive processing. Therefore, we attempted to apply machine learning formalization in PM and defined the problem of discovering an optimal process model automatically.
Let p be the algorithm for discovering a process model from an event log. The set of traces L = i = 1 N σ i is an event log, where σ i = e 1 ,   e 2 , ,   e k i is the i -th process execution instance (trace) of the length k i , and σ i ( j ) = e j is an event from the set of events X , which the log can contain, and the log size, therefore, is l = i = 1 N k i . An event can be defined as a set of attributes (activity type, resource type, time stamp, etc.), but here and further we imply an atomic event log, i.e., each event is an activity. We also assume that activities within a trace are ordered by the time registering in a system. Let p ( L , θ ¯ ) = M = V ,   E ,   v s t a r t , v e n d ,   s i g be a process model, which is a DFG, discovered by the algorithm p with parameters θ ¯ = ( θ 1 , θ 2 ) , activity and transition rates, respectively, from the event log L , where:
  • V X is a set of nodes, | V | = n ;
  • E V × V is a set of edges, | E | = m ;
  • v s t a r t is a “start” (initial) node;
  • v e n d is an “end” (terminal) node;
  • s i g : X ( X × X ) ( 0 ,   1 ] is an activity and transition significance defined as case frequency, a fraction of traces that contain an activity or transition:
s i g ( x ) = j = 1 k 1 σ j ( x ) k
for an element x , where 1 σ ( x ) is an indicator function that equals 1 if an element x is contained in a trace σ and equals 0 otherwise. For an activity, it is defined as follows:
1 σ ( x ) = { 1 ,   i = 1 , n ¯ :   x = σ ( i ) , 0 ,   otherwise ;
and in case of transition:
1 σ ( x ) = { 1 ,   i = 1 , n 1 ¯ :   x = σ ( i ) ,   σ ( i + 1 ) , 0 ,   otherwise ;
Let P = { p ( L , θ ¯ ) | θ ¯ Θ } be the process model space, where Θ is a domain of the algorithm parameters. Here, we consider θ ¯ = r a , r t . Thus, Θ = [ 0 ; 100 ] × [ 0 ; 100 ] . One needs to find an algorithm p P (more precisely its parameters) that maximizes Q on L :
Q ( p , L ) = ( 1 λ ) F + λ ( 1 C J ) max θ ¯ ,
where
F = 1 | L | σ L ( 1 | σ | i = 1 | σ | z i , n α δ ( σ , s * ) β ϕ ( M , σ , s * ) n ) +
z i , n is a binary variable equal to 1, if event i is represented by node n , ϕ is the number of forced transitions, δ is the event skipping indicator, and s * is the subtrace of all events represented by the process model M [35],
C J = J ( p ( L ,   θ ¯ ) ) J ( p ( L ,   θ 100 ¯ ) )
J ( p ( L ,   θ ¯ ) ) = m n
and E 0 :   p ( L ,   θ 0 ¯ ) = V 0 ,   E 0 ,   v s t a r t ,   v e n d ,   s i g , θ 0 ¯ = ( 0 ,   0 ) ; θ 100 ¯ = ( 100 ,   100 ) .
In the optimization problem (4), an objective function includes fitness (5) and complexity (6) terms where λ is the regularization parameter to weight them. Thus, one can discover a process model optimized in one of these senses or both.
The representativeness of a process model regarding a log is measured by the replayability [35,45], also called fitness or fidelity. This metric works fine with flexible logs with highly diverse and complex behaviors of the traces. It also overcomes DFG issues with alignments. Replayability is directly related to model complexity (6) and (7): a model with higher complexity allows for more traces and therefore higher replayability, making these measures contradictory objectives. A remarkable feature of replayability (5) is that it is scaled to be a number in [0, 1]. So, it can be combined with the scaled complexity term (6) in one objective function (4). Here and after, we assume α = 0.5 N 1 and β = N 1 , where N is defined as the number of unique activities in the log.
A complexity function could be performed as one of the network complexity measures [54,55,56]. In this study, we compare different measures, one of which is the Shannon entropy. Entropy can be measured across various network invariants [55]. For the current study, we chose a flattened adjacency matrix as a random variable X with two possible outcomes (0 or 1) to measure the Shannon entropy H ( X ) :
J :   H ( X ) = i = 1 n p ( x i ) log a p ( x i )
Alternatively, we have introduced several structural complexity measures as follows:
J :   K n = m n ( n 1 )
J :   R = 1 2 ( m M + n N )
where N and M are the numbers of unique activities and transitions in the log, and n and m are the numbers of the activities and (unique) transitions presented in the model, respectively. The above measures, therefore, explain how many elements were displayed in the model among theoretical or possible ones. They can also specify model complexity. However, it may penalize model a lot and shorten process behavior. So, we currently chose a simple graph measure, an average degree. In a directed graph, it is just the number of edges divided by the number of nodes:
J :   A D = m n
This measure is well suited to our aims: we want to reduce the number of transitions and conserve only the significant ones, while lengthening paths through the model by keeping more activities. This way, one may achieve a more transparent, less confusing, and consistent process model. In Section 5, we present an experiment on complexity optimization with different measures and show examples of process models automatically discovered with this approach.

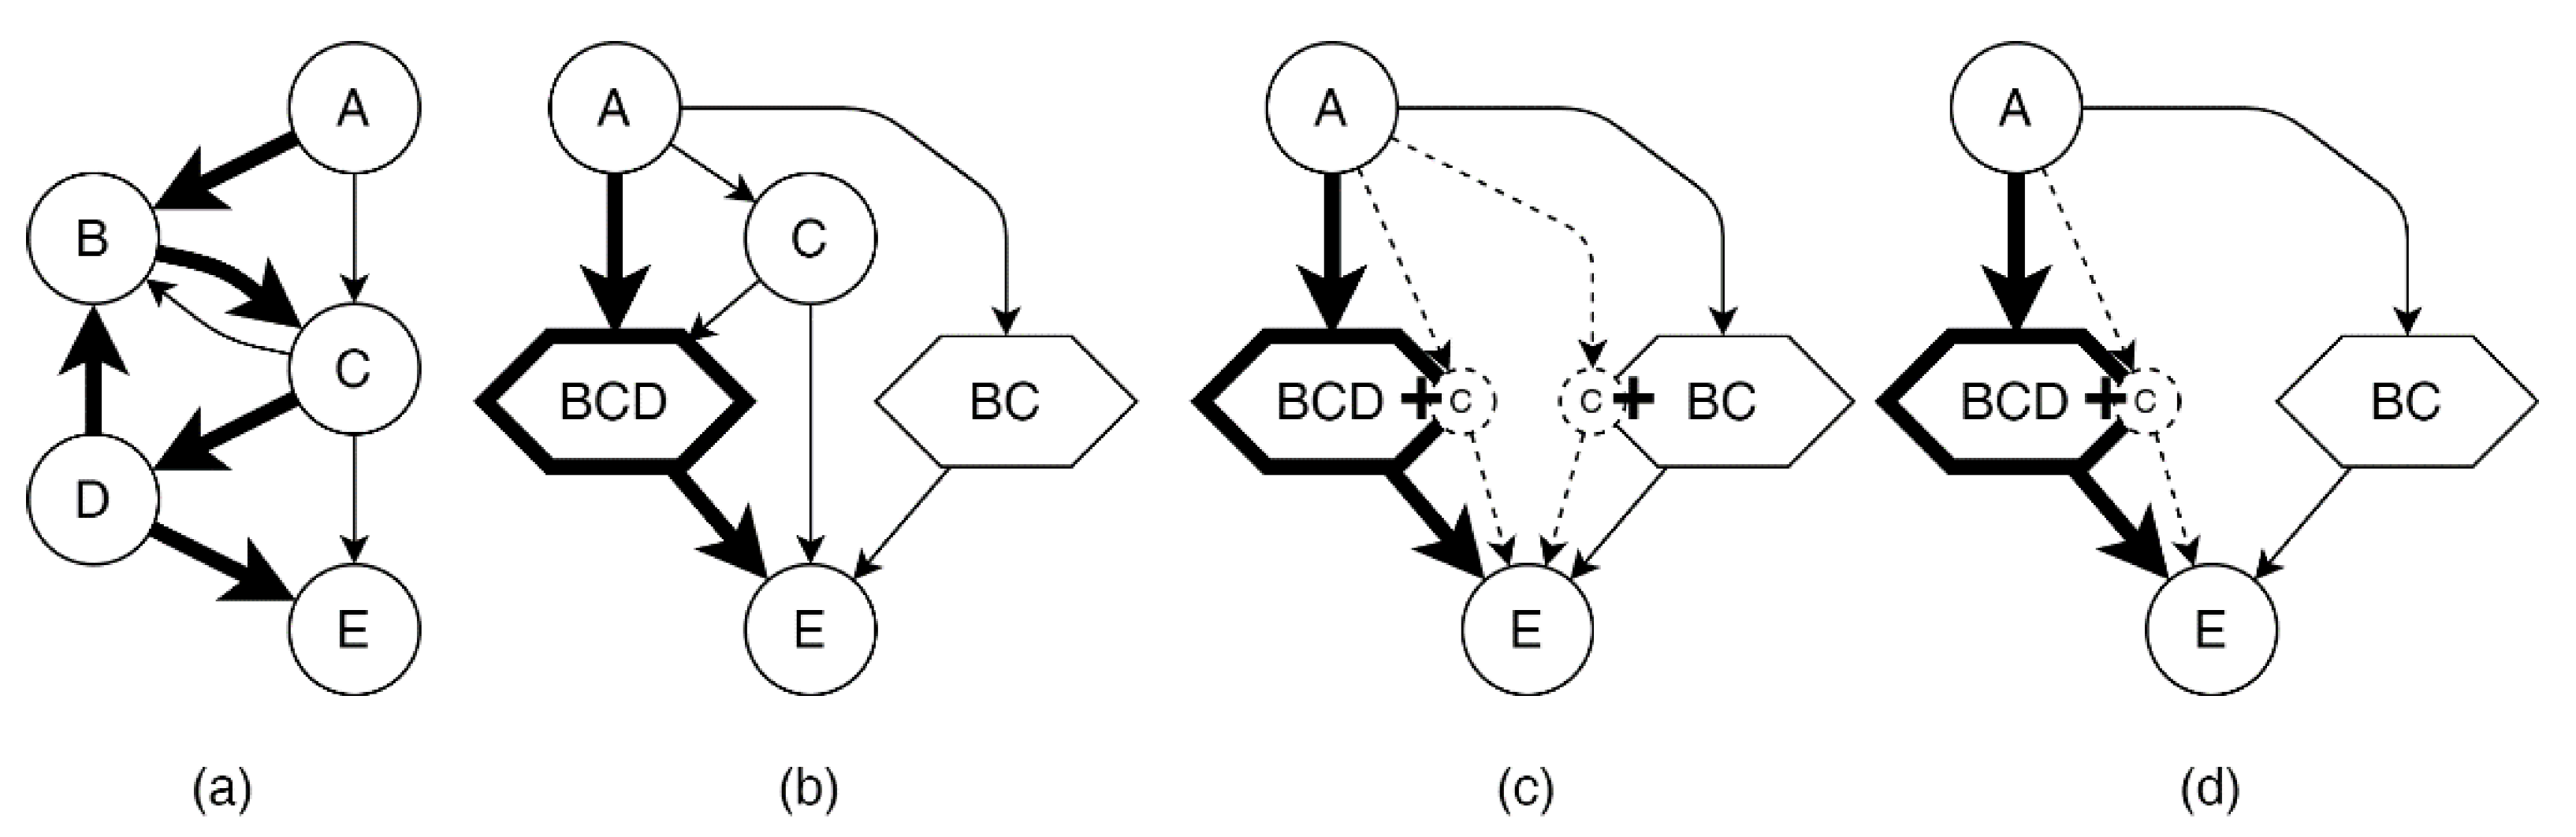
4.3. Discovering Meta-States

In this subsection, we introduce an approach for process model abstraction and simplification. Simplification of the process models can be done not only by node and edge filtering, but also by event aggregation. In [27], the authors proposed such model abstraction by iteratively aggregating highly correlated (in the context sense) but less significant nodes. However, in some fields, e.g., healthcare, it makes sense to propose a different method of abstraction. It is very likely that cycles present in the model, and this can signify distinct process parts from the perspective of for whom the process is performed. In healthcare, the cycles may represent routine procedures or repeated medical events for patients, i.e., an objective being in some stage of process execution or a “meta-state”. We clarify how meta-states are identified in an event log via pseudocode below (Algorithm 1). We assume a simple cycle to be a meta-state if the probability of its occurrence in the log exceeds a specified threshold, i.e., a cycle significance, as in the case of activities and their corresponding relations filtration (see Algorithm 2). One can obtain new knowledge about process execution by distinguishing the most significant cyclic behavior and exceptions.
Algorithm 1 Searching cycles and counting their frequencies in an event log.
procedure  CyclesSearch ( Log )
Input:    “Flat” event log Log composed of process cases
Output:    Set of (simple) cycles c ycles found in event log Log , Absolute abs [ c ] and
      case cse [ c ] frequencies of each cycle c c ycles
cycles     [   ]
k     0
for all cases t Log  do
   for all unique activities n t  do
       case _ cycles     [   ]
       i     0
       j     0
      while  i   <   length of t  do
         if  t [ i ] = n  then
             case _ cycles [ j ]     i // Positions of activity n in case t
             j     j + 1
         end if
          i     i + 1
      end while
       i     0
      while  i + 1 <   length of case _ cycles  do
          c     t [ from   case _ cycles [ i ]   to   case _ cycles [ i + 1 ] 1 ]   // Part of case t that starts and
                                           ends with activity n
         if length of c = number of unique activities a c then
            if c Cycles  then
                cycles [ k ]     c
                abs [ c ]     0
                cse [ c ]     0
               kk + 1
            end if
             abs [ c ]     abs [ c ] + 1
             cse [ c ]     cse [ c ] + 1 // if c was not found earlier within a case t
         end if
      end while
   end for
end for
end procedure
Algorithm 2 Identification of significant cycles (meta-states) in an event log.
procedure  FindStates ( Cycles ,   CycleFrequencies ,   NumberOfCases ,   MetaStateSignificance )
Input: Set of (simple) cycles Cycles found in a process model by DFS;
   Case cse [ c ] CycleFrequencies frequency of each cycle c Cycles ;
   Number of cases NumberOfCases in an event log;
   Required significance of cycle MetaStateSignificance to be defined as meta-state
Output: Set of meta-states (significant cycles) MetaStates
for all cycles c Cycles  do
   if length of c > 1  then
      if  cse [ c ] / NumberOfCases     MetaStateSignificance  then
          MetaStates     ADD ( c )
      end if
   end if
end for
end procedure
We propose two types of aggregation. In the first type, nodes included in meta-states are allowed to be present distinctly in a process model. We call this aggregation “outer” aggregation. In contrast, “inner” aggregation redirects all relationships of single events to corresponding meta-states. Here, we obtain different ways of redirecting relations: to all meta-states that contain such an event or to the most frequent one.
According to notations proposed in the previous subsection, we give a formal description of model aggregation. Let M = V ,   E ,   v s t a r t , v e n d ,   s i g and M = V ,   E , v s t a r t ,   v e n d , s i g be a process model before and after significant cycles folding, respectively, and let us introduce the following notations:
  • V ˜ = { v ˜ = v ˜ 1 , v ˜ 2 v ˜ k | v ˜ j ,   v ˜ j + 1 E   j = 1 , k 1 ¯ ,   k n ,   v ˜ k ,   v ˜ 1 E } —meta-states, i.e., significant cycles found in the process model M , and v ˜ ( i ) = v ˜ i ,
  • V + = { v V | i   v = v ˜ i ,   v ˜ V ˜ } is a set of meta-state vertices,
  • V = V \ V + is a set of vertices not appearing in meta-states,
  • E ˜ E ( V × V ˜ ) ( V ˜ × V ) is a set of edges obtained for the event log with collapsed cycles.
Then, V V V ˜ , E E ˜ for outer aggregation, and V V V ˜ , E ( V × V ˜ ) ( V ˜ × V ) E ˜ after inner joining with updating significance for redirected edges as follows:
s i g ( u , v ) = j = 1 k q : q = v ( i ) ( r * ( q , v ) 1 σ j ( u , q ) ) k   u V ,   v V ˜
s i g ( u , v ) = j = 1 k q : q = u ( i ) ( r * ( q , u ) 1 σ j ( q , v ) ) k   u V ˜ ,   v V
where r * is defined for the filtering aggregation function that is defined in two forms:
r a l l ( v , v ˜ ) = { 1 ,   i :   v = v ˜ ( i ) , 0 ,   otherwise , v V + ,   v ˜ V ˜
r f r e q ( v , v ˜ ) = { 1 , argmax v V ˜ i : v = v ( i )   s i g ( v ) = v ˜ , 0 ,   otherwise , v V + ,   v ˜ V ˜
Formulas (12) and (13) depict how we “hide” transitions between events, one of which meta-states absorb, i.e., recalculate their frequencies according to r * (14) and (15). After meta-states discovery, the event log is rebuilt, as in the example illustrated in Figure 5. The activities included in meta-states are not considered when we mine a process from the event log in the case of inner joining. Their precedence relations are redirected to corresponding meta-states determined by r * . We show an example of how the proposed technique can transform a model in Figure 6: (a) the initial process model has two simple cycles (BC and BCD); (b) if we assume they appeared in the event log in more than half of the cases, they are significant and may appear in the model as nodes along with the activities which compose these cycles in the case of outer aggregation; (c) performing inner joining with r a l l hides activity C, which is an element of the significant cycles, and incorporates frequencies of transitions associated with C ( A C ) with frequencies of transitions to or from all meta-states containing C ( A BC , A BCD ); and (d) inner joining with r f r e q is similar to the previous case but recounts frequencies of only the most significant meta-states (e.g., BCD). It is worth noting that after the introduction of meta-states, the frequencies are re-calculated for states and meta-states. This may cause the appearance of events unseen in process models without meta-states.

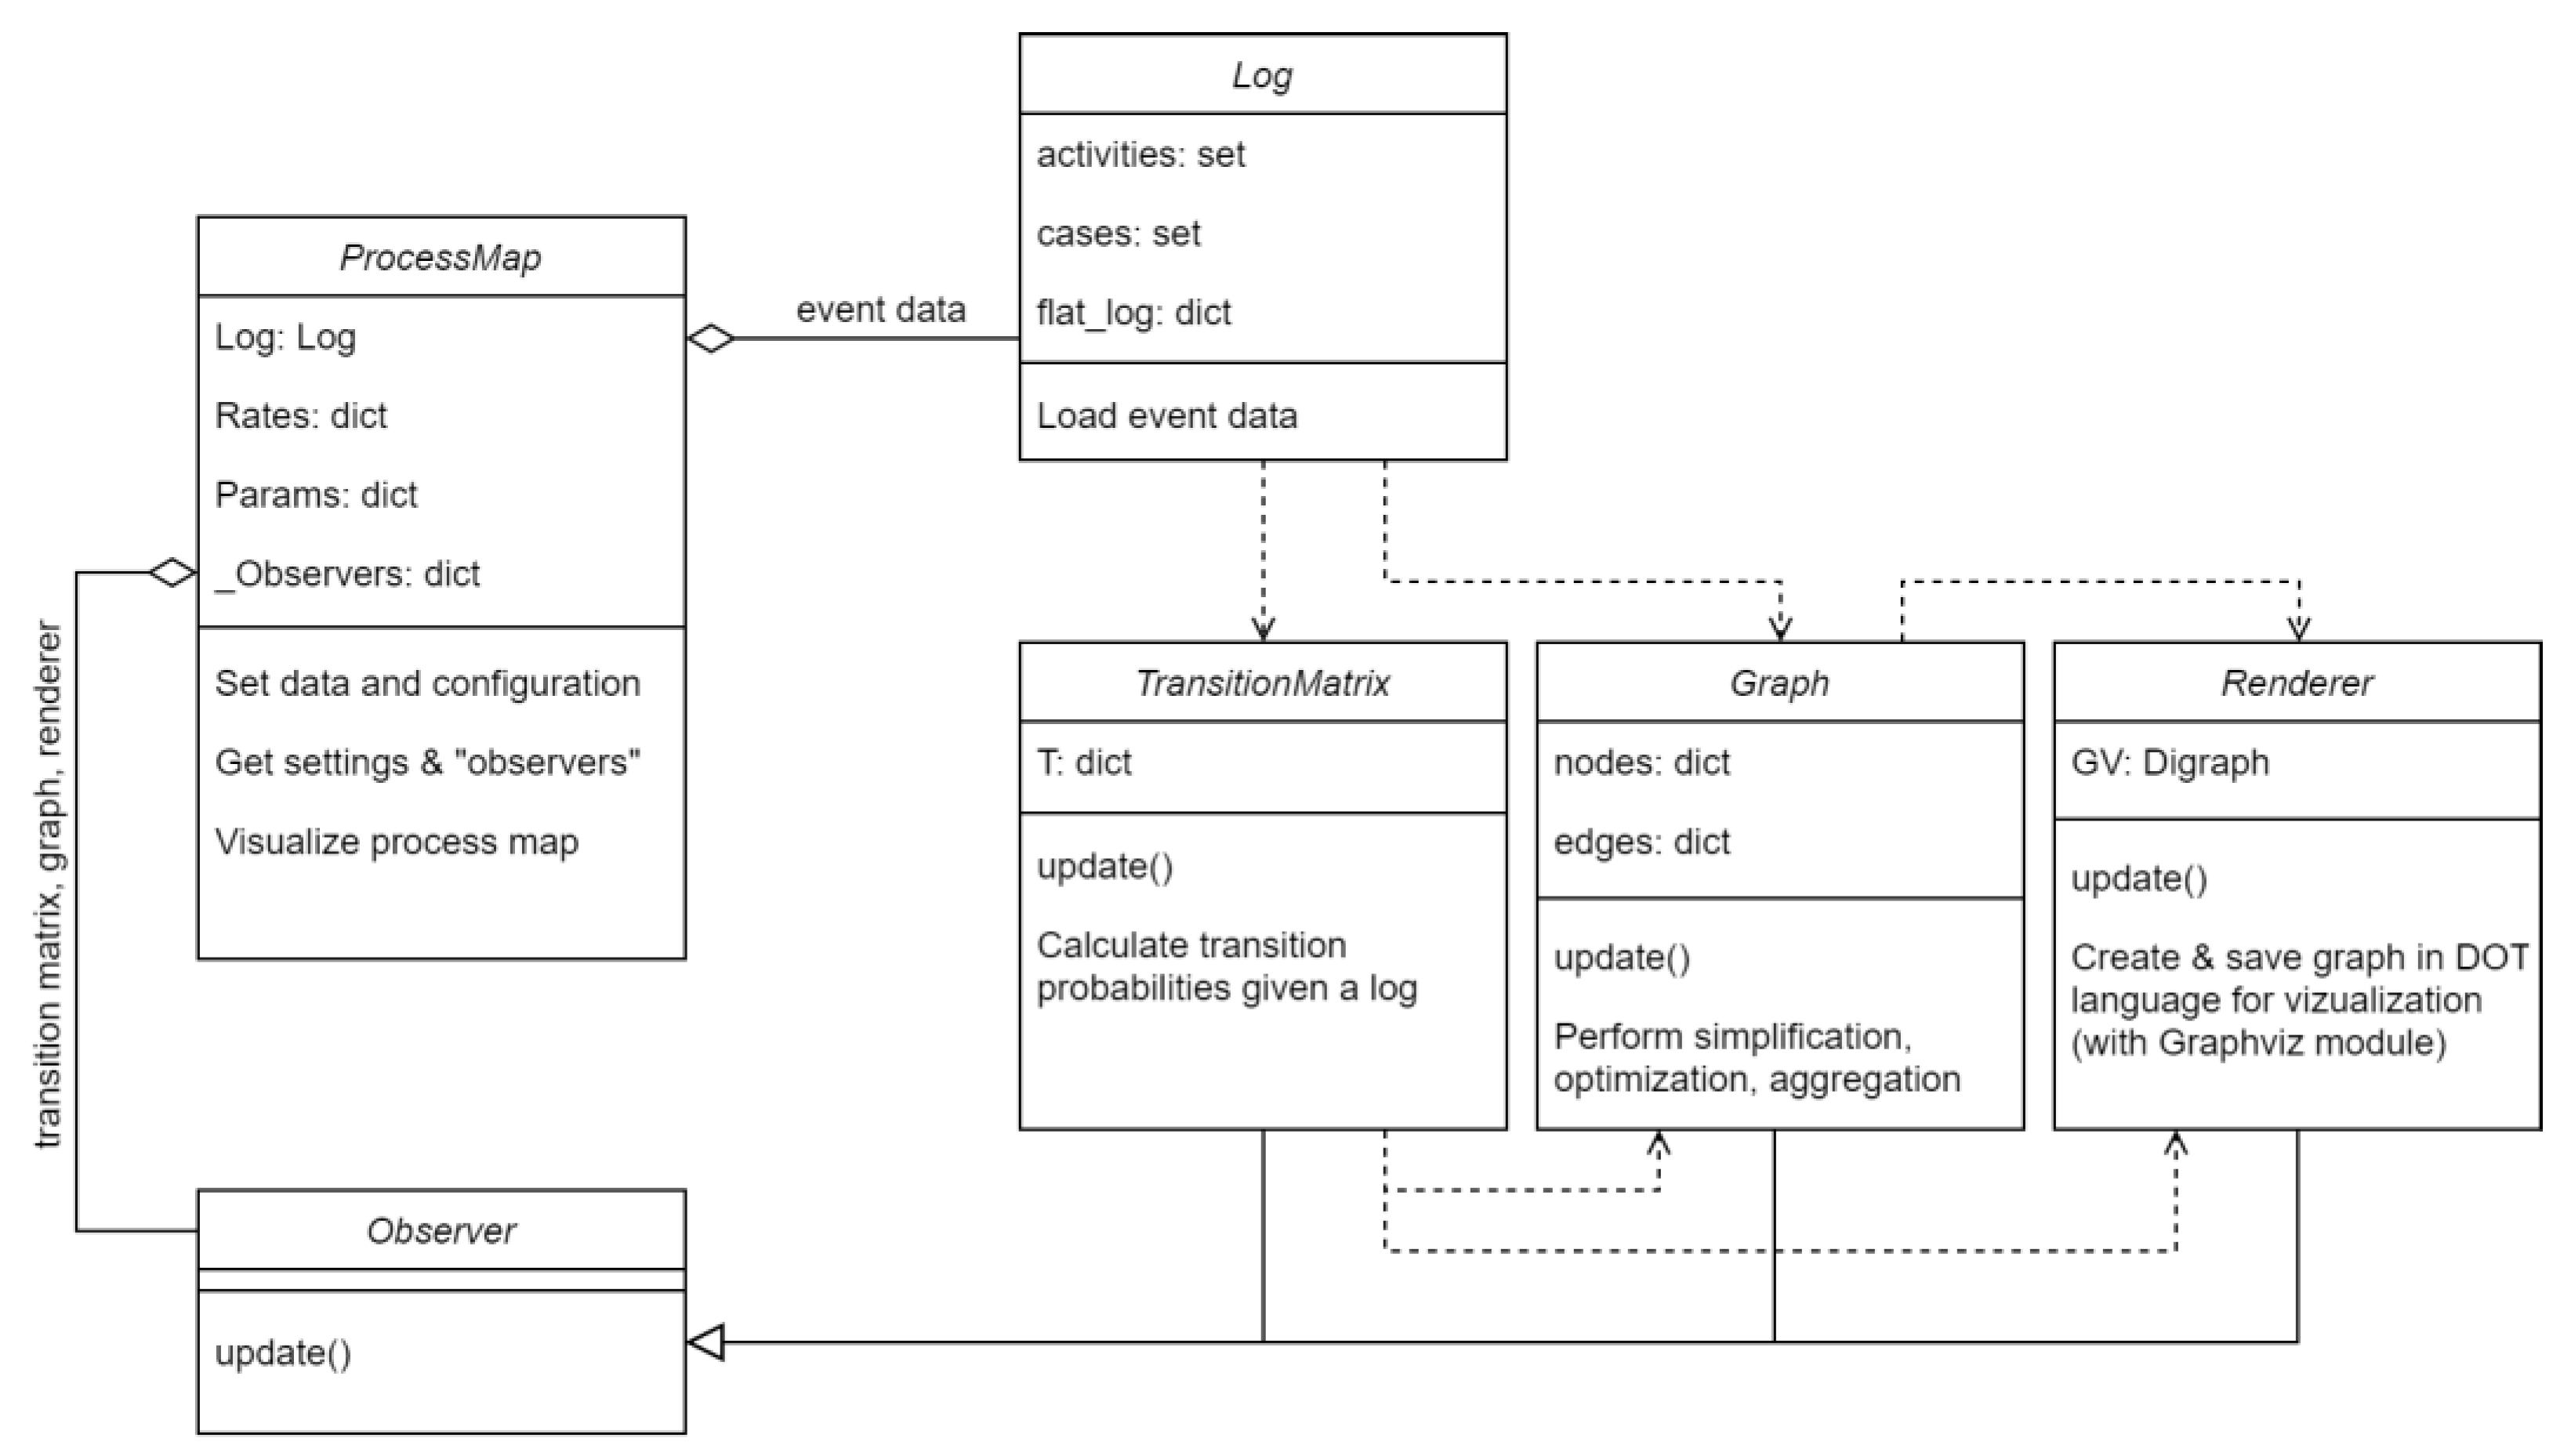
4.4. Software Implementation

To implement the proposed algorithms, we developed a Python library ProFIT (Process Flow Investigation Tool) for process mining with a higher degree of automation in complexity control. The library is considered as an extendable software solution which can be applied in various contexts and problem domains. We implemented “Observer” OOP pattern in the main class ProcessMap, where “observers” are TransitionMatrix, Graph, and Renderer that are updated when data or parameters were changed. These three classes store formal information about process structure, i.e., appropriate order of event relations and transition probabilities, sets of nodes and edges in a graph, sets of elements, and their arrangement in 2D space. With knowledge discovered from an event log by a single method of TransitionMatrix, we perform process mining in Graph, where the main algorithm and approaches are employed. Renderer object transforms an obtained model from graph notation into DOT language and then visualizes it through the Graphviz (https://pypi.org/project/graphviz/, accessed on 12 November 2022) module for Python. An architecture of the code represented in the UML class diagram is shown in Figure 7.
To start working with a module, it is enough to pass a path to a directory with a log file as input in the set_log method. The module will produce an optimal model with default parameters. One can also tune model details “by hand” via the set_rates method that changes the activity and transition rates as well as change parameters via the set_params method, e.g., enable aggregation or optimization. Exploring data stored in the “observers” is possible by calling corresponding get-methods and visualizing a process map by calling the render method. You can find more details and code examples in the project repository at Github (https://github.com/itmo-escience/ProFIT, accessed on 12 November 2022).

5. Experimental Study

5.1. Datasets

We consider two cases of process model discovery in the current study, on which the proposed solution was applied and validated. The first process to discover is remote monitoring of patients suffering from arterial hypertension provided by PMT Online (https://pmtonline.ru/ (in Russian), accessed on 12 November 2022) (a company specializing in the development of medical information systems and telemedicine systems). The second process is the daily activities of medical personnel in the Almazov center (http://www.almazovcentre.ru/?lang=en, accessed on 12 November 2022) in Saint Petersburg, one of the leading cardiological centers in Russia. These cases in healthcare seem to be much better for exploring complexity because healthcare processes are highly diverse and uncertain on multiple levels of implementation. We present a summary of all datasets in Table 2 and give a detailed description below.
First, we applied the proposed discovery technique to the monitoring event log consisting of 35,611 events, 272 cases corresponding to different patients, and 18 types of activities performed by operators, physicians, and nurses during monitoring of patients with arterial hypertension all over Russia within a telemedical system developed by PMT Online. We combined activity labels with corresponding resources to reveal additional role interactions. If the same activities performed by different workers are aggregated, it is similar to clustering events, which are highly correlated in context sense. The remote monitoring program for patients with hypertension is as follows: the patients measure their blood pressure at home on a regular basis, and each record made by a toolkit is transferred to a server, where data are then processed. There are several clinical events for medical staff that measurements may trigger. The main ones are “Red zone” and “Yellow zone” that signify exceeding critical (emergency instance) and target (urgent instance) levels of blood pressure, respectively. These events have to be processed by operators and doctors, which may take some actions according to a scenario, e.g., contacting a patient by appointment or instantly. Usually, the “Red zone” events occur for patients that do not have an appropriate treatment plan yet. When the health state is normalized with medications, the “Yellow zone” appears as opposed to a “Red zone”, or it is possible for the patient to be transferred to a therapy control program to maintain blood pressure levels. There are also non-clinical events such as “New med. program” when a patient is registered for remote care, “Meas. missing” when data are not received by the server, etc. Ideally, when target levels are achieved, and the kit is returned to the monitoring provider (as well as events), the program comes to an end with the “Monitoring completed” event.
A more challenging case study is discovering regular daily activities (workflow) of doctors and nurses from a not-process-aware hospital information system. Our colleagues from the Almazov National Medical Research Centre provided us with an anonymized database with patient electronic health records covering COVID-19 treatment cases in their facility from March 2020 to June 2021. The dataset is a collection of fragmented medical records from patient histories including patient id, event id, event description, and associated record section name, timestamp, specialist name and type, department, record status, and supplementary information as a semi-structured text. We created an event log from the raw data source following event log imperfection patterns [21]. They were form-based event capture, distorted label, collateral events, homonymous label, etc. From the obtained event log, we picked one doctor and one nurse instance of process realizations. Therefore, we obtained two event logs where process case was defined by patient id.

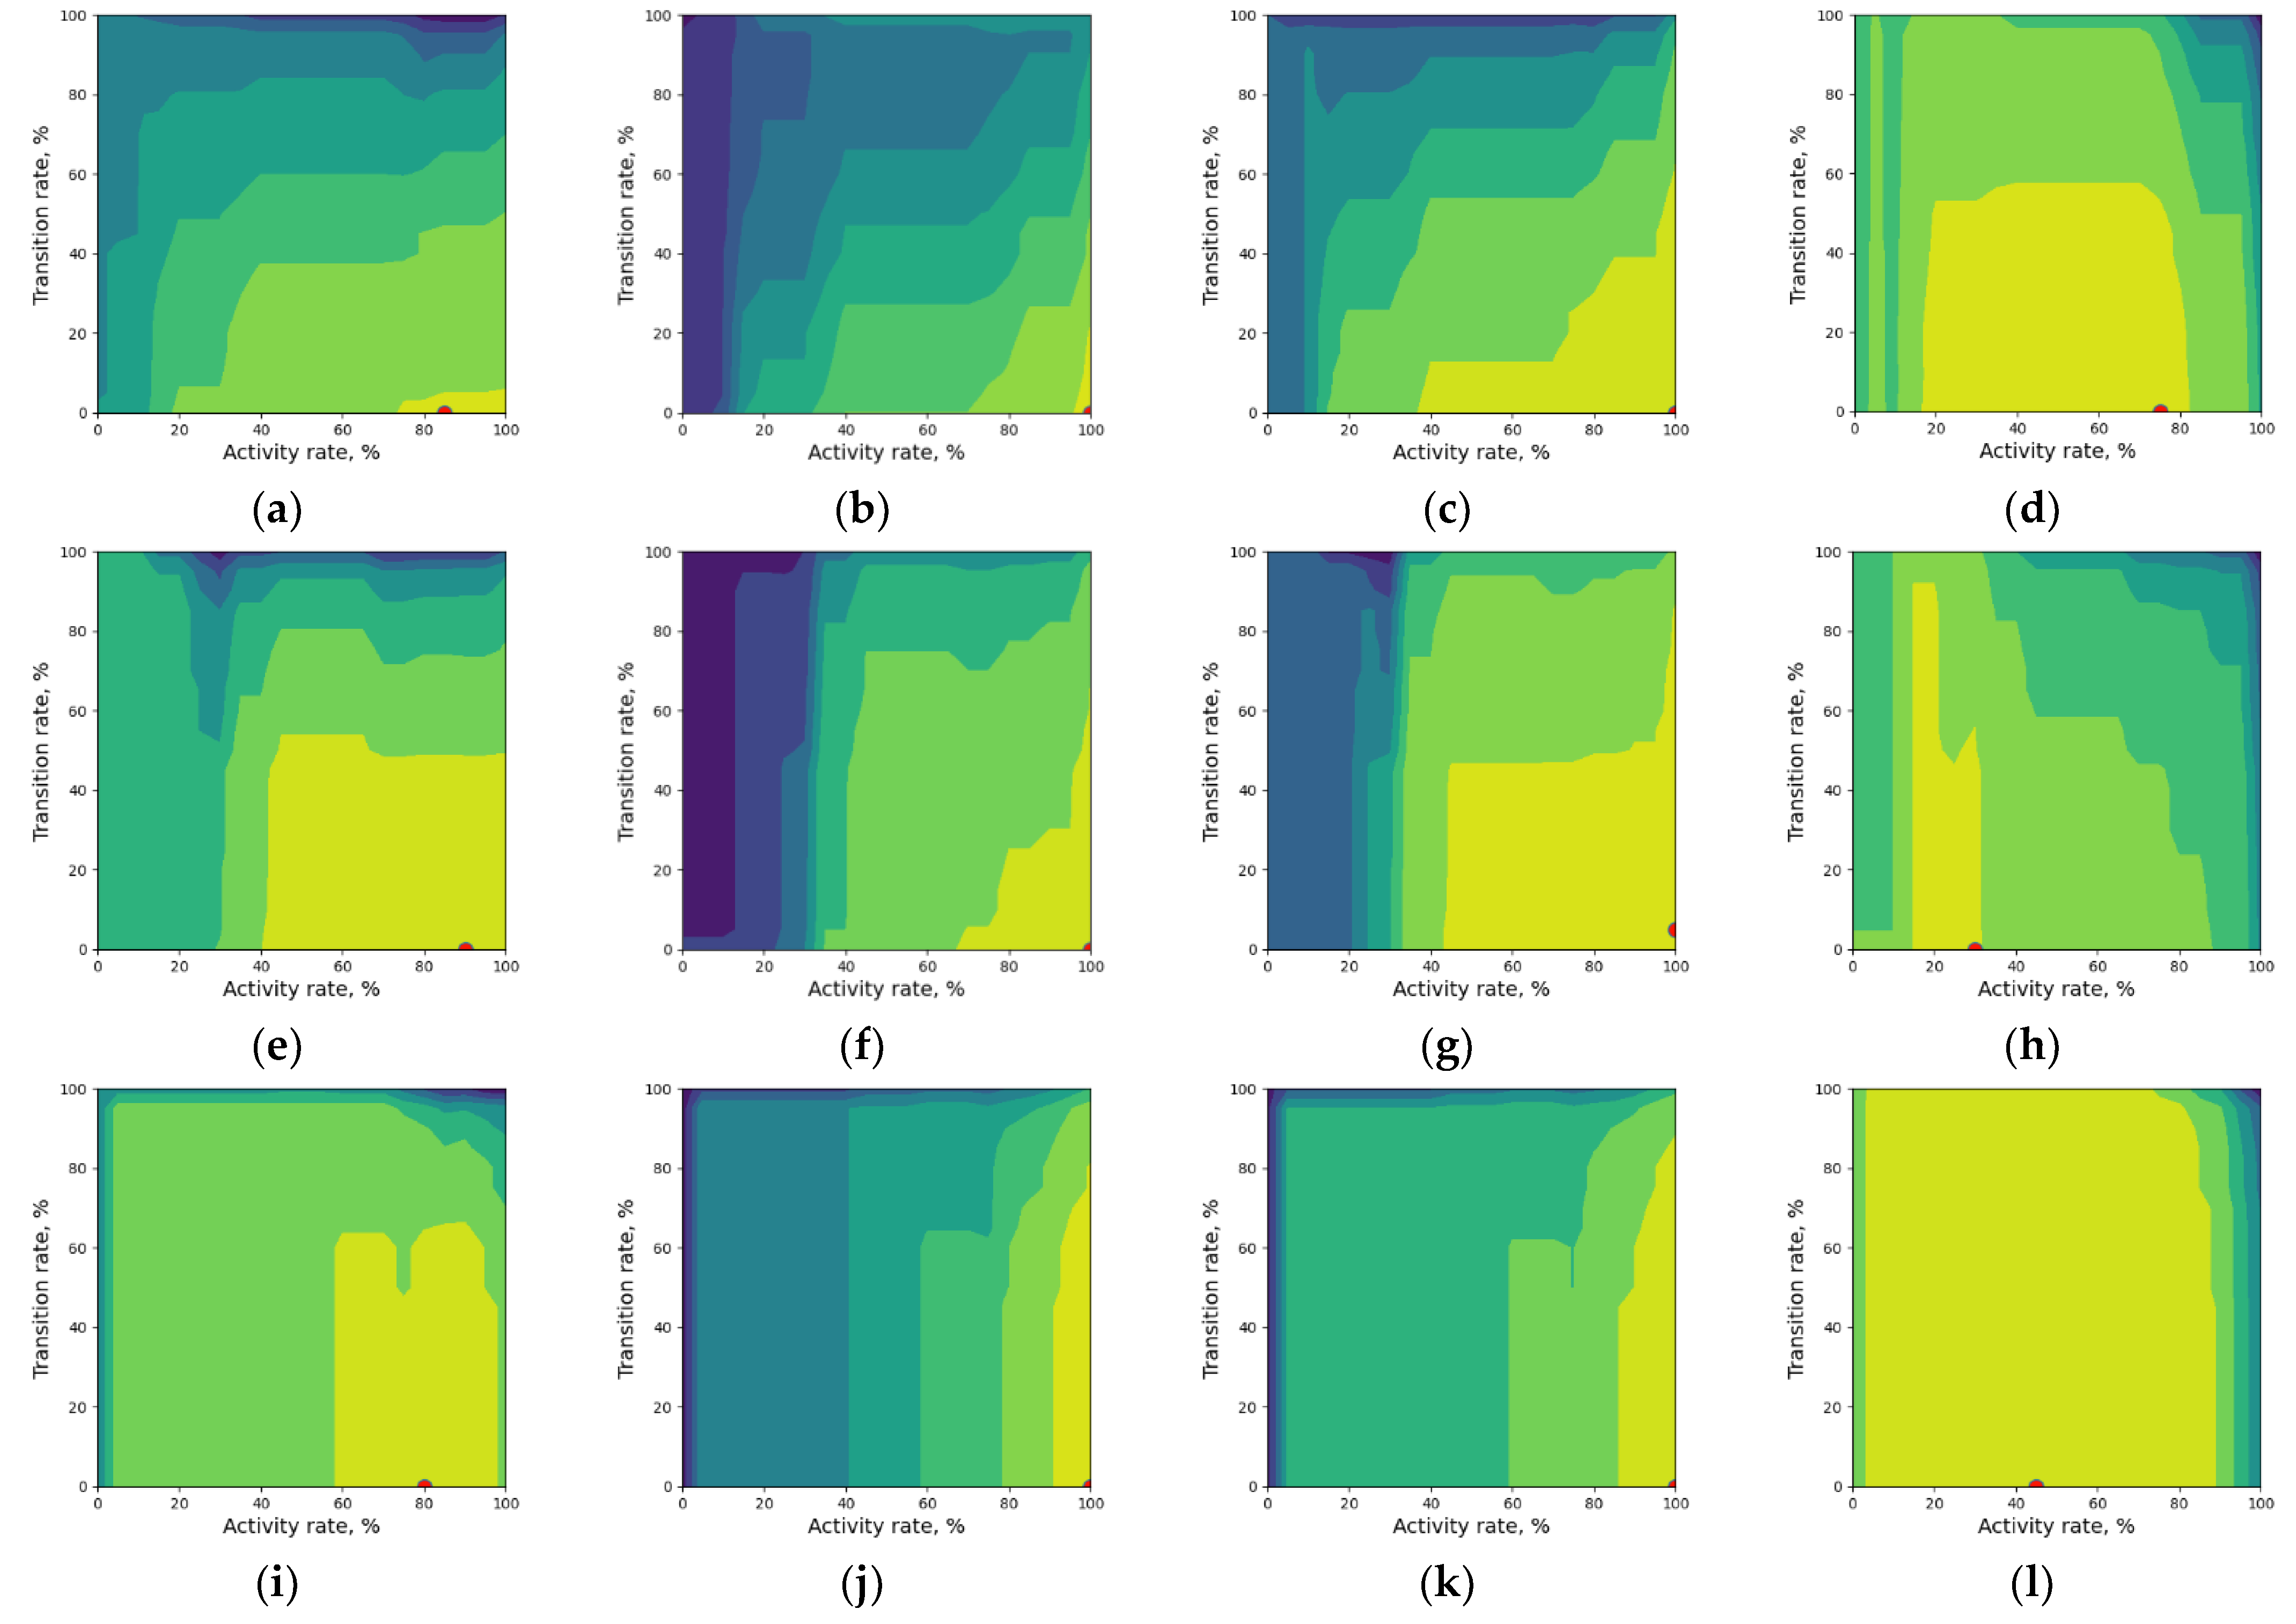
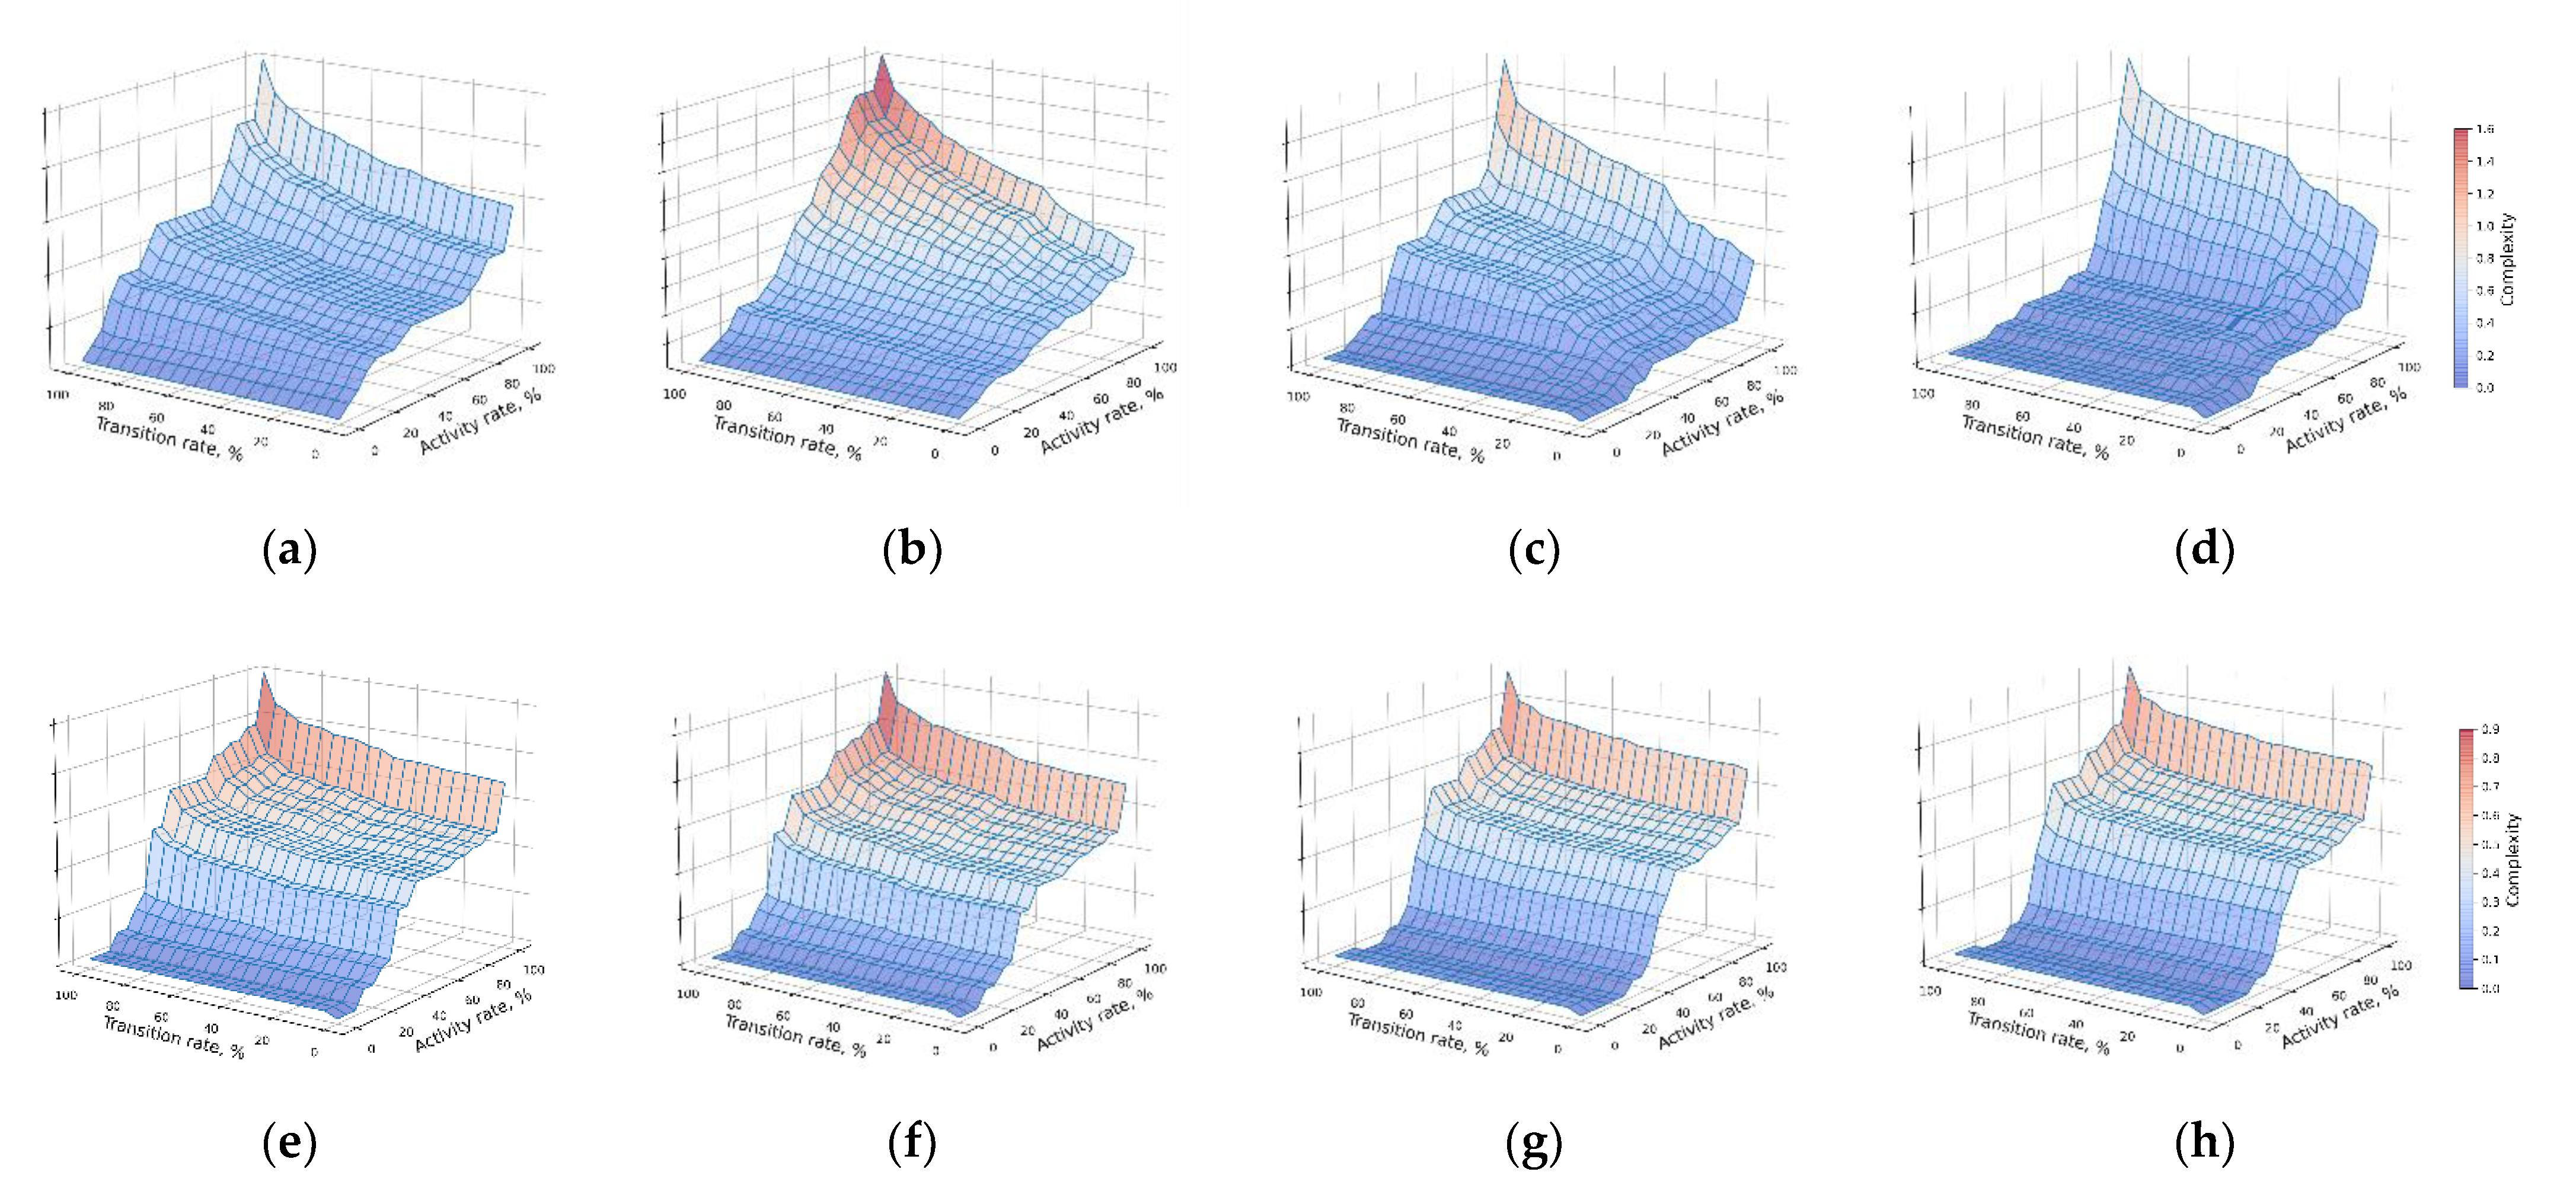
5.2. Complexity Optimization

We aimed to investigate several measures of complexity and to make a comparison across the event logs and types of cycles folding. In this study, we considered four measures, such as average degree, entropy, and two additional ones that we empirically derived in Section 4.2.
Measures (9) and (10) are structural. They indicate the relative size of the model, i.e., the ratio of the number of elements in the model and the number of possible or theoretical ones. The first is the number of edges presented in the model divided by the number of edges of a corresponding complete directed graph. This way, we can judge how close the graph structure is to having all pairs of relations, which complicates its understanding. A complete graph does not imply loops, so, in this formula, we do not account for them in the number of edges even though they present in the model. The last measure, (10), is the equally weighted sum of the activities and transitions ratios. “Start” and “end” events are not included in the set of nodes for this measure because they do not present in the log activities and are just auxiliary. Accordingly, in- and upcoming relations for the initial and terminal nodes are not included in the set of edges.
We plotted landscapes for each of the complexity measures considered. The measures visualize the complexity value and its relationships with activity and transition rates that are basic options in our algorithm to regulate the process model completeness. Process models in the area near the rate limits are mostly useless due to either very high complexity (with very high r a and r t ) or the reduction of almost all significant activities in the model (with very low r a and r t ). We also revealed that there are no meta-states for the event log of nurse workflow. So, only the results for two event logs of the monitoring program and physician workflow are discussed further. A summary of cycles found in the models is given in Table 3. It should be pointed out that “start” and “end” events and relations associated with them are accounted for in the number of model elements. We also want to highlight that the maximum and the minimum numbers of cycles and meta-states are not always for the boundary levels, and the mean values are rounded down.
We also provide and investigate fitness and complexity landscapes across the considered measures and event logs. At first sight, they may seem monotonic. However, intricate patterns in behaviors of real processes involve irregularities in the landscapes that are amplified with the presence of meta-states in the model. Nevertheless, we can still address the optimization problem within such conditions. The results of process model optimization are shown in Figure 8, where a red marker is plotted to indicate optimal rates. One can see that all complexity measures can facilitate decreasing the transition rate (as the optimal value is very close to zero when it concerns the transition rate), which directly affects the ability to comprehend a model effortlessly. Meanwhile, H and K n allowed the maximum activity rate to be optimal in all cases. This is not appropriate if there are too many activities and highly varying process behaviors.
The complexity landscape of R has a stepped form (Figure 9) due to a filtration principle: the more rate values, the more model elements. When we performed “outer” aggregation, the model complexity increased because extra nodes were added as meta-states. Other types of aggregation hide all stand-alone events which compose significant cycles. That is why we observe lower complexity, especially where the maximum number of significant cycles is obtained. This applies in all proposed measures generally. Other complexity landscapes (Figure 10, Figure 11 and Figure 12) are rather not steppe-like, and the measures depend mostly on the transition rate. A D and K n are directly related to the number of edges and inversely related to the number of nodes, which makes it possible to lengthen paths, leaving them simple to track. This is what we aimed to achieve: to not “cut off” the model and make it simpler to understand. As mentioned above, the average degree of a directed graph is just the ratio of the number of edges and the number of nodes. It seems that A D and K n should have similar landscapes but with the first not being normalized and the second being penalized a lot for more activities in the model. However, there are some similarities in the forms of K n and entropy landscapes, which is an interesting observation. Indeed, the number of occurrences of Outcome 1 in the adjacency matrix is equal to the number of edges in the graph, and its probability is the number of edges divided by the number of nodes squared, almost as for K n . However, there may be processes with all possible relationships of events. In this case, a complete process model will have an entropy of zero and a complete graph ratio of one.
In the remainder of this section, we give the results of process models optimization with C R in Table 4 and a summary across all proposed complexity measures in Table 5. We consider 50/50 models as a baseline of comparison with optimal ones. These models are neither good nor bad, so we aim to see whether performing optimization and aggregation may give odds for better results. We do not categorize process models as right or wrong, but rather compare them on appropriateness for describing and comprehending the process. In our understanding, excessively large process models, as well ones that are too small, are not appropriate. We have mentioned the model size influences the ability to understand it easily enough. Large process models cause cognitive difficulties for both analysts and common users, yet a model with short paths of process execution may not reflect complete process behaviors. In this regard, we succeed in discovering meaningful and intuitive process models (Table 4). The optimization results using other complexity measures are shown in Table 5, and some examples of the corresponding process models mined are in the appendix.
We recall that the aggregation step follows the optimization in the algorithm’s workflow (Figure 2), i.e., models with meta-states are obtained within fixed optimal parameters ( r a and r t ) found before. We additionally defined how fitness is calculated for the aggregated models: if ( u , v ) E , u V , v V ˜ , then we add ( u , v i ) , v i   in   v , and all transitions composing v to the list of edges “presenting” in the model. Other cases ( ( v , u ) and ( v , v ) , v V ˜ ) are treated similarly. This was carried out to demonstrate the quantified results for all models that may be discovered across different complexity measures, aggregation types, and event data. This way, one can obtain better insight into the comprehension difficulty and precision of the discovered models via numerical comparison in addition to a visual assessment.

5.3. Domain Interpretation of Considered Application Scenarios

This sub-section presents domain interpretation of the considered application scenarios provided by a domain specialist (M.V.I.) regarding the obtained process models, the applicability of process mining in the target cases, and insights from the discovered process models.
Process optimization is crucial for healthcare as there is always a lack of human and time resources. It is even more pronounced in the management of hypertension and COVID-19. In the first case, it is mainly due to the enormous amount of patients (who are mostly outpatients) as around 33% of the adult population is hypertensive around the globe [57]. With the introduction of telehealth home blood pressure (BP) monitoring was given a “second life”. Home BP telemonitoring and remote counseling are now feasible and practical approaches for hypertension management [58,59]. In addition, during the COVID-19 pandemic, telehealth played a key role in chronic disease management, notably hypertension [60]. A team approach is based on health behavior and psychological support and on close physician supervision. In the observed BP telemonitoring scenarios (“Monitoring Process”), we suppose it could be wrong to ping-pong a patient from an operator (or case manager) to a doctor and vice versa. Both doctor and nurse may act similarly in most cases. In the meantime, optimization of the home BP telemonitoring supports multidisciplinary patient care and early doctor alerts but only when there is something wrong with the patients’ BP data (“red zone” or missed measurements). Optimized management process ensures patient safety and adherence. The proposed way of the process model optimization approach (Table 4) seems plausible. A number of interim steps may be taken off, and the scheme of BP telemonitoring may be distilled into 3–4 interpretable steps without any loss in quality of patient care. The unnecessary closed loops of actions were also suppressed.
Talking about COVID-19, less waiting time may be a lifesaver, especially for severe cases. Recently, a British study found an increase in mortality rates with 5 and more hours in the emergency departments. Jones et al. calculated that for every 82 patients with a length of stay of 6 to 8 h, 1 extra death occurs [61]. The length of hospital stay may also play a crucial role in mortality and morbidity benefit, especially in elderly cases [62]. So, it is of great importance to look inside the business processes and to try to improve them as process optimization may save not only time and money but also health and lives. Here, (“Nurse Workflow” and “Physician Workflow”) the optimized process models describe emergency patient care with a structured and more reasonable workflow for nurse and physician. These provide early targeted therapy; therefore improved inpatient care gives an opportunity to shorten hospital stays without posing a risk to patients but with the possibility to treat more critically ill patients with faster hospital bed rotation. One may argue that the nurse’s workflow seems to be more complex after optimization and aggregation, but it should be noted that some physicians’ activities have been rescheduled. These are mostly technical ones, and task shifting is one of the most important steps when it comes to emergency care.

6. Discussion

The experimental study shows that the proposed approach can be applied in various conditions and problem domains and diverse structure of process maps. The optimization procedure enables the construction of explicit and understandable process maps with good coverage of the event log. The optimized process maps for the considered cases reveal key sequences of events and demonstrate a good reflection of the processes’ nature. One of the challenging issues discovered within the study is managing cyclic meta-states as part of the model optimization procedure and further domain interpretation.
The revealed complexity landscapes become highly “rugged” after the introduction of aggregation procedures (see Figure 9, Figure 10, Figure 11 and Figure 12). This leads to the appearance of multiple local optimums. Although these optimums may be considered stable and interpretable process maps, they cover or do not cover certain field-specific states. Within the proposed approach, we focused on reaching higher interpretability of process maps from this point of view. Thus, this issue goes beyond the problem of global optimization. The presence or absence of particular meta-states should be considered from the domain-specific point of view with a further interpretation that can impose restrictions on a global optimization problem during process discovery within the proposed approach.
The number of meta-states varies over the parameter space significantly (see, e.g., Figure 13a for the monitoring process). To analyze the structure of meta-states discovered in different areas of the parametric space, we identified the meta-states’ appearance for the monitoring program case. Within a basic grid search, we discovered 15 possible combinations of meta-states (see Figure 13b,d for a description of states). Still, the more important issues can be revealed when considering the structure of adjacent areas. In Figure 13c, we introduce a graph structure showing the transitions between combinations by adding meta-states (e.g., edge “+CF|HD” means that moving from combination C 14 to combination C 12 is reflected in adding two cycles “CF” and “HD”—see the Figure 13d caption for the interpretation). Several measures can be introduced to identify the relevance of the combination to the actual process, e.g., by assessing the coverage area in parameter space or the centrality measure in the proposed graph structure. Here, one can select combinations C 2 , C 9 , C 14 by their centrality and high coverage of parameter space. Moreover, C 2 , C 9 have implicit evidence of their consistency as transitions from loose multiple meta-states with increasing complexity (see, e.g., transitions to combinations C 3 , C 4 , C 5 , C 6 , C 8 ). Thus, in this case, the combinations can be selected to define the area for the optimization within the parametric space.
Additionally, it is worth mentioning that common PM approaches focus on the most frequent traces within the event log. Still, in many cases, rare behavior may also present significant variants of the process. To tackle such issues, specific procedures may be introduced both in the internal structuring process models [63] and in the decomposition of event log data (e.g., by clustering) [41]. While the last approach may be directly combined with the proposed methods, it introduces a series of process models where meta-states may possibly be semantically connected. At the same time, internal restructuring of the process model may also be implemented as an extension of the proposed formal identification of meta-states.
Considering the limitations of the proposed approach, several important issues have to be mentioned. First, the proposed optimization is based on a balance between event log coverage (fitness), process complexity, and interpretability. These criteria generally contradict each other. This leads to a complex multi-criterion optimization problem which requires more sophisticated techniques to be used and/or new aggregated metrics to be introduced. Still, similar to many modeling problems, there is no explicit and natural way to introduce a unified criterion for such optimization. Second, the introduced meta-states modify an optimization landscape which leads to the appearance of multiple local optimums and potential violation of locality property due to triggering meta-states rules. This leads to more sophisticated optimization methods being hired. Third, the introduction of meta-states may lead to the appearance of unseen events in the map and more abrupt changes in the structure of a map during slight modification of discovery algorithm parameters (e.g., activity and transition rate). This may negatively affect the interpretability of the model. Fourth, the interconnection between complexity and interpretability (widely claimed as conceptually existing and generally negative) may have a more complicated nature. For example, both of them may be considered as subjective properties of human perception in relation to personal experience, expertise, goals, etc. Finally, building DFG as a reachable graph improves consistency and still may negatively introduce behavior unseen in data. Although in practical cases, this issue rarely affects the model significantly (usually in an abnormally low transition rate), this may cause certain limitations of the proposed approach.
The discovered issues are an insight into the development of the proposed approach towards higher domain-specific interpretability and consistency of process models discovered automatically. Along with other interpretability issues, e.g., the tuning process map layout for better human comprehension, we consider these issues as a direction for further work.

7. Conclusions and Future Works

In this paper, we presented an algorithm for automatic process model discovery and a method of process model abstraction and interpretation. We defined the problem of process model optimization to achieve the balance between two terms: model correctness for event data, i.e., fitness, and model complexity, i.e., a measure of its comprehension difficulty. We proposed several complexity measures in the experimental part of the study and conducted a comprehensive analysis of their influences on the model form and its parameters. We demonstrated our solution validity on event logs from the healthcare domain. Still, the algorithm is general-purpose and adaptable to different fields and tasks.
In future studies, we plan to extend the functionality of this project. A promising direction for development is extending interpretability capabilities within the solution with different knowledge sources, including formal knowledge and data mining. As an example, machine learning models or hidden Markov models can be used to interpret meta-states found in process models, or on the other hand, knowledge mined from the event logs can be employed in predictive modeling [64]. We are also interested in the integration and application of the developed solution in various problem domains. We see much research potential in process mining application, which can lead to interesting and valuable results.

Author Contributions

Conceptualization, S.V.K.; methodology, S.V.K.; software, L.O.E. and A.D.K.; validation, M.A.B. and M.V.I.; formal analysis, L.O.E.; investigation, M.A.B.; resources, M.A.B.; data curation, A.D.K. and M.A.B.; writing—original draft preparation, L.O.E.; writing—review and editing, L.O.E. and S.V.K.; visualization, L.O.E. and S.V.K.; supervision, S.V.K.; project administration, M.A.B.; funding acquisition, S.V.K. All authors have read and agreed to the published version of the manuscript.

Funding

This work was supported by the Ministry of Science and Higher Education of Russian Federation, goszadanie no. 2019-1339.

Institutional Review Board Statement

Not applicable.

Informed Consent Statement

Not applicable.

Data Availability Statement

Data available on the request from the authors.

Conflicts of Interest

The authors declare no conflict of interest.

References

  1. Van der Aalst, W. Process Mining: Data Science in Action; Springer: Berlin/Heidelberg, Germany, 2016; ISBN 9783662498514. [Google Scholar]
  2. dos Santos Garcia, C.; Meincheim, A.; Faria Junior, E.R.; Dallagassa, M.R.; Sato, D.M.V.; Carvalho, D.R.; Santos, E.A.P.; Scalabrin, E.E. Process mining techniques and applications—A systematic mapping study. Expert Syst. Appl. 2019, 133, 260–295. [Google Scholar] [CrossRef]
  3. Buijs, J.C.A.M.; Van Dongen, B.F.; Van Der Aalst, W.M.P. Quality dimensions in process discovery: The importance of fitness, precision, generalization and simplicity. Int. J. Coop. Inf. Syst. 2014, 23, 1440001. [Google Scholar] [CrossRef] [Green Version]
  4. Batista, E.; Solanas, A. Process mining in healthcare: A systematic review. In Proceedings of the 2018 9th International Conference on Information, Intelligence, Systems and Applications, IISA 2018, Zakynthos, Greece, 23–25 July 2018; Institute of Electrical and Electronics Engineers Inc.: Piscataway, NJ, USA, 2019. [Google Scholar]
  5. Erdogan, T.G.; Tarhan, A. Systematic Mapping of Process Mining Studies in Healthcare. IEEE Access 2018, 6, 24543–25567. [Google Scholar] [CrossRef]
  6. Riz, G.; Santos, E.A.P.; de Freitas Rocha Loures, E. Interoperability Assessment in Health Systems Based on Process Mining and MCDA Methods. Adv. Intell. Syst. Comput. 2017, 569, 436–445. [Google Scholar] [CrossRef]
  7. Martin, N.; De Weerdt, J.; Fernández-Llatas, C.; Gal, A.; Gatta, R.; Ibáñez, G.; Johnson, O.; Mannhardt, F.; Marco-Ruiz, L.; Mertens, S.; et al. Recommendations for enhancing the usability and understandability of process mining in healthcare. Artif. Intell. Med. 2020, 109, 101962. [Google Scholar] [CrossRef]
  8. Murdoch, W.J.; Singh, C.; Kumbier, K.; Abbasi-Asl, R.; Yu, B. Definitions, methods, and applications in interpretable machine learning. Proc. Natl. Acad. Sci. USA 2019, 116, 22071–22080. [Google Scholar] [CrossRef] [PubMed] [Green Version]
  9. Gilpin, L.H.; Bau, D.; Yuan, B.Z.; Bajwa, A.; Specter, M.; Kagal, L. Explaining Explanations: An Overview of Interpretability of Machine Learning. In Proceedings of the 2018 IEEE 5th International Conference on Data Science and Advanced Analytics (DSAA), Turin, Italy, 1–3 October 2018; pp. 80–89. [Google Scholar]
  10. Mendling, J.; Reijers, H.A.; Cardoso, J. What Makes Process Models Understandable? In Business Process Management; Springer: Berlin/Heidelberg, Germany, 2007; pp. 48–63. [Google Scholar]
  11. Ingvaldsen, J.E.; Gulla, J.A. Industrial application of semantic process mining. Enterp. Inf. Syst. 2012, 6, 139–163. [Google Scholar] [CrossRef]
  12. Kinsner, W. System Complex. In Studies in Computational Intelligence; Springer: Berlin/Heidelberg, Germany, 2010; Volume 323, pp. 265–295. ISBN 9783642160820. [Google Scholar]
  13. Fernández-Cerero, D.; Varela-Vaca, Á.J.; Fernández-Montes, A.; Gómez-López, M.T.; Alvárez-Bermejo, J.A. Measuring data-centre workflows complexity through process mining: The Google cluster case. J. Supercomput. 2020, 76, 2449–2478. [Google Scholar] [CrossRef]
  14. Muketha, G.M.; Ghani, A.A.A.; Selamat, M.H.; Atan, R. A Survey of Business Process Complexity Metrics. Inf. Technol. J. 2010, 9, 1336–1344. [Google Scholar] [CrossRef] [Green Version]
  15. Figl, K. Comprehension of Procedural Visual Business Process Models: A Literature Review. Bus. Inf. Syst. Eng. 2017, 59, 41–67. [Google Scholar] [CrossRef]
  16. Figl, K.; Laue, R. Cognitive complexity in business process modeling. In Proceedings of the 23rd International Conference on Advanced Information Systems Engineering, London, UK, 20–24 June 2011; Lecture Notes in Computer Science (including Subseries Lecture Notes in Artificial Intelligence and Lecture Notes in Bioinformatics). Volume 6741, pp. 452–466. [Google Scholar]
  17. Cardoso, J. Business process control-flow complexity: Metric, evaluation, and validation. Int. J. Web Serv. Res. 2008, 5, 49–76. [Google Scholar] [CrossRef] [Green Version]
  18. Jung, J.-Y.; Chin, C.-H.; Cardoso, J. An entropy-based uncertainty measure of process models. Inf. Process. Lett. 2011, 111, 135–141. [Google Scholar] [CrossRef]
  19. Kluza, K.; Nalepa, G.J. Proposal of square metrics for measuring Business Process Model complexity. In Proceedings of the 2012 Federated Conference on Computer Science and Information Systems (FedCSIS), Wroclaw, Poland, 9–12 September 2012; pp. 919–922. [Google Scholar]
  20. Cardoso, J.; Mendling, J.; Neumann, G.; Reijers, H.A. A discourse on complexity of process models. In Proceedings of the 2006 International Conference on Business Process Management, Vienna, Austria, 4–7 September 2006; Lecture Notes in Computer Science (including Subseries Lecture Notes in Artificial Intelligence and Lecture Notes in Bioinformatics). Springer: Berlin/Heidelberg, Germany, 2006; Volume 4103, pp. 117–128. [Google Scholar]
  21. Suriadi, S.; Andrews, R.; ter Hofstede, A.H.M.; Wynn, M.T. Event log imperfection patterns for process mining: Towards a systematic approach to cleaning event logs. Inf. Syst. 2017, 64, 132–150. [Google Scholar] [CrossRef]
  22. Leonardi, G.; Striani, M.; Quaglini, S.; Cavallini, A.; Montani, S. Leveraging semantic labels for multi-level abstraction in medical process mining and trace comparison. J. Biomed. Inform. 2018, 83, 10–24. [Google Scholar] [CrossRef]
  23. Chiudinelli, L.; Dagliati, A.; Tibollo, V.; Albasini, S.; Geifman, N.; Peek, N.; Holmes, J.H.; Corsi, F.; Bellazzi, R.; Sacchi, L. Mining post-surgical care processes in breast cancer patients. Artif. Intell. Med. 2020, 105, 101855. [Google Scholar] [CrossRef]
  24. Tax, N.; Sidorova, N.; Haakma, R.; van der Aalst, W.M.P. Event abstraction for process mining using supervised learning techniques. In Lecture Notes in Networks and Systems; Springer: Cham, Switzerland, 2018; Volume 15, pp. 251–269. [Google Scholar]
  25. Alharbi, A.; Bulpitt, A.; Johnson, O. Improving pattern detection in healthcare process mining using an interval-based event selection method. In Proceedings of the International Conference on Business Process Management; Lecture Notes in Business Information Processing, Barcelona, Spain, 10–15 September 2017; Springer: Cham, Switzerland, 2017; Volume 297, pp. 88–105. [Google Scholar]
  26. vanden Broucke, S.K.L.M.; De Weerdt, J. Fodina: A robust and flexible heuristic process discovery technique. Decis. Support Syst. 2017, 100, 109–118. [Google Scholar] [CrossRef]
  27. Günther, C.W.; van der Aalst, W.M.P. Fuzzy Mining—Adaptive Process Simplification Based on Multi-perspective Metrics. In Proceedings of the International Conference on Business Process Management, Brisbane, Australia, 24–28 September 2007; pp. 328–343. [Google Scholar] [CrossRef] [Green Version]
  28. Batista, E.; Solanas, A. Skip Miner: Towards the Simplification of Spaghetti-like Business Process Models. In Proceedings of the 10th International Conference on Information, Intelligence, Systems and Applications, IISA 2019, Patras, Greece, 15–17 July 2019; Institute of Electrical and Electronics Engineers Inc.: Piscataway, NJ, USA, 2019. [Google Scholar]
  29. De Weerdt, J.; vanden Broucke, S.K.L.M.; Caron, F. Bidimensional process discovery for mining BPMN models. In Proceedings of the International Conference on Business Process Management, Eindhoven, The Netherlands, 7–8 September 2014; Lecture Notes in Business Information Processing. Springer: Cham, Switzerland, 2015; Volume 202, pp. 529–540. [Google Scholar]
  30. Leemans, S.J.J.; Poppe, E.; Wynn, M.T. Directly follows-based process mining: Exploration & a case study. In Proceedings of the 2019 International Conference on Process Mining, ICPM 2019, Aachen, Germany, 24–26 June 2019; Institute of Electrical and Electronics Engineers Inc.: Piscataway, NJ, USA, 2019; pp. 25–32. [Google Scholar]
  31. Leemans, M.; van der Aalst, W.M.P.; van den Brand, M.G.J. Hierarchical performance analysis for process mining. In Proceedings of the 2018 International Conference on Software and System Process—ICSSP’18, Gothenburg, Sweden, 26–27 May 2018; ACM Press: New York, NY, USA, 2018; pp. 96–105. [Google Scholar]
  32. Augusto, A.; Conforti, R.; Dumas, M.; Rosa, M. La Split miner: Discovering accurate and simple business process models from event logs. In Proceedings of the IEEE International Conference on Data Mining, ICDM, New Orleans, LA, USA, 18–21 November 2017; Institute of Electrical and Electronics Engineers Inc.: Piscataway, NJ, USA, 2017; pp. 1–10. [Google Scholar]
  33. Sun, H.W.; Liu, W.; Qi, L.; Du, Y.Y.; Ren, X.; Liu, X.Y. A process mining algorithm to mixed multiple-concurrency short-loop structures. Inf. Sci. 2021, 542, 453–475. [Google Scholar] [CrossRef]
  34. De Smedt, J.; De Weerdt, J.; Vanthienen, J. Fusion Miner: Process discovery for mixed-paradigm models. Decis. Support Syst. 2015, 77, 123–136. [Google Scholar] [CrossRef]
  35. Prodel, M.; Augusto, V.; Jouaneton, B.; Lamarsalle, L.; Xie, X. Optimal Process Mining for Large and Complex Event Logs. IEEE Trans. Autom. Sci. Eng. 2018, 15, 1309–1325. [Google Scholar] [CrossRef]
  36. Fahland, D.; Van Der Aalst, W.M.P. Simplifying discovered process models in a controlled manner. Inf. Syst. 2013, 38, 585–605. [Google Scholar] [CrossRef]
  37. Delias, P.; Doumpos, M.; Grigoroudis, E.; Manolitzas, P.; Matsatsinis, N. Supporting healthcare management decisions via robust clustering of event logs. Knowl.-Based Syst. 2015, 84, 203–213. [Google Scholar] [CrossRef]
  38. De Weerdt, J.; Vanden Broucke, S.K.L.M.; Vanthienen, J.; Baesens, B. Leveraging process discovery with trace clustering and text mining for intelligent analysis of incident management processes. In Proceedings of the 2012 IEEE Congress on Evolutionary Computation, CEC 2012, Brisbane, Australia, 10–15 June 2012. [Google Scholar]
  39. García-Bañuelos, L.; Dumas, M.; La Rosa, M.; De Weerdt, J.; Ekanayake, C.C. Controlled automated discovery of collections of business process models. Inf. Syst. 2014, 46, 85–101. [Google Scholar] [CrossRef] [Green Version]
  40. Becker, T.; Intoyoad, W. Context Aware Process Mining in Logistics. Procedia CIRP 2017, 63, 557–562. [Google Scholar] [CrossRef]
  41. Kovalchuk, S.V.; Funkner, A.A.; Metsker, O.G.; Yakovlev, A.N. Simulation of patient flow in multiple healthcare units using process and data mining techniques for model identification. J. Biomed. Inform. 2018, 82, 128–142. [Google Scholar] [CrossRef] [PubMed]
  42. Najjar, A.; Reinharz, D.; Girouard, C.; Gagné, C. A two-step approach for mining patient treatment pathways in administrative healthcare databases. Artif. Intell. Med. 2018, 87, 34–48. [Google Scholar] [CrossRef]
  43. Prodel, M.; Augusto, V.; Xie, X.; Jouaneton, B.; Lamarsalle, L. Discovery of patient pathways from a national hospital database using process mining and integer linear programming. In Proceedings of the IEEE International Conference on Automation Science and Engineering, Gothenburg, Sweden, 24–28 August 2015; IEEE Computer Society: New York, NY, USA, 2015; pp. 1409–1414. [Google Scholar]
  44. Camargo, M.; Dumas, M.; González-Rojas, O. Automated discovery of business process simulation models from event logs. Decis. Support Syst. 2020, 134, 113284. [Google Scholar] [CrossRef]
  45. De Oliveira, H.; Augusto, V.; Jouaneton, B.; Lamarsalle, L.; Prodel, M.; Xie, X. Optimal process mining of timed event logs. Inf. Sci. 2020, 528, 58–78. [Google Scholar] [CrossRef]
  46. Effendi, Y.A.; Sarno, R. Discovering optimized process model using rule discovery hybrid particle swarm optimization. In Proceedings of the 2017 3rd International Conference on Science in Information Technology: Theory and Application of IT for Education, Industry and Society in Big Data Era, ICSITech 2017, Bandung, Indonesia, 25–26 October 2017; Institute of Electrical and Electronics Engineers Inc.: Piscataway, NJ, USA, 2017; pp. 97–103. [Google Scholar]
  47. Buijs, J.C.A.M.; van Dongen, B.F.; van der Aalst, W.M.P. Discovering and navigating a collection of process models using multiple quality dimensions. In Proceedings of the International Conference on Business Process Management, Beijing, China, 26 August 2013; Lecture Notes in Business Information Processing. Springer: Cham, Switzerland, 2014; Volume 171, pp. 3–14. [Google Scholar]
  48. Vázquez-Barreiros, B.; Mucientes, M.; Lama, M. ProDiGen: Mining complete, precise and minimal structure process models with a genetic algorithm. Inf. Sci. 2015, 294, 315–333. [Google Scholar] [CrossRef]
  49. Weijters, A.J.M.M.; van der Aalst, W.M.P.; de Medeiros, A.K.A. Process Mining with the HeuristicsMiner Algorithm. Beta Work. Pap. 2006, 166, 1–34. [Google Scholar]
  50. Van Der Aalst, W.M.P.; De Medeiros, A.K.A.; Weijters, A.J.M.M. Genetic process mining. Lect. Notes Comput. Sci. 2005, 3536, 48–69. [Google Scholar]
  51. van der Aalst, W. Academic View: Development of the Process Mining Discipline. In Process Mining in Action: Principles, Use Cases and Outlook; Reinkemeyer, L., Ed.; Springer International Publishing: Cham, Switzerland, 2020; pp. 181–196. ISBN 978-3-030-40172-6. [Google Scholar]
  52. Van Der Aalst, W.M.P. A practitioner’s guide to process mining: Limitations of the directly-follows graph. Procedia Comput. Sci. 2019, 164, 321–328. [Google Scholar] [CrossRef]
  53. Leemans, S.J.J.; Fahland, D.; van der Aalst, W.M.P. Discovering Block-Structured Process Models from Event Logs Containing Infrequent Behaviour. In BPM 2013: Business Process Management Workshops; Lohmann, N., Song, M., Wohed, P., Eds.; Springer International Publishing: Cham, Switzerland, 2014; pp. 66–78. [Google Scholar]
  54. Bonchev, D.; Buck, G.A. Quantitative Measures of Network Complexity. In Complexity in Chemistry, Biology, and Ecology; Springer: Boston, MA, USA, 2005; pp. 191–235. ISBN 0387232648. [Google Scholar]
  55. Morzy, M.; Kajdanowicz, T.; Kazienko, P. On Measuring the Complexity of Networks: Kolmogorov Complexity versus Entropy. Complexity 2017, 2017, 3250301. [Google Scholar] [CrossRef] [Green Version]
  56. Zenil, H.; Kiani, N.; Tegnér, J. A Review of Graph and Network Complexity from an Algorithmic Information Perspective. Entropy 2018, 20, 551. [Google Scholar] [CrossRef] [PubMed] [Green Version]
  57. Zhou, B.; Carrillo-Larco, R.M.; Danaei, G.; Riley, L.M.; Paciorek, C.J.; Stevens, G.A.; Gregg, E.W.; Bennett, J.E.; Solomon, B.; Singleton, R.K.; et al. Worldwide trends in hypertension prevalence and progress in treatment and control from 1990 to 2019: A pooled analysis of 1201 population-representative studies with 104 million participants. Lancet 2021, 398, 957–980. [Google Scholar] [CrossRef] [PubMed]
  58. Tucker, K.L.; Sheppard, J.P.; Stevens, R.; Bosworth, H.B.; Bove, A.; Bray, E.P.; Earle, K.; George, J.; Godwin, M.; Green, B.B.; et al. Self-monitoring of blood pressure in hypertension: A systematic review and individual patient data meta-analysis. PLOS Med. 2017, 14, e1002389. [Google Scholar] [CrossRef]
  59. Ionov, M.V.; Zhukova, O.V.; Yudina, Y.S.; Avdonina, N.G.; Emelyanov, I.V.; Kurapeev, D.I.; Zvartau, N.E.; Konradi, A.O. Value-based approach to blood pressure telemonitoring and remote counseling in hypertensive patients. Blood Press. 2021, 30, 20–30. [Google Scholar] [CrossRef]
  60. Omboni, S.; Padwal, R.S.; Alessa, T.; Benczúr, B.; Green, B.B.; Hubbard, I.; Kario, K.; Khan, N.A.; Konradi, A.; Logan, A.G.; et al. The worldwide impact of telemedicine during COVID-19: Current evidence and recommendations for the future. Connect. Health 2022, 1, 7–35. [Google Scholar] [CrossRef]
  61. Jones, S.; Moulton, C.; Swift, S.; Molyneux, P.; Black, S.; Mason, N.; Oakley, R.; Mann, C. Association between delays to patient admission from the emergency department and all-cause 30-day mortality. Emerg. Med. J. 2022, 39, 168–173. [Google Scholar] [CrossRef]
  62. da Costa Sousa, V.; da Silva, M.C.; de Mello, M.P.; Guimarães, J.A.M.; Perini, J.A. Factors associated with mortality, length of hospital stay and diagnosis of COVID-19: Data from a field hospital. J. Infect. Public Health 2022, 15, 800–805. [Google Scholar] [CrossRef]
  63. Mannhardt, F.; de Leoni, M.; Reijers, H.A.; van der Aalst, W.M.P. Data-Driven Process Discovery—Revealing Conditional Infrequent Behavior from Event Logs. In Advanced Information Systems Engineering; Springer: Cham, Switzerland, 2017; pp. 545–560. [Google Scholar]
  64. Elkhovskaya, L.; Kovalchuk, S. Feature Engineering with Process Mining Technique for Patient State Predictions. Lect. Notes Comput. Sci. 2021, 12744, 584–592. [Google Scholar] [CrossRef]
Figure 1. General approach for PM procedures extension.
Algorithms 16 00057 g001
Figure 2. Scheme of the algorithm workflow.
Algorithms 16 00057 g002
Figure 3. Example of disconnected model obtained by Disco (https://fluxicon.com/disco/, accessed on 12 November 2022).
Algorithms 16 00057 g003
Figure 4. Model of the remote monitoring process performed for patients with hypertension.
Algorithms 16 00057 g004
Figure 5. Cycles collapsing in an event log. Activities colored with blue are present in meta-states but do not compose them in the log: they will not be included in the model in case of inner aggregation.
Algorithms 16 00057 g005
Figure 6. Possible rebuilding of a process map with cycles: (a) initial map; (b) outer joining; (c) inner joining with r a l l ; (d) inner joining with r f r e q .
Algorithms 16 00057 g006
Figure 7. UML class diagram for the main classes of ProFIT library.
Algorithms 16 00057 g007
Figure 8. Contour plots of target function (4) for monitoring (ad), physician (eh), and nurse (il) event logs with complexity defined as AD (a,e,i), H (b,f,j), Kn (c,g,k), and R (d,h,l); λ = 0.6.
Algorithms 16 00057 g008
Figure 9. Complexity landscapes of R for models of the monitoring program (ad) and physician workflow (eh) with no aggregation (a,e), outer joining (b,f), inner joining with r a l l (c,g), or inner joining with r f r e q (d,h).
Algorithms 16 00057 g009
Figure 10. Complexity landscapes of A D for models of the monitoring program (ad) and physician workflow (eh) with no aggregation (a,e), outer joining (b,f), inner joining with r a l l (c,g), or inner joining with r f r e q (d,h).
Algorithms 16 00057 g010
Figure 11. Complexity landscapes of K n for models of the monitoring program (ad) and physician workflow (eh) with no aggregation (a,e), outer joining (b,f), inner joining with r a l l (c,g), or inner joining with r f r e q (d,h).
Algorithms 16 00057 g011
Figure 12. Complexity landscapes of H for models of the monitoring program (ad) and physician workflow (eh) with no aggregation (a,e), outer joining (b,f), inner joining with r a l l (c,g), or inner joining with r f r e q (d,h).
Algorithms 16 00057 g012
Figure 13. Meta-state combination: (a) number of significant cycles; (b) covered area; (c) transition states; (d) legend (meas. missing (operator), A; yellow zone (doctor), B; yellow zone (doctor FD), C; red zone (doctor FD), D; patient informing (operator), E; red zone (operator), F; red zone (doctor), G; meas. missing (doctor), H).
Algorithms 16 00057 g013
Table 1. Studies addressing process model optimization.
ApproachStudiesOptimizationMethods
Log pre-processingSuriadi et al. [21], Leonardi et al. [22], Chiudinelli et al. [23], Tax et al. [24], Alharbi et al. [25], Broucke et al. [26]±Outlier (events, traces) detection and removal, region-based methods for repeated tasks, topic modelling, sequence labelling
Behaviour filteringGünther et al. [27], Batista et al. [28], Weerdt et al. [29], Broucke et al. [26], Leemans et al. [30,31], Augusto et al. [32], Sun et al. [33], De Smedt et al. [34]
(manual)
Activity, precedence relation, cycles, and split/join filtering; conflict resolution; attribute accounting
AggregationSuriadi et al. [21], Günther et al. [27], Leemans et al. [31], Prodel et al. [35], Fahland et al. [36]±Hierarchical event structure (e.g., ICD-10 codes, software code architecture), correlation metrics, model construction folding
ClusteringDelias et al. [37], Weerdt et al. [38], García-Bañuelos et al. [39], Becker et al. [40], Funkner et al. [41], Najjar et al. [42]±Trace and event clustering
Optimization problemProdel et al. [35,43], Camargo et al. [44], De Oliveira et al. [45], Effendi et al. [46], Buijs et al. [47], Vázquez-Barreiros et al. [48]Linear programming, Pareto optimality, particle swarm optimization, etc.
Table 2. Datasets summary.
Monitoring
Process
Nurse
Workflow
Physician
Workflow
Num. of cases27216543
Event classesClinical
Non-clinical
Lab tests and Follow-up
Triage duties
Appointments
COVID-19 treatment
Num. of unique events181929
Total num. of events35,61110421077
Case lengthMax6743361
Min311
Mean131625
Record duration355 days454 days377 days
Table 3. Cycles and meta-states found in the model.
Monitoring ProcessNurse WorkflowPhysician Workflow
Num. of elements
(activities/transitions)
Upper boundary (100/100)20/17621/6931/139
Lower boundary (0/0)4/44/33/2
Total num. of cyclesMax4983107
Min100
Mean102018
Num. of significant cyclesMax1001
Min100
Mean701
Table 4. Process models optimization.
Monitoring ProcessNurse WorkflowPhysician Workflow
No optimizationAlgorithms 16 00057 i001Algorithms 16 00057 i002Algorithms 16 00057 i003
Optimization, no aggregationAlgorithms 16 00057 i004Algorithms 16 00057 i005Algorithms 16 00057 i006
Optimization, best aggregationAlgorithms 16 00057 i007Algorithms 16 00057 i008Algorithms 16 00057 i009
Table 5. Optimized process models summary.
Monitoring ProcessNurse WorkflowPhysician Workflow
Agg.NAO I , r a l l I , r f r e q NAO I , r a l l I , r f r e q NAO I , r a l l I , r f r e q
50/50 r a 505050505050505050505050
r t 505050505050505050505050
F 0.910.91000.640.640.640.640.930.930.400.40
A D 2.733.135.091.601.001.001.001.001.851.901.801.80
H 0.800.741.000.900.540.540.540.540.440.450.530.53
K n 0.250.200.480.350.140.140.140.140.090.100.120.12
R 0.340.500.400.100.210.210.210.210.450.450.320.32
Optimized A D r a 858585858080808090909090
r t 000000000000
F 0.960.970.020.020.850.850.850.850.970.970.540.54
J 1.401.531.291.291.171.171.171.171.431.421.501.50
H r a 100100100100100100100100100100100100
r t 000000000000
F 0.960.970.070.070.990.990.990.990.980.980.540.54
J 0.380.340.440.440.400.400.400.400.290.280.300.30
K n r a 100100100100100100100100100100100100
r t 000000005555
F 0.960.970.070.070.990.990.990.990.980.980.550.55
J 0.080.070.100.100.080.080.080.080.050.050.060.06
R r a 757575754545454530303030
r t 000000000000
F 0.940.950.020.020.640.640.640.640.620.620.060.06
J 0.320.460.160.130.210.210.210.210.140.140.040.04
Disclaimer/Publisher’s Note: The statements, opinions and data contained in all publications are solely those of the individual author(s) and contributor(s) and not of MDPI and/or the editor(s). MDPI and/or the editor(s) disclaim responsibility for any injury to people or property resulting from any ideas, methods, instructions or products referred to in the content.

