Article

Improving Traffic Load Distribution Fairness in Mobile Social Networks

by
Bambang Soelistijanto
* and
Vittalis Ayu
Department of Informatics, Sanata Dharma University, Yogyakarta 55281, Indonesia
*
Author to whom correspondence should be addressed.
Algorithms 2022, 15(7), 222; https://doi.org/10.3390/a15070222
Submission received: 23 May 2022 / Revised: 10 June 2022 / Accepted: 13 June 2022 / Published: 22 June 2022
(This article belongs to the Special Issue Algorithms for Communication Networks)

Abstract

:
Mobile social networks suffer from an unbalanced traffic load distribution due to the heterogeneity in mobility of nodes (humans) in the network. A few nodes in these networks are highly mobile, and the proposed social-based routing algorithms are likely to choose these most “social” nodes as the best message relays. Finally, this could lead to inequitable traffic load distribution and resource utilisation, such as faster battery drain and/or storage consumption of the most (socially) popular nodes. We propose a framework called Traffic Load Distribution Aware (TraLDA) to improve traffic load balancing across network nodes. We present a novel method for calculating node popularity which takes into account both node inherent and social-relations popularity. The former is purely determined by the node’s sociability level in the network, and in TraLDA is computed using the Kalman prediction which considers the node’s periodicity behaviour. However, the latter takes the benefit of interactions with more popular neighbours (acquaintances) to boost the popularity of lower (social) level nodes. Using extensive simulations in the Opportunistic Network Environment (ONE) driven by real human mobility scenarios, we show that our proposed strategy enhances the traffic load distribution fairness of the classical, yet popular social-aware routing algorithms BubbleRap and SimBet without negatively impacting the overall delivery performance.

1. Introduction

As a particular case of mobile ad-hoc networks (MANETs), opportunistic mobile networks [1] are unique dynamic wireless mobile networks. Unlike MANETs, in such networks persistent connectivity is not a necessity, and end-to-end paths from sources to destinations are not assumed to exist at all times. A link between a pair of nodes is established whenever they come into contact. In opportunistic mobile networks, pairwise node contacts occur randomly in time, and the duration of each contact is also random. Owing to the omnipresence of mobile devices nowadays, e.g., mobile phones and tablets, human can exploit contact opportunities to exchange information by means of short radio range connections. This leads to human-centric opportunistic mobile networks, also referred to mobile social networks (MSNs) in [2,3]. These networks have mainly been introduced by combining social networks and mobile communication networks. MSNs take a human-centric approach to networking, closing the gap between networks and human behaviour. Moreover, studies in [4,5,6] revealed that social interactions influence human mobility. As a result, MSNs are closely linked to social networks, and knowledge about social ties can be used to improve routing algorithms in such human-based networks.
Researchers currently focus on studying social relation patterns, e.g., node popularity and social similarity, as the choice parameters of relay nodes. Furthermore, the proposed social-based routing algorithms [7,8,9] typically favour nodes with many social ties as optimal carriers for message transfers. This might end up in heavy traffic load in the (socially) popular nodes, quickly draining the nodes’ constraint resources, such as power and storage, and this unbalanced traffic load eventually deteriorates the network’s delivery performance [10]. In addition, the poor traffic load balancing also results in unfair delivery success rate among individuals, where messages from popular individuals can reach the destinations with a high probability, but individuals with few social connections will experience in low delivery success [11]. This variance of the delivery rate becomes a deterrent for nodes to participate in the message forwarding. Ultimately, the unfairness of traffic load makes popular nodes easy target of attacks [12].
Unbalanced traffic distribution across network nodes leading to traffic congestion in social networks has been extensively studied in several areas [13,14,15]. In [13], (data) traffic congestion during crowd disaster was thoroughly discussed. In that crowd management scenario, mobile devices carried by individuals is used to detect and inform to the crowd managers about the crowd density. However, in crowded areas traffic can increase dramatically within a short period of time, and, in turn, traffic congestion starts to occur, making the crowd managers fail to handle the crowd. In [14], traffic in social networks was investigated in various applications, ranging from vehicular traffic in urban environments to data traffic in Internet of Things and human–machine networks. In these settings, local failures such as traffic congestion in some parts of networks might provoke a cascade of failures throughout systems. Machine learning approaches were therefore nominated to address such issues. In [15], pocket switched networks were proposed to transfer data between users’ mobile devices. Such opportunistic networks exploit human mobility to enable a store-carry-forward mechanism to deliver messages from sources to destinations. In each contact, social-based routing algorithms [7,8,9] typically select popular nodes (individuals) as the best relays in the network, resulting in unbalanced traffic distribution across nodes and traffic congestion in the most central nodes.
Social-based routing algorithms are a class of utility-based routing algorithms. In such schemes, heuristic methods are used to determine the “quality” (utility) of a node as a relay. Each node i retains U i ( j ) , a utility function that denotes the likelihood of i delivering a message to j. The utility function can be based on some different parameters, such as contact history, mobility model, social relations, etc. Spyropoulos et al. [16] categorised utility functions into two types: destination-dependent (DD) and destination-independent (DI). In DD, node utility is dependent of the destination; i.e., node i is an optimal relay for one destination d 1 , yet node j is the best one for another d 2 , or U i ( d 1 ) > U j ( d 1 ) , but U i ( d 2 ) < U j ( d 2 ) for d 1 d 2 . DD functions could be based on last-contact, social similarity, or correlated mobility pattern, with the given destination. However, destination-dependent (DD) imposes a large overhead on nodes, since the nodes should keep a single entry for each peer in the network. As opposed to DD, node utility in DI is independent of any destination, for example, a single node may be the best carrier for most/all destinations in the network, or in general it holds that U i ( d 1 ) > U j ( d 1 ) then U i ( d ) > U j ( d ) for most/all j, d. Instances of nodes which are better relays for all destinations would be those with many connections to others (e.g., hub nodes in scale-free networks), nodes with many acquaintances (e.g., popular nodes in social networks), or nodes with high mobility (e.g., cars or buses in vehicular delay-tolerant networks). Nevertheless, destination-independent (DI) imposes a higher forwarding overhead on better relays, leading to poorer fairness in both traffic load distribution and utilisation of the nodes’ resources.
This paper proposes a framework called Traffic Load Distribution Aware (hereafter, TraLDA), aiming to improve fairness in forwarding of social-based routing algorithms. Here, we introduce a novel computation of node (global) popularity in the entire network. This utility metric is obviously independent of the message destination, and it may contribute to a traffic load imbalance across nodes, as mentioned in [16]. In TraLDA, we consider two different popularities in the calculation of node popularity, namely inherent popularity and social-relations popularity. Inherent popularity is based solely on the node’s sociability level, and in TraLDA it is computed using the Kalman prediction [17] which considers the periodicity in human behaviour. The works in [18,19] confirmed that human activities typically exhibit some periodicity. Consequently, the calculation of node popularity in mobile social networks should consider this property. Social-relations popularity, on the other hand, reflects the social benefit of connections with popular nodes, and spreads the popularity of these nodes to their lower ranking acquaintances. Finally, we apply the TraLDA’s node popularity computation on the classical, yet prominent social-based routing algorithms SimBet [20] and BubbleRap [21], and next investigate the performance improvements of these routing schemes, particularly in the trade-off between forwarding fairness and efficiency. SimBet and BubbleRap basically combine two different utility metrics to decide node fitness as relay to a given destination: the one which is dependent of the destination (i.e., similarity and social community in SimBet and BubbleRap, respectively), and the other one which is independent of the destination (i.e., betweeness centrality and global popularity in SimBet and BubbleRap, respectively). In the present case, TraLDA focuses on improving the calculation of global popularity and betweeness centrality in BubbleRap and SimBet, respectively.
The followings are the main contributions we made in this paper:
  • To increase fairness in forwarding of social-based routing algorithms in mobile social networks, we propose TraLDA, a framework of traffic load distribution aware. We offer a new method for calculating node global popularity, a function of both node inherent and social-relations popularity.
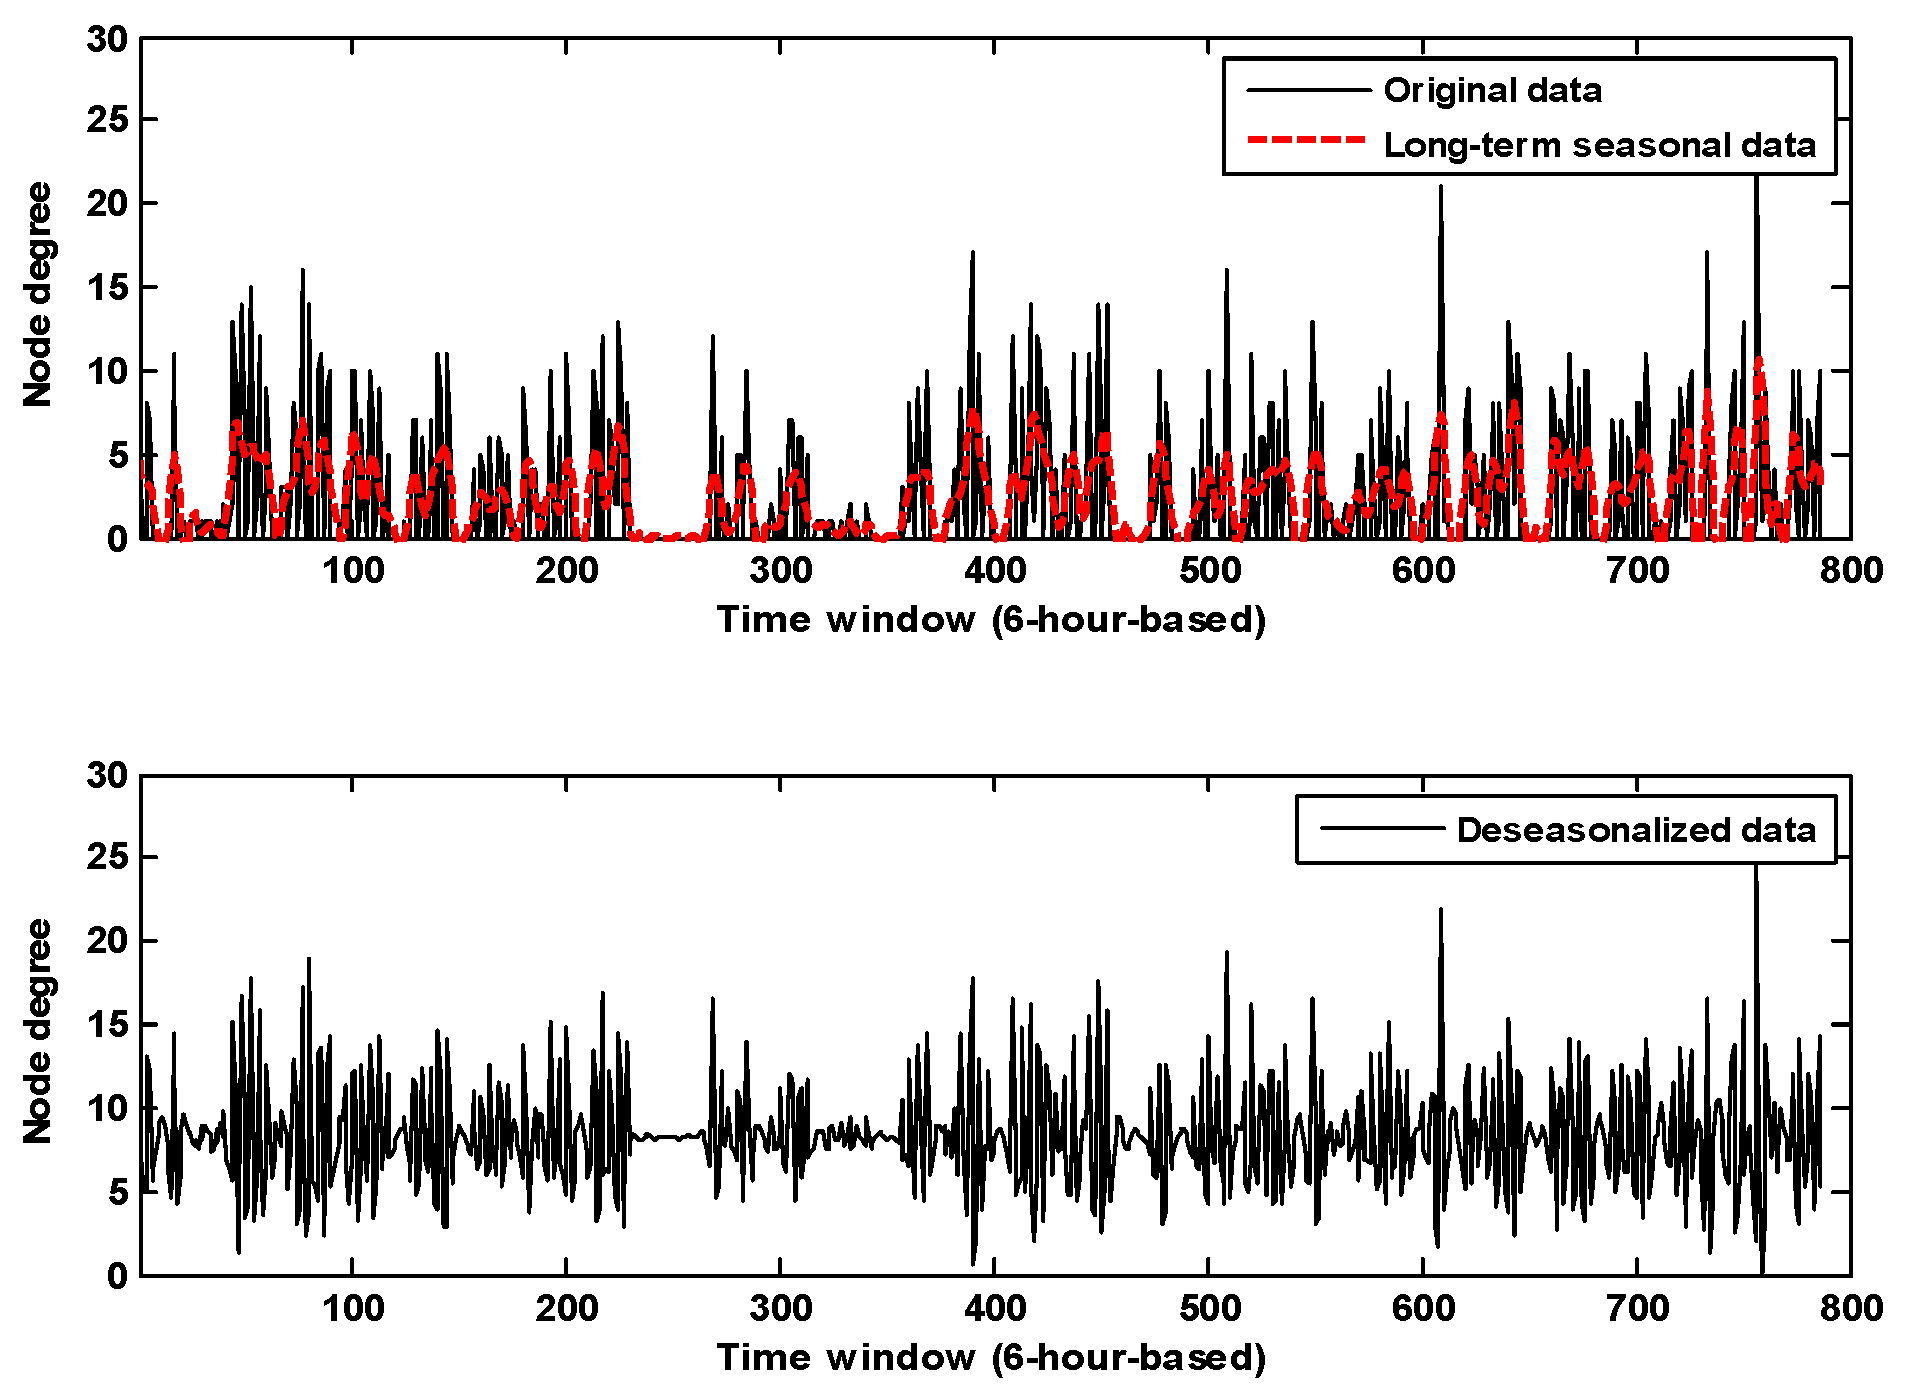
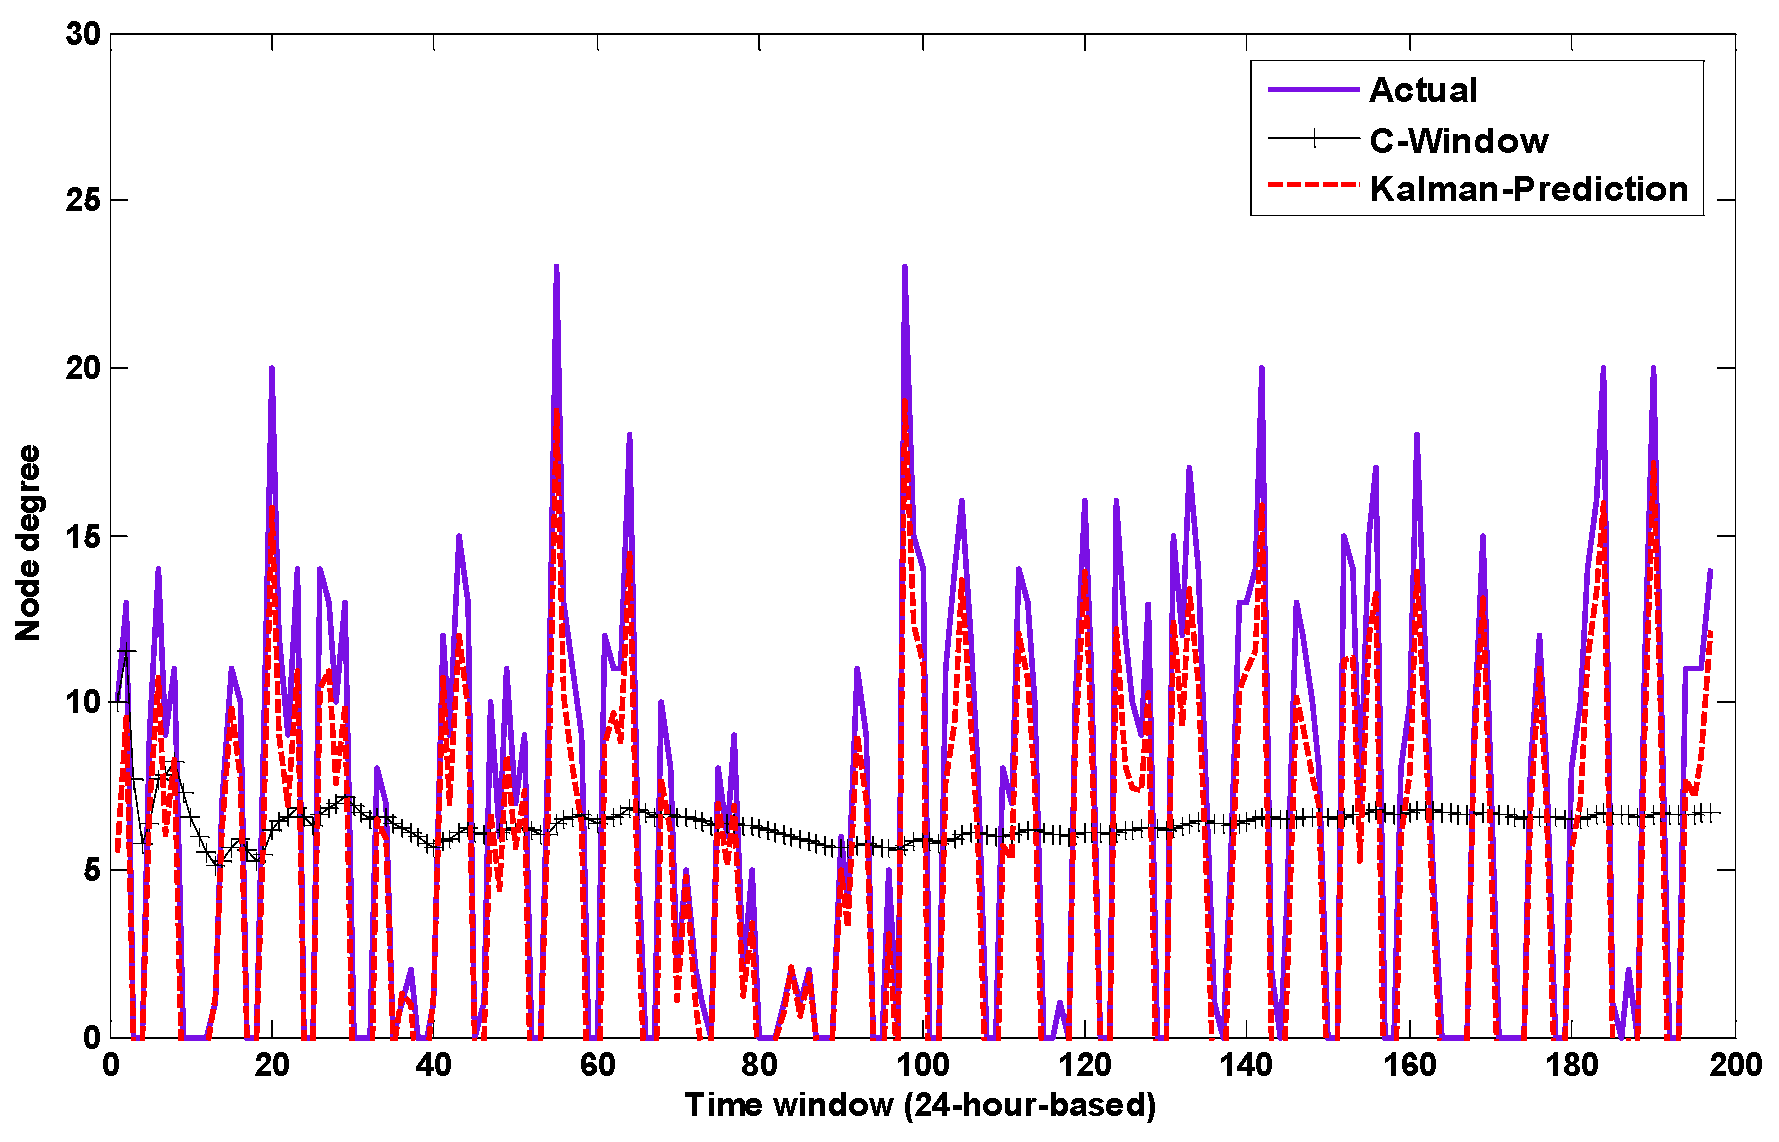
  • The inherent popularity of a node is solely determined by the node’s own mobility pattern or sociability level in the network, and in TraLDA it is computed using the Kalman prediction which accounts for the regularity (periodicity) of human behaviour.
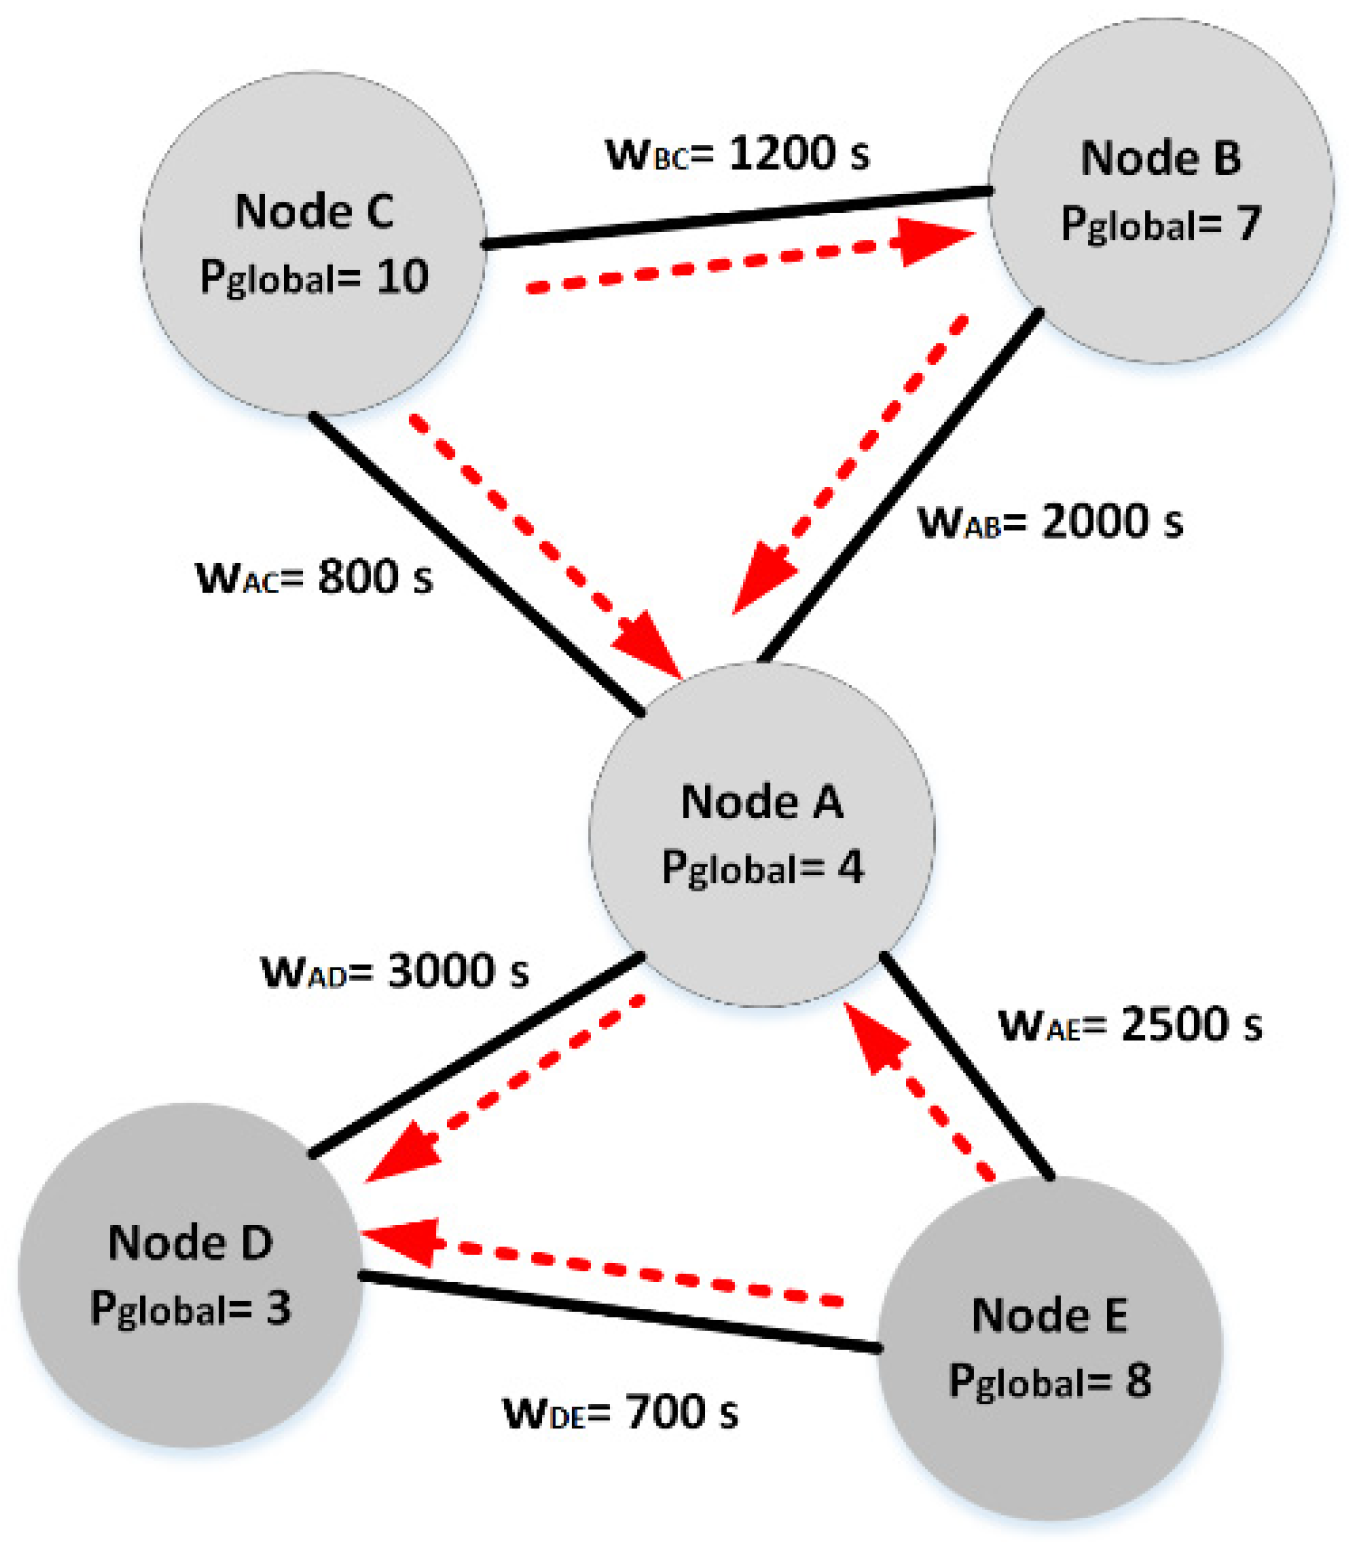
  • Node social-relation popularity, on the other hand, represents the advantages of connections with more popular or central nodes (individuals). It shares the popularity of more popular nodes to their less popular counterparts.
  • Finally, we apply TraLDA on the calculation of node global popularity and centrality in BubbleRap and SimBet, respectively, in order to improve the traffic load balancing among network nodes. Using extensive simulations in the Opportunistic Network Environment (ONE) [22] driven by realistic human mobility scenarios, we show that TraLDA enhances fairness in forwarding of both schemes, without negatively affecting the overall delivery performances.
We proceed in this paper as follows. Related literature is given in Section 2, research background is described in Section 3, detailed design strategy of TraLDA is discussed in Section 4, simulation and discussion are presented in Section 5, and lastly conclusion and future work are presented in Section 6.

2. Related Literature

Fairness is important in many areas of human lives, e.g., sociology, economics and politics, and it is also true in technologies. In computer engineering, distinct computer resources should be shared equally amongst all processes and threads. In computer networking, all nodes require to attain the bandwidth and quality of service (QoS) equitably. In [23], fairness challenges and issues in wireless networks are thoroughly discussed, and some trade-offs between fairness and performance are reviewed. Mtibaa and Harras [10] studied the trade-offs between fairness and efficiency of social-based routing algorithms in mobile social networks. They found that excluding popular nodes on the message forwarding significantly degrades the delivery efficiency. We [24] also showed that absolute traffic load fairness leads to the deterrent of delivery efficiency; yet, high delivery efficiency results in unfairness of traffic load.
To overcome the problem, fair routing algorithms have been proposed for mobile social networks [11,25,26,27]. Fan et al. [11] introduced a fair routing strategy based on packet priority to improve fairness in success rate among nodes. Ying et al. [25] proposed FSMF, a fair social aware message forwarding to solve the issues of imbalanced traffic load distribution as well as unfair delivery rate. Pujol et al. [26] proposed FairRoute that combines social strength and buffer queue length as the routing metrics to fairly distribute the traffic load among nodes. Milena and Grundy [27] presented CafRep, an adaptive congestion aware forwarding strategy that diverts the traffic from congested nodes (popular nodes) to less congested nodes (unpopular nodes).
Indeed, fair routing algorithms in distributed, intermittently connected wireless networks such as mobile social networks are more complex than those in conventional networks, such as the Internet, since: (i) negotiation and compromise amongst autonomous nodes is more complicated, for example non-cooperative nodes may be reluctant to help other nodes in forwarding; and (ii) due to the lack of knowledge about the global states, routing decisions are made solely based on nodes’ local information. For the first issue, the impact of selfish nodes on delivery performance and resource consumption fairness has been investigated in [28]. In addition, to increase fairness in forwarding an incentive or a credit was applied on the routing decisions in [25]. Finally, in [29] a game theoretic approach is used to support fair cooperation among nodes in opportunistic networks. For the second issue, current works of fair routing schemes searched for proper nodes’ locally available information to ensure a better fairness and efficiency trade-off. Furthermore, there are two sorts of node local knowledge which are commonly used to improve traffic fairness and reduce congestion: (i) buffer statistics and (ii) social measures. For the former case, some algorithms consider node burden, inferred from the node’s buffer queue length, as the forwarding metric to achieve a balanced traffic distribution. For example, FOG [10] and GreBurD [30] prioritise nodes with higher residual buffer space as suitable relays to distribute load away from the congested nodes; CafRep [27] defines node retentiveness, calculated as an expected weighted moving average of the node’s remaining storage, as the congestion heuristic to detect storage congestion in popular nodes. For the latter case, on the other hand, researchers search for better social network measures for improving fairness in forwarding of social-based routing schemes. For example, FairRoute [26] improves the calculation of pairwise tie strength based on the short-term and long-term relationships; SimBet [20] adds connection strength information to the routing metrics to offload traffic from popular nodes; Socially-Aware Prediction (SAP) [31] estimates future contacts based on the node (social) similarity, and forwards messages to nodes with a higher similarity with the destinations, thus reducing messages forwarded to globally popular nodes.
As opposed to [20,26,31], which focus on improving the calculation of destination-dependent (DD) utility metrics, our proposed scheme TraLDA chooses to improve the computation of node popularity in the network, since as noted in [16], this destination-independent (DI) utility metric primarily contribute to the traffic imbalance among nodes in mobile social networks. In social network analysis, Freeman [32] proposed three distinct centrality measures to identify the importance of nodes (individuals) in social networks, namely degree centrality, betweeness centrality and closeness centrality. Degree centrality is the number of direct neighbours or friends a node has; betweeness centrality is the number of shortest paths connecting any two nodes that pass through a given node; and closeness centrality is the average distance (proximity) between a node and all other nodes in the network. Freeman’s centrality metrics have been widely used to detect nodes which are capable of disseminating information in mobile social networks; for example, BubbleRap [21] and SimBet [20] consider degree centrality and betweeness centrality, respectively, computed in a distributed, ad-hoc fashion to determine node popularity. In BubbleRap, node degree is calculated as the cumulative average of total number of distinct peers encountered by the node in all previous time windows. In SimBet, node betweeness centrality is computed based on a binary model of a social relation, i.e., a value of “1” means two nodes know each other and “0” otherwise. However, we argue that the node popularity or centrality calculations in BubbleRap and SimBet do not cope with the dynamics of a social network. Furthermore, as confirmed in [18,19] human activity typically exhibits a regularity (periodicity) pattern. Considering this matter, as our first contribution in this paper, we propose a novel method to calculate node inherent popularity at a given time interval based on the Kalman prediction [17] which takes into account the node’s periodicity behaviour.
Nevertheless, Freeman’s centrality measures typically disregard the influence of the neighbours. The authors of [33] argued that a node’s importance in the social network should also be determined by the importance of its neighbours. In [34], the authors studied a strategy to find persons that are able to spread advertisements as far as possible in a social network. They showed that a person that receives high respects from her friends, her advertisements will be highly probable to spread over the social network quickly. In addition, Ursino and Virgili [35] integrated the concept of social networks and IoT to determine the reputation of IoT objects. They proposed a formula to calculate reputation of an object in a social Internet of Things based on the well-known Google PageRank. In that technique, the reputation of an object is determined by the level of trust it obtains from other IoT objects. Almost similar, Cauteruccio et al. [36] attempted to introduce concepts and behaviours of social networks into the IoT settings. In that work, to measure the reputation of an IoT object, the authors defined Impact Degree, calculated as the average trust degree that the object receives from the other objects in its scope (neighbourhood). Meanwhile, from the social network theory, there exist centrality measures that consider a richer range of direct and indirect influence of neighbours, such as the Katz’s prestige measure [37]. This centrality metric is developed based on the premise that a node’s importance in the network is influenced by its neighbours’ importance. Thus, this prestige measure considers a node’s connectedness to other nodes as well as its proximity to other important nodes. In this regard, node popularity calculation in TraLDA should take into account the influence of more popular neighbours when determining the popularity of a node. Therefore, as our second contribution in this paper, we propose a method to calculate node social-relations popularity based on the Katz’s prestige measure [37]. We perform some modifications on the calculation of this centrality metric to make it appropriate for distributed, ad hoc environments, such as mobile social networks.

3. Research Background

In this section, we discuss the topology structure of mobile social networks and the forwarding strategy of social-based routing algorithms. We initially consider an opportunistic network with N nodes as a graph G (V, E), where V and E are the sets of nodes and links, respectively. In this graph, a link between two nodes represents the physical contact between them, and the link weight is defined as the probability of their pairwise contact. We assume graph G is connected, that is, between any pair of nodes at least a single path exists. Further, the message dissemination in the graph G under a utility-based routing is formulated as a discrete-time Markov chain. Suppose that a message m is transferred hop-by-hop in this graph. Initially, a message m is in state i if it is carried by node i, and when a contact occurs between node i and j and suppose that i transfers the message m to j, then the state of m changes from i to j. Therefore, the forwarding procedure of a message in an opportunistic network can be modelled as a state transition process in a discrete-time Markov chain. Next, we develop a transition probability matrix P, where p i j denotes the probability that the message m is transferred from node i to j, and is expressed as follows
p i j = p i j c   ·   p i j f
where p i j c is the probability of encounter between i and j, and p i j f is the likelihood that i transfers the message m to j during the contact. Node contact probability in mobile social networks is directly related with the human mobility pattern, and in some papers, such as [5,38], it was characterised based on the structural properties of node contacts. Yet, forwarding probability fully depends on the forwarding rules used in message routing. In the following, we analyse the topology characteristics of mobile social networks as well as the forwarding features of social-based routing schemes, and discuss how the combination of them may result in the unfairness in forwarding among network nodes.

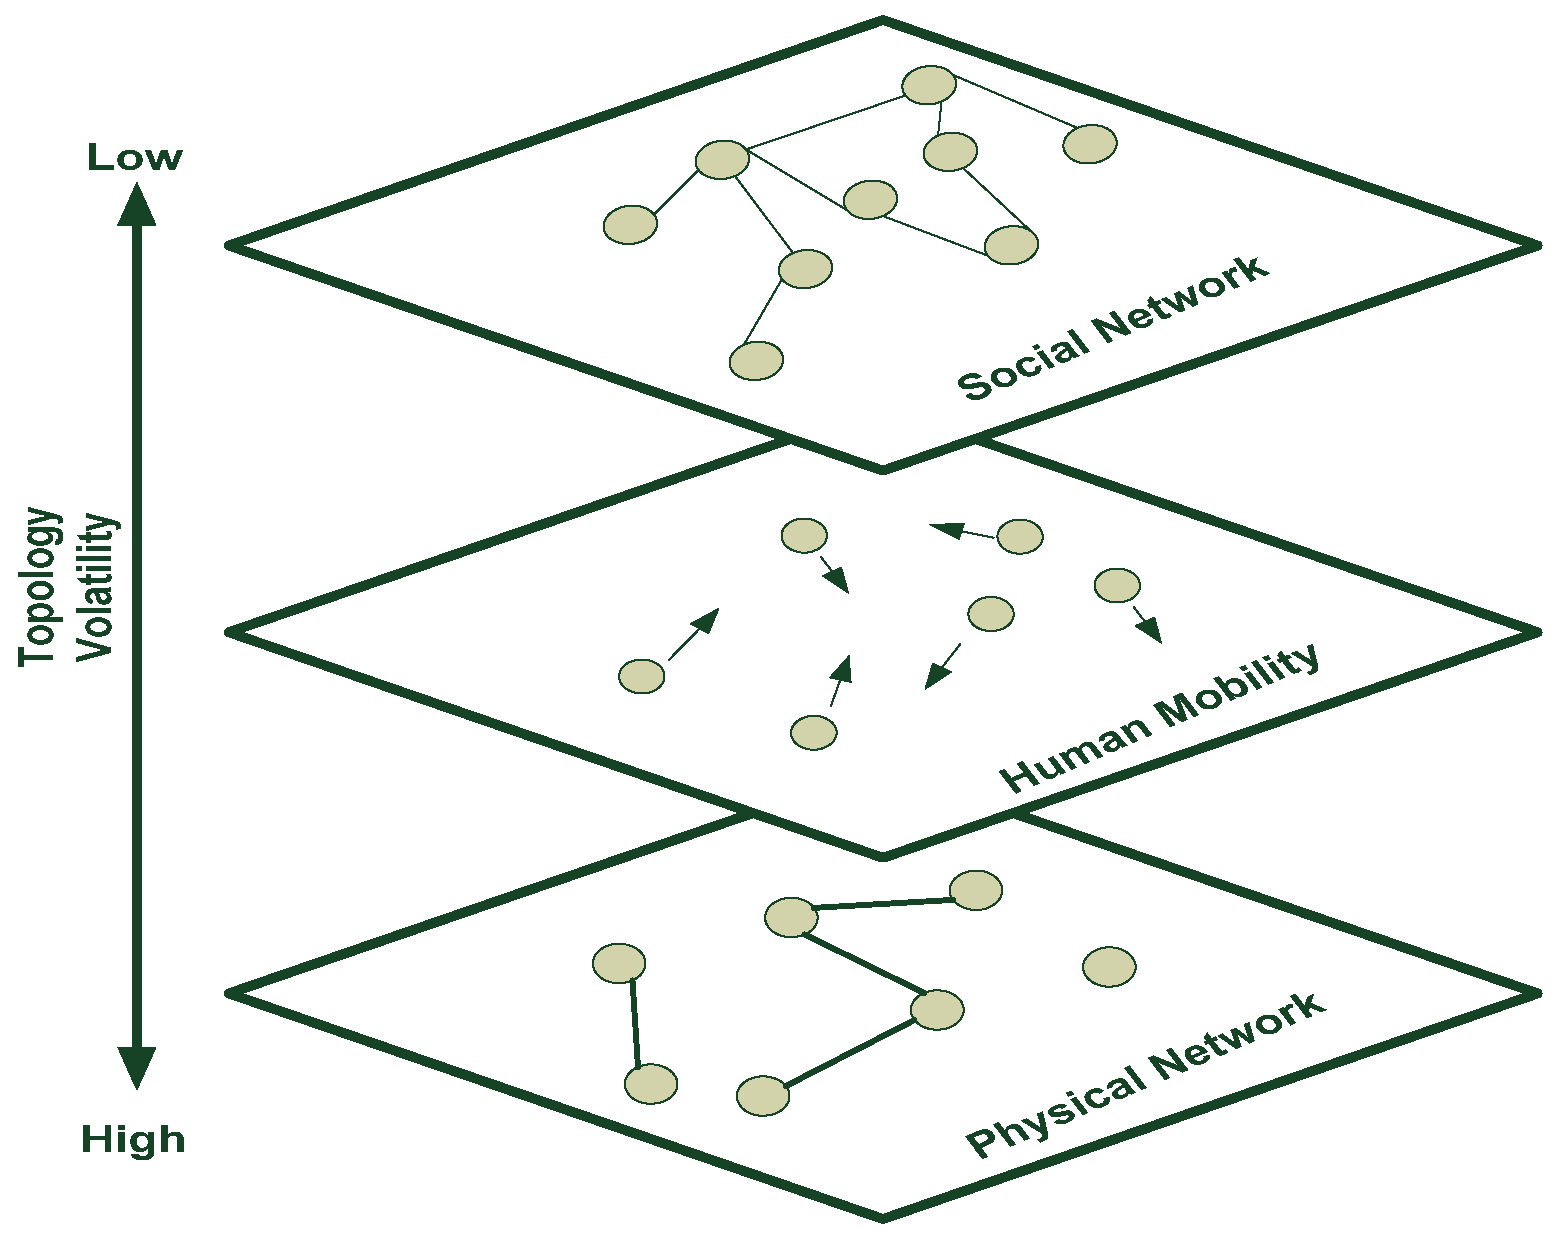
3.1. Topology Structures of Mobile Social Networks

When analysing the delivery performance of a routing algorithm, information of network topology is typically needed. The movement patterns of nodes in mobile networks have a direct impact on the networks’ topologies. Mobile social networks, in particular, are human-based networks, and node encounters in such networks represent the ways in which people interact. Yoneki et al. [38] and Hossmann et al. [5] studied the topology characteristic of mobile social networks using some realistic human mobility scenarios. They first aggregated the contact data to establish weighted contact graphs, where the link weights express the duration of contact of pairs of nodes. These graphs in turn exhibit the characteristics of social networks (a social network is a graph of human relationships formed by one or more types of interdependencies, such as mutual interests, kinship, or friendship). By applying a complex network analysis on the derived graphs, they concluded that the networks have a non-random (heterogeneous) connectivity structure, exhibiting a power-law degree distribution in which some nodes have a relatively large connectivity degree to other nodes, whereas the majority of nodes in the network have a few. The large degree nodes (so-called hub nodes) are the most popular (central) nodes in the social graph, and therefore they can act as information brokers which are capable of disseminating messages to all nodes within a relatively short delay. In Figure 1 we show the structural topology of a mobile social network: a virtual social network exists on top of a mobile social network, which is less volatile than the physical network, and this network guides humans to move.
Additionally, we conduct an online analysis in the ONE simulator [22] to investigate the node popularity distribution in mobile social networks. A node in self-organizing networks such as mobile social networks should be able to sense its own popularity throughout the network. Here, node popularity is defined as the number of different nodes contacted in a certain time window. In an aggregated contact graph, this corresponds to node degree (centrality) [21]. In this study, we consider the Reality contact traces [39] as the mobility scenario. In Figure 2 (left) we show the node degree distribution in Reality, where the degree of a node is computed in a 6-h-time-window basis. It is evident that some nodes have a degree value that is significantly larger than the network’s average degree (i.e.,   2.2). Furthermore, in Figure 2 (right) we show the node degree distribution in the Reality scenario on a log-log scale. The graphic shows that the node degree distribution follows a power-law distribution, with a low probability of finding nodes with a high degree because most network nodes have a low one. Moreover, the authors of [40] established the potential of coupling between mobile social networks and scale-free networks, which have a power-law degree distribution as their main characteristic. In other words, the degree distribution in real human-based networks differs from the Gaussian (normal) degree distribution commonly assumed in random networks.

3.2. Social-Based Routing Algorithms

Social-based routing schemes typically define a utility metric for each node when making routing choices. Clearly, a higher utility reflects a higher chance of the node to deliver a message. The method forwards the message to the contacted node with a higher utility in each contact. This best next-hop heuristic forwarding p i j f can be described as
p i j f = { 1 ,       U i < U j 0 ,       U i > U j
Nevertheless, the utility-based routing algorithms in mobile social networks have some drawbacks as follows:
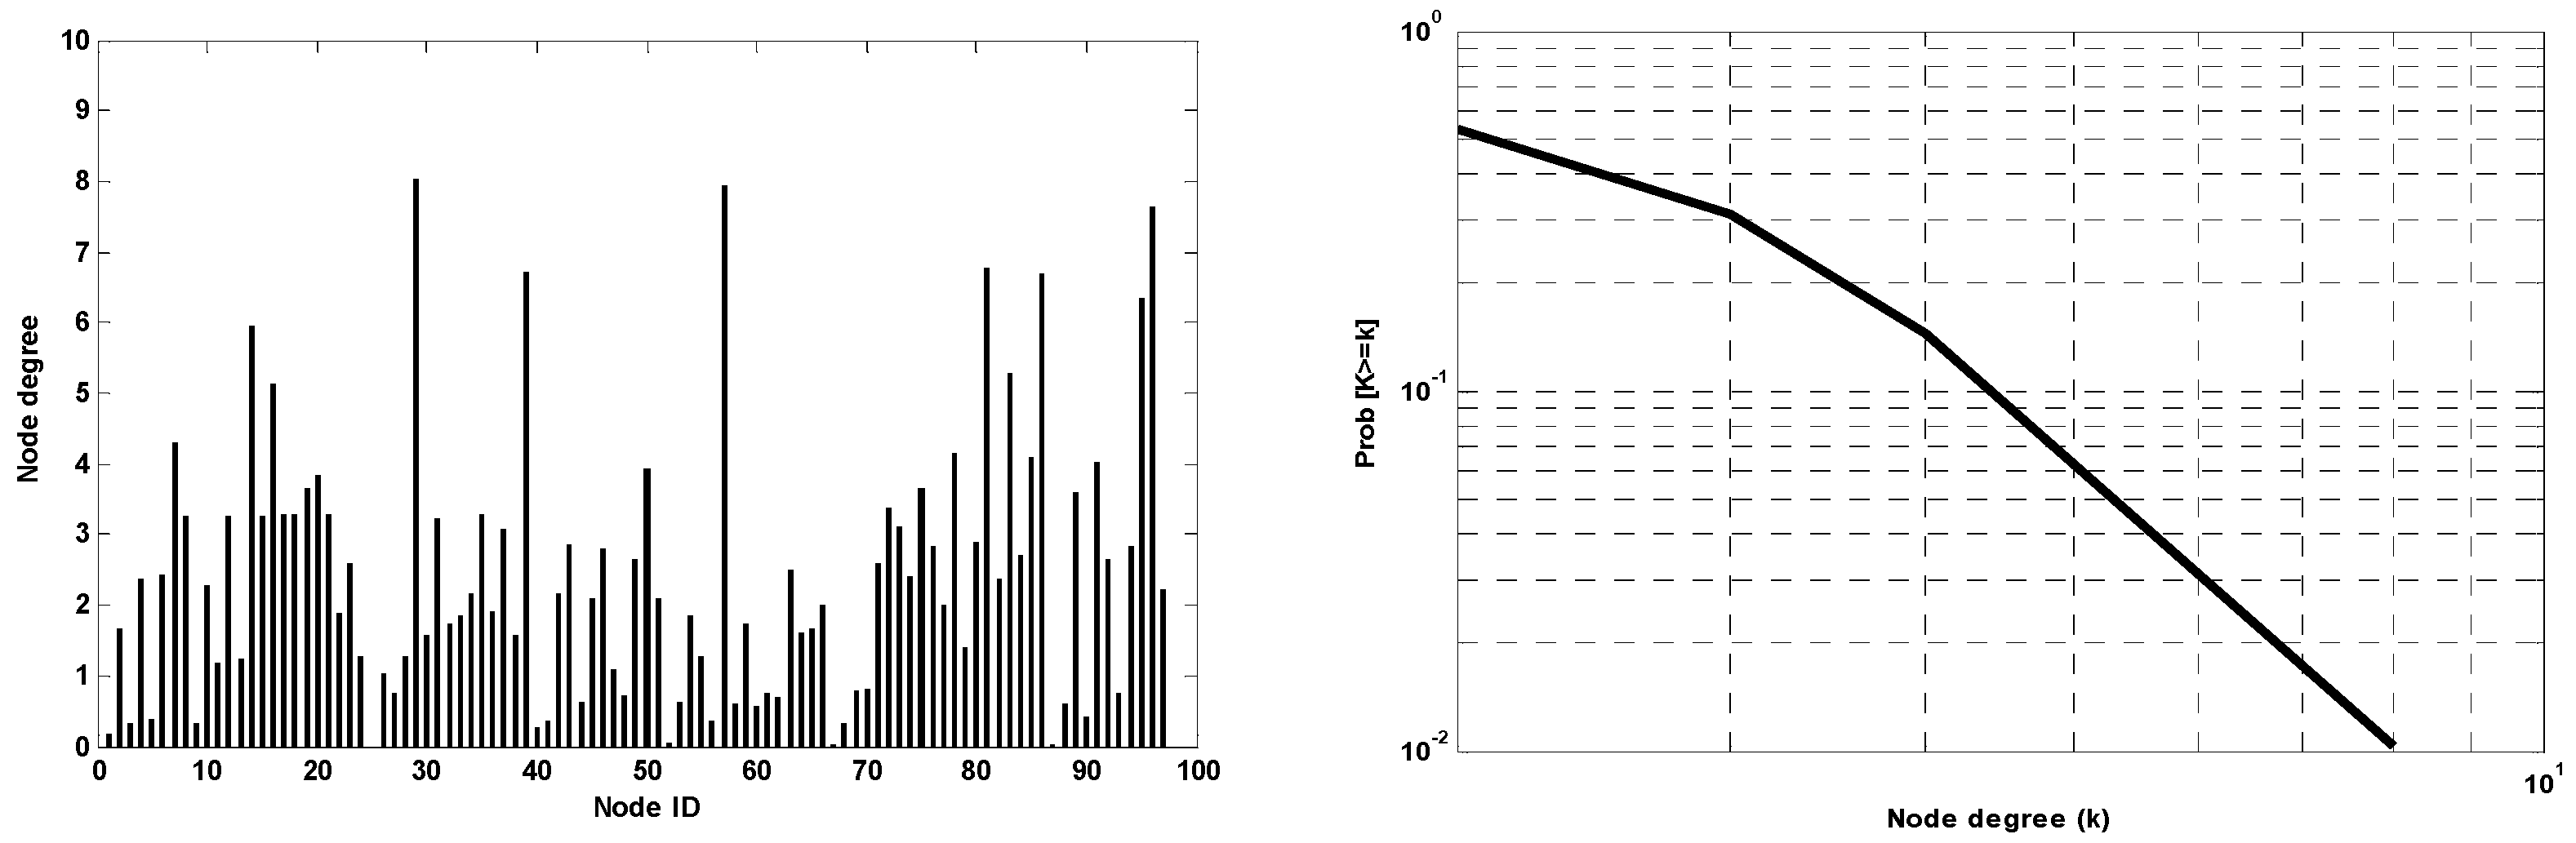
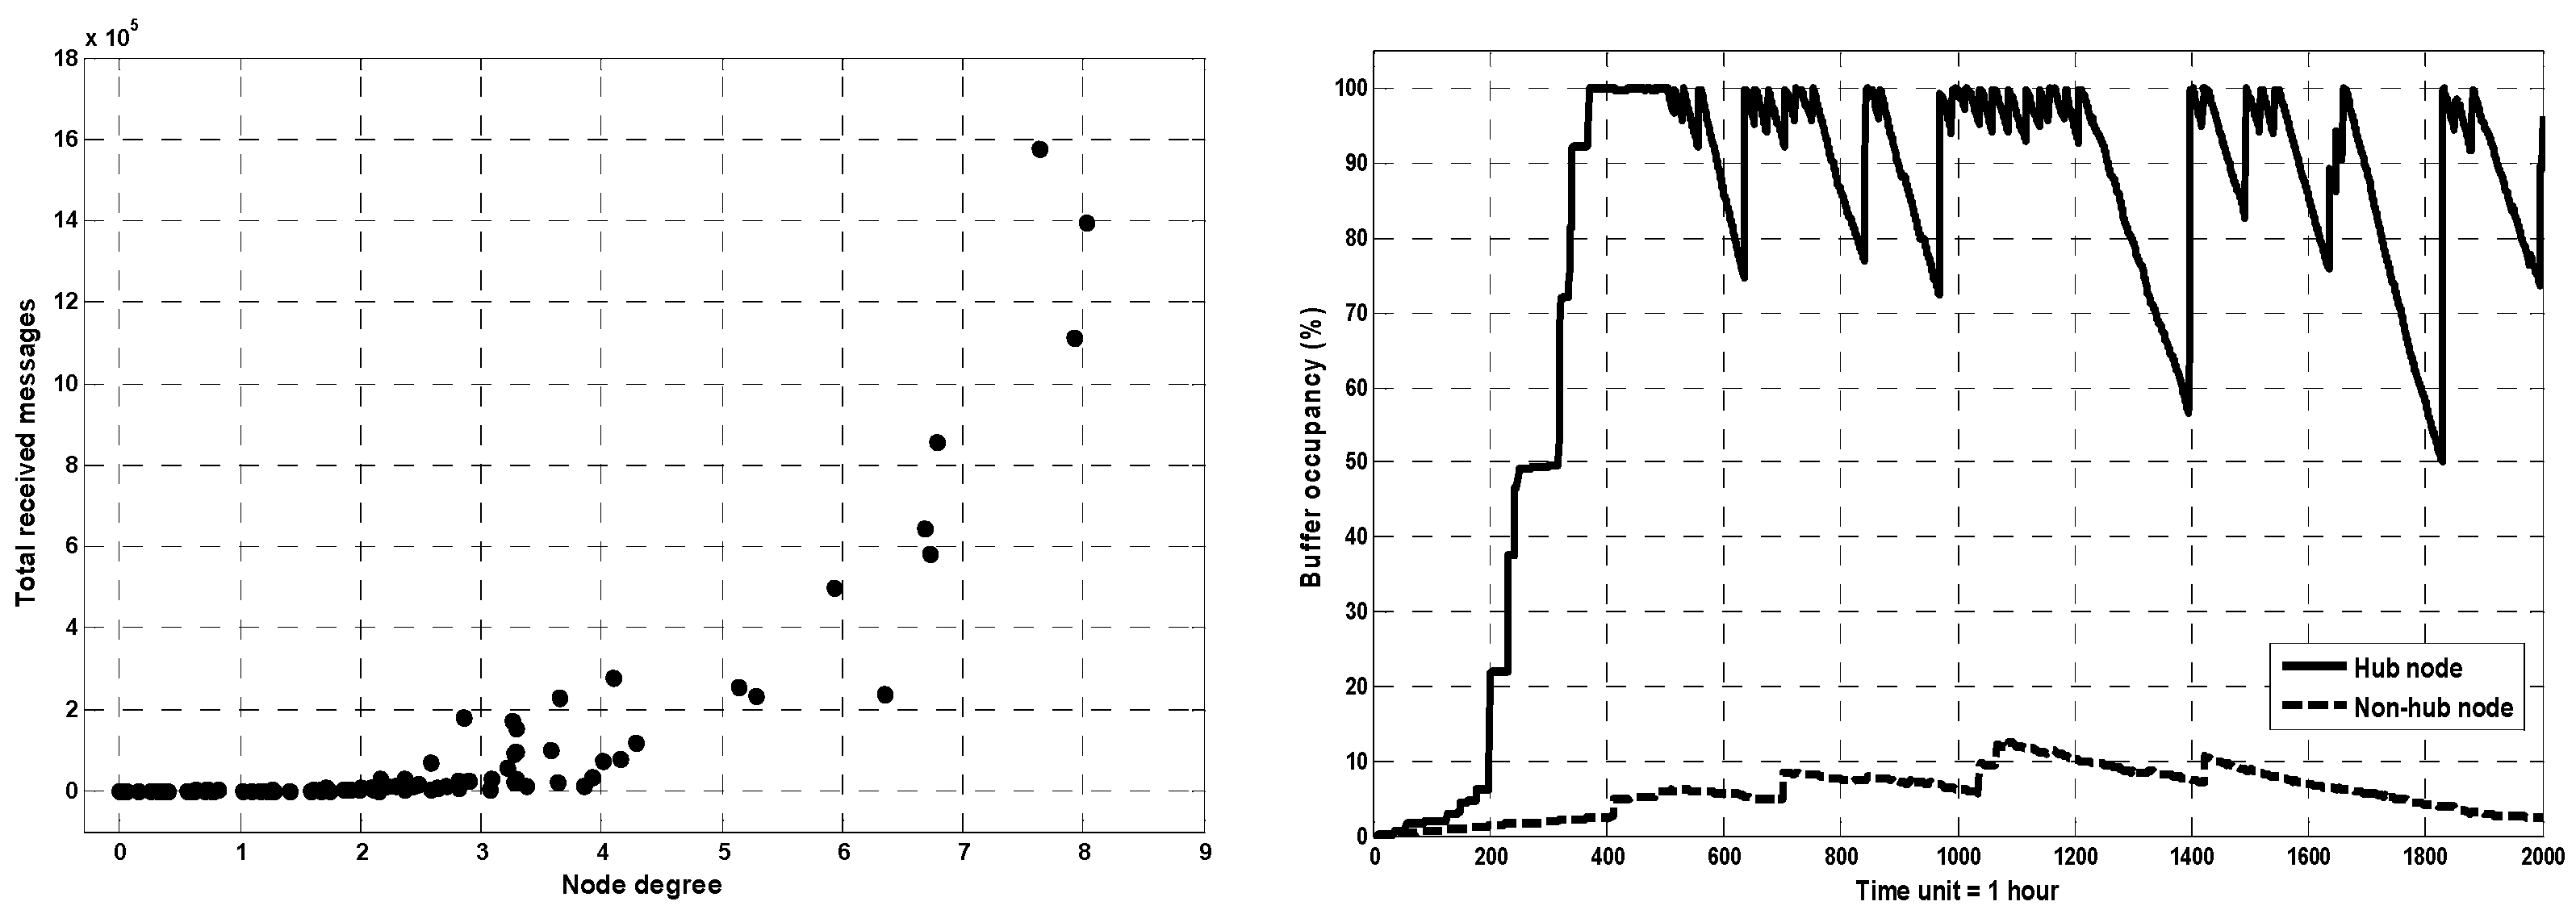
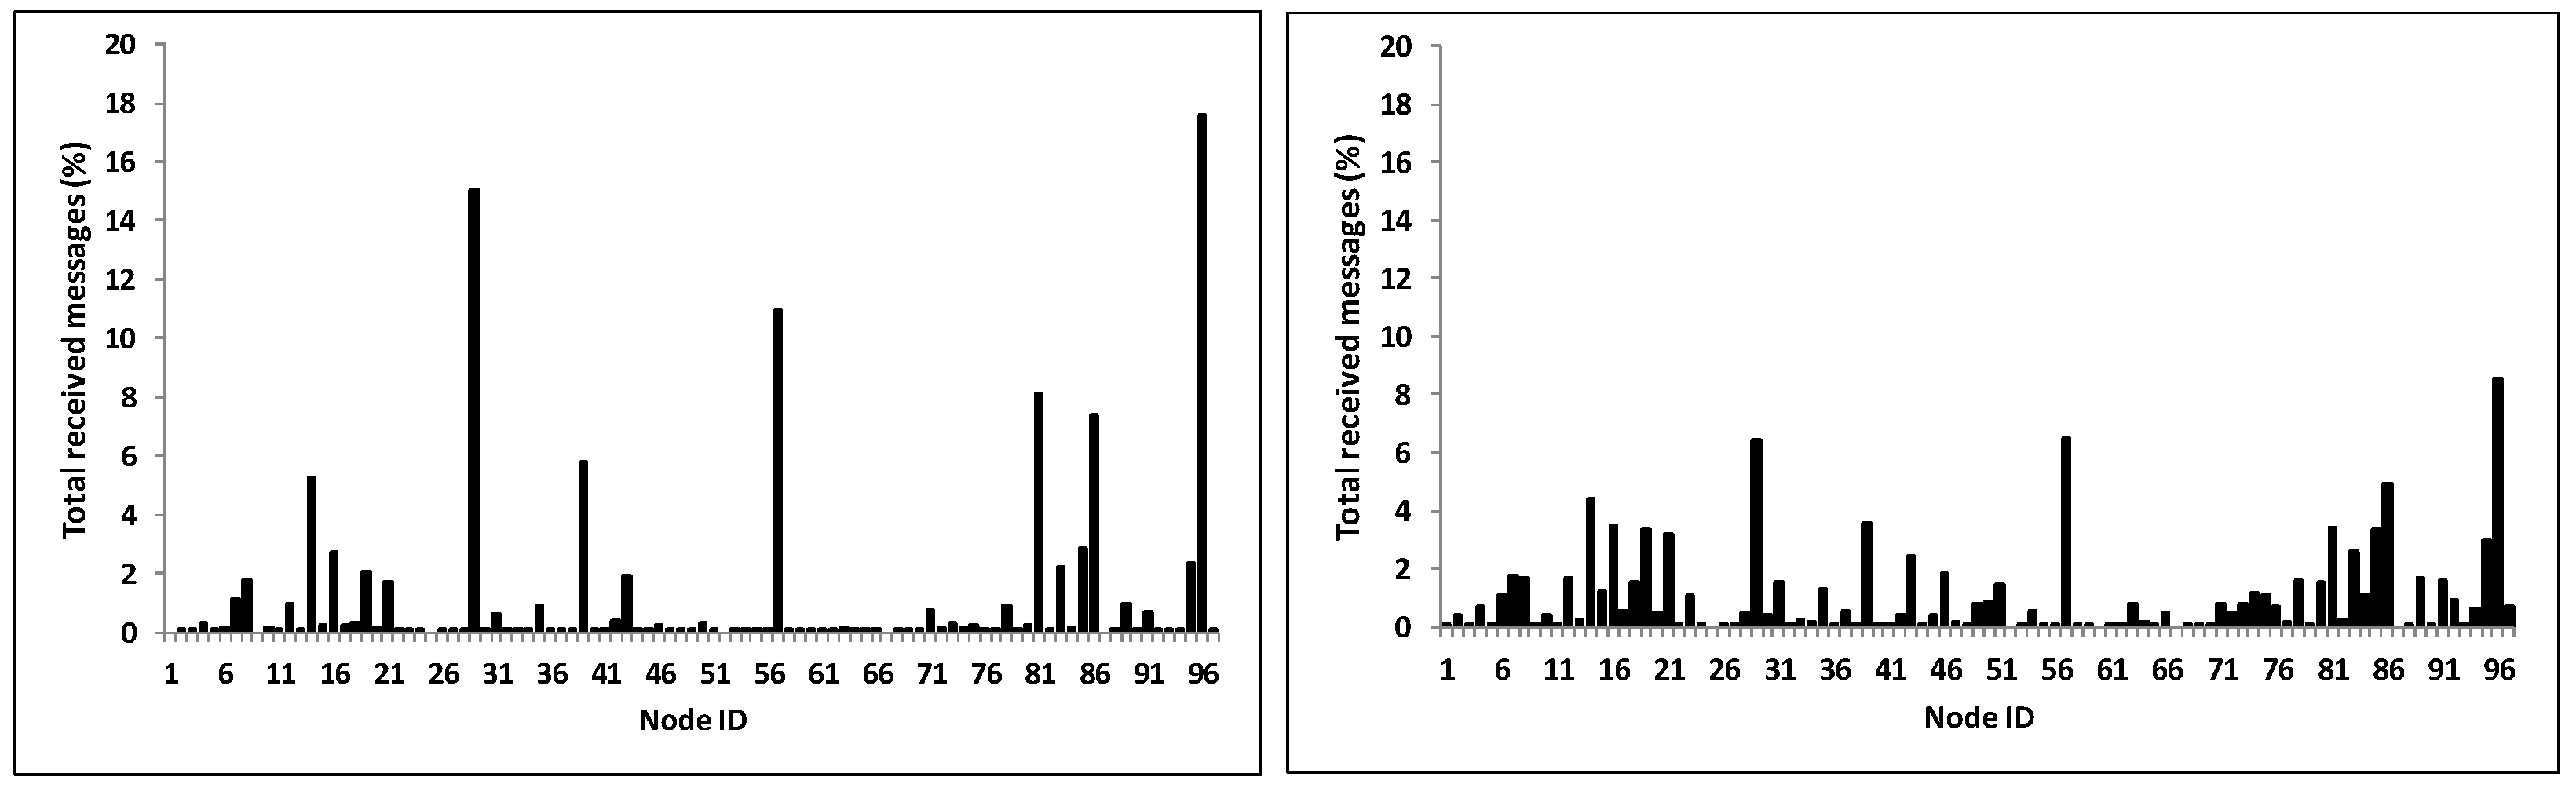
  • Hill-climbing heuristic forwarding is a pure greedy approach that sends the message to the nodes with the highest utility at each contact (hop). Fan et al. [11] used a Markov model to show that under this forwarding technique, the probability of a message reaching the greatest utility node(s) is one, implying that messages will always find the highest utility nodes in mobile social networks. Furthermore, in the following we show mathematically that the forwarding heuristic, which is biased towards higher value nodes, guides the routing algorithm to send the bulk of network traffic through the highest utility node(s) as follows. We first assume a routing strategy that determines the next-hop nodes in a random manner. The message forwarding is therefore a random walk over the graph G(V, E) mentioned above, with the transition probability matrix P, where its element p i j is defined in (1). Under this random forwarding, p i j is equal to the inverse of node i’s degree d i , or p i j = 1 / d i . In a steady state traffic flow, the chance to find a message m in node j, which also equals to j’s traffic load, can be computed as the first eigenvector of the distribution matrix Π T , with π i j = p i j   ·   ( j p i j ) 1 . Then, it is easy to see that the eigenvector for distribution matrices of networks with a non-random (heterogeneous) connectivity distribution such as mobile social networks will be skewed towards the highly connected nodes (hub nodes) under this random scheme. Eventually, this confirms the natural traffic load imbalance in the social networks. Further, if the forwarding strategy is not random, but biased towards connectivity (i.e., favouring nodes with a higher degree), the probability of hub nodes receiving relay traffic increases and the traffic load distribution becomes more unbalanced. Furthermore, using simulation in the Reality mobility scenario [39] we illustrate in Figure 3 (left) the node degree vs. node traffic load when the hill-climbing heuristic forwarding is applied on the network (here, node traffic load is defined as the total relay messages carried by a node). The graphic depicts a few the highest degree nodes handle a big portion of traffic, yet most of network nodes only process a small one. This quickly depletes the hub nodes’ constrained resources such as power and storage. For instance, we show in Figure 3 (right) the buffer occupancy changes of illustrative hub node and non-hub node in Reality. Clearly, the buffer occupancy in the hub node is regularly saturated, whereas the buffer queue on the non-hub node is normally low during the experiment.
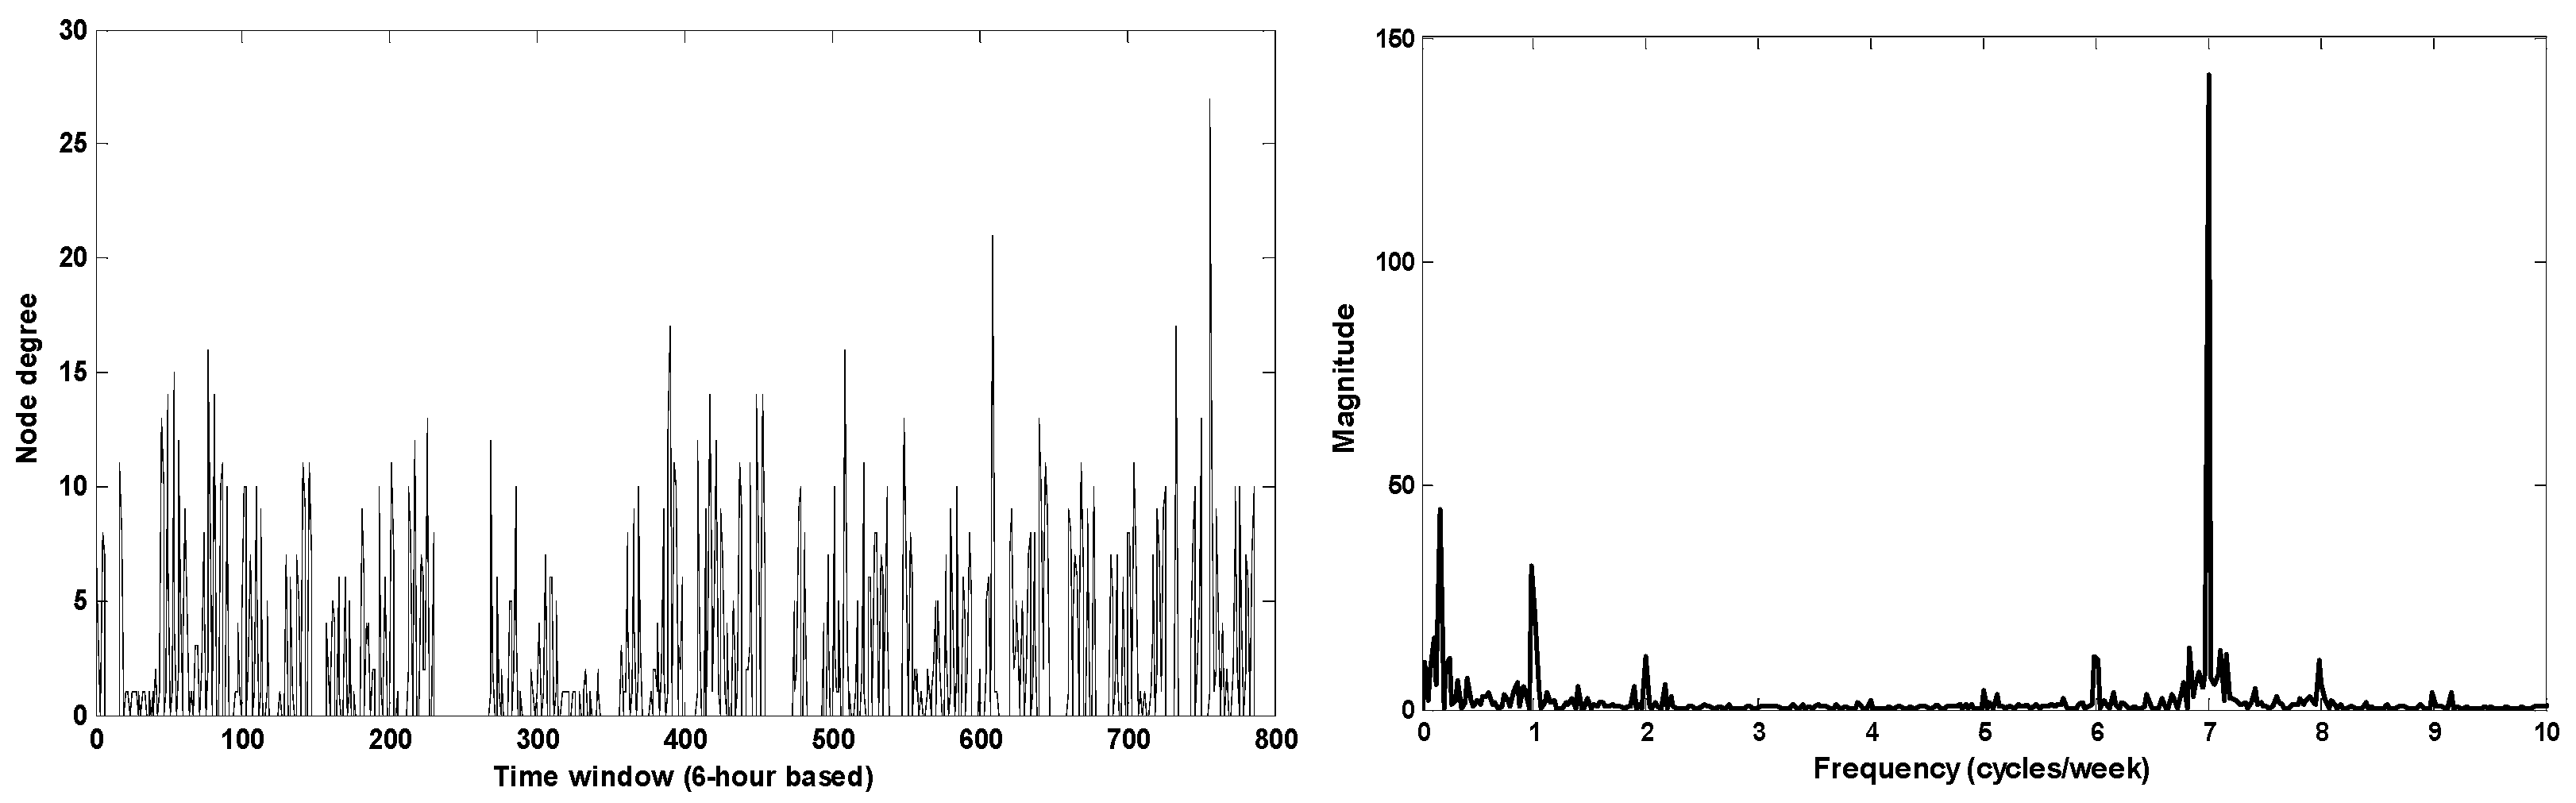
  • In mobile social networks, node utility can change over time, and a low utility node at the present time could become a good relay in the future. Most conventional utility-based forwarding algorithms, however, often ignores this. Furthermore, the studies in [18,19] showed that node popularity in human-based networks varies over time and has a periodic pattern. Considering this, when TraLDA calculates node popularity, these features will be taken into account.

4. TraLDA Design

In TraLDA, we improve the computation of node (global) popularity in mobile social networks. To determine a node’s popularity, two popularity metrics are calculated: inherent popularity and social-relations popularity. We hypothesise that inherent popularity is purely determined by the node’s own mobility pattern or sociability level, whereas social-relation popularity is derived as an advantage from relationships with more popular nodes. Finally, TraLDA uses both popularity indicators to choose optimal relays during contacts. In the following, the computations for both measures are described in detailed.

4.1. Inherent Popularity Calculation

The inherent popularity of a node is determined by its own sociability degree or movement pattern. In practice, this metric is defined based on a particular metric, such as the total contacts with different nodes in a time interval [21] or the neighbour change rate [38,41]. In the literature, the former is denoted as the node degree in an aggregated encounter graph. In TraLDA, we use node degree to quantify a node’s inherent popularity. Moreover, our investigation below shows that node degree in mobile social networks fluctuates significantly over time and exhibits some periodicity. Thus, it is important to take into account these features when calculating node degree at a given time. Finally, we introduce a novel calculation of node degree using the Kalman prediction [17] which consider the periodicity of human behaviour.
We begin by looking into the node degree change characteristics in mobile social networks using real human movement cases. The Reality trace dataset [39] is used in this study because it consists of a large number of nodes and spans a lengthy period of time. Furthermore, an instantaneous node degree is estimated by the number of distinct nodes contacted in a given time window. In the case of Reality, we chose a time window of 6 h as the basis for node degree calculation based on a study in [21] that found that individuals’ daily life is typically separated into four main periods of 6 h each: morning, afternoon, evening, and night (however, for a detailed discussion of the impact of time window scale choices on the node degree calculation, see [42]).
We now depict changes in node degree in the Reality scenario; for instance, in Figure 4 (left), we present the node degree variations of an illustrative hub node in Reality. We notice that the node’s degree changes dramatically and rapidly over time. Subsequently, we use a periodogram analysis [43] to find the main periods (frequencies) within the node’s degree data series. We display the discovered periodicities of the hub node’s degree in Figure 4 (right). The figure clearly shows that the degree of the hub node firmly demonstrates a 7-days (weekly) period (moreover, our investigation on all the nodes in Reality finds that majority of the nodes possess a weekly cycle of their popularities as well). Indeed, the Reality dataset logged MIT staff and student activities on campus, which are higher during the weekdays but lower on weekends due to less interactions. Nevertheless, depending on the experimental setting, distinct human encounter datasets may have different periodicities.
The structural component of the node degree data series in Figure 4 (left) is then observed using a discrete time series analysis. A discrete time series is a set of observations y t logged regularly at a specific time interval. In the traditional decomposition model [44], y t can be broken down into a trend component, a seasonal (periodic) component with period d, and a random noise component. We apply a seasonal filter [45] to the given data series to get estimated periodic data: In Figure 5 (upper), we present the long-term seasonal data of the data series; finally, by removing the periodic data from the original data, deseasonalized data are obtained (shown in Figure 5 (lower)), consisting of a random noise element and a less obvious trend element.
Based on the previous analysis, we now use the Kalman-filter theory [17] to develop an estimation model of the time series data to compute a node’s inherent popularity in a time interval. The Kalman filter is widely used in control system design to estimate unmeasured process conditions. It can calculate the best estimates of the current states of a dynamic system defined in a state vector. The state is updated based on periodic observations of the system. We use a typical state space model [46] to express the problem in our model. Furthermore, we only investigate the case when a seasonal component dominates the time series (see [47] for the discussion of Kalman prediction for a complete model). The state space model is constituted by two scalar equations, namely the observation equation and the state equation. For our model with (only) a seasonal component, the observation equation is given as follows
y t = S t + W t   ,               t = 1 , 2 ,  
where S t is a state variable and W t is an additive white noise with zero mean and variance σ w 2 ( W t = W N ( 0 , σ w 2 ) ). Furthermore, when we consider S t representing a seasonal component with a period d such that S t + d = S t and t = 1 d S t = 0 , it is therefore possible to determine S t + 1 as
S t + 1 = S t S t 1 S t d + 2
For a more general expression of S t allowing random deviations to exist in the periodicity, a white noise term V t ( V t = W N ( 0 , σ w 2 ) ) is added in the right hand side of (4). Afterwards, regarding only the seasonal effect on the series, in order to obtain the state equation for our model, we introduce ( d 1 ) dimensional state vector X t defined as
X t = [   S t       S t 1         S t d + 2 ] T
and the series S t is determined as
S t = [ 1     0     0     0           0 ]   X t
For the purpose of the derivation of Kalman prediction, the observation equation in (3) is now rewritten in a general form as follows
Y t =   G t X t + W t
with G t = [ 1   0   0   0     0 ] , and X t satisfies the state equation
X t + 1 =       F t X t + V t
with V t = [ σ v 2   0   0     0 ] T , and F t = [ 1 1   1 1     1         0         0       0     0         1         0       0                                   0         0         1       0 ] .
Given the observation equation in (7) and the state equation in (8), the recursive equations of Kalman-filter for the estimation of the values of the series are defined as follows. Considering the initial settings as
X ^ 1 = P ( X 1 | Y 0 )
Ω 1 = E ( X 1 X ^ 1 ) ( X 1 X ^ 1 ) T
the Kalman recursive equations are then given as
X ^ t + 1 = F t X ^ t + Θ t Δ t 1 ( Y t G t X ^ t )
Ω t + 1 = F t Ω t F t T + Q t Θ t Δ t 1 Θ t T
where Δ t = G t Ω t G t T + R t , Θ t = F t Ω t G t T , Q t = [ σ v 2 0 0 0   σ v 2 0 0   0       0 σ v 2 ] , and R t = σ w 2 .
As an example of node popularity estimation using the Kalman prediction, we discuss in Section 5.2 the Kalman estimates of the hub node’s degree compared with the actual values of the node degree in the Reality mobility scenario (for the detail implementation of the Kalman prediction on the node degree calculation in the ONE simulator, please refer to https://github.com/soelistijanto/TraLDA/routing/community/KalmanDegree.java (accessed on 14 June 2022).

4.2. Social-Relations Popularity Calculation

An individual can gain (social) benefits from relationships with her more central or popular acquaintances in a social network. Depending on the substance of the relations, measures of node centrality can be classified as undirected (symmetric) relations, such as friendship and kinship, or directed (asymmetric) relations, such as choice and influence. Moreover, in directed graphs centrality is known as “prestige” [48], where the direction of the interaction is a key attribute for this metric. For instance, individuals who are picked as friends by many others have a special status–prestige in the group. In the literature, there exist metrics of prestige which consider both direct and indirect social influences. For instance, the centrality measures in [37,49] are based on the assumption that the importance of a node in the network is determined by the importance of its neighbours. Thus, these metrics take into account both a node’s connectivity to other nodes and its proximity to other important nodes.
We now mention one of the widely used centrality measures, the Katz’s prestige measure [37]. This defines the prestige of node i in the graph G, denoted by C K a t z ( i ) , as the sum of the prestige of all i’s neighbours divided by their degrees. Node i therefore gains its prestige from having a neighbour j with higher prestige. This i’s prestige is however corrected by the number of neighbours of j, so if j has more relations, then i gains less prestige from friendship with j. This adjustment might be thought of correcting for i’s time spent with or relative access to j. As a result, node i’s Katz centrality in the graph G is determined as follows:
C K a t z ( i ) = j i   g i j   C K a t z ( j ) d j  
where g i j = 1 if there is a relation between i and j, or “0” otherwise, and d j is the degree of j representing the number of j’s neighbours.
Inspired by the Katz’s centrality measure, we introduce social-relations popularity, the node’s popularity derived from relationships with more popular nodes. This distributes the popularity of more (socially) important nodes to their less important neighbours, and thus takes neighbours’ popularity into account when calculating a node’s popularity. We employ (13) to compute a node’s social-relations popularity in a given time window as follows. To begin, we suppose that social influence occurs in only one direction, with nodes with lower popularity can only receive social benefits from their more popular neighbours; for instance, from (13) we can deduce influence from j towards i, denoted by g j i = 1 , exists when C K a t z ( j ) > C K a t z ( i ) or “0” otherwise, and therefore g j i g i j . Second, we assume that the popularity of a more important node is shared by its less important neighbours and is weighted by the strength of their interactions with the given node. As a result, the higher (social) level node gives more effect on the closer neighbours. Finally, the social-relations popularity of node i in time window t is defined as follows
P s o c t ( i ) = j F ( i )     g j i   ·   w j i k F ( j )       g j k   ·   w j k     ·     P ¯ g l o b a l t   ( j )  
where g j i denotes the presence of a (social) influence of j towards i: g j i = 1 for P ¯ g l o b a l t ( j ) > P ¯ g l o b a l t ( i ) , or =0 otherwise, F ( i ) represents the set of i’s friends,   w j i is the connection strength of i and j, and P ¯ g l o b a l t ( j ) is the cumulative mean of global popularity in time window t calculated as follows
P ¯ g l o b a l t ( j ) = t = 1 t 1 P g l o b a l t ( j ) / ( t 1 )
where P g l o b a l t ( j ) is the instantaneous global popularity of j in time window t computed using (16) below.
To present an example of the calculation of node social-relations popularity, we consider a simple neighbourhood of node A in Figure 6, comprising four neighbours with different levels of global popularity at a time t. Between a pair of nodes A and B, a black line indicates the social connection between them, with w A B representing their connection strength (e.g., measured in total contact duration (seconds)). A red dotted vector, on the other hand, denotes the influence of node B to A: g B A = 1 if P ¯ g l o b a l t ( B ) > P ¯ g l o b a l t ( A ) , and =0 otherwise. Finally, the social-relations popularity of node A at time t is calculated as:
P s o c t ( A ) = g B A   ·   w B A   · P ¯ g l o b a l t   ( B )   g B A   ·   w B A + g B C   ·   w B C + g C A   ·   w C A   · P ¯ g l o b a l t   ( C )   g C A   ·   w C A + g C B   ·   w C B + g D A   ·   w D A   · P ¯ g l o b a l t   ( D )   g D A   ·   w D A + g D E   ·   w D E + g E A   ·   w E A   · P ¯ g l o b a l t   ( E )   g E A   ·   w E A + g E D   ·   w E D P s o c t ( A ) = 1   ·   2000   ·   7   1   ·   2000 + 0   ·   1200 + 1   ·   800   ·   10   1   ·   800 + 1   ·   1200 + 0   ·   3000   ·   3   0   ·   3000 + 0   ·   700 + 1   ·   2500   ·   8   1   ·   2500 + 1   ·   700 P s o c t ( A ) = 7 + 4 + 0 + 6.25 = 17.25

4.3. TraLDA Distributed Algorithm

In TraLDA, we combine a node’s inherent popularity and social-relations popularity to assess its global popularity. The instantaneous global popularity of node I in time window t, denoted by P g l o b a l t ( i ) , is represented by
P g l o b a l t ( i ) = P i n h r t ( i ) + ξ   ·   P s o c t ( i )
where P i n h r t ( i ) and P s o c t ( i ) are node i’s inherent and social-relations popularity, respectively, in time window t, and ξ is a social influence factor which controls the impact of neighbours’ influences on the overall i’s popularity and is defined between 0 ξ 1 . When ξ = 0 , neighbours’ influences disappear, and the node’s global popularity is solely dependent of its own behaviour. The metric P g l o b a l t ( i ) is further used by TraLDA to select optimal relays during node contacts.
We now discuss how TraLDA is implemented in a distributed environment. In self-organizing networks such as mobile social networks, a node should be able to perceive its immediate neighbours autonomously. In TraLDA, we use the terminology “familiar set” in [50] to refer to a node’s group of friends (direct neighbours) (hereafter, called a friendship set F). Every node stores a map of the contacted nodes together with their total encounter times. When the pairwise total contact time surpasses a given friendship threshold F t h , the contacted node is added in the given node’s friendship set. This implies that the two nodes now have a link, and in turn, we apply a direction and a weight on this connection to indicate the direction of social impact and the strength of the tie between them, respectively. Finally, in Algorithm 1 we describe how to calculate node popularity in mobile social networks using the TraLDA distributed algorithm. When a contact occurs in time window t and the contacted node is in the current node’s friendship set, the two nodes exchange two items of data to compute their social-relations popularities: P ¯ g l o b a l t 1 ( · ) the mean of global popularity in time window t 1 , and t s l o w e r ( · ) the total strength of connections to the less popular neighbours. The latter is computed as k F ( j )   g j k   ·   w j k , where k is the direct neighbours of j, w j k is the connection strength of j and k, and g j k is the existence of influence of j towards k. The current node modifies its social-relation popularity and then recalculates both its instantaneous global popularity and cumulative average global popularity based on this peer’s data. When the contact ends, if the contacted node is not in the friendship set yet, then the current node updates a map ( p e e r ,   t s ( p e e r ) ) . Finally, the peer will be added to the friendship set when t s ( p e e r ) exceeds the threshold F t h (the implementation of the TraLDA distributed algorithm in the ONE simulator is available online at https://github.com/soelistijanto/TraLDA (accessed on 14 June 2022).
Algorithm 1: TraLDA node global popularity calculation (i).
require :   P s o c 0 ( i ) 0 ,   P ¯ g l o b a l 0 ( i ) 0
while i encounters j in time window t do
/*update current node’s global popularity based on the peer’s information*/
if j F ( i )  then
send   ( P ¯ g l o b a l t 1 ( i ) ,   t s l o w e r ( i ) )
receive   ( P ¯ g l o b a l t 1 ( j ) ,   t s l o w e r ( j ) )
calculate   P s o c t ( i )         (14)
calculate   P i n h r t ( i )         (9)–(12)
calculate   P g l o b a l t ( i )         (16)
calculate   P ¯ g l o b a l t ( i )        (15)
end if

/* exchange instantaneous node global popularity */
send   P g l o b a l t ( i )
receive   P g l o b a l t ( j )

/*when the contact ends*/
if   j F ( i )  then
update map   ( j ,   t s ( j ) )
if   ts ( j )   >   F t h   then   F ( i ) j
end if
end if
end while

5. Simulation and Discussion

5.1. Simulation Setup

The scenarios of simulations and evaluation metrics considered in the TraLDA’s investigation are now discussed. We implement TraLDA and the algorithm benchmarks in the Opportunistic Network Environment (ONE) simulator [22]. For the simulations, we vary the total number of nodes and simulation time dependent of the mobility scenarios. A warm-up phase of 30% of the simulation duration is used to enable nodes to gather information about the network’s states. We set the node buffer to 20 MB, while the message size and its TTL are set to 10 kB and 7 days, respectively. A new message is generated at a rate of 12 messages per hour at a random node, and is directed to a randomly selected destination. For each algorithm, the simulations are run five times with distinct random number seeds.
For mobility scenarios, we use two realistic, long period of human encounter datasets, Reality [39] and Sassy [51]. In Reality, 100 mobile phones were carried by MIT staffs and students for nine months. The phones were running software that performed Bluetooth device discovery every 5 min, logging contacts with nearby Bluetooth-enabled devices. The dataset gathered device contacts in the campus over the given period. The traces were acquired in Sassy, however, utilising tMote invent devices carried by academics of University of St. Andrews. The invent devices were designed to broadcast beacons every 6.67 s to detect other devices within a 10-m radius. The experiment was conducted for 74 days, where they were asked to bring the devices at all times, whether in or out the town.
For performance evaluation, we utilise the following evaluation metrics:
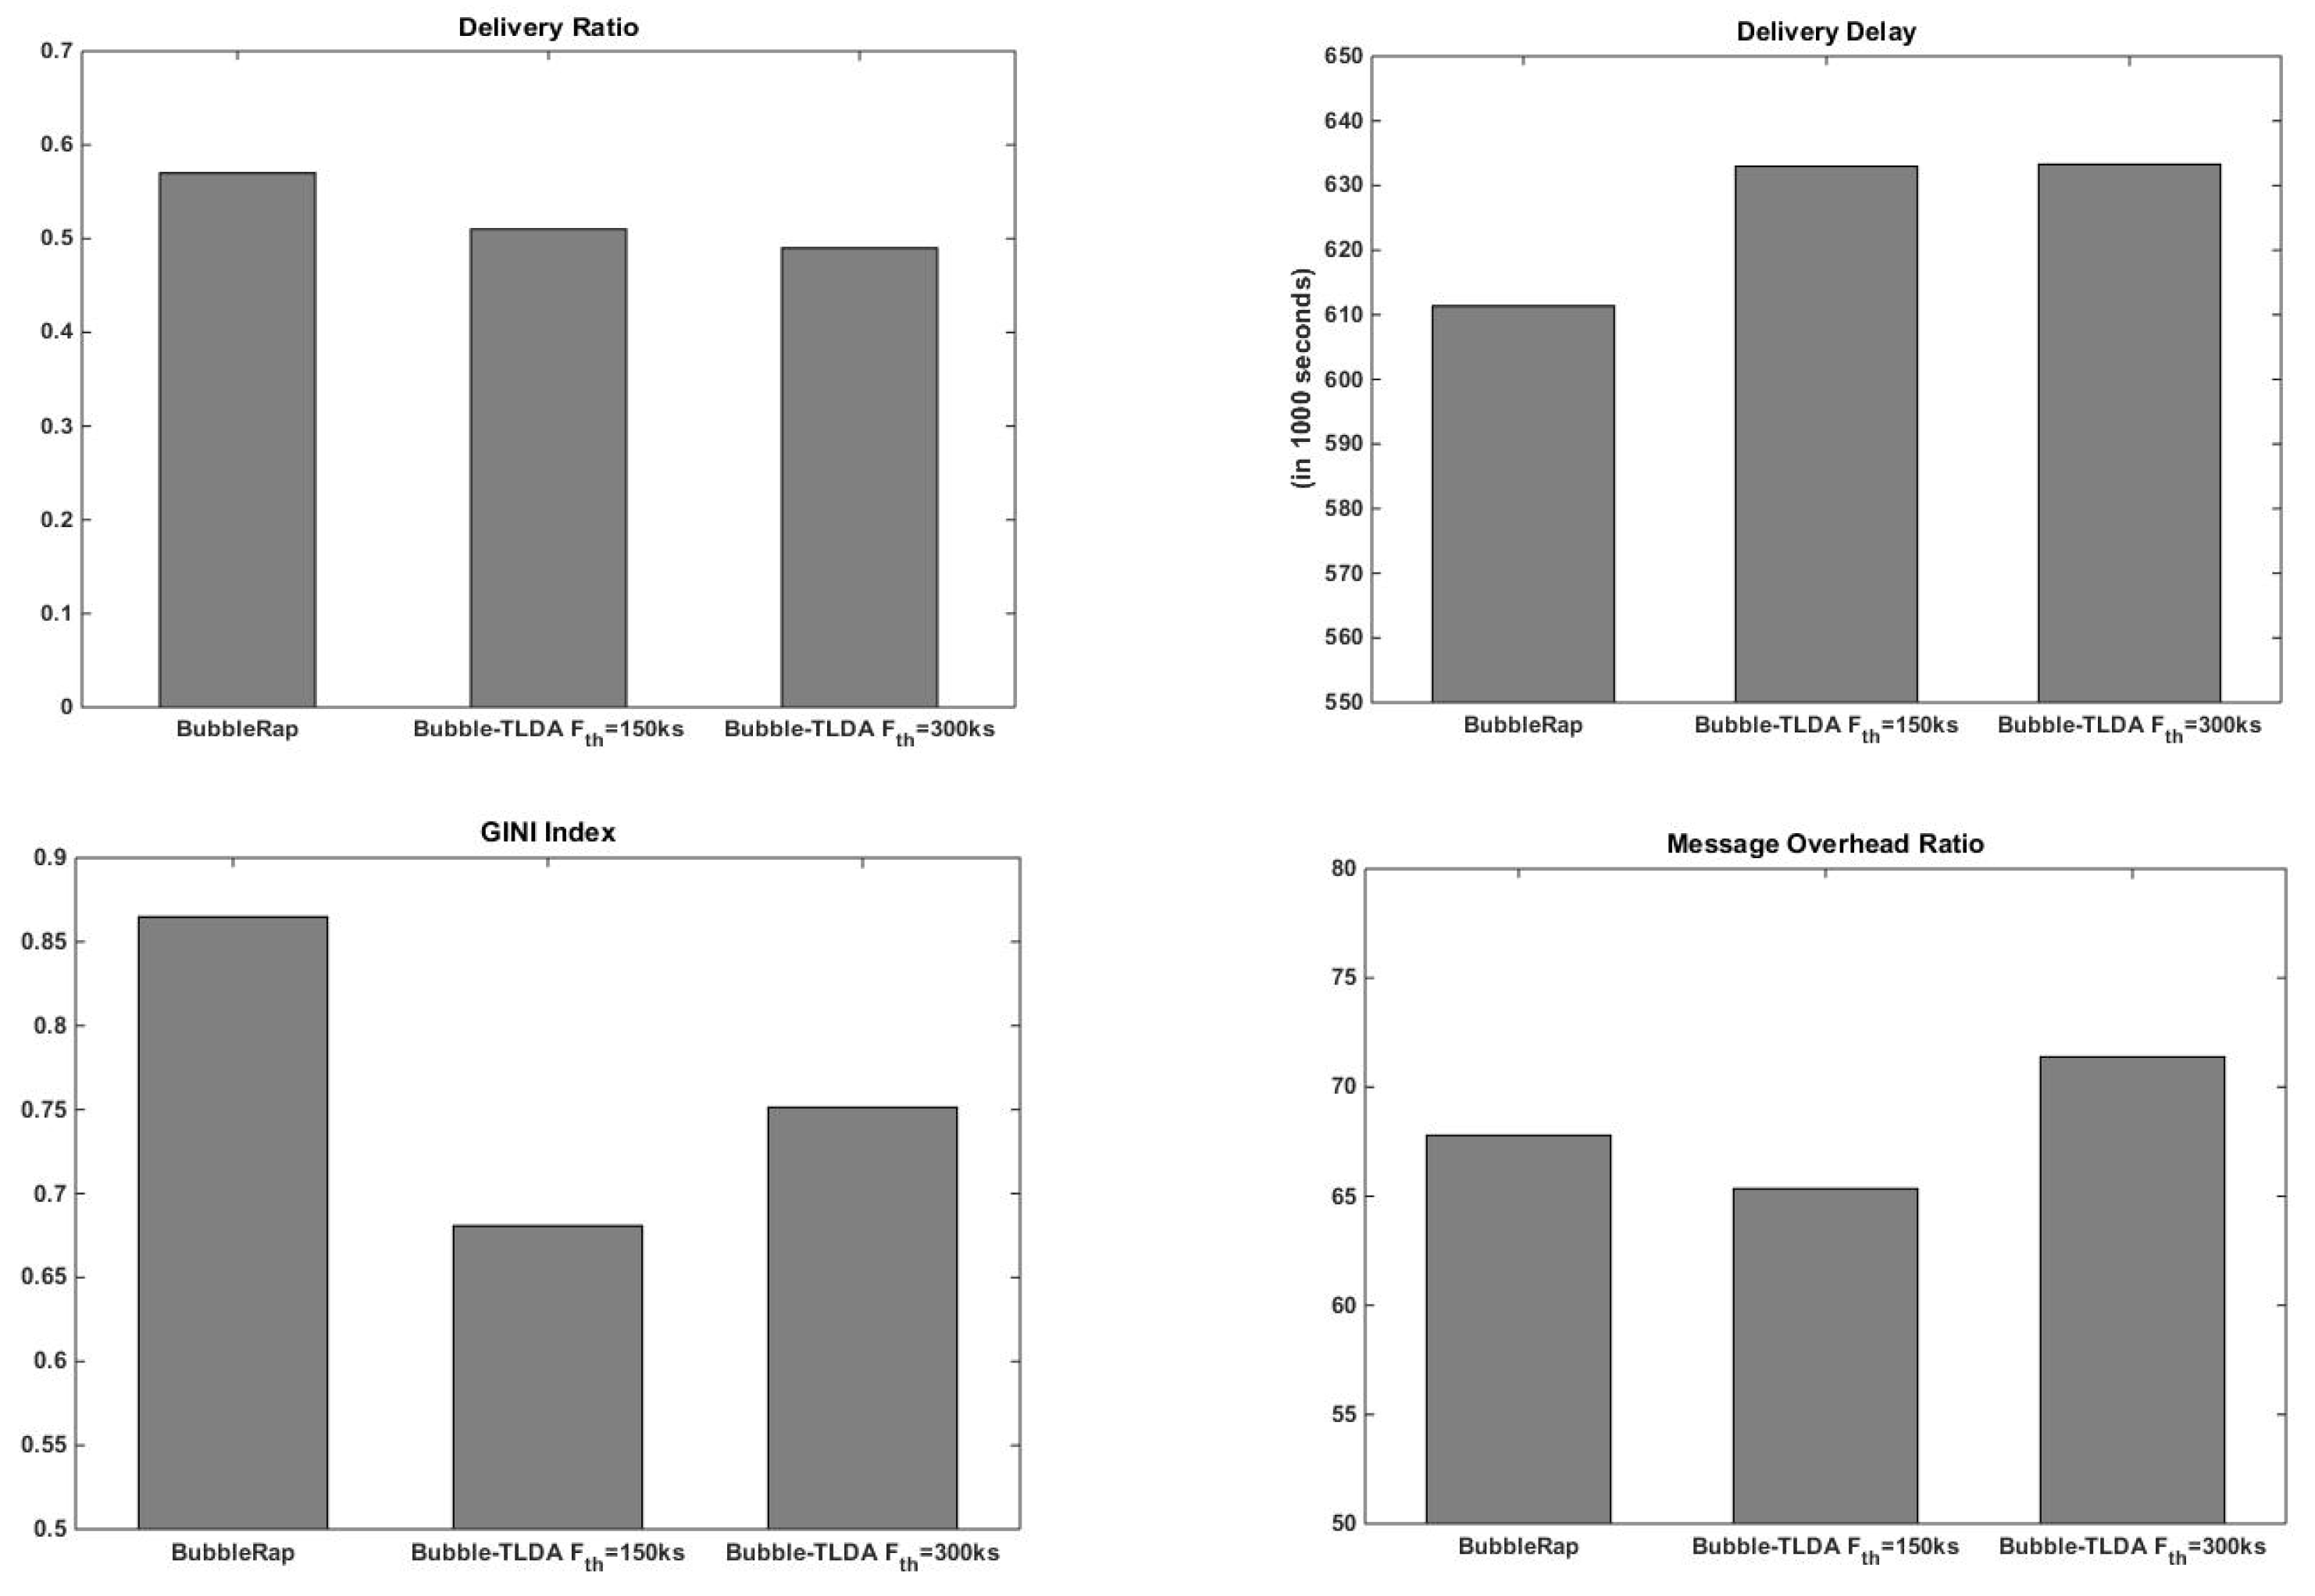
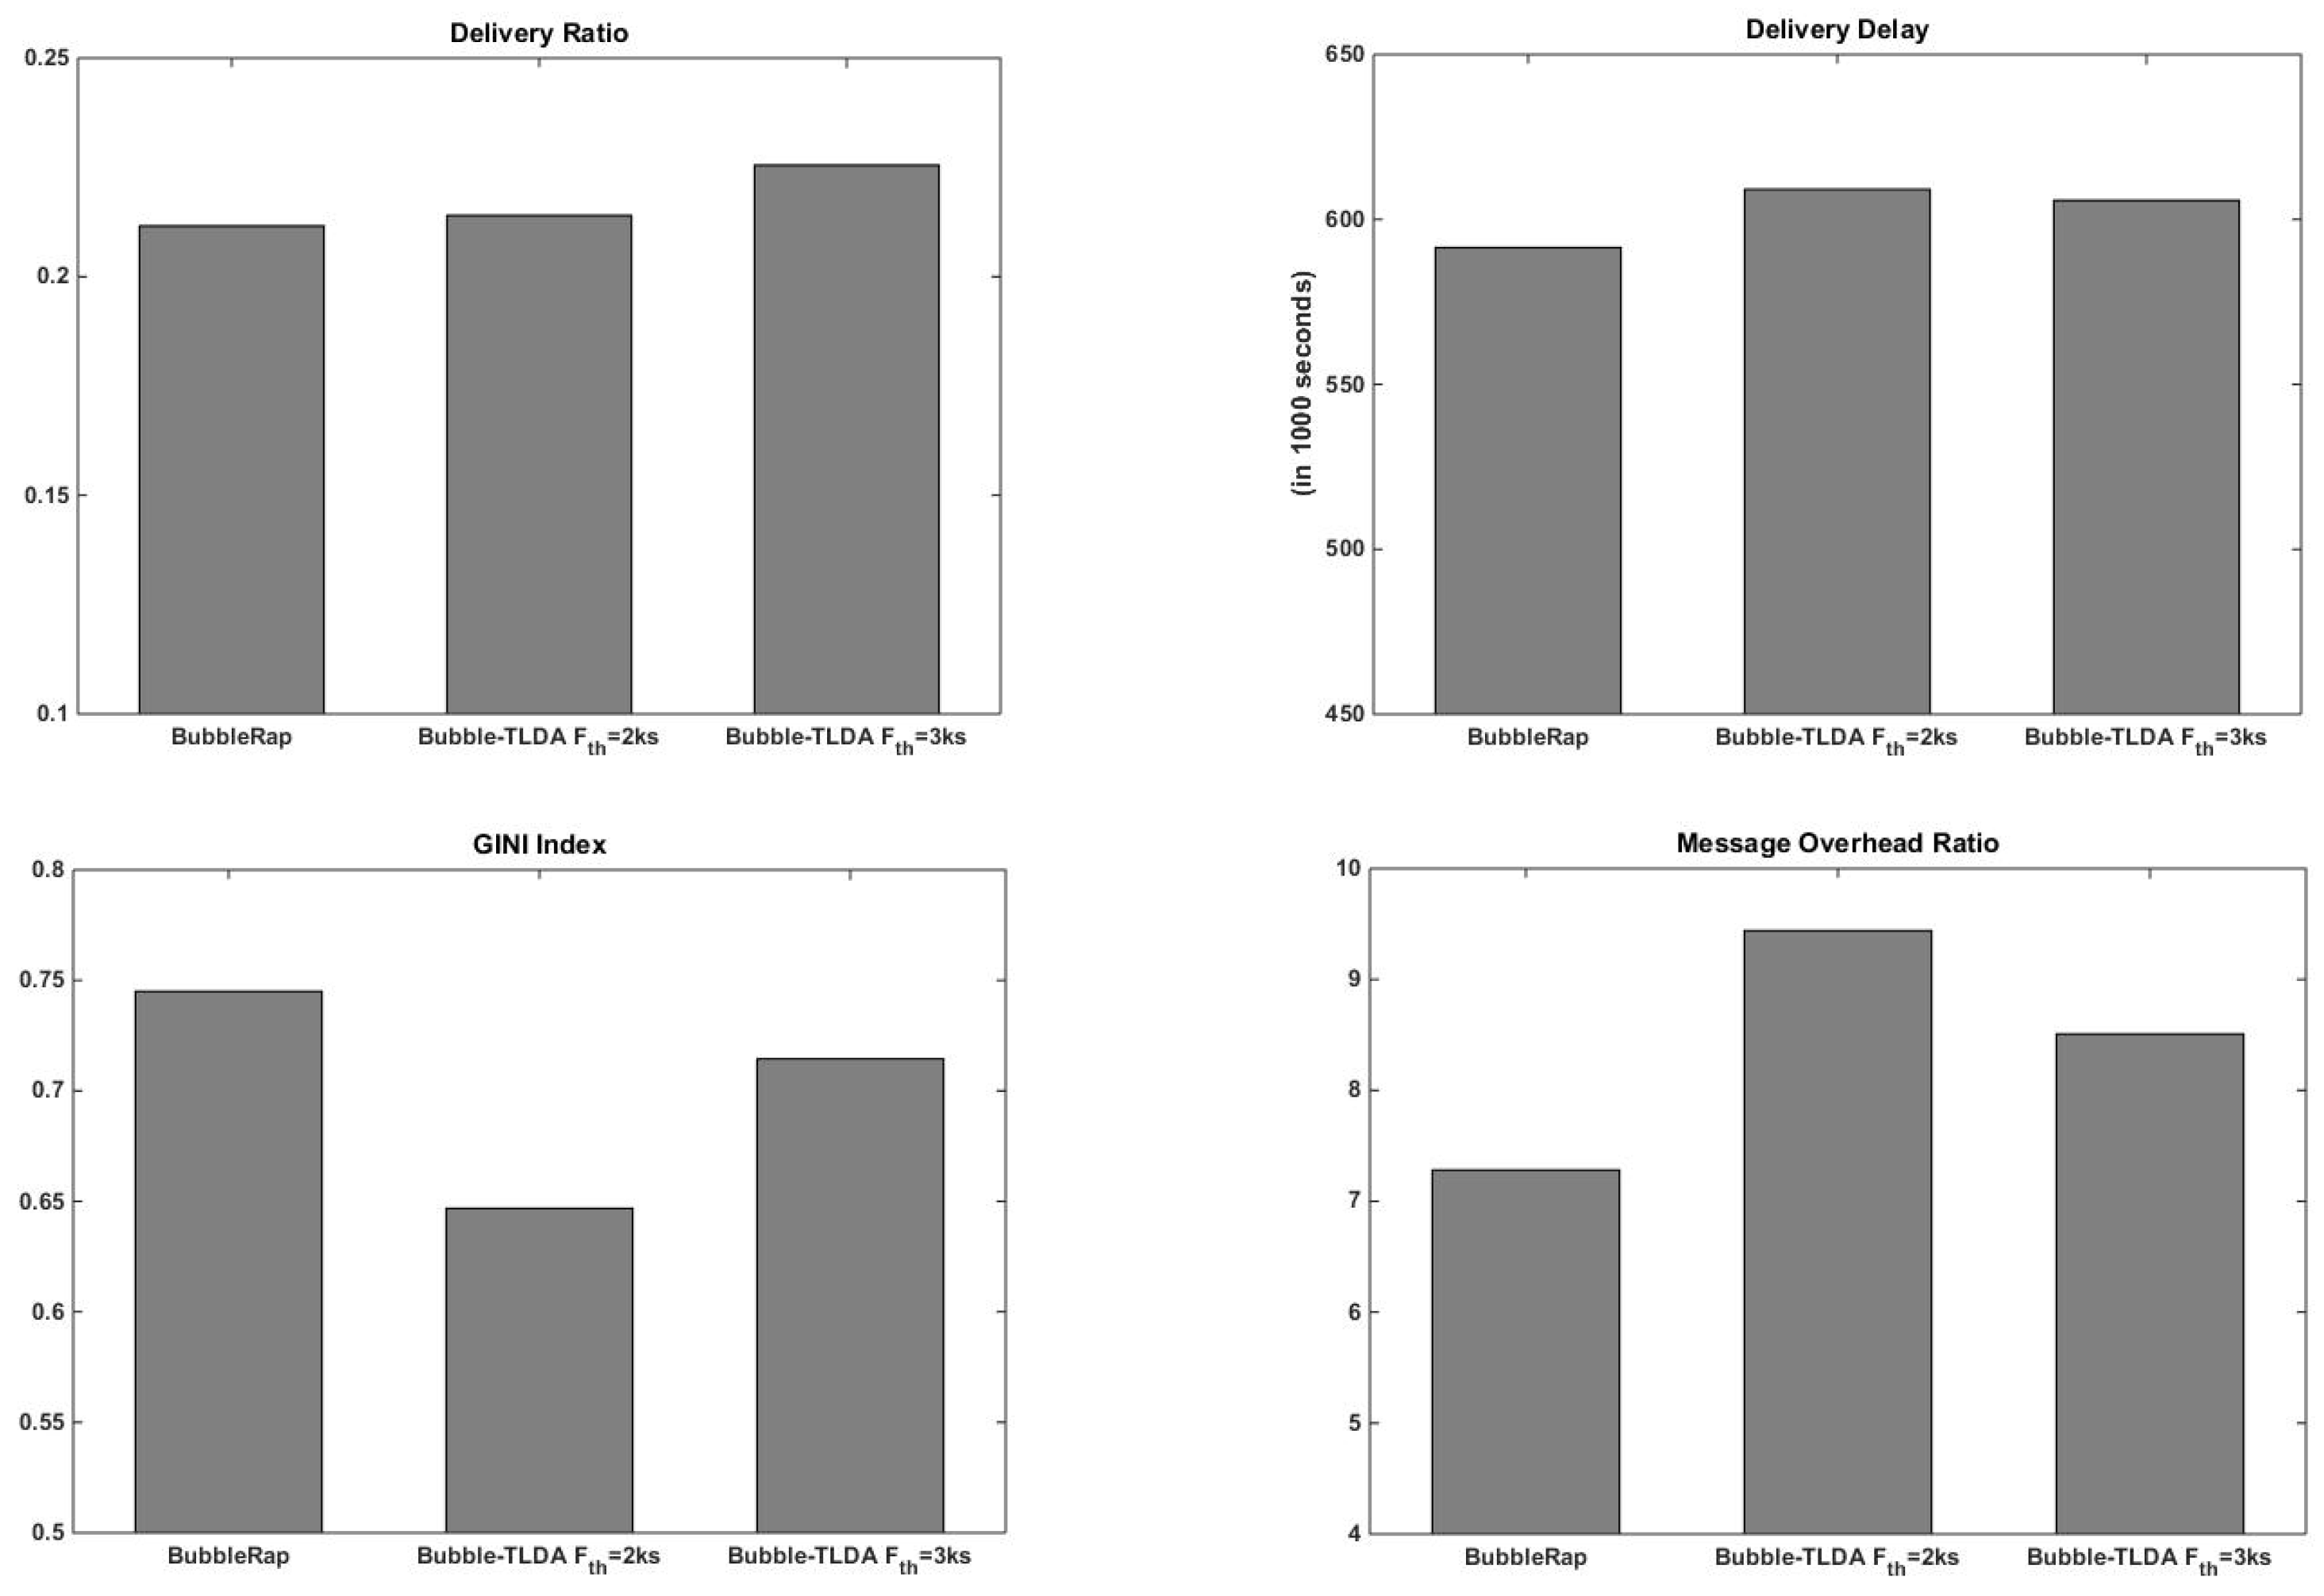
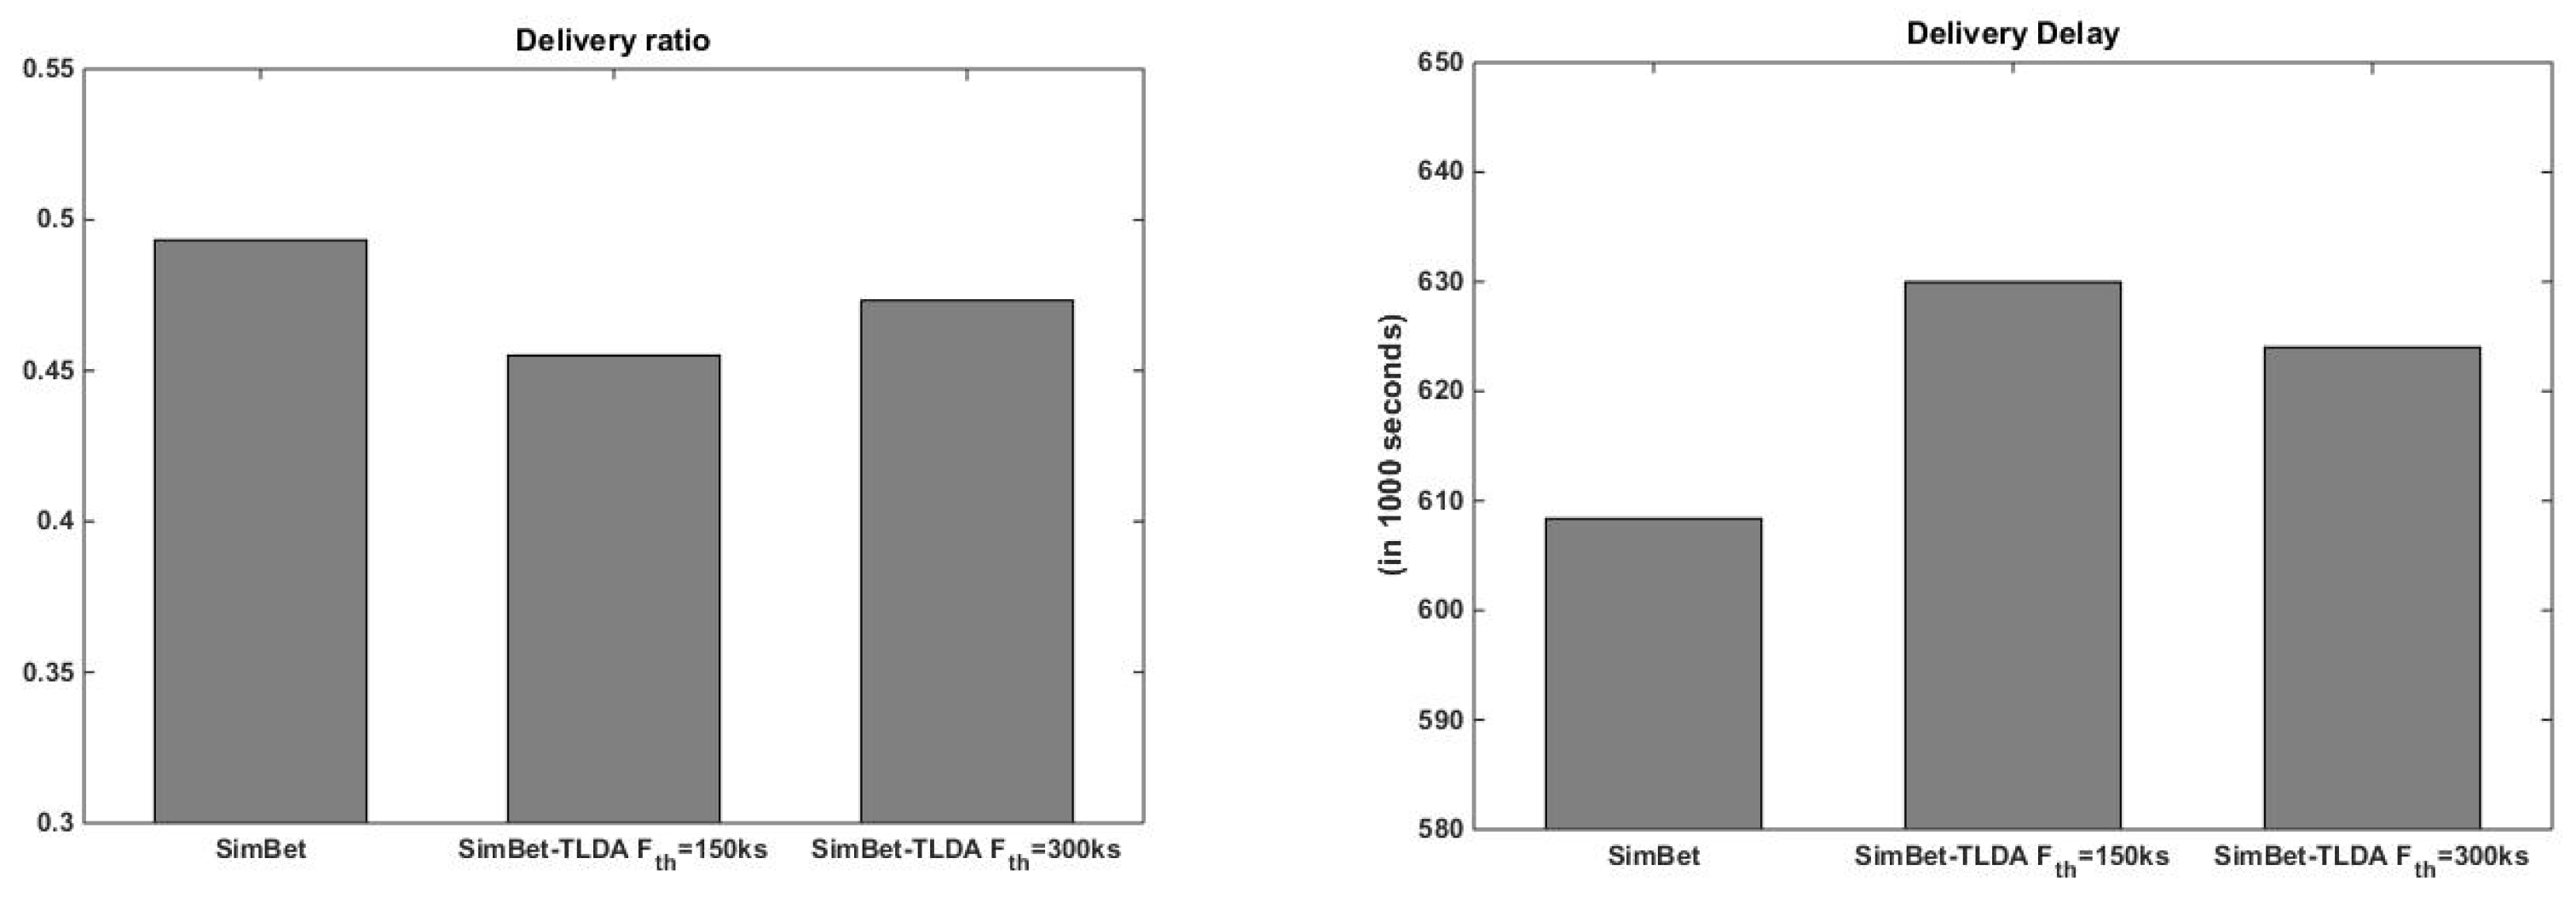
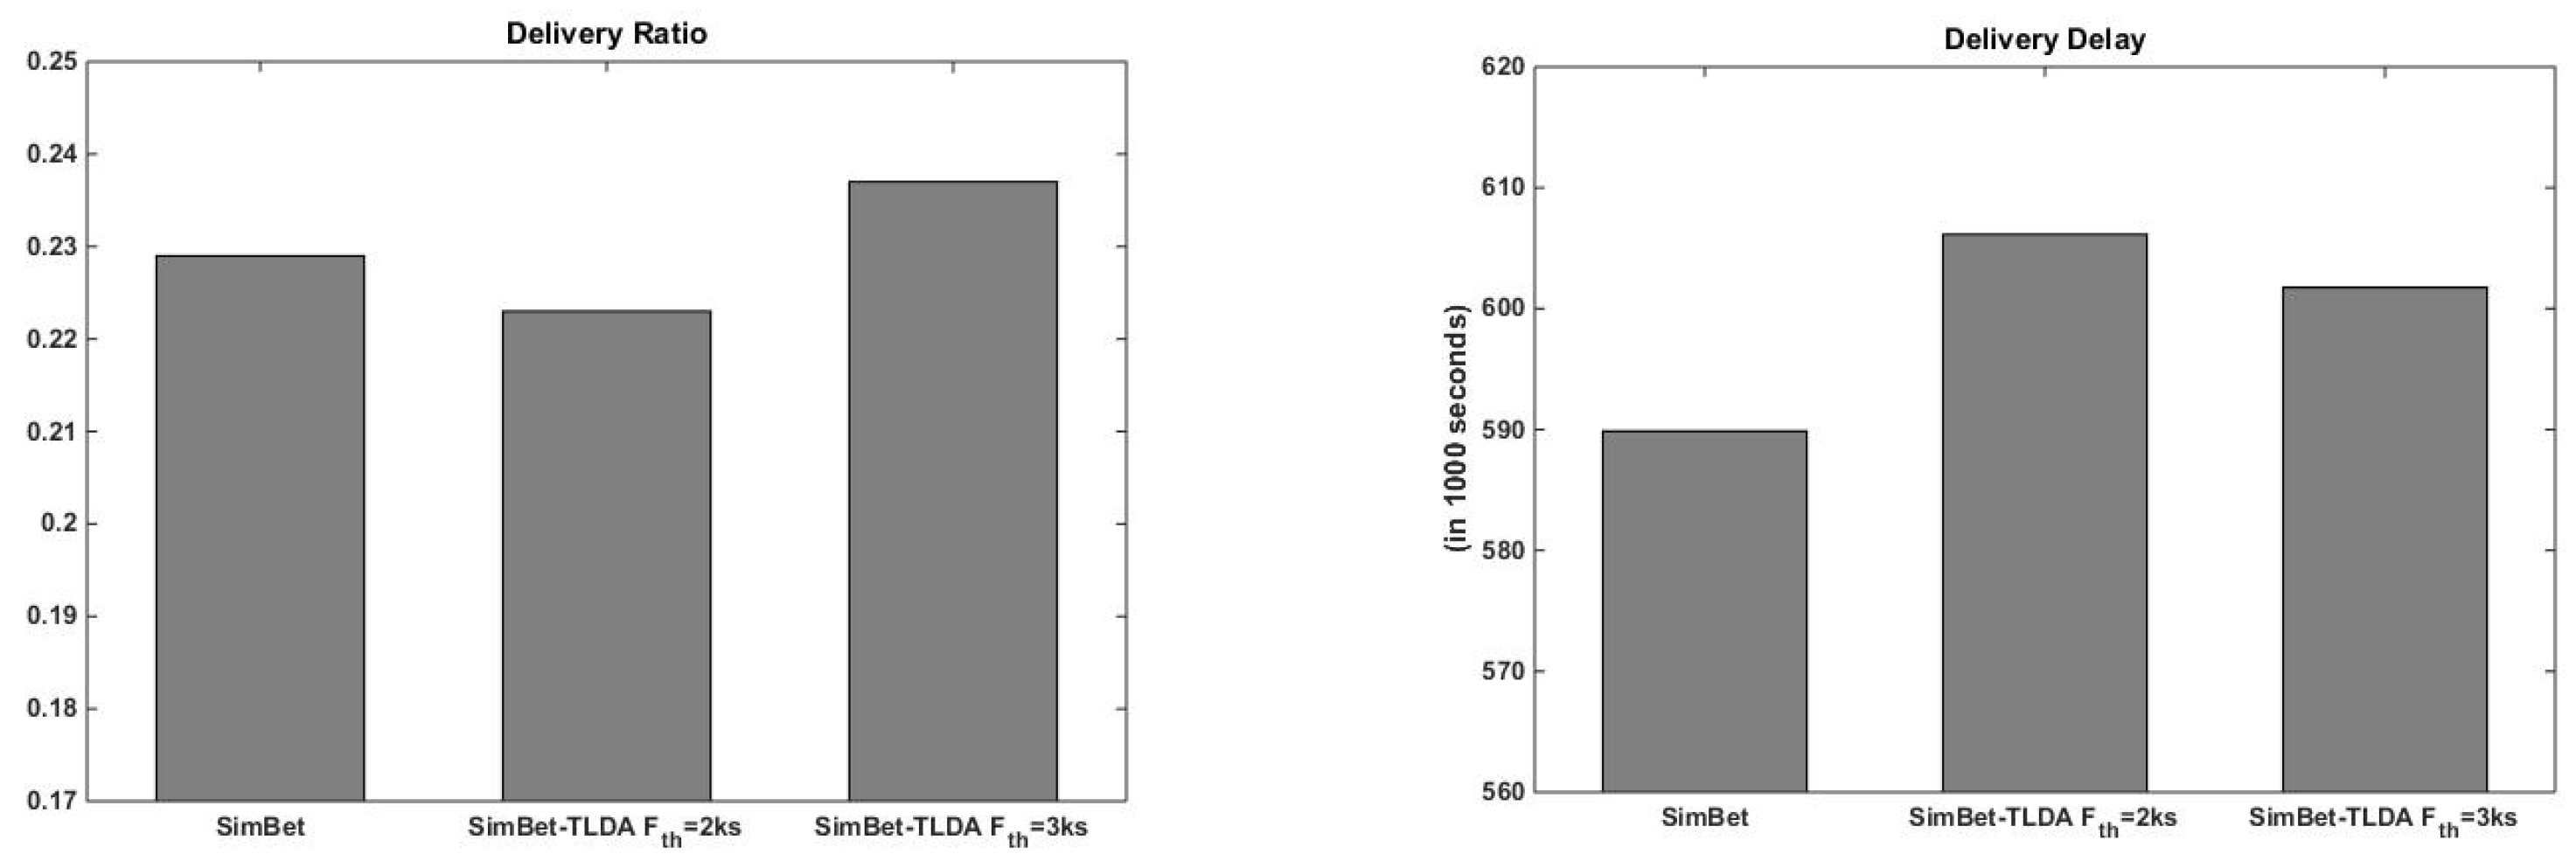
  • Delivery ratio: the ratio of the number of messages delivered to the number of new messages created.
  • Delivery latency: the time it takes for a message to be created and forwarded to the intended recipient.
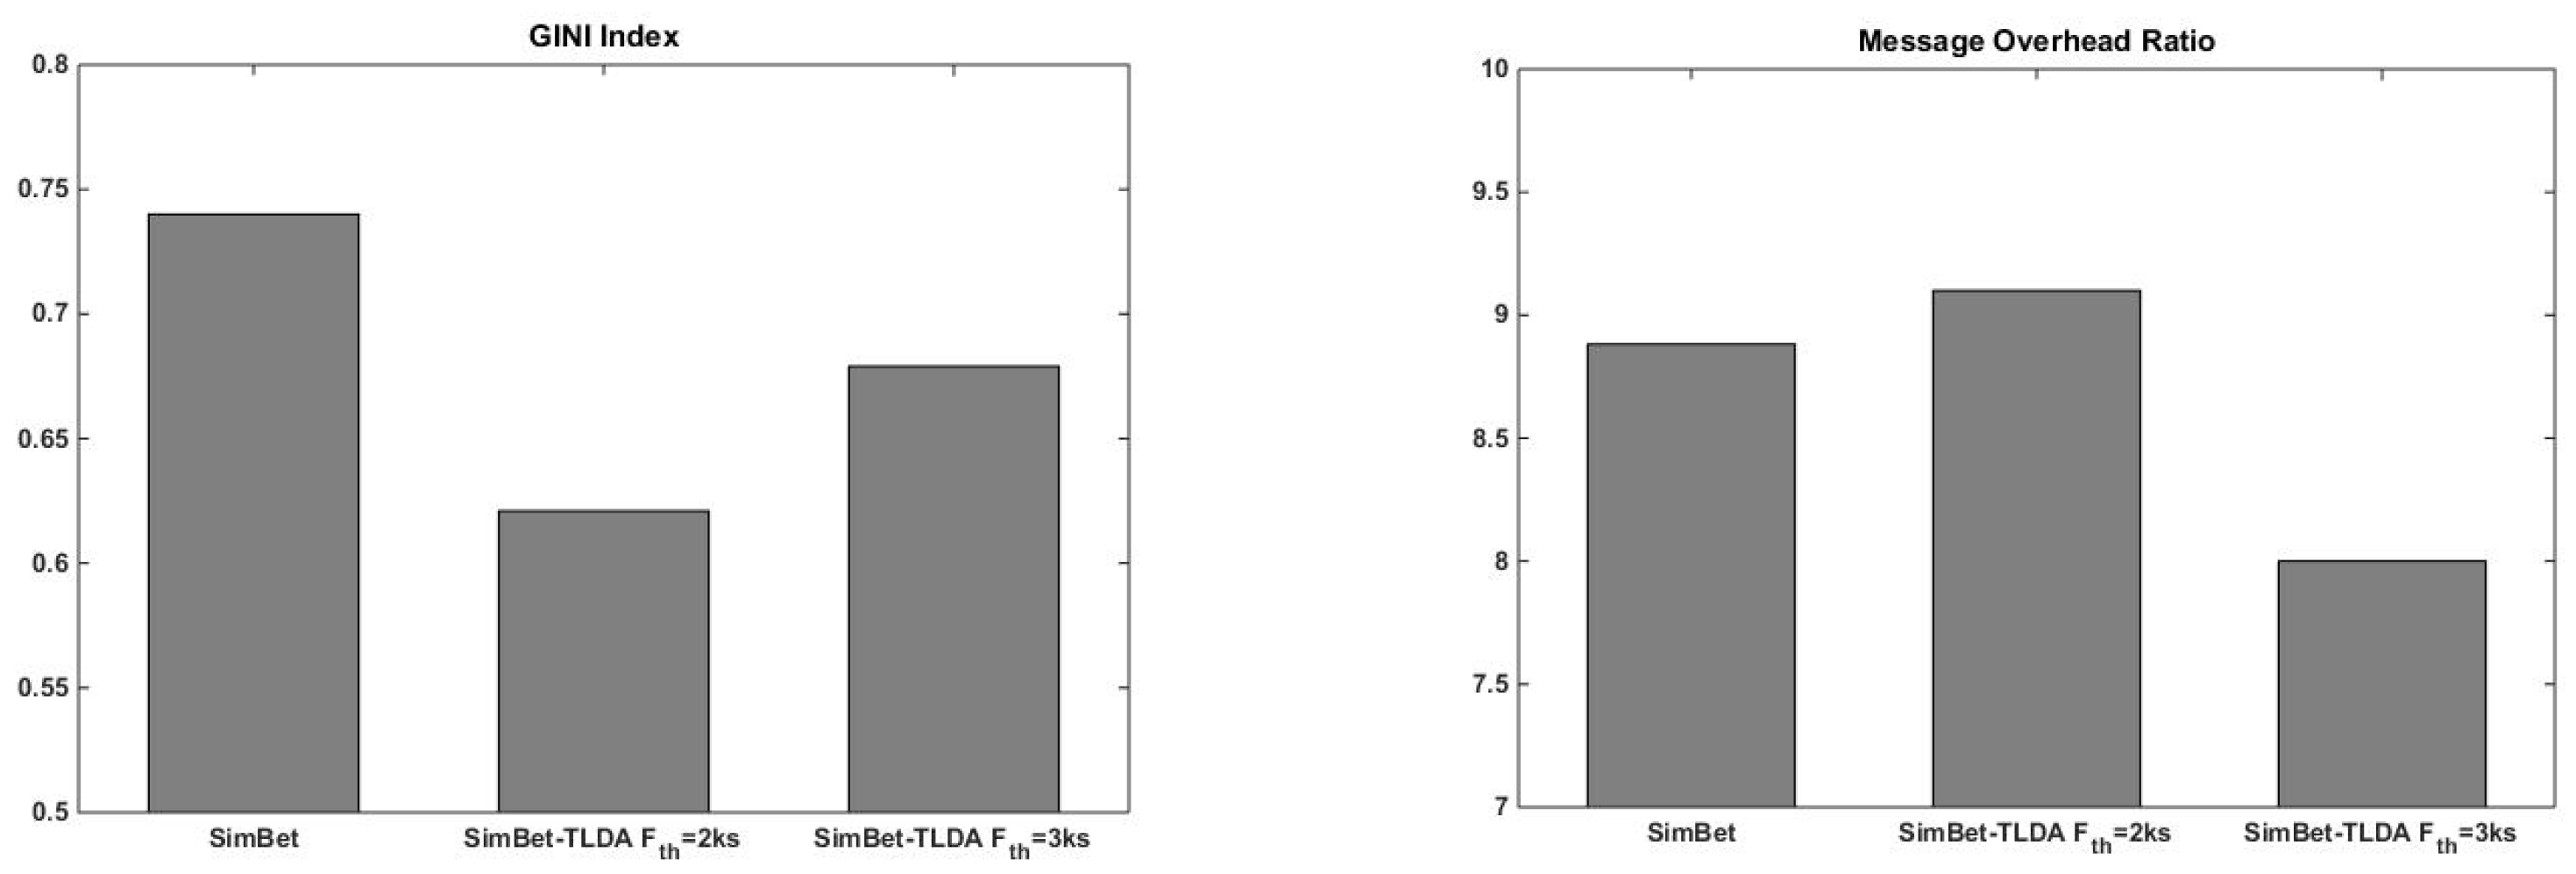
  • Message overhead ratio: the fraction between total overhead messages and total delivered messages. The total overhead messages is computed as the number of forwarded messages minus the number of messages successfully delivered
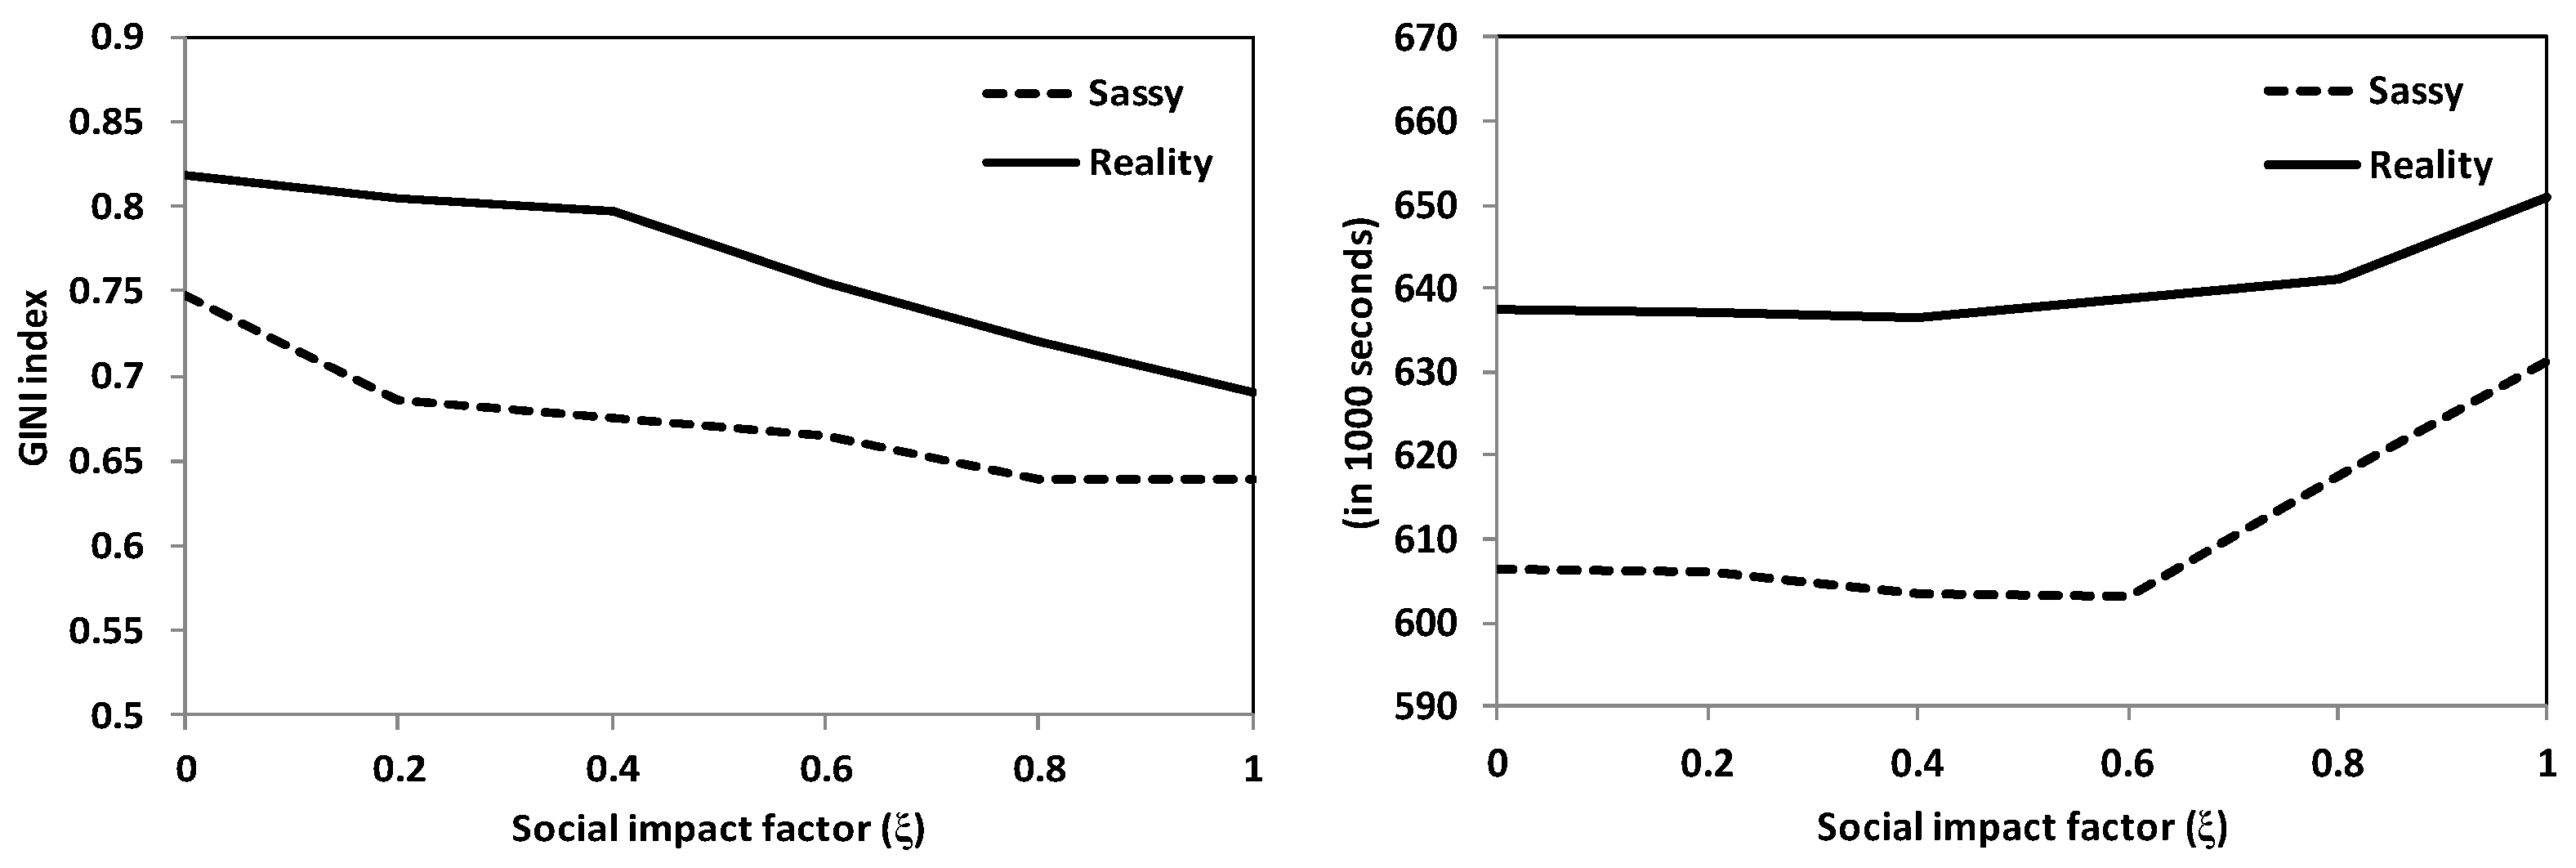
  • GINI index: this statistical dispersion measure [52] computes the disparity between values of a frequency distribution. Here, the GINI index is used to quantify the fairness level of traffic load distribution in the network: a value of “0” indicates that traffic is divided equally among network nodes, while a value of “1” indicates that all network traffic is processed by a single node.

5.2. Simulation Results and Discussions

We now present the simulation results and discussions of the delivery performances of conventional BubbleRap [21] (hereafter, called BubbleRap) and conventional SimBet [20] (hereafter, called SimBet) compared with their improved versions within the TraLDA framework (hereafter, called Bubble-TLDA and SimBet-TLDA, respectively) in the given mobility scenarios, Reality and Sassy.

5.2.1. BubbleRap vs. Bubble-TLDA

BubbleRap bases its routing on both node global popularity and the community to which the destination belongs to. When either the current node or the encountered node is in the destination’s community, routing decisions are performed based on local popularity, which is the popularity of the node within the given community; otherwise, global popularity is considered. In BubbleRap, the C-Window method is used to compute node global popularity. This method calculates a node’s degree value in the current time window by simply taking the average of all the node’s degree values in prior time windows. TraLDA, on the other hand, estimates node inherent popularity in a time window (also measured in node degree) based on the Kalman prediction which considers the periodicity of human activities. For a performance comparison between two schemes, in Figure 7 we show the time series of an illustrative hub node’s degree values in Reality. In each time window, the node’s degree value is determined based on real measurement ( y t ), C-Window ( y ¯ t ) and Kalman prediction ( y ^ t ) (we show these values in a daily basis to make them easily observed). For Kalman prediction, we assume (from Section 3.1) that the seasonality S t is known with the period of 7 days. Figure 7 shows that Kalman prediction captures fluctuations in the node degree values, and thus delivers more accurate estimations of the instantaneous node’s popularity compared to BubbleRap’s C-Window. C-Window reacts slowly to variations in node popularity and ignores the regularity of human activity.
We next discuss the delivery performance of BubbleRap compared with that of Bubble-TLDA in the Reality and Sassy scenarios based on the given evaluation metrics. As we noted above, BubbleRap considers node global popularity, and the community of the destination belongs to when making forwarding decisions. To determine the community of a node, we exploit the k-clique community detection in [50]. For the parameters of the k-clique scheme used by both BubbleRap and Bubble-TLDA, we choose k = 5 and familiar threshold T t h   = 250 k seconds for Reality, and for Sassy k = 3 and T t h   = 3 k seconds. Moreover, for the TraLDA’s parameters in Bubble-TLDA, we use two distinct values of friendship thresholds for each mobility scenario: F t h   = 150 k seconds and 300 k seconds for Reality, and F t h   = 2 k seconds and 3 k seconds for Sassy. In addition, for both mobility scenarios, we use a social impact factor ( ξ ) of 0.8, which determines the weight of neighbours’ influences on the overall node’s popularity.
As previously mentioned in the node social-relations popularity (Section 4.2), the neighbourhood of a node is defined in terms of a friendship set, with another node being involved in the node’s friendship set if their pairwise total encounter time surpasses a given friendship threshold ( F t h ). Indeed, this threshold is critical for TraLDA’s performance as it dictates the size of a node’s friendship set, which in turn impacts the node’s social influence in its neighbourhood. For instance, in Table 1 we show the comparison of the friendship sets of hub node and non-hub node in the Reality scenario for various values of friendship threshold ( F t h ) (in seconds). In the hub node, we notice that increasing the friendship threshold F t h makes the friendship set shrinking (Table 1a). This implies that as F t h increases, the spread of social influences of the hub node to its neighbours diminishes. Since a hub node, in general, is the most active node in the network, it consequently has weaker ties with its neighbours. Furthermore, Granovetter [53] underlined the relevance of weak relationships in information dissemination in social networks. A non-hub node, on the other hand, has stronger relationships to its direct neighbours, and as indicated in Table 1b the friendship threshold ( F t h ) in this case has a small influence on the node’s friendship set size.
Finally, we depict the delivery performances of BubbleRap and Bubble-TLDA in Reality and Sassy in Figure 8 and Figure 9, respectively, based on the four performance metrics mentioned before. For Bubble-TLDA, we consider two distinct friendship thresholds for each scenario: for Reality F t h   = 150 ks and 300 ks, and for Sassy F t h   = 2 ks and 3 ks. Since the primary purpose of TraLDA is to enhance fairness in forwarding across network nodes, we notice in these figures that this is achieved: Bubble-TLDA can improve the traffic distribution fairness in both scenarios, indicated by the reduced of GINI index. The improved traffic fairness of Bubble-TLDA has a little impact on the delivery rate, i.e., Bubble-TLDA keeps the delivery success rate as high as that of BubbleRap. In addition, Bubble-TLDA with a lower friendship threshold ( F t h ) can give a more significant impact on reducing the GINI index. As mentioned in Table 1, the lower friendship threshold ( F t h ) means the wider influences of hub nodes on their neighbourhoods, resulting in more non-hub nodes that can increase their popularity and, in turn, may become better relays. For example, in Figure 10 we show the distribution of traffic load among nodes in Reality for BubbleRap and Bubble-TLDA ( ξ   = 0.8, F t h   = 150 ks). Bubble-TLDA is clearly capable of significantly reducing the relay traffic managed by the most popular nodes (hub nodes), while, on the other hand, simultaneously increasing the total relay traffic on a large number of non-hub nodes, and thereby improving traffic load balancing across network nodes.
The reduction in load in the most popular nodes in the case of Bubble-TLDA, on the other hand, negatively impacts on the delivery latency. In both Reality and Sassy, as illustrated in Figure 8 and Figure 9 (upper-right), Bubble-TLDA increases delivery time beyond that of BubbleRap. Reducing traffic on the hub nodes implies that most of the network traffic is diverted away from the shortest-paths through these nodes, and now traverses on the suboptimal-paths via non-hub nodes which is typically longer than the shortest-paths, resulting in a longer delivery time.
Subsequently, we investigate the effect of a social impact factor ( ξ ) on Bubble-TLDA’ performance, particularly delivery latency and GINI index. In TraLDA, a social impact factor ( ξ ) determines the weight of neighbours’ influences on the node’s global popularity. From (16), when the social impact factor ( ξ ) decreases, the effect of neighbours’ importance on the node’s popularity weakens, and thus the node’s popularity merely relies on its own mobility pattern or sociability level in the social network. In Figure 11, we depict the impact of varying social impact factor ( ξ ) on the GINI index and average delivery latency in Reality and Sassy. As illustrated in Figure 11 (left), when the social impact factor ( ξ ) increases, the GINI index in both scenarios decreases, with the reduction is more obvious in Reality. This demonstrated that considering neighbours’ popularity influences on the node’s global popularity computation indeed improves fairness in forwarding of BubbleRap. However, increasing the social impact factor ( ξ ) lengthens the delivery time in both scenarios. The greater the value of the social impact factor ( ξ ), the more traffic is redirected from optimal paths (via hub nodes) to sub-optimal paths (through non-hub nodes), which are often longer than the shortest routes (via hub nodes) to the destination. Finally, for the case of message overhead ratio, Bubble-TLDA marginally rises BubbleRap’s delivery cost in both mobility scenarios (Figure 8 and Figure 9 (lower-right)). This implies that reducing traffic in hub nodes, while increasing traffic in non-hub nodes shows a less impact on the delivery overhead, i.e., Bubble-TLDA is able to maintain the total message copies as high as BubbleRap.

5.2.2. SimBet vs. SimBet-TLDA

For the last TraLDA’s analysis, we now consider SimBet routing [20]. SimBet uses two distinct social properties, namely betweeness centrality and social similarity, to calculate node utility to a given destination. Both the SimBet’s utility metrics are calculated based on a binary model of a social connection, where a value of “1” denotes that a pair of nodes have known each other, and “0” otherwise. The binary social relationships may create a substantial issue in forwarding fairness, since a node having large contacts with other nodes will always be considered as the popular nodes regardless of time. Using the graph with binary links, SimBet computes node betweeness centrality based on an ego-centric network approach, since the global network topology information is unavailable for nodes in MSNs. Node social similarity, on the other hand, is calculated as the number of common encountered nodes between a pair of nodes. In the end, the SimBet utility of a node is computed as the weighted combination of betweeness centrality and similarity, with a parameter α which balances the two metrics’ respective relevance. However, for SimBet-TLDA, we modify the calculation of node betweeness of SimBet with the calculation of node global popularity of TraLDA using (16). Eventually, in Figure 12 and Figure 13 we depict the delivery performances of SimBet and SimBet-TLDA for Reality and Sassy, respectively. For TraLDA’s social-relations parameters, namely friendship threshold ( F t h ) and social impact factor ( ξ ), we again consider the similar settings used in the previous investigation of Bubble-TLDA. Moreover, for both SimBet and SimBet-TLDA we choose a weighting parameter α = 0.5, assigning an equal importance to the global popularity and social similarity utilities in both Reality and Sassy.
The major purpose of SimBet-TLDA is to enhance traffic load balancing across network nodes, and as seen in Figure 12 and Figure 13 (lower-left), the GINI index performance of SimBet-TLDA can outperform that of SimBet. As previously stated, using binary relationships to calculate node centrality makes a node’s utility relatively constant over time, ignoring the dynamics of human behaviour. As a result, majority of network traffic is directed to the most central nodes (hub nodes), creating a traffic imbalance in the network. A node’s centrality in SimBet-TLDA, however, is determined by considering both the periodicity of human activities as well as the centrality of the neighbours of the nodes. This can reduce the traffic in the most central nodes and distributes the traffic more equitably across the network nodes, indicated by the reduce of GINI index in both mobility scenarios. Furthermore, the GINI index reduction in SimBet-TLDA is more obvious in the case of lower friendship thresholds ( F t h ). As described in Table 1, a lower friendship threshold means the influence of more central nodes is wider in their neighbourhood, and hence, many more less central neighbour nodes can increase their popularity and afterwards can become good relays. Moreover, the reduction in GINI index slightly impacts the delivery ratio, and SimBet-TLDA delivers messages to the destinations with a success rate as high as that of SimBet. However, as in Bubble-TLDA, the GINI index reduction in SimBet-TLDA increases the delivery time in both mobility cases. The explanation of this is similar to that given in the Bubble-TLDA before, as follows: when SimBet-TLDA successfully reduces the GINI index, some of traffic is diverted away from the shortest-paths (through hub nodes) on to the sub-optimal paths (via non-hub nodes); in turn, increasing the average delivery time. Finally, in terms of delivery cost performance, SimBet-TLDA performs as well as SimBet in both scenarios, i.e., SimBet-TLDA creates (redundant) message copies as many as SimBet in the network.

6. Conclusions

We presented TraLDA, a distributed framework aimed primarily at improving fairness in forwarding among nodes in mobile social networks. In TraLDA, we introduce a novel calculation of node popularity, a function of inherent and social-relations popularity. We have demonstrated that TraLDA achieves this fairness, reducing the GINI index of BubbleRap and SimBet, but at the expense of a slight increase of delivery delay of these routing schemes. Given that mobile social networks are assumed to be delay-tolerant, the increased delivery latency is a reasonable trade-off given the enhanced network traffic fairness and lower resource use in the most popular nodes.
For future work, we believe that TraLDA can be incorporated with buffer congestion control to further improve traffic load balancing across network nodes and simultaneously avoid congestion mainly in the most popular nodes.

Author Contributions

Conceptualization, B.S.; methodology, B.S.; software, B.S. and V.A.; validation, B.S.; formal analysis, B.S.; investigation, B.S.; resources, B.S. and V.A.; data curation, B.S.; writing—original draft preparation, B.S.; writing—review and editing, B.S. and V.A.; visualization, B.S.; supervision, B.S.; project administration, B.S.; funding acquisition, B.S. and V.A. All authors have read and agreed to the published version of the manuscript.

Funding

This research was partially funded by the Sanata Dharma University Research Grants 2021.

Institutional Review Board Statement

Not applicable.

Informed Consent Statement

Not applicable.

Data Availability Statement

The Java implementation of TraLDA is available online at: https://github.com/soelistijanto/TraLDA (accessed on 14 June 2022).

Conflicts of Interest

The authors declare no conflict of interest.

References

  1. Conti, M.; Giordano, S.; May, M.; Passarella, A. From Opportunistic Networks to Opportunistic Computing. IEEE Commun. Mag. 2010, 48, 126–139. [Google Scholar] [CrossRef]
  2. Cai, Y.; Zhang, H.; Fan, Y.; Xia, H. A Survey on Routing Algorithms for Opportunistic Mobile Social Networks. China Commun. 2021, 18, 86–109. [Google Scholar] [CrossRef]
  3. Hu, X.; Chu, T.H.S.; Leung, V.C.M.; Ngai, E.C.-H.; Kruchten, P.; Chan, H.C.B. A Survey on Mobile Social Networks: Applications, Platforms, System Architectures, and Future Research Directions. IEEE Commun. Surv. Tutor. 2015, 17, 1557–1581. [Google Scholar] [CrossRef]
  4. Barbosa, H.; Barthelemy, M.; Ghoshal, G.; James, C.R.; Lenormand, M.; Louail, T.; Menezes, R.; Ramasco, J.J.; Simini, F.; Tomasini, M. Human Mobility: Models and Applications. Phys. Rep. 2018, 734, 1–74. [Google Scholar] [CrossRef] [Green Version]
  5. Hossmann, T.; Spyropoulos, T.; Legendre, F. A Complex Network Analysis of Human Mobility. In Proceedings of the 2011 IEEE Conference on Computer Communications Workshops (INFOCOM WKSHPS), Shanghai, China, 10–15 April 2011; pp. 876–881. [Google Scholar]
  6. Borrel, V.; Legendre, F.; de Amorim, M.; Fdida, S. SIMPS: Using Sociology for Personal Mobility. IEEE/ACM Trans. Netw. 2009, 17, 831–842. [Google Scholar] [CrossRef] [Green Version]
  7. Mtibaa, A.; May, M.; Diot, C.; Ammar, M. PeopleRank: Social Opportunistic Forwarding. In Proceedings of the 2010 Proceedings IEEE INFOCOM, San Diego, CA, USA, 15–19 March 2010; pp. 1–5. [Google Scholar]
  8. Picu, A.; Spyropoulos, T. Distributed Optimization in DTNs: Towards Understanding Greedy and Stochastic Algorithms; TIK Report No. 326; ETH: Zurich, Germany, 2010; pp. 1–19. [Google Scholar]
  9. Yuan, P.; Pang, X.; Song, M. SSR: Using the Social Similarity to Improve the Data Forwarding Performance in Mobile Opportunistic Networks. IEEE Access 2019, 7, 44840–44850. [Google Scholar] [CrossRef]
  10. Mtibaa, A.; Harras, K.A. Fairness-Related Challenges in Mobile Opportunistic Networking. Comput. Netw. 2013, 57, 228–242. [Google Scholar] [CrossRef]
  11. Fan, X.; Li, V.O.K.; Xu, K. Fairness Analysis of Routing in Opportunistic Mobile Networks. IEEE Trans. Veh. Technol. 2014, 63, 1282–1295. [Google Scholar] [CrossRef]
  12. Sun, Y.; Yin, L.; Liu, W. Defending Sybil Attacks in Mobile Social Networks. In Proceedings of the 2014 IEEE Conference on Computer Communications Workshops (INFOCOM WKSHPS), Toronto, ON, Canada, 27 April–2 May 2014; pp. 163–164. [Google Scholar]
  13. Helbing, D.; Brockmann, D.; Chadefaux, T.; Donnay, K.; Blanke, U.; Woolley-Meza, O.; Moussaid, M.; Johansson, A.; Krause, J.; Schutte, S.; et al. Saving Human Lives: What Complexity Science and Information Systems Can Contribute. J. Stat. Phys. 2015, 158, 735–781. [Google Scholar] [CrossRef]
  14. Jusup, M.; Holme, P.; Kanazawa, K.; Takayasu, M.; Romić, I.; Wang, Z.; Geček, S.; Lipić, T.; Podobnik, B.; Wang, L.; et al. Social Physics. Phys. Rep. 2022, 948, 1–148. [Google Scholar] [CrossRef]
  15. Hui, P.; Chaintreau, A.; Scott, J.; Gass, R.; Crowcroft, J.; Diot, C. Pocket Switched Networks and Human Mobility in Conference Environments. In Proceedings of the 2005 ACM SIGCOMM Workshop on Delay-Tolerant Networking—WDTN’05, Philadelphia, PA, USA, 26 August 2005; ACM Press: Philadelphia, PA, USA, 2005; pp. 244–251. [Google Scholar]
  16. Spyropoulos, T.; Turletti, T.; Obraczka, K. Routing in Delay-Tolerant Networks Comprising Heterogeneous Node Populations. IEEE Trans. Mob. Comput. 2009, 8, 1132–1147. [Google Scholar] [CrossRef]
  17. Kalman, R.E. A New Approach to Linear Filtering and Prediction Problems. J. Fluids Eng. Trans. ASME 1960, 82, 35–45. [Google Scholar] [CrossRef] [Green Version]
  18. Hu, F.; Smeaton, A.F.; Newman, E.; Buman, M.P. Using Periodicity Intensity to Detect Long Term Behaviour Change. In Proceedings of the Adjunct Proceedings of the 2015 ACM International Joint Conference on Pervasive and Ubiquitous Computing, and Proceedings of the 2015 ACM International Symposium on Wearable Computers, Osaka, Japan, 7–11 September 2015; Association for Computing Machinery: New York, NY, USA, 2015; pp. 1069–1074. [Google Scholar]
  19. Soelistijanto, B.; Adi Permatasari, E.K. Periodicity Detection of Node Behaviour in Opportunistic Mobile Social Networks. In Proceedings of the 2019 IEEE International Conference on Internet of Things and Intelligence System (IoTaIS), Bali, Indonesia, 5–7 November 2019; pp. 25–29. [Google Scholar]
  20. Daly, E.M.; Haahr, M. Social Network Analysis for Information Flow in Disconnected Delay-Tolerant MANETs. IEEE Trans. Mob. Comput. 2009, 8, 606–621. [Google Scholar] [CrossRef]
  21. Hui, P.; Crowcroft, J.; Yoneki, E. BUBBLE Rap: Social-Based Forwarding in Delay-Tolerant Networks. IEEE Trans. Mob. Comput. 2011, 10, 1576–1589. [Google Scholar] [CrossRef] [Green Version]
  22. Keränen, A.; Ott, J.; Kärkkäinen, T. The ONE Simulator for DTN Protocol Evaluation. In Proceedings of the SIMUTools 2009-2nd International ICST Conference on Simulation Tools and Techniques, Rome, Italy, 2–6 March 2009. [Google Scholar] [CrossRef] [Green Version]
  23. SHI, H.; Prasad, R.V.; Onur, E.; Niemegeers, I.G.M.M. Fairness in Wireless Networks: Issues, Measures and Challenges. IEEE Commun. Surv. Tutor. 2014, 16, 5–24. [Google Scholar] [CrossRef]
  24. Soelistijanto, B. The Efficiency-Fairness Trade-off of Social-Rank-Based Forwarding in Social Opportunistic Networks. In Proceedings of the 2016 IEEE Asia Pacific Conference on Wireless and Mobile (APWiMob), Bandung, Indonesia, 13–15 September 2016; pp. 113–119. [Google Scholar]
  25. Ying, B.; Xu, K.; Nayak, A. Fair and Social-Aware Message Forwarding Method in Opportunistic Social Networks. IEEE Commun. Lett. 2019, 23, 720–723. [Google Scholar] [CrossRef]
  26. Pujol, J.M.; Toledo, A.L.; Rodriguez, P. Fair Routing in Delay Tolerant Networks. In Proceedings of the IEEE INFOCOM, Rio de Janeiro, Brazil, 19–25 April 2009; pp. 837–845. [Google Scholar] [CrossRef] [Green Version]
  27. Radenkovic, M.; Grundy, A. Efficient and Adaptive Congestion Control for Heterogeneous Delay-Tolerant Networks. Ad Hoc Netw. 2012, 10, 1322–1345. [Google Scholar] [CrossRef]
  28. Sermpezis, P.; Spyropoulos, T. Understanding the Effects of Social Selfishness on the Performance of Heterogeneous Opportunistic Networks. Comput. Commun. 2014, 48, 71–83. [Google Scholar] [CrossRef]
  29. Abdelkader, T.; Naik, K.; Gad, W. A Game-Theoretic Approach to Supporting Fair Cooperation in Delay Tolerant Networks. In Proceedings of the 2015 IEEE 81st Vehicular Technology Conference (VTC Spring), Glasgow, UK, 11–14 May 2015; pp. 1–7. [Google Scholar]
  30. Amah, T.E.; Kamat, M.; Bakar, K.A.; Moreira, W.; Oliveira, A., Jr.; Batista, M.A. Measuring Burden and Routing Fairness in Pocket Switched Networks. In Proceedings of the {XXXV} Brazilian Symposium on Computer Networks and Distributed Systems, Belém, Brazil, 15–19 May 2018; Abelém, A., Cerqueira, E., Eds.; SBRC: Linlithgow, UK, 2017. [Google Scholar]
  31. Ciobanu, R.I.; Dobre, C.; Cristea, V. Reducing Congestion for Routing Algorithms in Opportunistic Networks with Socially-Aware Node Behavior Prediction. In Proceedings of the Proceedings-International Conference on Advanced Information Networking and Applications, AINA, Barcelona, Spain, 25–28 March 2013; pp. 554–561. [Google Scholar]
  32. Freeman, L.C. Centrality in Social Networks. Soc. Netw. 1979, 1, 215–239. [Google Scholar] [CrossRef] [Green Version]
  33. Rusinowska, A.; Berghammer, R.; De Swart, H.; Grabisch, M. Social Networks: Prestige, Centrality, and Influence: (Invited Paper). In Relational and Algebraic Methods in Computer Science; de Swart, H., Ed.; Lecture Notes in Computer Science; Springer: Berlin/Heidelberg, Germany, 2011; Volume 6663, pp. 22–39. ISBN 978-3-642-21069-3. [Google Scholar]
  34. Sheikhahmadi, A.; Nematbakhsh, M.A. Identification of Multi-Spreader Users in Social Networks for Viral Marketing. J. Inf. Sci. 2017, 43, 412–423. [Google Scholar] [CrossRef]
  35. Ursino, D.; Virgili, L. An Approach to Evaluate Trust and Reputation of Things in a Multi-IoTs Scenario. Computing 2020, 102, 2257–2298. [Google Scholar] [CrossRef]
  36. Cauteruccio, F.; Cinelli, L.; Fortino, G.; Savaglio, C.; Terracina, G.; Ursino, D.; Virgili, L. An Approach to Compute the Scope of a Social Object in a Multi-IoT Scenario. Pervasive Mob. Comput. 2020, 67, 101223. [Google Scholar] [CrossRef]
  37. Katz, L. A New Status Index Derived from Sociometric Analysis. Psychometrika 1953, 18, 39–43. [Google Scholar] [CrossRef]
  38. Yoneki, E.; Hui, P.; Crowcroft, J. Distinct Types of Hubs in Human Dynamic Networks. In Proceedings of the 1st Workshop on Social Network Systems; Association for Computing Machinery: New York, NY, USA, 2008; pp. 7–12. [Google Scholar]
  39. Eagle, N.; Pentland, A. Reality Mining: Sensing Complex Social Systems. Pers. Ubiquitous Comput. 2006, 10, 255–268. [Google Scholar] [CrossRef]
  40. Ferretti, S.; Ghini, V.; Panzieri, F. Scale-Free Opportunistic Networks: Is It Possible? In Proceedings of the 2012 IEEE International Conference on Pervasive Computing and Communications Workshops, Lugano, Switzerland, 19–23 March 2012; pp. 625–630. [Google Scholar]
  41. Musolesi, M.; Mascolo, C. CAR: Context-Aware Adaptive Routing for Delay-Tolerant Mobile Networks. IEEE Trans. Mob. Comput. 2009, 8, 246–260. [Google Scholar] [CrossRef] [Green Version]
  42. Williamson, G.; Cellai, D.; Dobson, S.; Nixon, P. Self-Management of Routing on Human Proximity Networks. In Proceedings of the Self-Organizing Systems; Spyropoulos, T., Hummel, K.A., Eds.; Springer: Berlin/Heidelberg, Germany, 2009; pp. 1–12. [Google Scholar]
  43. Stoica, P.; Moses, R.L. Spectral Analysis of Signals; Pearson/Prentice Hall: Upper Saddle River, NJ, USA, 2005; ISBN1 0131139568. ISBN2 9780131139565. [Google Scholar]
  44. Brockwell, P.J.; Davis, R.A. Introduction to Time Series and Forecasting, 2nd ed.; Springer: Berlin/Heidelberg, Germany, 2002; ISBN 9780387781884. [Google Scholar]
  45. Dagum, E.B. The X-II-ARIMA Seasonal Adjustment Method; Statistics Canada: Ottawa, ON, Canada, 1980; 119p.
  46. Durbin, J.; Koopman, S.J. Time Series Analysis by State Space Methods: Second Edition; Oxford University Press: Oxford, UK, 2012; ISBN 9780199641178. [Google Scholar]
  47. Musolesi, M.; Hailes, S.; Mascolo, C. Prediction of Context Information Using Kalman Filter Theory; UCL Research Note RN/04/22; University College London: London, UK, 2004. [Google Scholar]
  48. Wasserman, S.; Faust, K. Social Network Analysis: Methods and Applications; Structural Analysis in the Social Sciences; Cambridge University Press: Cambridge, UK, 1994. [Google Scholar]
  49. Bonacich, P. Power and Centrality: A Family of Measures. Am. J. Sociol. 1987, 92, 1170–1182. [Google Scholar] [CrossRef]
  50. Hui, P.; Yoneki, E.; Chan, S.Y.; Crowcroft, J. Distributed Community Detection in Delay Tolerant Networks. In Proceedings of the 2nd ACM/IEEE International Workshop on Mobility in the Evolving Internet Architecture, Kyoto, Japan, 27–30 August 2007; Association for Computing Machinery: New York, NY, USA, 2007. [Google Scholar]
  51. Bigwood, G.; Henderson, T.; Rehunathan, D.; Bateman, M.; Bhatti, S. {CRAWDAD} Dataset St_andrews/Sassy, v. 2011-06-03. 2011. Available online: https://crawdad.org/st_andrews/sassy/20110603/ (accessed on 20 July 2021).
  52. Gini, C. On the Measure of Concentration with Special Reference to Income and Statistics. Colo. Coll. Publ. Colo. Springs Gen. Ser. 1936, 208, 73–79. [Google Scholar]
  53. Granovetter, M.S. The Strength of Weak Ties. Am. J. Sociol. 1973, 78, 1360–1380. [Google Scholar] [CrossRef] [Green Version]
Figure 1. A mobile social network’s structural topology. On the top layer, the social network drives human to move, and this human mobility creates opportunistic contacts in the physical network.
Algorithms 15 00222 g001
Figure 2. (left) the node degree distribution in the Reality mobility scenario, and (right) when it is plotted in a log-log scale. The almost linear of the plot of the node degree in the log-log scale verifies that the node degree is power-law distributed.
Algorithms 15 00222 g002
Figure 3. (left) Node degree vs. node traffic load, and (right) the buffer queue growths of illustrative hub node and non-hub node, when the hill-climbing heuristic forwarding is used in the mobile social network. This describes an imbalanced traffic load among nodes, with the highest degree nodes handling the bulk of network traffic, resulting in significant buffer occupancy throughout the simulation.
Algorithms 15 00222 g003
Figure 4. (left) The changes of degree of an illustrative hub node in Reality (measured by node degree in a 6-h time window), and (right) the detected periodicities of the node’s degree. This describes that the node popularity in the mobile social network fluctuates over time and has a weekly period.
Algorithms 15 00222 g004
Figure 5. (upper) Long-term seasonal data, and (lower) deseasonalized data of the hub node’ degree in Figure 4. These figures show that node popularity in mobile social networks typically comprises a periodic (seasonal) component along with a random noise component.
Algorithms 15 00222 g005
Figure 6. A neighbourhood of node A, comprising four nodes which gives social influences to node A. Social influences (red dotted vectors) to node A exist when the global popularity of the neighbours is higher than A’s.
Algorithms 15 00222 g006
Figure 7. Node degree values of an illustrative Reality hub node in a certain time window, comparing the actual value, the Kalman prediction, and the C-Window estimate. Kalman prediction clearly outperforms C-Window when estimating the actual node’s degree level in each time window, and it captures the periodic pattern of the node degree quite well.
Algorithms 15 00222 g007
Figure 8. Performance evaluation of BubbleRap and Bubble-TLDA ( ξ   = 0.8) for the Reality mobility scenario, comparing the delivery performances of BubbleRap and its improved version, Bubble-TLDA. Bubble-TLDA significantly decreases of the GINI index of BubbleRap in this case, without negatively impacting other delivery performances.
Algorithms 15 00222 g008
Figure 9. Performance evaluation of BubbleRap and Bubble-TLDA ( ξ   = 0.8) for the Sassy mobility scenario. In this case, Bubble-TLDA slightly improves the traffic distribution (indicated by a reduced GINI index), while keeping other delivery performances as high as those of BubbleRap.
Algorithms 15 00222 g009
Figure 10. (left) The traffic load distribution among nodes in Reality for BubbleRap, and (right) for Bubble-TLDA ( ξ   = 0.8, F t h   = 150 ks). Clearly, the improved node popularity calculation of TraLDA on BubbleRap significantly reduces the traffic load in the hub nodes, while increasing the relay traffic in majority of non-hub nodes.
Algorithms 15 00222 g010
Figure 11. (left) Social impact factor ( ξ ) vs. GINI index, and (right) social impact factor ( ξ ) vs. delivery latency of Bubble-TLDA for Reality (Fth = 150 ks) and Sassy (Fth = 2 ks). A social impact factor represents the contribution of neighbours’ influence on the node popularity. A higher ξ leads to a lower GINI index, but somewhat increases the delivery delay.
Algorithms 15 00222 g011
Figure 12. Performance evaluation of SimBet and SimBet-TLDA ( ξ   = 0.8) for the Reality mobility scenario. As in the case of BubbleRap, in this case TraLDA is also able to substantially reduce the SimBet’s GINI index, without much affecting other delivery performances.
Algorithms 15 00222 g012aAlgorithms 15 00222 g012b
Figure 13. Performance evaluation of SimBet and SimBet-TLDA ( ξ   = 0.8) for the Sassy mobility scenario. Similar with the case in Reality, here SimBet-TLDA also improves the traffic fairness in the network (indicated by the reduced GINI index), while keeping other delivery performances as high as those of SimBet.
Algorithms 15 00222 g013aAlgorithms 15 00222 g013b
Table 1. The friendship sets of hub node and non-hub node in Reality for different values of F t h .
(a) Node 80 (Hub Node)(b) Node 3 (Non-Hub Node)
F t h   ( s ) Friendship Set (Node ID) F t h   ( s ) Friendship Set (Node ID)
150 k[5, 7, 13, 15, 17, 20, 22, 32, 82, 84, 85, 95]150 k[45, 63, 82, 95, 96]
200 k[5, 7, 13, 17, 20, 22, 32, 82, 84, 95]200 k[45, 63, 82, 95, 96]
250 k[5, 7, 13, 17, 20, 22, 82, 84, 95]250 k[45, 63, 82, 95, 96]
300 k[5, 13, 17, 22, 82, 84, 95]300 k[45, 63, 82, 95, 96]
Publisher’s Note: MDPI stays neutral with regard to jurisdictional claims in published maps and institutional affiliations.

