Abstract
In industry, electric motors such as the squirrel cage induction motor (SCIM) generate motive power and are particularly popular due to their low acquisition cost, strength, and robustness. Along with these benefits, they have minimal maintenance costs and can run for extended periods before requiring repair and/or maintenance. Early fault detection in SCIMs, especially at low-load conditions, further helps minimize maintenance costs and mitigate abrupt equipment failure when loading is increased. Recent research on these devices is focused on fault/failure diagnostics with the aim of reducing downtime, minimizing costs, and increasing utility and productivity. Data-driven predictive maintenance offers a reliable avenue for intelligent monitoring whereby signals generated by the equipment are harnessed for fault detection and isolation (FDI). Particularly, motor current signature analysis (MCSA) provides a reliable avenue for extracting and/or exploiting discriminant information from signals for FDI and/or fault diagnosis. This study presents a fault diagnostic framework that exploits underlying spectral characteristics following MCSA and intelligent classification for fault diagnosis based on extracted spectral features. Results show that the extracted features reflect induction motor fault conditions with significant diagnostic performance (minimal false alarm rate) from intelligent models, out of which the random forest (RF) classifier was the most accurate, with an accuracy of 79.25%. Further assessment of the models showed that RF had the highest computational cost of 3.66 s, while NBC had the lowest at 0.003 s. Other significant empirical assessments were conducted, and the results support the validity of the proposed FDI technique.
1. Introduction
SCIMs are used to power most industrial appliances because of their robust nature and ability to generate sufficient torque to effectively drive much larger machinery at an affordable cost through the process of electromagnetic induction. Injection sea water pumps, air conditioner compressor drives, gas circulators in power generating firms, and oil exporting pumps in the oil and gas drilling industries are only a few of the well-known applications of SCIMs [1]. SCIMs are often prone to failures and breakdowns as a result of faults and prolonged operation, and, if left unmonitored, often suffer major damage or breakdowns. According to a review done by Bhowmik et al. [2], severe operating environments, insufficient insulation, purposely overloading the power supply, and factory defects are the most typical causes of breakdowns and failure. The production down-times caused by these flaws have frequently resulted in revenue loss, among other pitfalls. Therefore, early fault detection is important/crucial to avoid these occurrences [1]. The consequences of these failures have increased the need for SCIM failure diagnosis as a crucial module for overall equipment prognostics and health management (PHM).
State-of-the-art research studies on SCIM FDI and prognostics feature data-driven PHM technologies, with research ongoing; these studies show that data-driven AI-based PHM technologies rely heavily on the quantity and quality of data to train AI-based predictive modeling [1,3]. However, the accuracy of these models is also dependent on how suitable the method befits the nature of the available data, which has led to various studies exploring numerous data-driven PHM methodologies. Researchers have used advances in artificial intelligence (AI), machine learning (ML), and deep learning to construct models that exploit current signals, vibration signals, and thermal signals generated by equipment via sensors, examining these signals separately or combining them for FDI [1,4,5]. Fourier analysis has proven to be effective among the different ways of analysis owing to its convenience and nature of application, especially when it comes to current signature analysis and/or vibration signature analysis (VSA) [5]. Fourier transforms (FTs) are essentially concerned with the decomposition of signals from their time domain to their frequency domain for analysis in both healthy and faulty motors, providing a superior platform for signal interpretation and feature extraction for FDI [3,6]. Even though it can decompose signals to their frequency domains, a FT still has limitations, such as its lack of transient information and its nature of providing only the average time of the spectrum content, thereby lacking in providing details on variations in frequency with regard to time of the signals [7]. Fast Fourier transforms with high computation speed and short-time Fourier transforms that decompose data into the time–frequency domain are frequently used to solve these challenges [7,8]. Further, according to [9], Fourier analysis is one of the highly efficient analytical tools that is compatible with MCSA for a variety of fault detection for SCIMs.
Although variable frequency drives (VFDs) have recently become more popular in industries than direct online starters due to their ability to provide flexible production control and soft motor start-up, variable frequencies, complex control systems, and harmonics generated at the drive output are still some of the major concerns they are associated with [10]. Harmonics generated by VFDs pose a significant problem for motor bearings and stator windings since they raise their level of stress. Moreover, they have an impact on signal quality in terms of noise ratio, particularly when using stator current signals for FDI [5,10].
2. Motivation and Literature Review
As dependency on SCIMs by industries is on the increase due to their robust nature, failures of these machines cannot be accommodated; therefore, the need to find solutions to these failures or to predict possible failure time cannot be overemphasized. Globally, close to 90% of industrial equipment relies on SCIMs as their prime mover [11]. According to Choudhary et al. [1], faults in SCIMs are categorized based on the location of occurrence, i.e., internal or external, and these faults are then grouped based on the nature and/or origin of the fault, i.e., mechanical or electrical faults; the severity of each fault type depends on its location. For instance, an external electrical fault is less threatening than an internal electrical issue, but if left unmonitored, it can escalate to an internal electrical fault, which can lead to a total breakdown.
Bearing and stator faults account for more than 70% of general failures in SCIMs [12]. According to an investigative report, bearing failure, unsurprisingly, has the highest percentage of occurrence in an SCIM (40–45% contribution) [1], which can be traced to the nature of SCIMs, whose bearings are susceptible to damage when overloaded, misaligned, and/or unbalanced. Moreover, the bearings are subjected to continuous loading at all times when the SCIM is in operation. Stator failures are common as well, owing to large current flows in their winding coils and insulation weakness caused by mechanical and electrical stress and/or deterioration of insulation. The most common defect in a stator is an inter-turn fault, which happens when two turns in a phase become linked as a result of failed insulation and, if left unchecked, can lead to phase damage or more serious stator failures, resulting in substantial maintenance costs [13]. Although not as common as stator and bearing problems, rotor faults are one of the most commonly occurring faults, accounting for over 8% of all SCIM faults [1], and can lead to poor performance and/or breakdown of the motor if left unmonitored.
For adequate FDI, signals generated from these machines are employed for condition-based monitoring, which has proven to be useful in past and present research studies [5,14,15]. Based on the nature of SCIMs, which generate vibration and thermal responses while in operation, vibration signals have been one of the most-used measurements thus far due to their efficiency in both time and frequency domains [16]. On the flip side, due to the simplicity, low cost, and non-intrusive nature of obtaining current signals, MCSA has become very popular in recent times. This can be linked to the unique current signatures from the IM’s supply [5,15]. Due to the effectiveness/efficiency of this approach, MCSA has been effectively employed in both stator and rotor monitoring [1,11]. Furthermore, MCSA has also proven to be effective and compatible with Fourier analysis for discriminant feature extraction for critical FDI [6,8,12,14,17].
In the literature, various studies have been presented for fault diagnosis frameworks and classifications that exploit MCSA and spectral features extracted based on Fourier series transformations of signals from their time to frequency domains. For instance, in [15], the authors used both MCSA and FFT under different conditions. Two faults were considered in the study to evaluate their proposed algorithm using stationary and non-stationary signals. Studies presented in [5,14] employed MCSA for SCIM fault detection in broken rotor bars. In their methodologies, spectral features obtained from applying FFT analysis to MCSA were applied to independent component analysis (ICA) for improved performance; the extracted features were labeled FFT-ICA and were proven to contain a wealth of information for FDI with good outcomes when used for online fault detection. In [18], the authors capitalized on the effectiveness of current FDI monitoring. Their proposed methodology used an FFT algorithm to interpret current signals for reliable anomaly detection in the IM. The authors also used advanced signal processing techniques in their proposed method for critical FDI at the bearing and rotor bar of SCIMs to improve the interpretation of current signals. Duc Nguyen et al. [6], trained features extracted from the FFT spectrum of raw current signals using a machine learning algorithm. According to their research, their methodology presents a low-cost, accurate, and robust FDI instrument for SCIMs that uses only current signals and is also applicable to real-world data. In [17], the authors used a novel methodology that combined two techniques, wavelet and power-spectral-density (PSD), to analyze the FFT spectrum of MCSA. The technique’s effectiveness was been demonstrated in diagnosing short turns and broken rotor bars in non-constant-load-torque SCIM applications, just as it does in constant-load-torque motor applications. In [8], Yoo proposed a fault detection algorithm for SCIMs using FFT and PCA. He employed FFT to analyze induction motor current in the frequency domain for fault-characteristic spectral components and used PCA for easy extraction of features from the available components.
In reality, SCIMs and induction motors are often operated under varying loads. It is not recommended to meet/exceed the motor’s maximum loading specification; however, production demands may sometimes require increased loading. These situations often induce stress and/or faults in motors, which may gradually evolve into failures [19]. On the flip side, SCIMs also experience faults that are humanly undetectable under low-load conditions [20]. At low-load conditions, SCIMs often do not generate noise and/or observable fault symptoms, which makes operation riskier since abrupt failures may occur, leading to interrupted production and/or accidents. This rationale makes it necessary to develop intelligent monitoring for early fault detection in SCIMs at low-load conditions. Bessam et al. [20] exploited the Hilbert transform (HT) and a neural network for broken rotor bar intelligent diagnosis in induction machines at low load. Beyond the efficiencies and limitations of their stand-alone HT-based diagnostic technique, other signal processing techniques could be integrated for comprehensive fault diagnostic efficiencies. For instance, Das et al. used an extended Park’s vector approach in conjunction with FFT, DWT, and PSD to process and extract features from current signals for distinguishing induction motor inter-turn stator winding faults from unstable supply voltage conditions [21]. The coefficient of the major peak observed in FFT was used in their methodology to indicate fault severity and load level in the IM. Hussain et al. [22] proposed a method for implementing and analyzing current signatures from a three-phase SCIM using a combination of three signal processing techniques: FFT, short-time Fourier transform, and continuous wavelet transform. Their method demonstrated that MCSA can detect changes in frequency components by obtaining the FFT-based spectrum that contains the initial information about the fault. In [23], the authors demonstrated the non-intrusive nature and simplicity of MCSA. They presented a methodology for detecting faults in an SCIM’s stator winding using external flux sensors on a three-phase SCIM. The sensors were placed on the outside of the motor’s body in the X, Y, and Z directions so as not to interfere with the motor’s operation. FFT analysis of the stator currents revealed a short circuit fault in the SCIM stator winding.
For all these successful case studies, one major take-home is the high efficiency of FTs for MCSA and its robustness for isolating fault frequencies on frequency bands in varying magnitudes. This provides a reliable avenue for harnessing the information provided by frequency-magnitude coordinates as representative features for discriminate modeling for FDI. Peak detection offers a cost-effective diagnostic feature-extraction alternative to spectral frequency-domain extraction and was employed in our study. Its diagnostic efficiency has been recorded in [19,24]. According to Jena and Panigrahi [19], peak detection was one of the techniques employed for fault localization in an automatic gear and bearing using vibration and acoustic signals. In their study, peak detection was one of their proposed filtering techniques, which aimed to unify the approach for both acoustic and vibration signals for enabling fault detection. Further, in [24], using peak detection as one of their techniques, the authors proposed a methodology for distinguishing bearing fault signals from masking signals emitted by drive-train elements. Peaks in the frequency spectrum were used as a discriminating technique for fault classification and separation in their proposed model. In our quest to develop an FT-MCSA-based diagnostic framework for SCIMs, this study makes the following contributions:
- A proposal for a three-phase MCSA-based peak detection approach for diagnostic feature extraction. The proposed feature extraction method extracts the coordinates of the highest peaks from the FFT, PSD, and autocorrelation function (ACF) spectra as features.
- An extensive comparison of ML-based diagnostic models to provide a generalization paradigm for SCIM diagnosis.
- A computational cost assessment of ML-based diagnostic models is presented, and empirical assessments is conducted for improved diagnostic assessment of the models.
The rest of the paper is structured thus: Section 3 presents the theoretical background of the key modules of our proposed study, while Section 4 presents an overview of the proposed MCSA-based diagnostic method. Section 5 presents the experimental study on a physical case study, while Section 6 and Section 7 conclude the study.
3. Theoretical Background
In this section, the theoretical background of MCSA induction motor condition monitoring, frequency domain feature extraction, and ML-based diagnostic models for fault detection and isolation are discussed.
3.1. Review of Current Signature Analysis Methods
MCSA has recently become one of the most popular methods for fault detection in induction motors, owing to its rich spectrum contents and non-intrusive nature of accessing machines. MCSA exploits the current in the supply phases of the SCIM, which often contains little transient and spectral characteristics. The generated current signatures leave little room for proper interpretation of the underlying harmonics generated by the SCIM during operation, which has been a significant challenge for MCSA. Spectral decomposition of these signals, on the other hand, provides a more reliable avenue for understanding system dynamics due to its robustness for representing signatures in representative spectra bands [25]. The signatures typically present a rationale for distinguishing between healthy and faulty states of the machine being monitored because variations in loading of an SCIM are often reflected in the spectral bands. When faults occur in components, they cause a magnetic field anomaly in the regular mutual and self-inductance of the motor, resulting in sidebands across the line frequency [26].
Since motor faults change the harmonic content of the supply current, several methods have been used to aid in the pre-processing stage for feature extraction from measured current signals for adequate comparison between current signatures to detect motor fault signatures. These methods are fundamentally Fourier-based, and they include: fast Fourier transform (FFT), discrete Fourier transform (FDT), mel frequency cepstral coefficient (MFCC), short-time Fourier transform (STFT), wavelet transform, empirical mode decomposition, variable mode decomposition, etc. These popular methods are quite unique in their efficiencies and have been reported in several studies [7,27,28,29,30]. Traditional DFT and FFT discretize signals by representing the signal as different sinusoidal wave components, providing a strong foundation for most other advanced discretization methods. On the bright side, PSD offers an even more-reliable alternative to FFT due to its comparatively higher sensitivity to spectral changes in a signal. PSD computes the energy densities of the constituent frequencies, thereby exaggerating relevance for high-energy signal components while suppressing the effects of lower-energy constituents [27]; however, its limitations for transient signal representation remains a major challenge [7]. These inherent challenges motivated the development of STFT, which provides time-frequency resolution of a signal by taking the Fourier transform of the signal within a time window function; however, the optimal choice of window function remains its major challenge [7].
In contrast to Fourier-based transforms, wavelet transform represents signals as wavelet-series: a representation of a square integral function by a wavelet-created orthogonal series [28,30]. Due to its unique nature, the wavelet transform has been one of the most widely used signal representation method transforms for decades and is broadly used for discretization (discrete wavelet transform) and for transient-spectral representations (continuous wavelet transform); however, the choice of mother wavelet remains an exhaustive challenge for its optimal use and remains an open area of continued research [28]. Interestingly, numerous improvements have been made on existing methods as well as novel ideas offered over the years, including variational mode decomposition (VMD)—a relatively new signal processing technique that can be used to easily decompose signals into their various band-limited intrinsic mode functions. Technically, VMD is an improved version of the wavelet transform and Hilbert Huang transforms that is noise sensitive and devoid of the modal merging effect [29,31]. Though these methods are unique in their efficiencies (and deficiencies) for diverse purposes, their use for diagnosis is often motivated by the discriminative representations they provide from input signals, which form a feature set for diagnosis.
3.2. Review of ML-Based Classification Algorithms
As previously stated, recent AI advancements have aided in the improvement of ML and deep learning models for effective FDI, which typically involves relying on intelligent models for improved FDI at a minimal false alarm rate even amid uncertainties. Even though the efficiencies of these methodologies have been reported in numerous studies, there are still underlying challenges associated with their use, such as computational cost and their tendency to deviate from core engineering concepts, which makes them sometimes irrelevant for cost-conscious industrial applications, as presented in this study [32]. Traditional ML algorithms, on the other hand, offer a more cost-effective and dependable platform for adequate FDI because their efficiency is rarely affected by data availability [32,33]. The effectiveness of FDI algorithms is highly dependent on the nature of the discriminative content of the input signal of the device under monitoring; thus, significant discriminative feature extraction from raw signals is critical [30]. As a result, this study was motivated to investigate various ML algorithms and their efficacy on current-based fault detection after peak-detection-based feature extraction. As a result, in this study, a handful of popular ML-based classifiers are presented and discussed to present their theoretical background for FDI.
DT is one of the most common, cost-efficient, and reliable known ML algorithms that has been effectively employed for both regression and classification problems. DT is an algorithm that uses a tree-like structure of decision-making rules to classify input data into subsets and to make predictions based on this classification [34,35]. Its two main advantages are its ease of use and its ability to present solutions with various outputs [35]. However, this model is prone to over-fitting and under-fitting, which can be overcome with pruning. Again, even with proper pruning, a perfect solution to the problem is not guaranteed [30]. Random forest (RF), on the other hand, mitigates the major challenges of DT by establishing a great number of decision trees at the same instance [30]. RF passes the presented sample through its various structures with different classifiers, computing and storing the output of each tree, which it further compares with single outputs of the popular trees to derive the final classifiers. By simply changing its key parameters, this model eliminates the major problem of DT [30]. One of the well-known disadvantages of RF is its complexity, which can result in high computational cost [36]. Booster algorithms such as Adaboost classifier (ABC), gradient boosting classifier (GBC), and XG boost (XGB) have been used to improve the efficiency and predictive accuracy of weak classifiers such as DT, regressors, and so on. These boosters are ensemble learning algorithms that combine weak learners to produce strong learners by minimizing their training errors [36]. However, these boosters have their challenges, which provides justification for further development of other algorithms to address such issues. For example, as more trees are added to their structure, these models are prone to over-fitting. However, in comparison, each booster presents a distinctive advantage over the other. GBC outperforms ABC in terms of accuracy due to its immense flexibility, which allows the algorithm as many differentiable and convex loss functions as possible [36]. On the other hand, XGB’s scalability presents a structure that achieves algorithmic optimization, distinguishing it from the other boosters [37].
Interestingly, some ML algorithms make their predictions based on the assumption of a set of particular mathematical sequences or theories. For instance, k-nearest neighbor (KNN) is predicated on the assumption that any group of data with similar features will have similar feature values [38]. As a result, KNN performs better in cases where the datasets are evenly distributed; however, in cases where the datasets differ slightly, the accuracy of KNN may be affected [30]. On the plus side, normalization is critical in ensuring even representation of all feature values when feeding datasets to KNN for improved performance. Naive Bayes classifier (NBC) is a popular type of theorem-based learner; it is based on Bayes’ theorem, which defines the relationship between two conditional probabilities of a specific event based on available prior information about the event under consideration [39]. NBC is a better classifier than other models whose principles are also based on Bayes’ theorem because it presents a simpler model with a simpler computational procedure [30].
Overall, the accuracy of ML algorithms has improved over the years, as many algorithms employ techniques that would readily predict complex datasets to give an outstanding result—SVM is a unique ML algorithm that employs a hyper-plane to create its decision boundary using support vectors. It provides space for the user to define gamma parameters for decision boundaries, and its performance is based on: the distance of the sample on either side can change influence; its regularization parameter determines the distance between the decision boundary and separation; its various kernels (for nonlinear boundaries), radial-based function (RBF), and so on [40]. SVMs are known to be computationally efficient; however, as the parameter values increase, the computational speed significantly drops [30], which is a major drawback for its use on large datasets. Amongst ML-based learners, multi-layer perception (MLP) has a relatively high predictive accuracy compared to other methods. MLP is a feed-forward neural network (FFNN) with three structures by default: input, hidden, and output layers [41]. It is very efficient for both supervised and unsupervised situations due to its architecture, learning sequence, and flexibility, making it ideal for classification [30,41]. MLP’s difficulty in implementation and interpretation are some of its significant drawbacks [41].
4. Proposed System Model
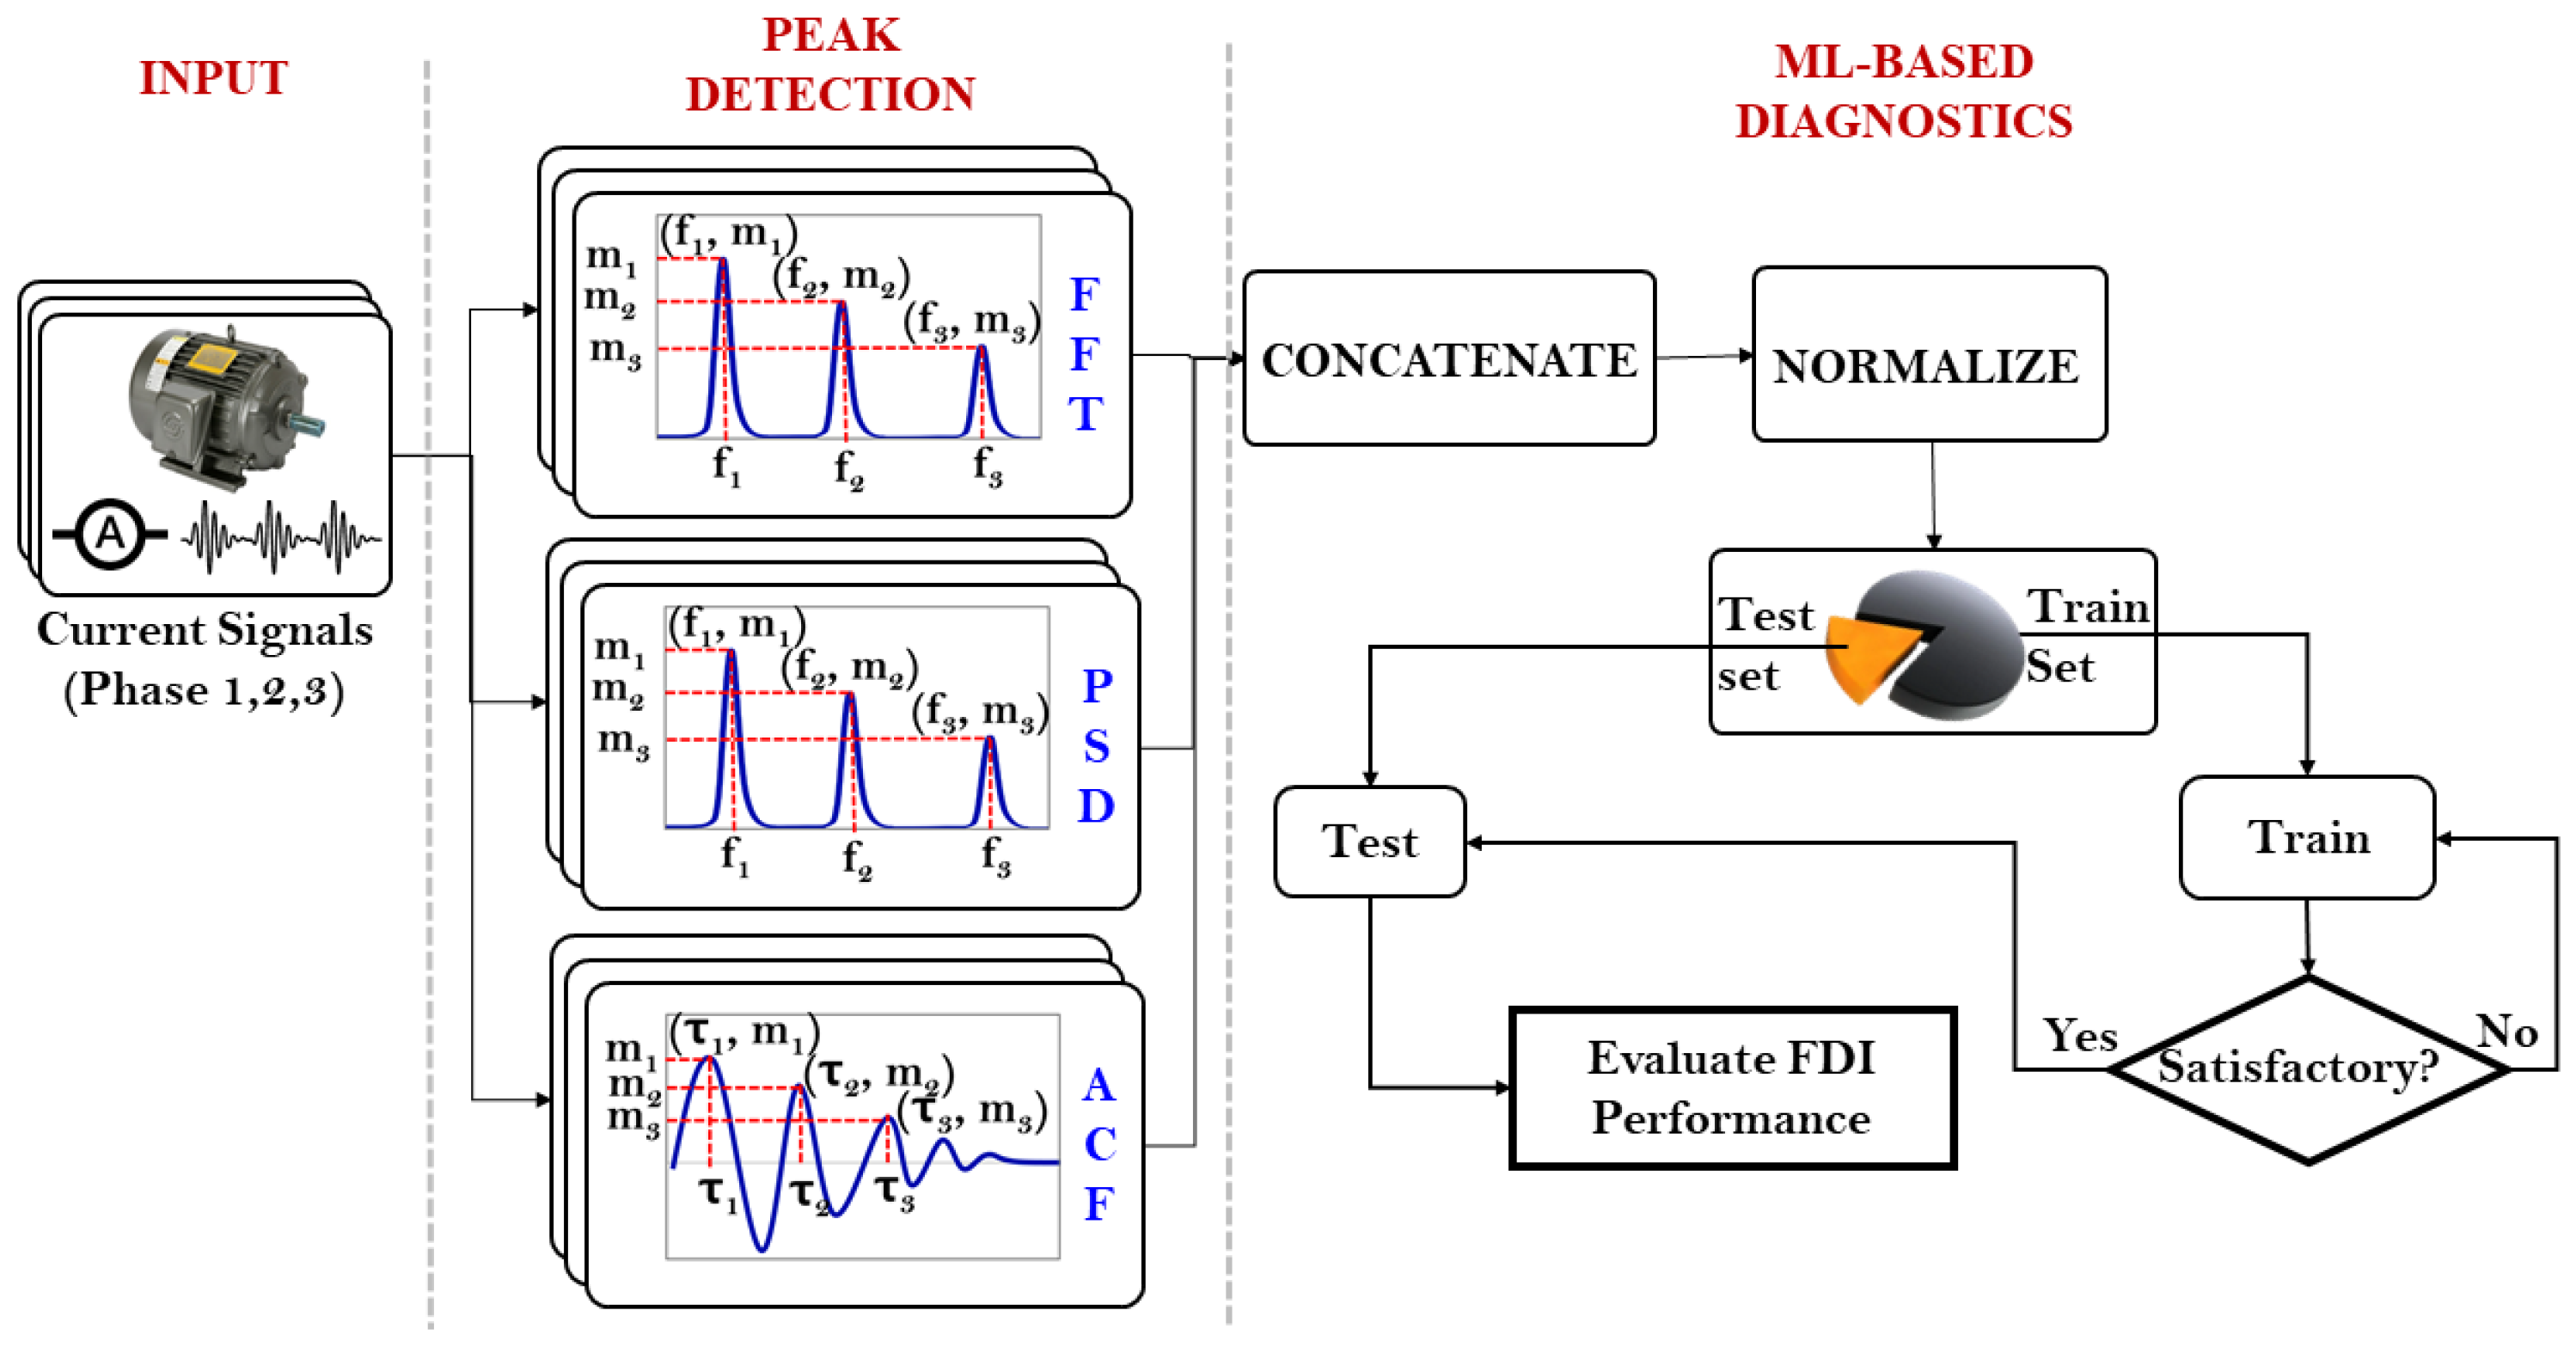
The proposed MCSA-based diagnostic framework for three-phase induction motors fundamentally features a Fourier-based peak detection module for discriminative feature extraction, interpreted by ML-based classifiers for diagnosis. Figure 1 shows the proposed diagnostic framework.
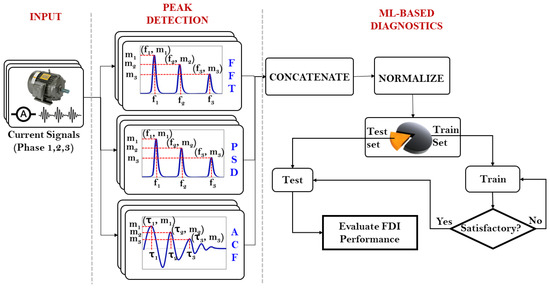
Figure 1.
Proposed diagnostic model.
As shown, the model receives current signals from the three phases of the induction motor, which are simultaneously processed via FFT, PSD, and ACF for peak-based feature extraction. The Fourier transform (and its variants) is named after Joseph Fourier (21 March 1768–16 May 1830), and it serves as the foundation for most frequency-domain signal processing techniques. As previously stated, FFT and PSD provide a spectral representation of the constituent periodic components in the current signatures and can be exploited for accurate condition monitoring. In addition, ACF provides the degree of similarity between a discrete signal and its delayed copy as a function of the delay between them.
Feature extraction from FFT, PSD, and ACF exploits peak coordinates from FTT and PSD spectra and from ACF such that for the first l tallest peaks in each of the three functions, their coordinates are concatenated to form the feature set. These labeled features are then received as input by the ML-based classifiers for discriminative modeling, validation, testing, and performance evaluation using standard classification performance evaluation metrics. The subsections below summarize the core modules of the proposed diagnostic framework.
4.1. Fourier-Based Peak Detection for Feature Extraction
Digital signal processing (DSP) has been a reliable condition monitoring paradigm in a variety of applications for decades. Particularly for induction motors, current signatures are often stationary with different periodic components that are affected by changing operating conditions. Most signals are composed of complex synthesis of sine and cosine functions under relaxable assumptions, which provides a reliable avenue for FFT to flourish.
Different parameters can be extracted from the spectra to make the necessary discriminative inferences for diagnosis. Often, there is a change in magnitude of the spectral components as the operating conditions of the induction motor change, and this presents an opportunity to exploit spectral peaks and their coordinate frequency values as representative features. Given a time-recorded signal (one-dimensional digitized current signal) , the Fourier transform of is traditionally denoted and is computed using Equation (1):
where is the input signal, k is the length of the transform, and is the corresponding frequency-domain output of the signal.
PSD exaggerates the impact of high-energy components while reducing it for lower-energy components by computing the energy densities of the constituent frequencies. Mathematically, PSD generates a spectrum by squaring the magnitude of the FFT outputs from Equation (1), and is obtained using Equation (2):
where is the PSD-domain output from the FFT of the signal.
High autocorrelation (a maximum of 1) implies high similarity between the signal and its delayed component, while the reverse is the case if autocorrelation is close to zero. ACF can be computed via a convolution theorem using Equation (3):
where * means complex conjugation and is the inverse FFT.
Feature extraction from FFT, PSD, and ACF exploits peak coordinates such that for the first l tallest peaks in each of these three functions, their coordinates are concatenated to form the feature set:
4.2. Discriminative Performance Evaluation Metrics
Because every ML model is unique to its architecture, it becomes necessary to exhaustively explore each model’s prowess for diagnostics while also considering other factors such as model complexity, computational costs, parametirization, etc. This presents the need to employ standardized diagnostic/discriminative performance evaluation metrics. These metrics include accuracy, sensitivity, precision, F1-score, and false alarm rate (FAR) [40]. These criteria are defined, respectively, as (4)–(8).
where and , respectively, are the number of correctly classified classes, number of incorrectly classified classes, number of incorrectly labeled samples belonging to a class that were correctly classified, and the number of incorrectly labeled samples belonging to a class that were incorrectly classified.
Although these metrics provide a global perspective for evaluating model classification performance, it may become necessary to evaluate each model’s class-specific performance to ensure a more comprehensive performance assessment. For instance, a classifier may return an overall classification accuracy of 90% over a five-class problem set. This high accuracy may emanate from the model’s strengths for correctly classifying three out of the five classes, whereas it may flaw on the remaining two classes. On the contrary, another model may return the same level of accuracy but its class-specific classification performance may be fairly uniform for each class; hence it would be more reliable than the previous model. This is usually the case, and presents the need for the confusion matrix, which provides an avenue for evaluating each model’s class-specific diagnostic performance.
5. Experimental Study
This study proposes an MCSA-based diagnostic framework, which was employed on a physical testbed at the Defense Reliability Laboratory, Kumoh National Institute of Technology, Korea. The testbed consists of different four-pole, 0.25 hp, three-phase squirrel cage (delta connection) induction motors operating at different operating conditions, as summarized in Table 1.

Table 1.
The different fault conditions of induction motors used in the experiment.
Three-phase induction motors are often exposed to different failure modes that emanate from sources ranging from environmental, thermal, electrical, and other factors. However, some failure modes are more critical than others, and they are prioritized in this study. Misalignment in a motor drive system is severe and the most frequently occurring condition in motor driven systems and may present itself in the form of angular, parallel/offset and/or a combination of parallel and angular misalignment [42]. In reality, it may be highly impossible to experience a single type of misalignment in absolute absence of the other. Often, even an acceptably aligned rotor has some level of a combination of angular and parallel misalignment (though insignificant). On the other hand, another frequently occurring (and critical) failure in induction motors is a broken rotor bar, which often occurs due to mechanical stresses emanating from variable operating conditions [43]. In addition, inter-turn short circuit winding is yet another critical and highly severe failure mode that often results in complete motor breakdown if undetected. This failure occurs as a result of aging and thermal stress to the insulator separating some turns in a particular phase of the motor [1,13,44]. Consequently, our study prioritizes these three critical failure modes, which were replicated on the testbed shown in Figure 2.
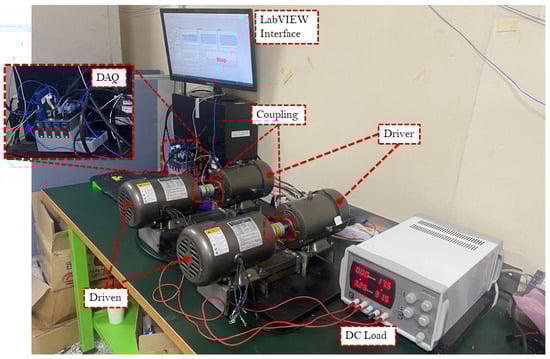
Figure 2.
A pictorial view of the experimental setup.
The induction motors were loaded via a DC loading mechanism—a DC power supply was connected to the driven motor to induce a magnetic field between its rotor and stator, which causes resistance in the driver, resulting in a low-load condition. The motors were operated at a constant speed of approximately 1780 RPM (30 Hz), while data were collected via the driver’s terminals using a NI 9246 module connected to a cDAQ-9178 connected to a desktop computer, as shown in Figure 2 above. The digital current signals were collected via a LabVIEW interface and stored in .csv format at a sampling rate of 50 Hz; the spectral resolution of the signals was 0.0003 Hz. Figure 3 shows the manually induced fault conditions to replicate rotor misalignment (ARM-1), a broken rotor bar (BRB-2), and inter-turn short circuit winding (ISC-3) failure modes for the experiment.
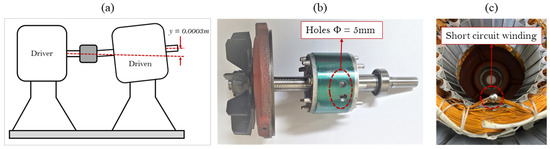
Figure 3.
Fault conditions to replicate for the failure modes: (a) rotor misalignment, (b) broken rotor bar, and (c) inter-turn short circuit winding.
ARM-1 was achieved by first aligning the motors (driver and driven) using a precision laser alignment kit, and then to misaligned them by 0.3 mm for both parallel and angular misalignment. BRB-2 was imitated by drilling two holes of diameter 5 mm to a depth of 5 mm. ISC-3 was imitated by bridging seven (7) coils in the same phase. For control, a motor with no fault/failure mode (NOM-4) was also employed.
5.1. Signal Processing for Feature Extraction
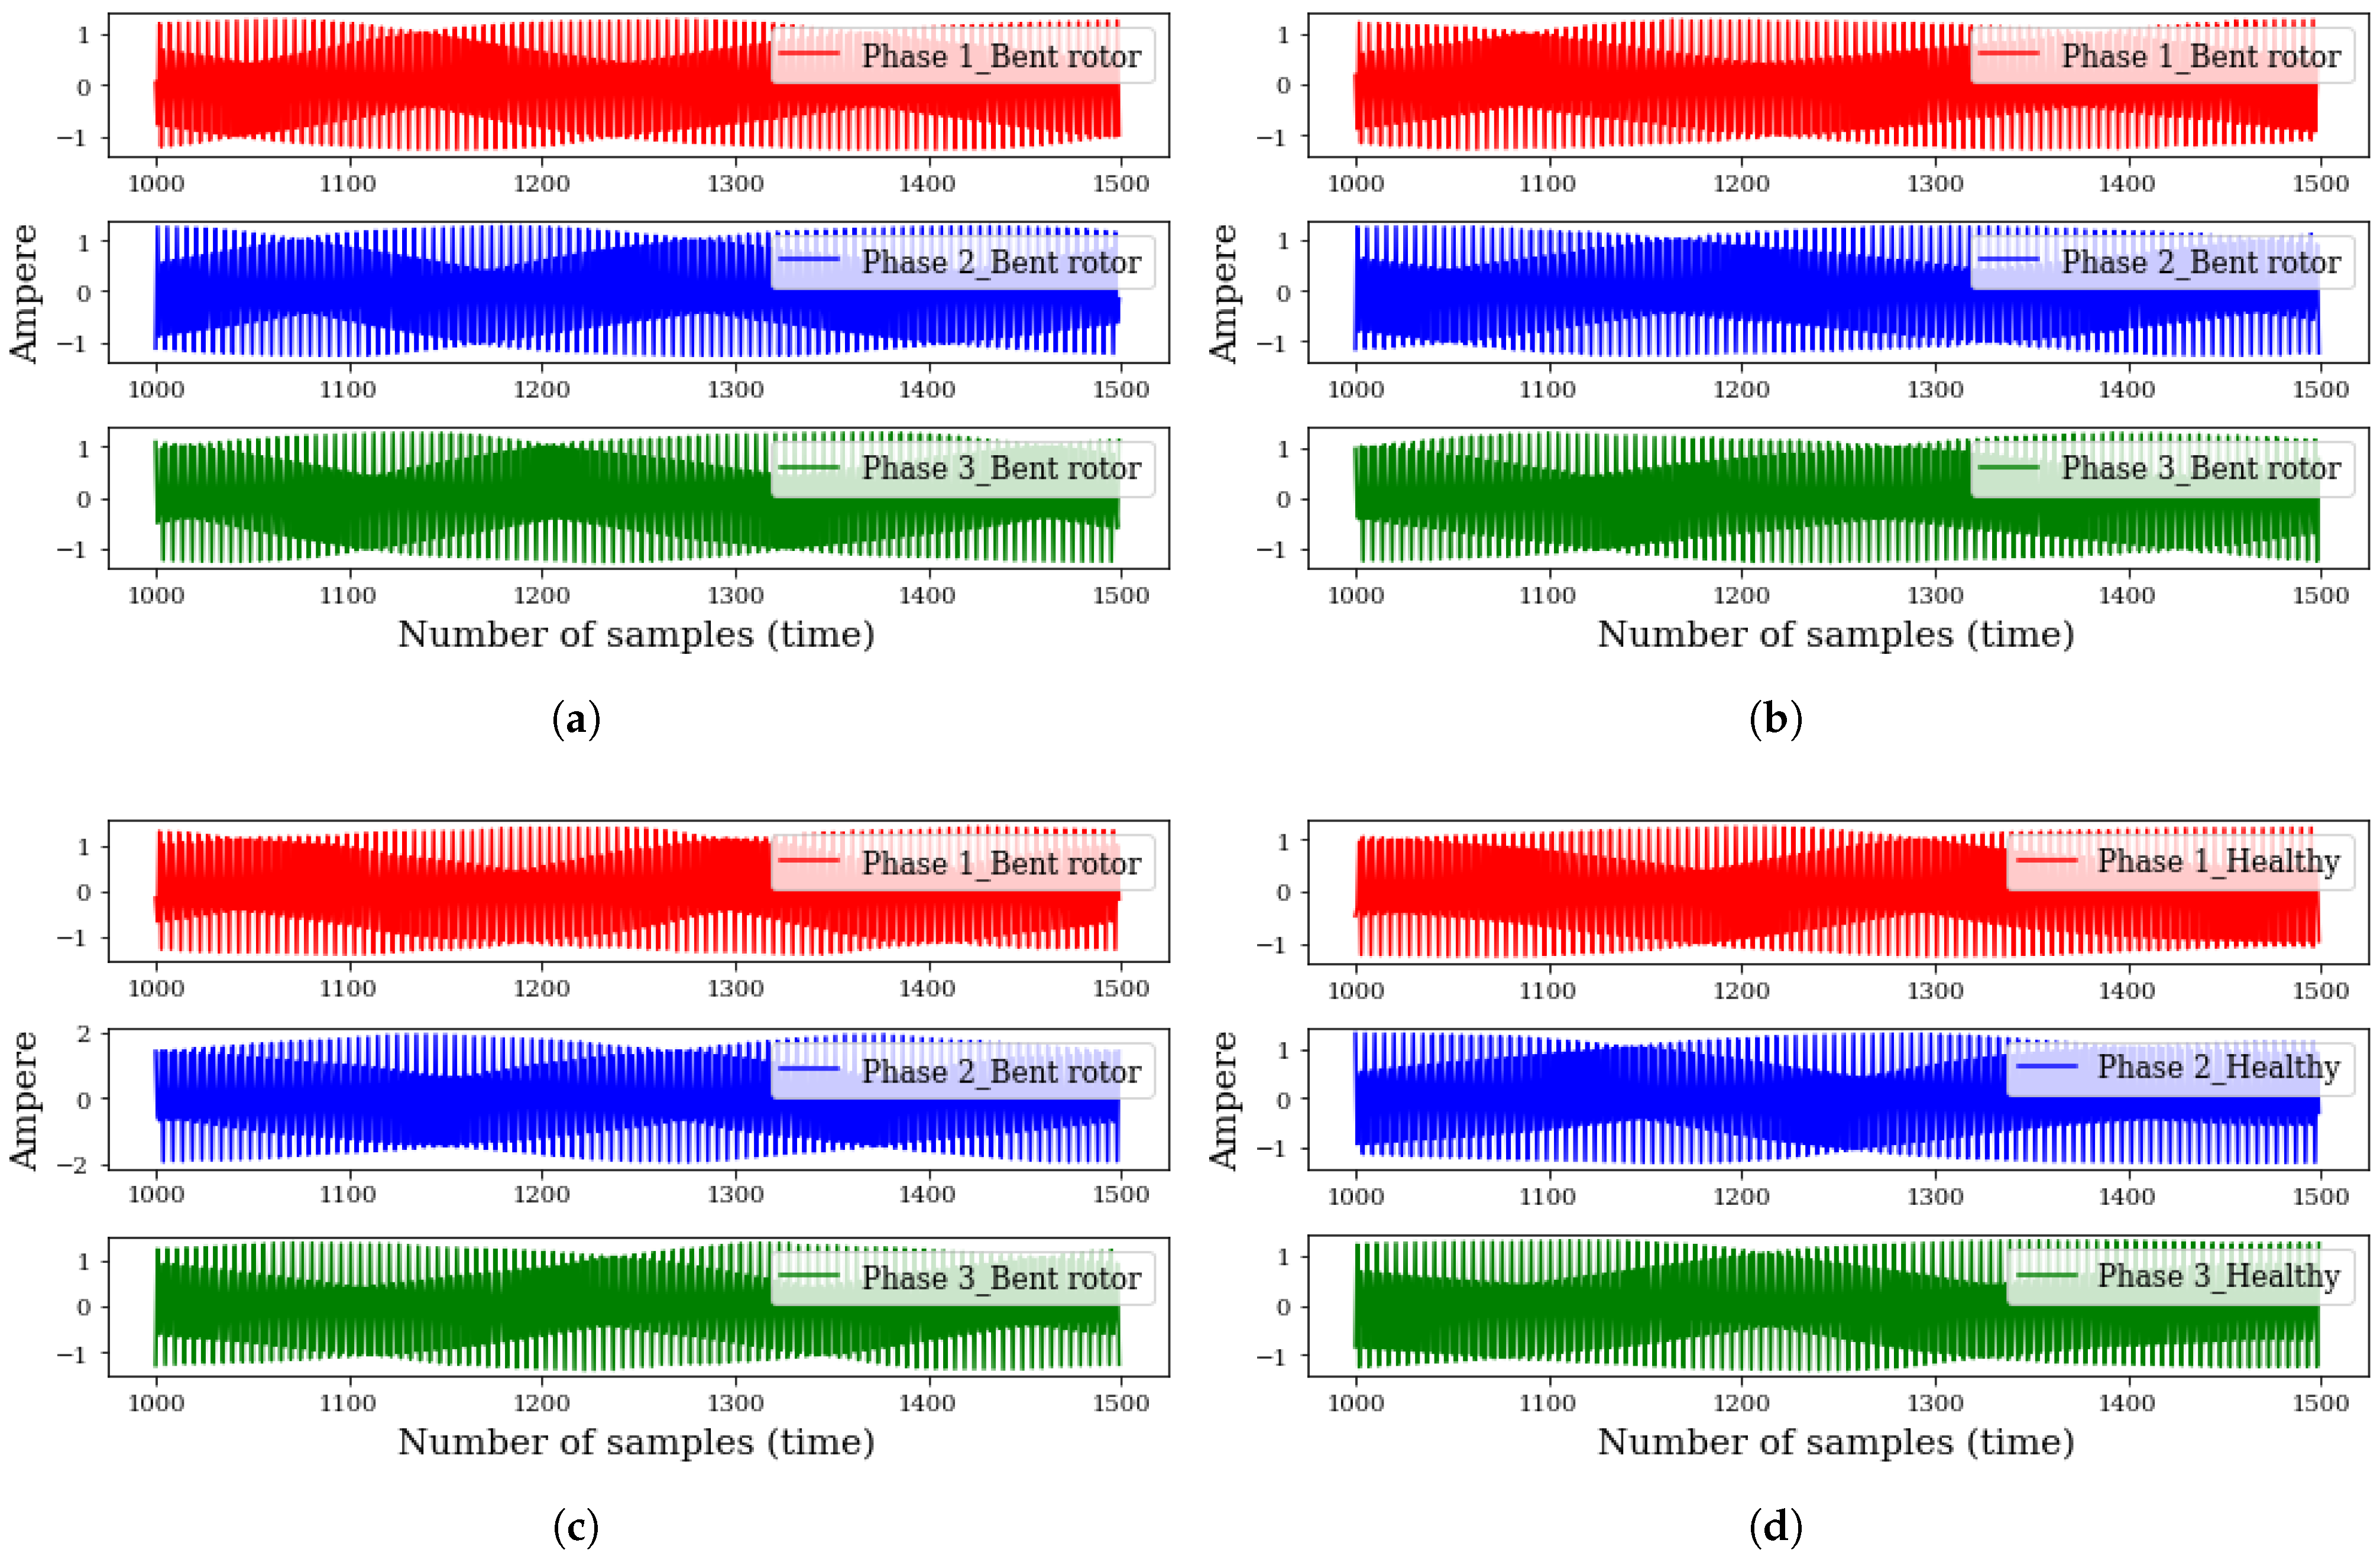
Current data were collected from the three-phases of the motors at the different operating conditions and cleaned. Figure 4 shows a visualization of the current signals collected from the induction motors at the different operating conditions, with red, blue, and green representing phases 1, 2, and 3, respectively.
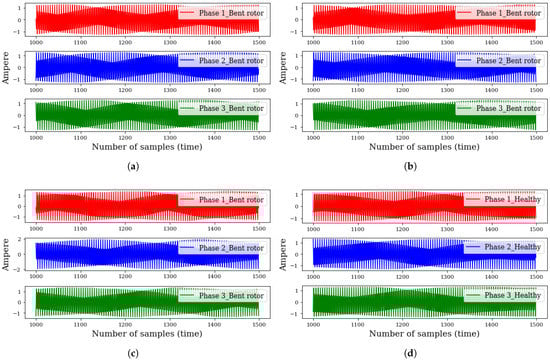
Figure 4.
Current signals collected from the induction motors: (a) ARM-1, (b) BRB-2, (c) ISC-3, and (d) NOM-4.
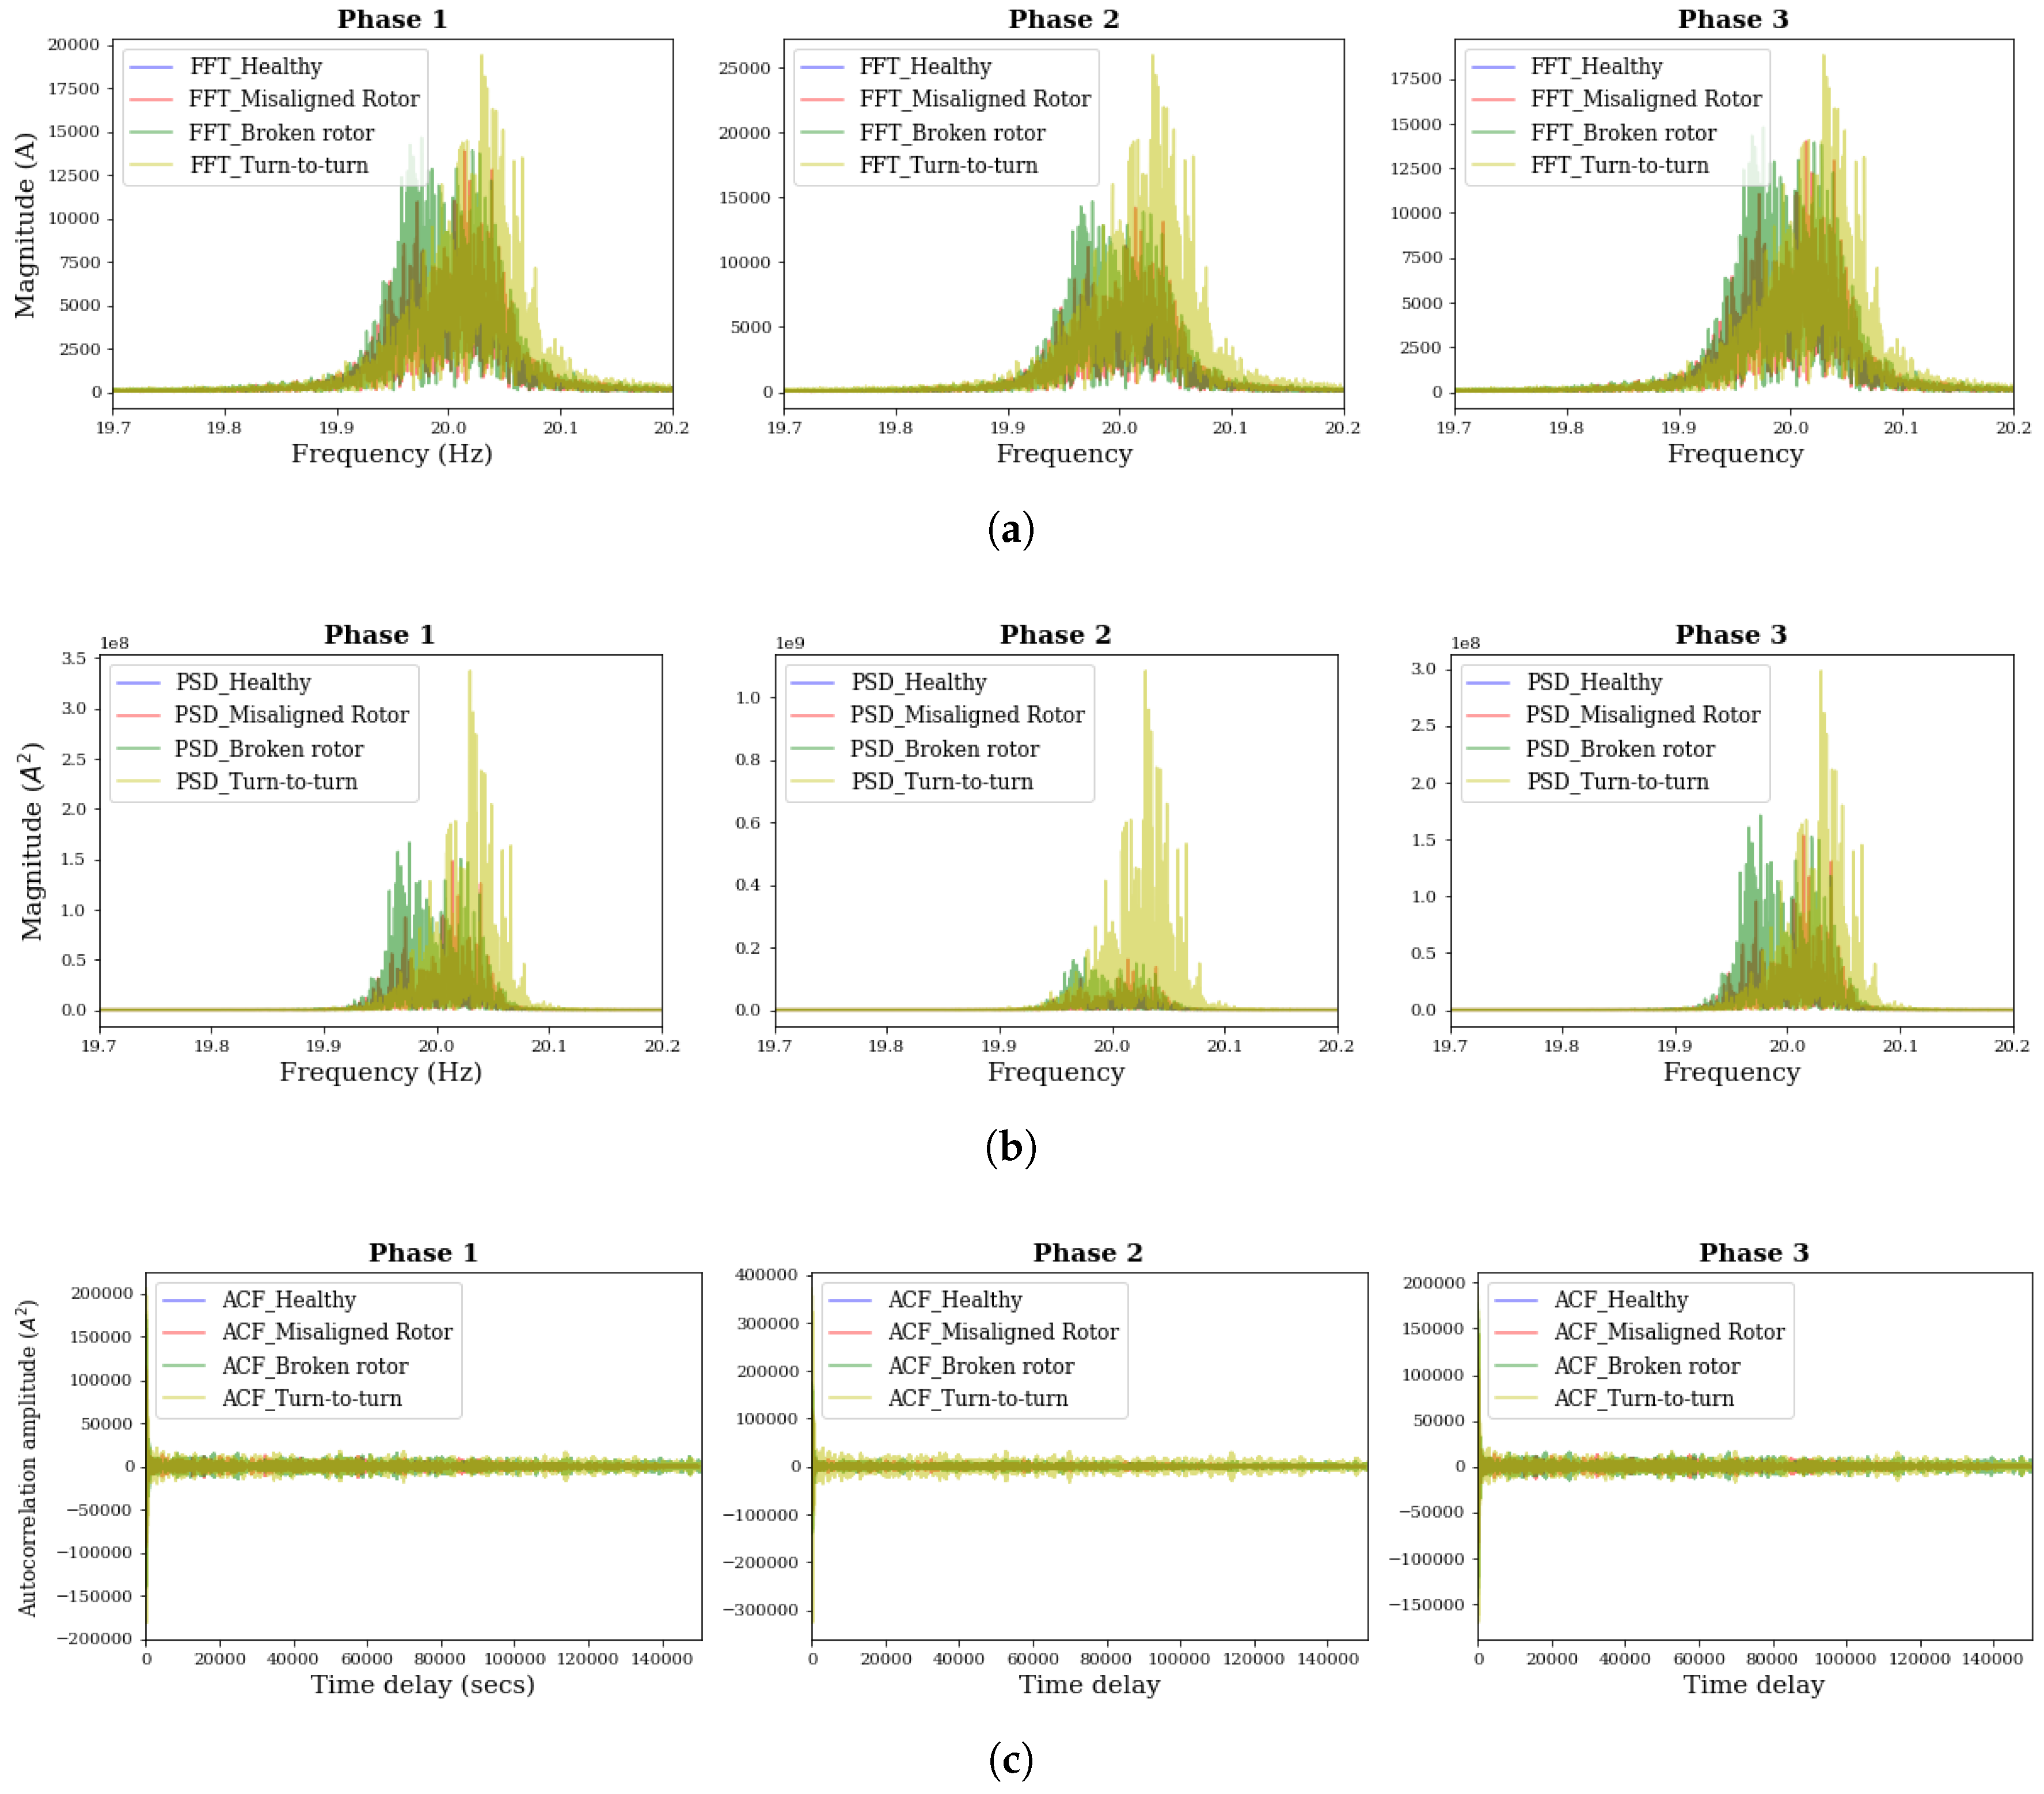
As shown, the signals reveal some similarity in waveforms across the different operating conditions apart from the phase 2 signal (in blue) of Figure 4c, whose maximum amplitude is about 2 amperes while the rest have a magnitude of 1 ampere. Next, the signals were processed for feature extraction using the method proposed in Section 4. Figure 5 shows the respective FFT, PSD, and ACF visualizations of the signals under the different operating conditions.
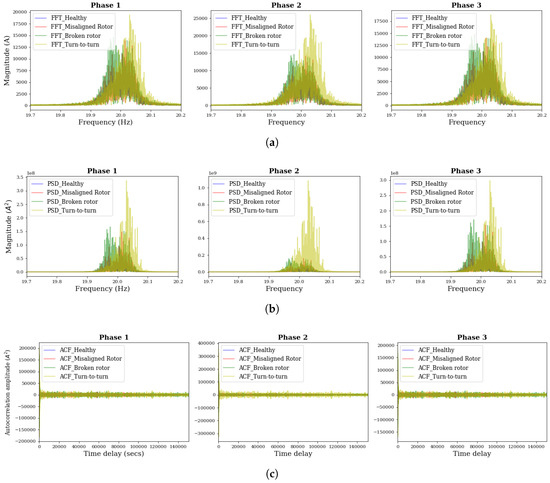
Figure 5.
Phase current signal spectra for different fault conditions: (a) FFT (b) PSD, and (c) ACF.
As shown in Figure 5a,b, the FFT and PSD for each of the different operating conditions uniquely reflect different spectral bands of different magnitudes and frequency ranges, whereby PSD is more sensitive for the 1SC-3 condition for phase 2 signals. In addition, the ACF results in Figure 5c reveals differing ACF amplitudes over the time delay for each of the phases. These were concatenated to form the feature set for discriminative modeling for diagnosis. To develop the feature set, the proposed peak detection algorithm extracted the ten (10) tallest peaks from the FFT, PSD, and ACF spectra, respectively, from each of the current signals collected from the different operating conditions.
5.2. Feature Evaluation
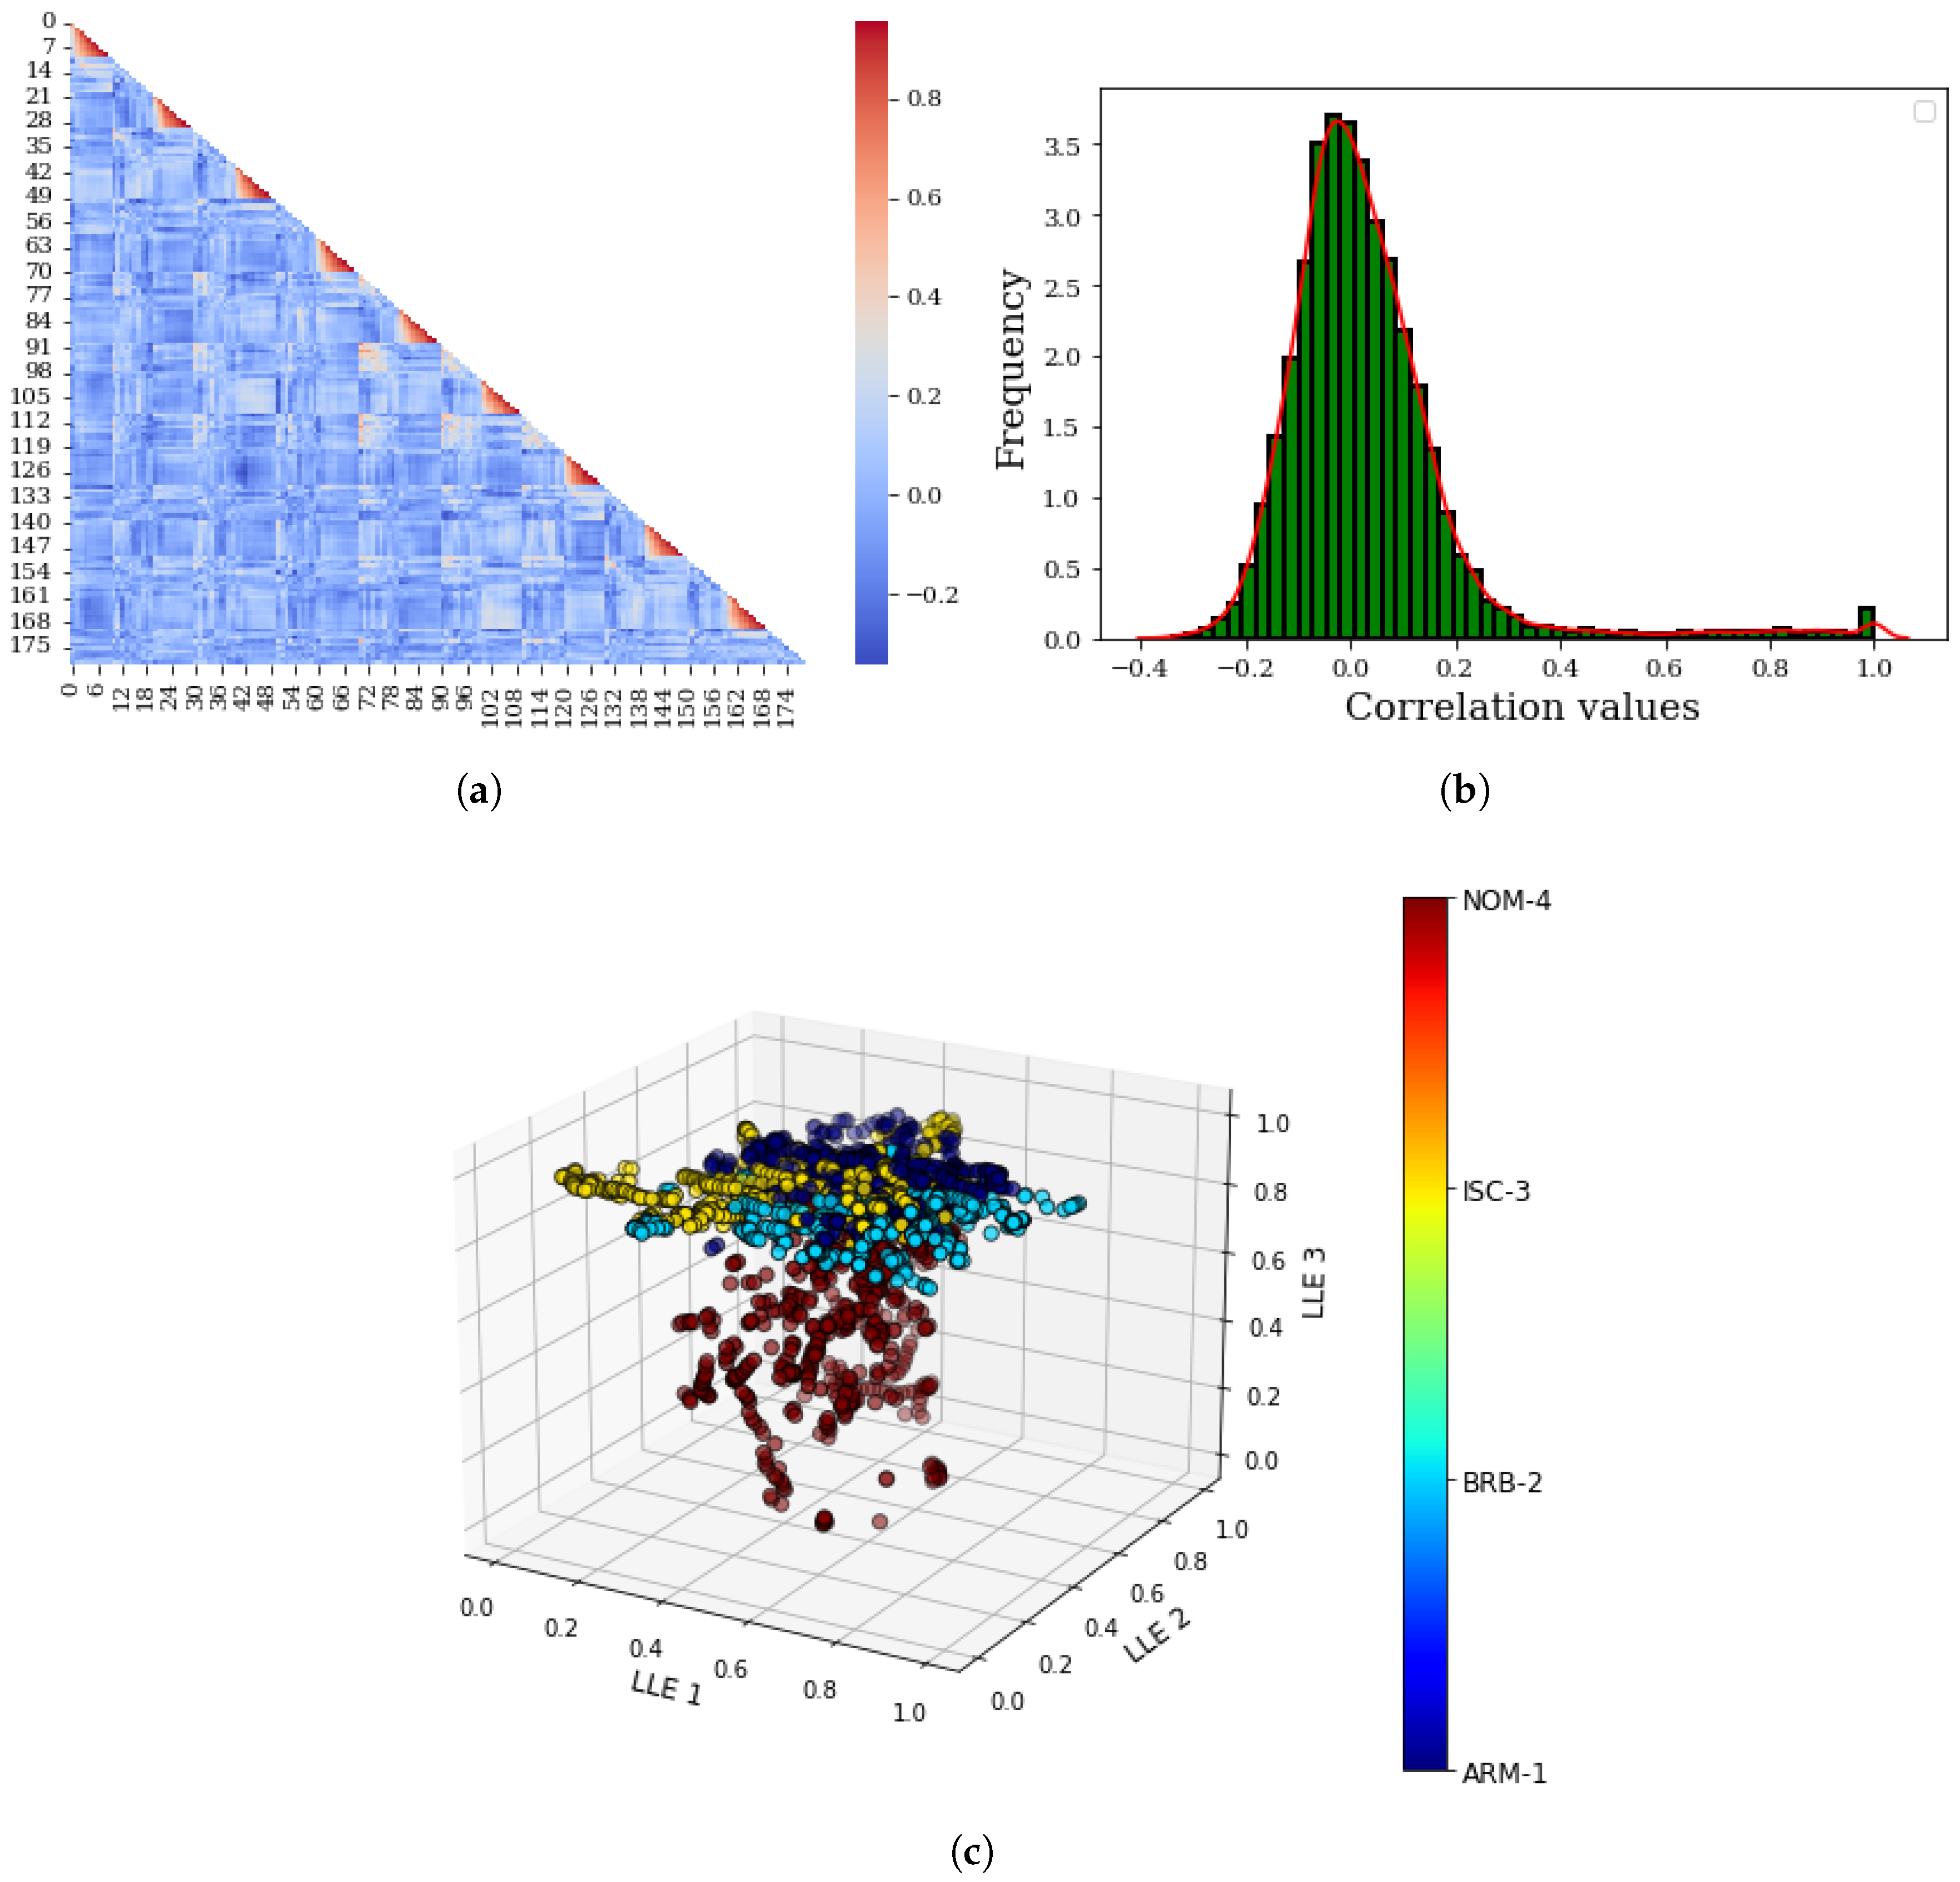
Ideally, the efficiency of traditional ML-based classifiers for diagnosis relies on the discriminative power of the input features. Interestingly, Spearman’s correlation provides a reliable avenue for evaluating the discrimnance amongst the features extracted from each of the operating conditions. This tool measures the linear dependence between two continuous variables and returns a value in the range of –1 (negative correlation) and +1 (positive correlation). Apart from serving as an easy-to-use feature selection tool, it fundamentally provides a hint of the level of dsiscriminance between/amongst features, whereby a high positive and/or negative correlation implies poor discriminance in the features and vice versa. Sometimes, it is also desirable to visually assess the features for discrimnance. This is often supported by dimensionality reduction tools such as principal component analysis (PCA), locally linear embedding (LLE), independent component analysis (ICA), etc. These algorithms fundamentally reduce the dimensions of a feature set and have been employed for numerous purposes, including feature selection, feature reduction, health index construction, etc., and are unique in their individual architectures. For ease-of-use and familiarity in the domain, LLE was employed for reducing the features to a three-dimensional vector for visualizing their discriminative potentials. Accordingly, Figure 6 shows the feature assessment results.

Figure 6.
Feature evaluation results: (a) correlation heatmap between features, (b) probability density plot of the features, and (c) LLE-assisted discriminative property assessment.
Figure 6a shows the Spearman’s correlation heatmap of the peak features extracted from motor current signals. Overall, the feature set, which formed a 180-dimensional feature matrix, is mostly uncorrelated, with correlation values normally distributed with a mean of zero, as shown in Figure 6b. This hints that the features are not correlated and are, hence, very useful for discriminative modeling. Further assessment of the features using the LLE-based feature visualization tool shows in Figure 6c that the dissimilarity between respective feature clusters per operating condition. They are reasonably isolated in space, as shown in the dark blue, light blue, yellow, and red circles corresponding to the ARM-1, BRB-2, ISC-3, and NOM-4 conditions, respectively.
5.3. ML-Based Diagnosis
Empirically, the feature extraction and evaluation processes described in the previous subsections provide the platform upon which traditional ML-based classifiers are deployed for fault classification. Practically, each ML-based classifier is unique in its architecture and learning principle, and this often poses a concern when choosing the most appropriate model for practical use. In addition, their respective cons and computational costs also pose valid concerns during decision making. Consequently, we explore (as much as possible) many popular traditional ML-based classifiers in our study. The classifiers summarized in Table 2 were employed for training (using the training feature set) and testing (using the test feature set).
Table 2.
Classifiers and their respective architecture.
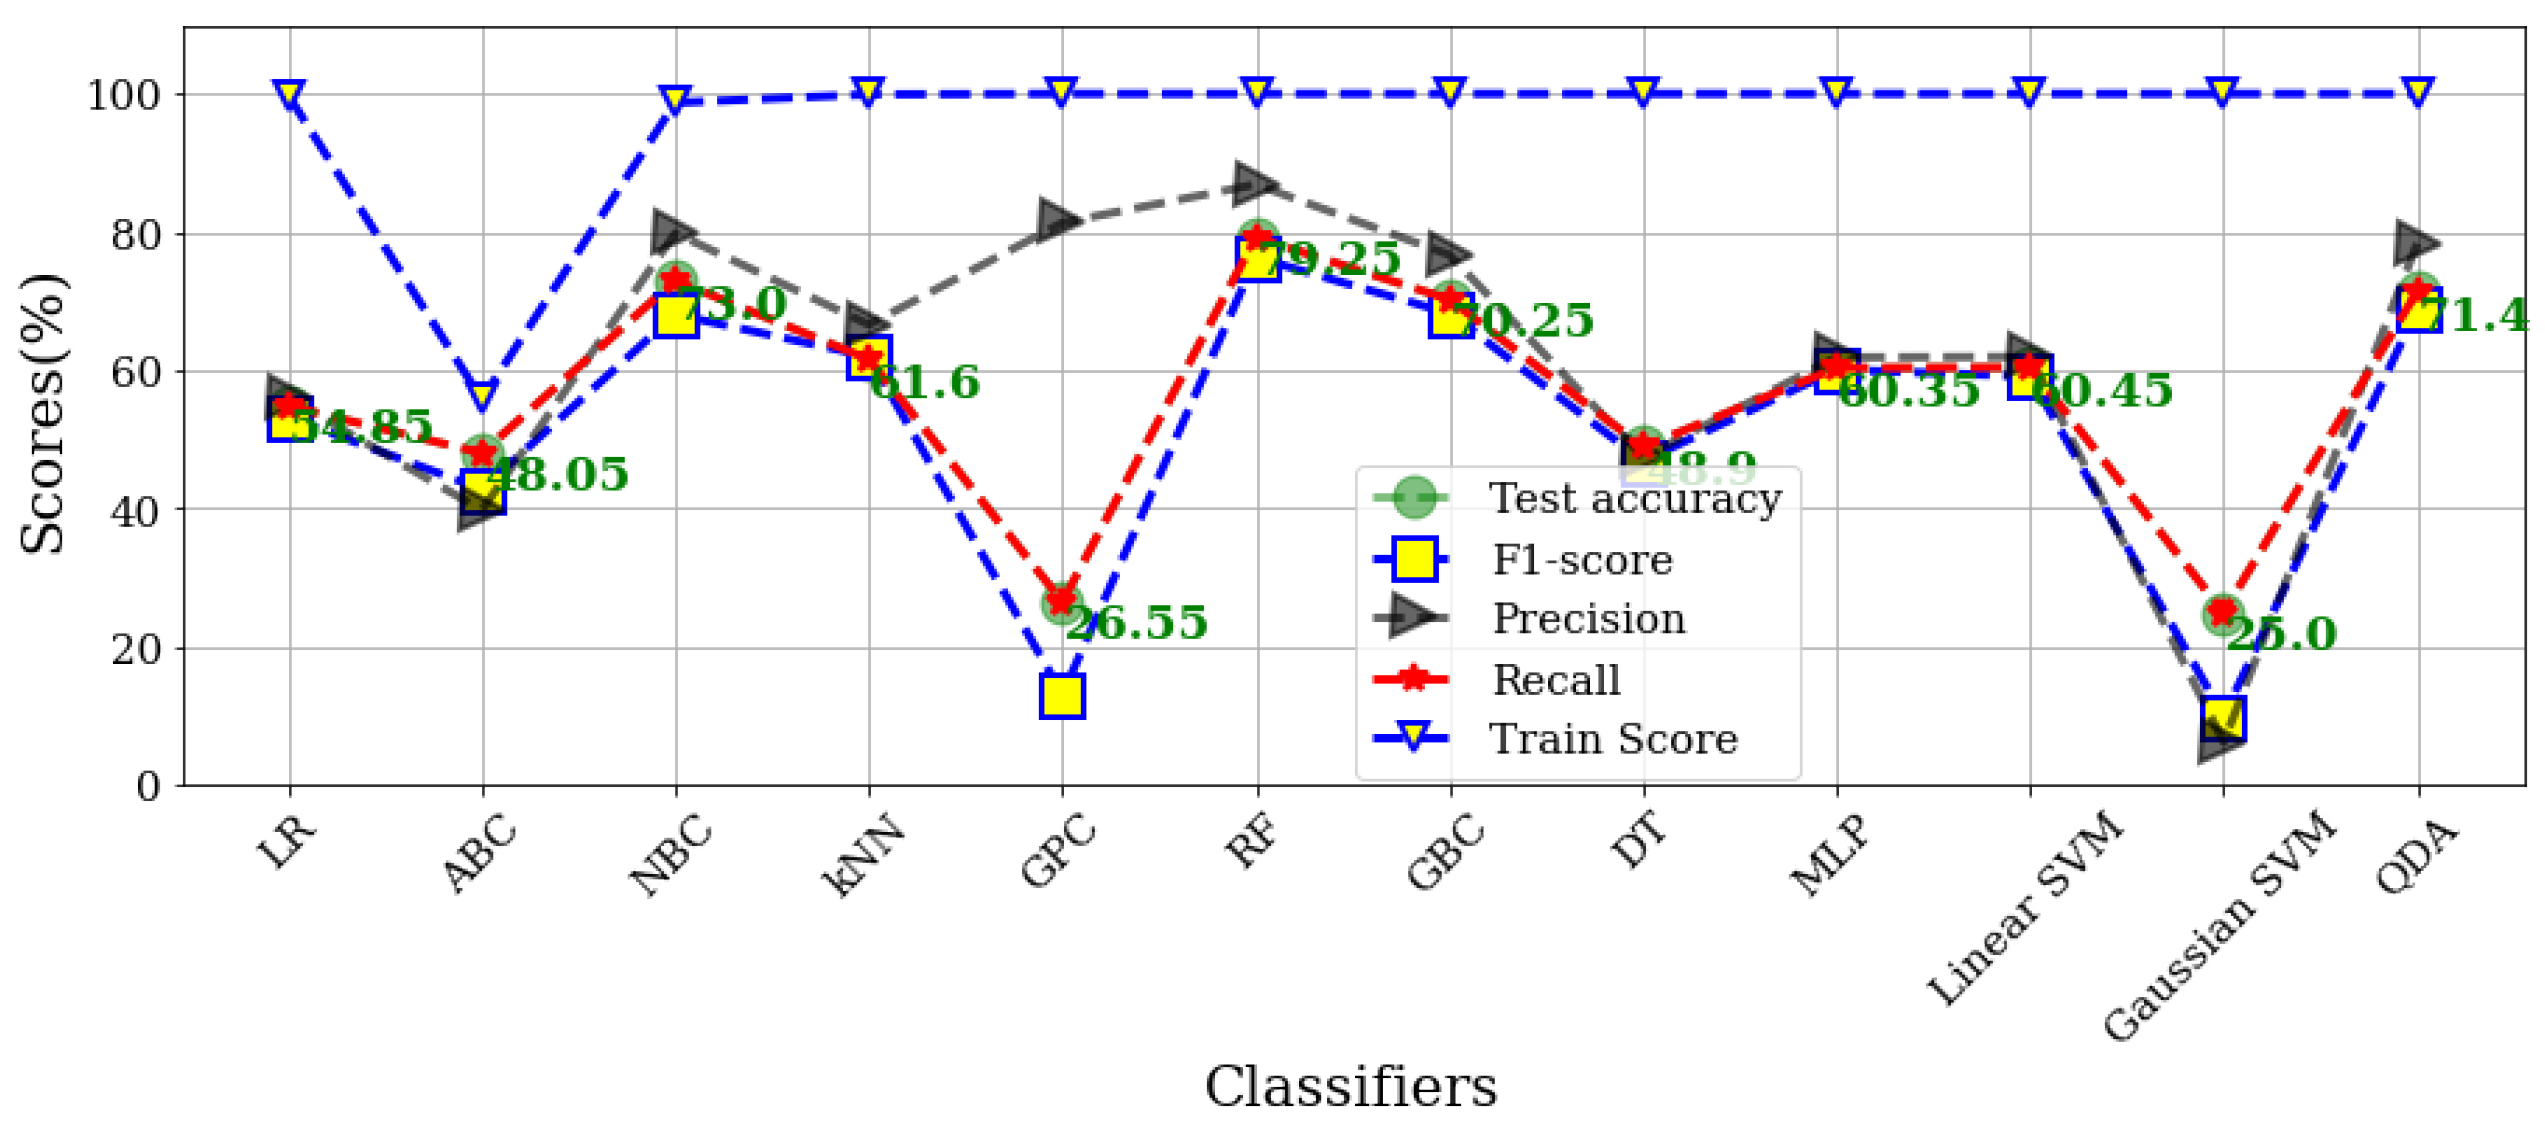
For optimal efficiency, each algorithm has its own set of parameters and architecture, as shown in Table 2. Exhaustive parameter tuning optimized parameters for each algorithm, which are recorded in Table 2. Figure 7 illustrates the accuracy, precision, recall, and F1-scores resulting from ten-fold cross-validation of the algorithms on the test data.
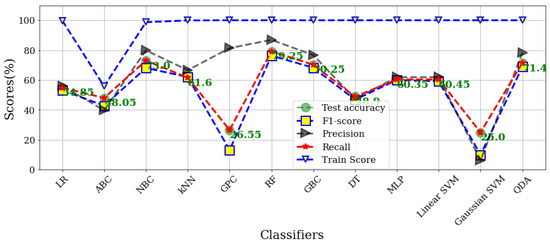
Figure 7.
Global performance evaluation of the classifiers on the test data.
In general terms, accuracy measures a model’s ability to predict classes correctly and is represented in Figure 7 in green circles. F-1 (represented by yellow squares with blue dotted lines) is calculated by taking the average of precision and recall, which determines the proportion of true predictions the model makes among all actual predictions. Precision determines the percentage of classes that are true and is represented by black triangles, while recall determines the percentage of predicted cases that are actually true and is represented by red stars. As observed, RF is the highest performing classifier, with a test accuracy of . This is followed by NBC, QDA, and GBC, whose test accuracies are , , and , respectively. On the downside, GPC and Gaussian SVM were the worst performing, with test accuracies of and , respectively, while the rest of the classifiers ranged between and .
It can be observed that the training scores of all the classifiers (except ABC) on the training data are almost ; however, their test performances are not as optimal as anticipated. This hints at the superiority of some classifiers over others. Interestingly, RF remains one of the most reliable ML-based classifiers and has been shown to be the most accurate in the proposed case study. From a different perspective, assessing the computational cost of the classifiers provides a further avenue for assessing their suitability for practical use, especially in cost-sensitive situations where computational power is a concern. Table 3 summarizes the computational costs (in seconds) of the classifiers for training and testing.
Table 3.
Computational costs of training and testing process.
Table 3 reveals that the most accurate classifier, RF, takes approximately 3660 milliseconds (3.66 s), whereas the second most accurate took much less than 1 s for the same process, yet returned a reliable test accuracy. However, its efficiency is limited to the underlying assumption that the input data distribution is Gaussian—which is not often the case for real-life applications. On the high side, GBC revealed itself as a greedy algorithm, as shown by its high computational cost of 31,210 milliseconds (31.2 s); yet it ranks third in the test comparative assessment. This is followed by GPC (whose cost is 5030 milliseconds), which is costlier than RF but still the second least accurate on the test data. Based on the comparison, a choice of classifier can be made according to the metric being assessed. Typically, computational speed is highly considered in most real-world scenarios, but not at the expense of predictive efficiency. Considering such circumstances, NBC may be preferred, since it offers both low computational cost and significantly high test accuracy. However, RF is an appropriate choice when there is abundant computing power available or when accuracy is critical.
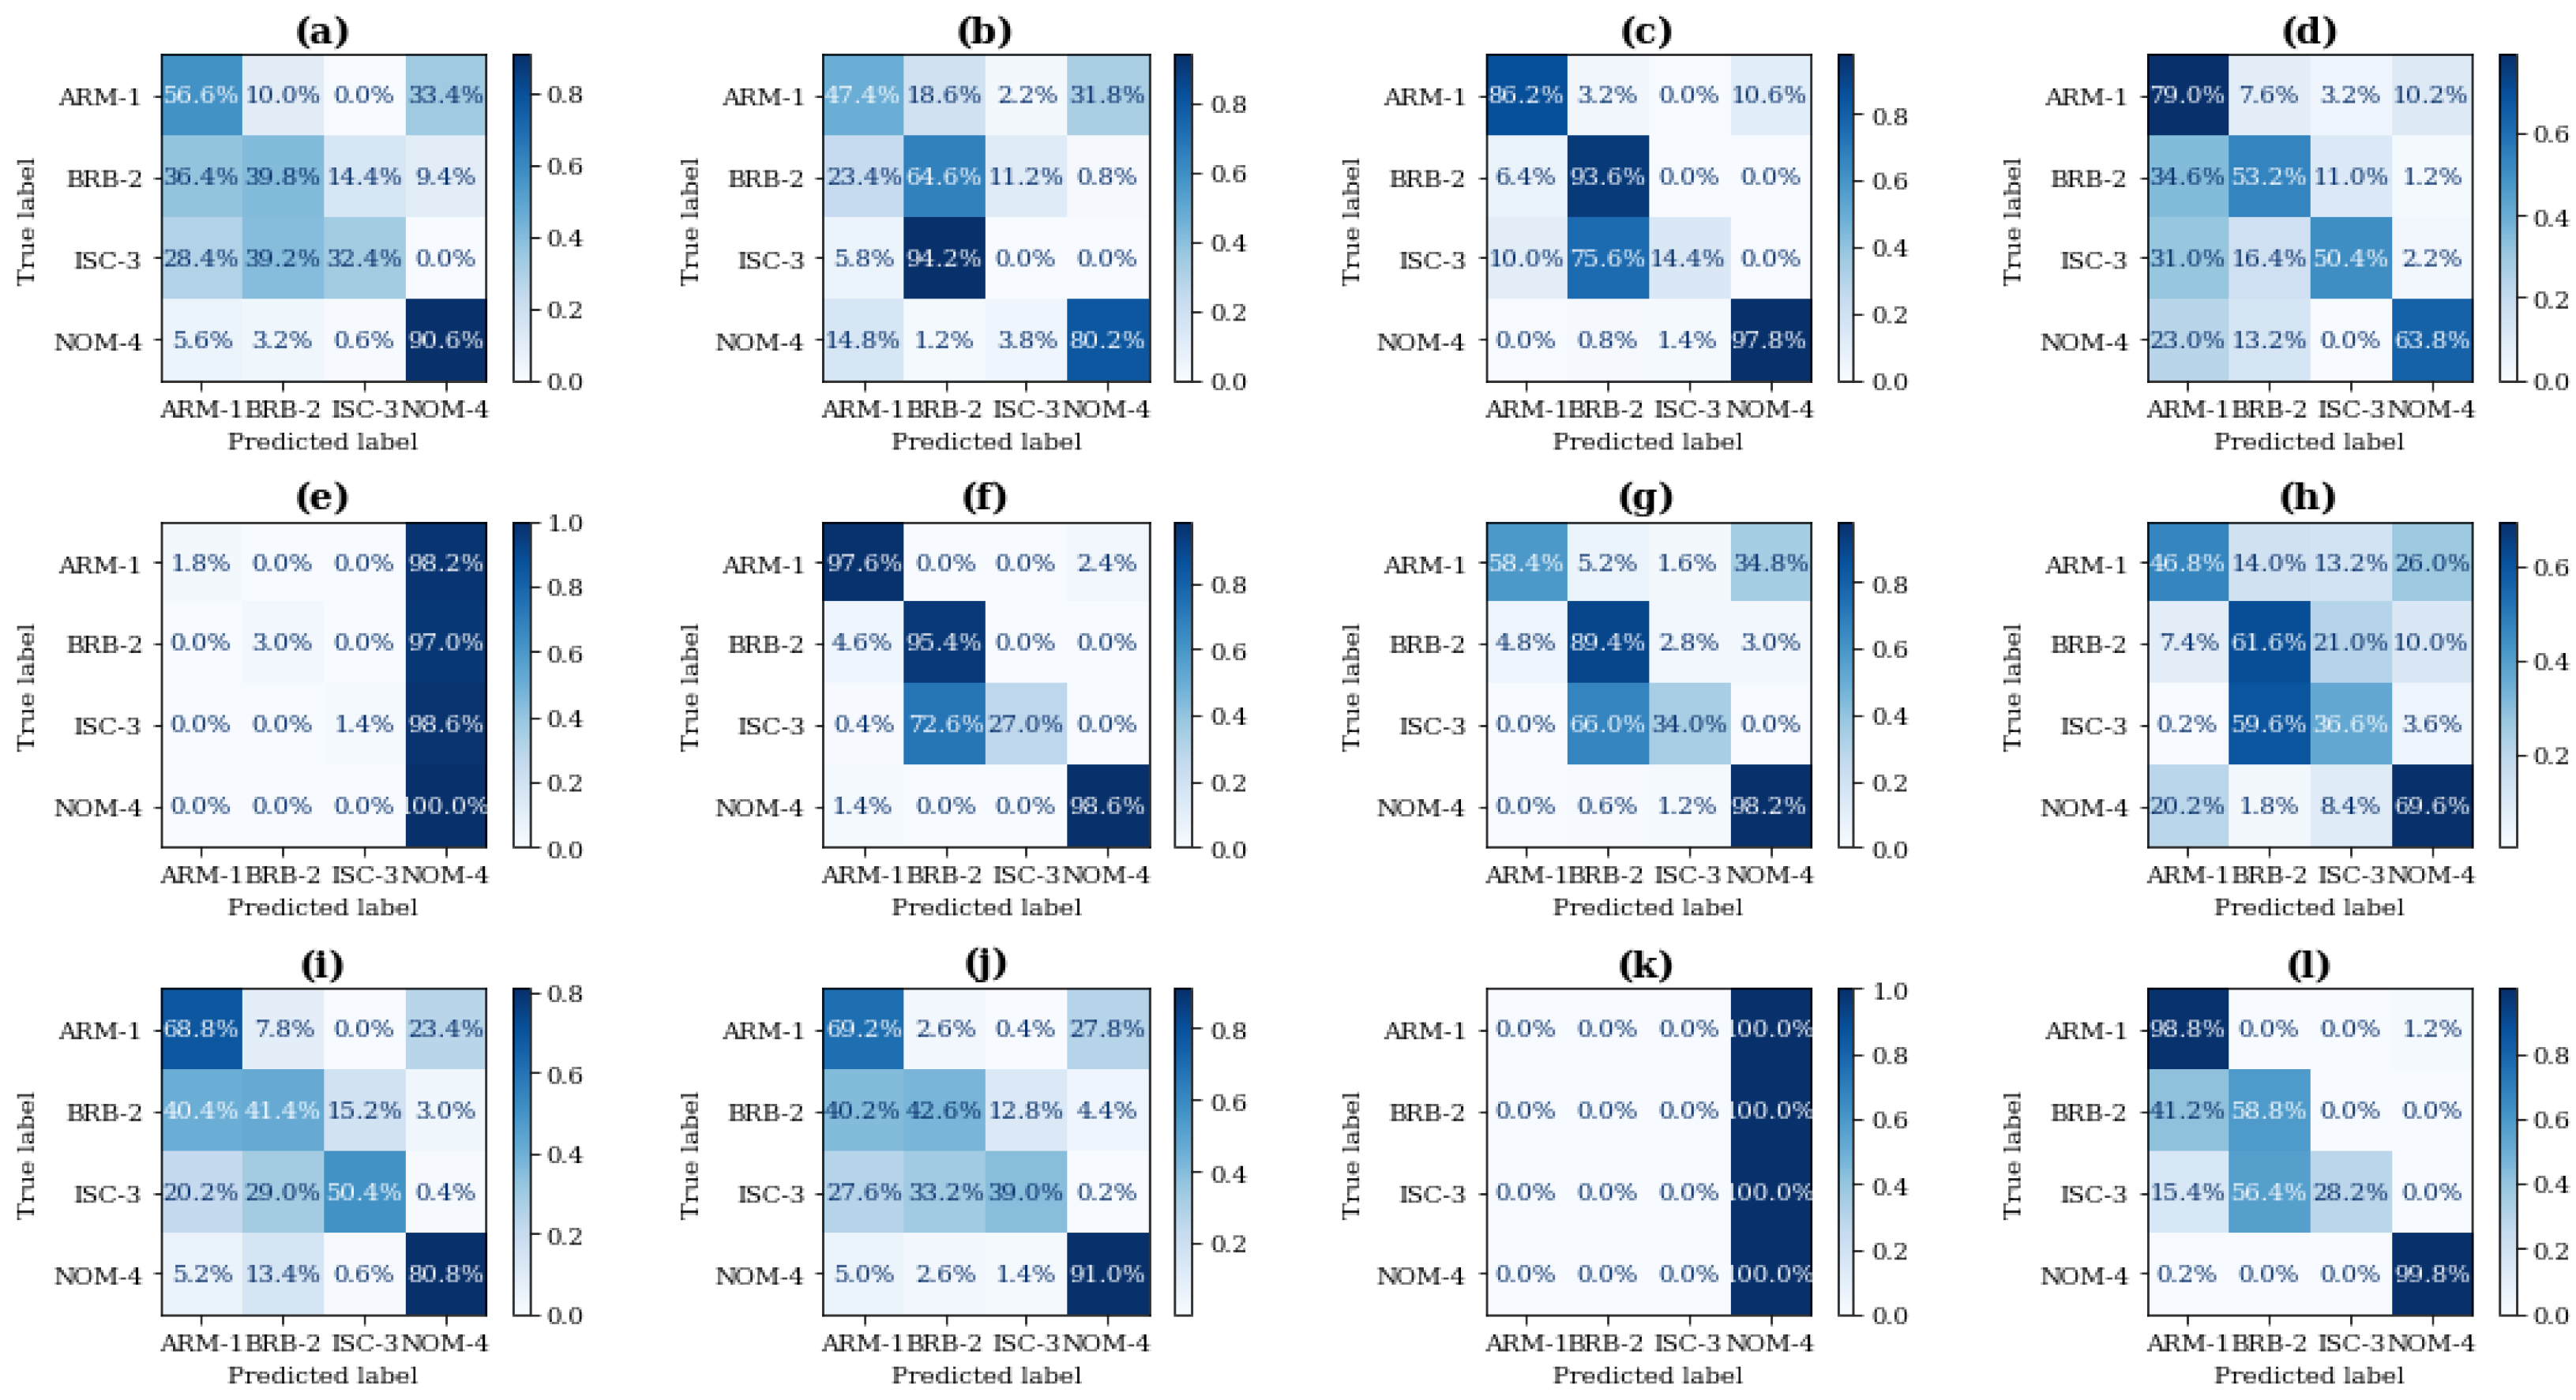
Digging deeper into the algorithms, we assessed the class-specific predictive performance of the classifiers using the traditional confusion matrix, which reveals the probability of correct predictions of a classifier for each of the classes of interest, i.e., operating conditions. Figure 8 illustrates the confusion matrix resulting from ten-fold cross-validation of the algorithms based on the test data.

Figure 8.
Confusion matrix on test data: (a) LR, (b) ABC, (c) NBC, (d) kNN, (e) GPC, (f) RF, (g) GBC, (h) DT, (i) MLP, (j) Linear SVM, (k) Gaussian SVM, and (l) QDA.
Close examination of Figure 8 reveals that GPC and Gaussian SVM returned the highest false positives (FP) per class (except NOM-4), as shown in Figure 8e,k. However, class-specific efficacy in prediction for RF (see Figure 8f) is observed in its high true positive values (across the diagonal). Unfortunately, the false-alarm rate for ISC-3 is observed in the false negative to BRB-2. This implies that the model mostly recognizes data belonging to ISC-3 as belonging to BRB-2, and this reveals itself as a major limitation of our study.
6. Discussion, Open Issues, and Future Work
Despite the robustness and low cost of maintenance for extended use of SCIMs [1], the increasing industrial reliance on these power machines, with the critical need to assess for efficiency, reliability, and safety, as emphasized by this study’s goals, cannot be overstated. This study focuses on presenting an ML model that can provide a high level of fault classification performance for various types of faults that are common in SCIMs; nevertheless, we consider the following to be some of the study’s inadequacies: Although the findings revealed the cost efficiency and accuracy of the proposed peak-based feature extraction and ML-based diagnosis, the need for improved diagnostic performance is still critical considering that against the limitations of traditional ML-based algorithms (accompanied with hand-crafted feature extraction processes), the superior feature extraction and classification efficiencies of deep learning models have been shown in multiple studies. These deep learning models—convolutional neural networks, recurrent neural networks, etc.—are popular for automated feature learning; however, their mystical defiance from the statistical principles from which they were fundamentally designed has been a major issue for their adoption. In addition, other issues such as trustworthiness, computational cost, increased complexity, over-fitting/under-fitting, high stochasticity in learning, extensive parameterization/optimization, etc., contribute significantly to hesitation towards generalization. On the other hand, although the traditional, hand-crafted feature extraction process for ML-based diagnosis offers comparatively poorer diagnostic efficiencies in relation to deep learning models, it does offer a transparent architecture for ensuring explainability, empirical investigations, and trustworthiness.
Under realistic situations, the occurrence of the SCIM failure modes presented in this study are not mutually exclusive and may occur in little or intense degrees. This presents the issue of accurately identifying the fault type (or combination of fault types) in place. For example, turn-to-turn short circuit may be minimal (just two turns), intense (several turns in the same phase), or may become very intense when it grows to a phase-to-phase short circuit. Although this presents a broad opportunity for more extensive research, it becomes an endless uphill task to replicate all the possible failure modes, their individual degrees of severity, the possible failure combinations, and their respective degrees of combined severity. Nonetheless, our study offers a reliable feature extraction approach that is expected to direct continued research in the domain. On a different note, the frequency-domain approach for SCIM fault diagnosis has some limitations, which are mostly inherited from spectral leakage and lack of transient information. The models often perform poorly in finite-time window situations, require high-frequency resolution for adequate performance, and exhibit unstable variations in side-band frequencies in varying load situations. In addition, they are often flawed at detecting certain faults at no load conditions, especially the broken rotor bar [21,45]. On the other hand, deep learning and time-frequency domain signal processing techniques offer better discrimninative feature extraction efficiencies; however, they are often associated with high computational costs. Because current signals are often stationary and do not often exhibit any transient changes, we believe the proposed frequency-domain approach is more beneficial, considering that the efficiencies of its counterparts—time-domain, time-frequency-domain approaches, and deep learning methods—are insignificant, computationally expensive, and highly unexplainable, respectively.
At minimal load conditions (as presented in our study), the peak detection technique proposed herein offers reliable discrimininative efficiencies. Nonetheless, the high false negatives by the best-performing classifiers for ISC-3 poses a strong concern and is currently a major motivation for our continued research. Notwithstanding, our comparative study herein (for the ML classifiers) provides a valid yardstick for assessing the efficiencies of our future work. From a broader perspective, beyond the efficiencies of standalone sensing/monitoring methods, combination of multiple sensing techniques has been reported in several studies [45]. Such combinations may exploit vibration, temperature, acoustic emissions, and so on in a unified framework for comprehensive monitoring and/or diagnostic MCSA [29,30]. Although these sensor fusion techniques offer valid rationale, achieving a standardized approach for their use remains open for continued investigations. However, as part of our continued studies, we intend to explore deeper and more comprehensive approaches.
7. Conclusions
Squirrel cage induction motors are among the most popular industrial electrical motors due to their high motive power generation, durability, and low maintenance costs. The need for condition monitoring presents the opportunity for CS-based fault diagnosis; however, selecting the appropriate signals processing technique(s) for ML-based diagnostics remains open for continued research.
This paper presented a peak detection approach for discriminative feature extraction, which concatenates FFT, PSD, and ACF peak coordinates from the current signals sourced from a three-phase SCIM. These features are received by various ML-based classifiers, whose classification results are also presented in the study. An extensive comparison of ML-based diagnostic models provides a generalization paradigm for SCIM diagnosis. Results show that RF is the most accurate, with an accuracy of 79.25%, followed by NBC and QDA, with accuracies of 73% and 71.4%, respectively. Furthermore, computational cost assessment of the ML-based diagnostic models is conducted for improved diagnostic assessment of the models. Results show that RF’s computational cost of 3.66 s is in an acceptable range, while NBC has the lowest at 0.003 seconds.
The confusion matrix of the best-performing models revealed that the turn-to-turn fault was imprecisely predicted, providing an avenue for future research. Amongst the paper’s limitations, it is believed that the developed easy, nonintrusive, low-cost FDI framework offers a reliable direction for motivating future work.
Author Contributions
Conceptualization, C.N.O. and U.E.A.; methodology, C.N.O. and U.E.A.; software, U.E.A.; formal analysis, U.E.A.; investigation, C.N.O. and U.E.A.; resources, C.N.O., U.E.A., and J.-W.H.; data curation, C.N.O. and U.E.A.; writing—original draft, C.N.O. and U.E.A.; writing—review and editing, C.N.O. and U.E.A.; visualization, U.E.A.; supervision, J.-W.H.; project administration, J.-W.H.; funding acquisition, J.-W.H. All authors have read and agreed to the published version of the manuscript.
Funding
This research was supported by the Ministry of Science and ICT (MSIT), Korea, under the Grand Information Technology Research Center support program (IITP-2020-2020-0-01612) supervised by the Institute for Information & Communications Technology Planning & Evaluation (IITP).
Institutional Review Board Statement
Not applicable.
Informed Consent Statement
Not applicable.
Data Availability Statement
The data presented in this study are available on request from the corresponding author. The data are not publicly available due to laboratory regulations.
Conflicts of Interest
The authors declare no conflict of interest.
References
- Choudhary, A.; Goyal, D.; Shimi, S.L. Condition Monitoring And Fault Diagnosis Of Induction Motors: A Review. Arch. Comput. Methods Eng. 2019, 26, 1221–1238. [Google Scholar] [CrossRef]
- Bhowmik, P.I.; Pradhan, S.; Prakah, M. Fault Diagnostic And Monitoring Methods of Induction Motor: A Review. IJACEEE 2013, 1, 8681–8689. [Google Scholar]
- Amanuel, T.; Ghirmay, A.; Ghebremeskel, H.; Ghebrehiwet, R.; Bahlibi, W. Comparative Analysis of Signal Processing Techniques for Fault Detection in Three Phase Induction Motor. J. Electron. Inform. 2021, 1, 61–76. [Google Scholar] [CrossRef]
- Ali, M.Z.; Shabbir, M.N.S.K.; Zaman, S.M.K.; Liang, X. Machine Learning Based Fault Diagnosis for Single-and Multi-Faults for Induction Motors Fed by Variable Frequency Drives. In Proceedings of the 2019 IEEE Industry Applications Society Annual Meeting, Baltimore, MD, USA, 29 September–3 October 2019; pp. 1–14. [Google Scholar] [CrossRef]
- Yang, T.; Pen, H.; Wang, Z.; Chang, C.S. Feature knowledge based fault detection of induction motors through the analysis of stator current data. IEEE Trans. Instrum. Meas. 2016, 65, 549–558. [Google Scholar] [CrossRef]
- Nguyen, V.D.; Zwanenburg, E.; Limmer, S.; Luijben, T.; Back, T.; Olhofer, M. A Combination of Fourier Transform and Machine Learning for Fault Detection and Diagnosis of Induction motors. In Proceedings of the 8th International Conference on Dependable Systems and Their Applications (DSA), Yinchuan, China, 5–6 August 2021; pp. 344–351. [Google Scholar] [CrossRef]
- Boudinar, A.H.; Aimer, A.F.; Khodja, M.E.A.; Benouzza, N. Induction Motor’s Bearing Fault Diagnosis Using an Improved Short Time Fourier Transform. In Lecture Notes in Electrical Engineering; Springer: Cham, Switzerland, 2019; pp. 411–426. [Google Scholar] [CrossRef]
- Yoo, Y.J. Fault Detection of Induction Motor Using Fast Fourier Transform with Feature Selection via Principal Component Analysis. Int. J. Precis. Eng. Manuf. 2019, 20, 1543–1552. [Google Scholar] [CrossRef]
- Pusca, R.; Sbaa, S.; Bessous, N.; Romary, R.; Bousseksou, R. Mechanical Failure Detection in Induction Motors Using Stator Current and Stray Flux Analysis Techniques. Eng. Proc. 2022, 14, 19. [Google Scholar] [CrossRef]
- Zaman, S.M.K.; Liang, X.; Li, W. Fault Diagnosis for Variable Frequency Drive-Fed Induction Motors Using Wavelet Packet Decomposition and Greedy-Gradient Max-Cut Learning. IEEE Access 2021, 9, 65490–65502. [Google Scholar] [CrossRef]
- Gundewar, S.K.; Kane, P.V. Condition Monitoring and Fault Diagnosis of Induction Motor. J. Vib. Eng. Technol. 2021, 9, 643–674. [Google Scholar] [CrossRef]
- Nakamura, H.; Asano, K.; Usuda, S.; Mizuno, Y. A Diagnosis Method of Bearing and Stator Fault in Motor Using Rotating Sound Based on Deep Learning. Energies 2021, 14, 1319. [Google Scholar] [CrossRef]
- Sadeghi, R.; Samet, H.; Ghanbari, T. Detection of Stator Short-Circuit Faults in Induction Motors Using the Concept of Instantaneous Frequency. IEEE Trans. Ind. Inform. 2019, 15, 99. [Google Scholar] [CrossRef]
- Garcia-Bracamonte, J.E.; Ramirez-Cortes, J.M.; de Jesus Rangel-Magdaleno, J.; Gomez-Gil, P.; Peregrina-Barreto, H.; Alarcon-Aquino, V. An Approach on MCSA-Based Fault Detection Using Independent Component Analysis and Neural Networks. IEEE Trans. Instrum. Meas. 2019, 65, 1353–1361. [Google Scholar] [CrossRef]
- Gaeid, K.S.; Ping, H.W.; Khalid, M.; Salih, A.L. Fault Diagnosis of Induction Motor Using MCSA and FFT. Sci. Acad. Publ. 2011, 1, 85–92. [Google Scholar] [CrossRef]
- Kafeel, A.; Aziz, S.; Awais, M.; Khan, M.A.; Afaq, K.; Idris, S.A.; Alshazly, H.; Mostafa, S.M. An Expert System for Rotating Machine Fault Detection Using Vibration Signal Analysis. Sensors 2021, 21, 7587. [Google Scholar] [CrossRef] [PubMed]
- CusidÓCusido, J.; Romeral, L.; Ortega, J.A. GarcÍaGarcia Espinosa, A. Fault Detection in Induction Machines Using Power Spectral Density in Wavelet Decomposition. IEEE Trans. Ind. Electron. 2008, 55, 633–643. [Google Scholar] [CrossRef]
- Benbouzid, M.E.H.; Vieira, M.; Theys, C. Induction motors’ faults detection and localization using stator current advanced signal processing techniques. IEEE Trans. Power Electron. 1999, 14, 14–22. [Google Scholar] [CrossRef]
- Jena, D.P.; Panigrahi, S.N. Automatic gear and bearing fault localization using vibration and acoustic signals. Appl. Acoust. 2015, 98, 20–33. [Google Scholar] [CrossRef]
- Bessam, B.; Menacer, A.; Boumehraz, M.; Cherif, H. Detection of broken rotor bar faults in induction motor at low load using neural network. Isa Trans. 2016, 64, 241–246. [Google Scholar] [CrossRef]
- Das, S.; Purkait, P.; Chakravorti, S. Separating induction Motor Current Signature for stator winding faults from that due to supply voltage unbalances. In Proceedings of the 2012 1st International Conference on Power and Energy in NERIST (ICPEN), Nirjuli, India, 28–29 December 2012; pp. 1–6. [Google Scholar] [CrossRef]
- Hussain, M.; Soother, D.K.; Kalwar, I.H.; Memon, T.D. Stator winding fault detection and classification in three—phase induction motor. Intell. Autom. Soft Comput. 2021, 29, 869–883. [Google Scholar] [CrossRef]
- Prahesti, F.E.; Asfani, D.A.; Yulistya Negara, I.M.; Dewantara, B.Y. Three-Phase Induction Motor Short Circuit Stator Detection Using an External Flux Sensor. In Proceedings of the 2020 International Seminar on Intelligent Technology and Its Applications (ISITIA), Surabaya, Indonesia, 22–23 July 2020; pp. 375–380. [Google Scholar] [CrossRef]
- Peeters, C.; Guillaume, P.; Helsen, J. Vibration-based bearing fault detection for operations and maintenance cost reduction in wind energy. Renew. Energy 2018, 98, 74–87. [Google Scholar] [CrossRef]
- Deeb, M.; Kotelenets, N.F.; Assaf, T.; Sultan, H.M.; Akayasheedept, A.S.A. Three Phase Induction Motor Short Circuits Fault Diagnosis using MCSA and NSC. In Proceedings of the 2021 3rd International Youth Conference on Radio Electronics, Electrical and Power Engineering (REEPE), Moscow, Russia, 11–13 March 2021; pp. 1–6. [Google Scholar] [CrossRef]
- Messaoudi, M.; Flah, A.; Alotaibi, A.A.; Althobaiti, A.; Sbita, L.; Ziad El-Bayeh, C. Diagnosis and Fault Detection of Rotor Bars in Squirrel Cage Induction Motors Using Combined Park’s Vector and Extended Park’s Vector Approaches. Electronics 2022, 11, 380. [Google Scholar] [CrossRef]
- Yu, H.; Wang, B.; Li, Y.; Gao, Z. Spectral decomposition-based explicit integration method for fully non-stationary seismic responses of large-scale structures. Mech. Syst. Signal Process. 2022, 168, 108735. [Google Scholar] [CrossRef]
- Rhif, M.; Ben Abbes, A.; Farah, I.R.; Martínez, B.; Sang, Y. Wavelet Transform Application for/in Non-Stationary Time-Series Analysis: A Review. Appl. Sci. 2019, 9, 1345. [Google Scholar] [CrossRef] [Green Version]
- Chaitanya, B.K.; Yadav, A.; Pazoki, M.; Abdelaziz, A.Y. Chapter 8—A comprehensive review of islanding detection methods. In Uncertainties in Modern Power Systems; Academic Press: Cambridge, MA, USA, 2021; pp. 1664–1674. [Google Scholar] [CrossRef]
- Lee, G.-H.; Akpudo, U.E.; Hur, J.-W. FMECA and MFCC-Based Early Wear Detection in Gear Pumps in Cost-Aware Monitoring Systems. Electronics 2021, 10, 2939. [Google Scholar] [CrossRef]
- Chen, X.; Yang, Y.; Cui, Z.; Shen, J. Wavelet Denoising for the Vibration Signals of Wind Turbines Based on Variational Mode Decomposition and Multiscale Permutation Entropy. IEEE Access 2020, 8, 40347–40356. [Google Scholar] [CrossRef]
- Akpudo, U.E.; Hur, J.W. Towards bearing failure prognostics: A practical comparison between data-driven methods for industrial applications. J. Mech. Sci. Technol. 2020, 34, 4161–4172. [Google Scholar] [CrossRef]
- Han, T.; Jiang, D.; Zhao, Q.; Wang, L.; Yin, K. Comparison of random forest, artificial neural networks and support vector machine for intelligent diagnosis of rotating machinery. Trans. Inst. Meas. Control. 2017, 40, 2681–2693. [Google Scholar] [CrossRef]
- Asman, S.H.; Ab Aziz, N.F.; Ungku Amirulddin, U.A.; Ab Kadir, M.Z.A. Decision Tree Method for Fault Causes Classification Based on RMS-DWT Analysis in 275 kV Transmission Lines Network. Appl. Sci. 2021, 11, 4031. [Google Scholar] [CrossRef]
- Nabipour, M.; Nayyeri, P.; Jabani, S.S.; Mosavi, A. Predicting Stock Market Trends Using Machine Learning and Deep Learning Algorithms Via Continuous and Binary Data; A Comparative Analysis. IEEE Access 2020, 8, 150199–150212. [Google Scholar] [CrossRef]
- Stavropoulos, G.; van Vorstenbosch, R.; van Schooten, F.; Smolinska, A. Random Forest and Ensemble Methods. Compr. Chemom. Chem. Biochem. Data Anal. 2020, 2, 661–672. [Google Scholar] [CrossRef]
- Chen, T.; Guestrin, C. XGBoost: A Scalable Tree Boosting System. In Proceedings of the KDD’16: 22nd ACM SIGKDD International Conference on Knowledge Discovery and Data Minings, San Francisco, CA, USA, 13–17 August 2016; pp. 785–794. [Google Scholar] [CrossRef] [Green Version]
- Yang, J.; Sun, Z.; Chen, Y. Fault Detection Using the Clustering-kNN Rule for Gas Sensor Arrays. Sensors 2016, 16, 2069. [Google Scholar] [CrossRef] [Green Version]
- Pietrzak, P.; Wolkiewicz, M. On-line Detection and Classification of PMSM Stator Winding Faults Based on Stator Current Symmetrical Components Analysis and the KNN Algorithm. Electronics 2021, 10, 1786. [Google Scholar] [CrossRef]
- Akpudo, U.E.; Hur, J.W. A Multi-Domain Diagnostics Approach for Solenoid Pumps Based on Discriminative Features. IEEE Access 2020, 8, 175020–175034. [Google Scholar] [CrossRef]
- Carreras, J.; Kikuti, Y.Y.; Miyaoka, M.; Hiraiwa, S.; Tomita, S.; Ikoma, H.; Kondo, Y.; Ito, A.; Nakamura, N.; Hamoudi, R. A Combination of Multilayer Perceptron, Radial Basis Function Artificial Neural Networks and Machine Learning Image Segmentation for the Dimension Reduction and the Prognosis Assessment of Diffuse Large B-Cell Lymphoma. AI 2021, 2, 106–134. [Google Scholar] [CrossRef]
- Piotrowski, J. Shaft Alignment Handbook, 3rd ed.; CRC Press: Boca Raton, FL, USA, 2006. [Google Scholar] [CrossRef]
- Garcia-Calva, T.A.; Morinigo-Sotelo, D.; Fernandez-Cavero, V.; Garcia-Perez, A.; Romero-Troncoso, R.d.J. Early Detection of Broken Rotor Bars in Inverter-Fed Induction Motors Using Speed Analysis of Startup Transients. Energies 2021, 14, 1469. [Google Scholar] [CrossRef]
- Swana, E.F.; Doorsamy, W. Investigation of Combined Electrical Modalities for Fault Diagnosis on a Wound-Rotor Induction Generator. IEEE Access 2019, 7, 32333–32342. [Google Scholar] [CrossRef]
- Bouraiou, A. A comparative investigation between the mcsa method and the hilbert transform for broken rotor bar fault diagnostics, in a closed-loop three-phase induction motor. UPB Sci. Bull. Ser. C Electr. Eng. 2020, 81, 209–296. [Google Scholar]


Publisher’s Note: MDPI stays neutral with regard to jurisdictional claims in published maps and institutional affiliations. |
© 2022 by the authors. Licensee MDPI, Basel, Switzerland. This article is an open access article distributed under the terms and conditions of the Creative Commons Attribution (CC BY) license (https://creativecommons.org/licenses/by/4.0/).