1. Introduction
Motorways are generally considered safe road infrastructures. That is evident for three main reasons: (1) motorways are thoroughly inspected and monitored, (2) drivers are more precautious when passing through them, and (3) they are unaffected by open road weather conditions. As a result, tunnels are safer than open road infrastructures in terms of accident rates. However, accidents that occur inside tunnels can have a more significant impact and cause more casualties due to the constrained space of the tunnel itself. Moreover, negative consequences can arise when such accidents occur, particularly regarding human losses and damage to tunnel equipment and infrastructure [
1].
The most serious threat to road tunnel systems is fire. Destructive events such as the Mont Blanc fire in France (1999) or the fire in Yanhou, China (2014) are only examples of the magnitude of such events. Furthermore, previous tunnel fire accidents have shown that, in addition to the thermal radiation and toxic effects of the trapped fire, smoke inside the tunnel can cause many fatalities among trapped tunnel users, as mentioned by [
2].
According to [
3], the primary goal of dangerous goods transportation safety management is to reduce the frequency of fire accidents. Furthermore, [
4] has emphasized the significance of tunnel operators’ information in the event of a fire accident. They have insisted that such details about the specific characteristics of the fire incident have to be delivered to the motorway management staff as soon as possible to take appropriate actions. Furthermore, the substance involved in the accident is one of the most crucial pieces of information to predict fire progression.
A significant number of studies focusing on analyzing fire accidents in road tunnels indicate that fire is the most ominous and considerable threat inside tunnels, even though fires in road tunnels are not common cases [
5,
6]. Analysis of the Mont Blanc and Tauren tunnel accidents by [
7] revealed the implication of hazardous substances, while the primary vehicles were not carrying hazardous substances but were simple HGV (Heavy Good Vehicles). Vehicles loaded with dangerous goods above a certain quantity were not allowed to use the tunnel in the Mont Blanc tunnel. However, as dramatically shown, this ban has not been enough to prevent the occurrence of major accidents, as mentioned by [
8]. As mentioned by [
9], in a Yanhou 2014 tunnel accident, a coal truck rear-ended a methanol truck (classified as an ADR vehicle—ADR regulation,
Section 1.1). It resulted in a massive fire burning for three consecutive days, leading to 40 fatalities and 12 injuries. This event led to the prohibition of ADR vehicle use on the highway for one year.
A recent analysis by [
10] regarding fire accidents in Chinese highway tunnels has shown that the average prevalence of tunnel fire accidents increased over the last 20 years. Furthermore, as [
11] mentions, several aspects of tunnel design and safety regulations need to be reviewed due to their low standards and the severity of modern incidents. Heavy vehicles are also indicated by [
10,
12], as the vehicle type is mainly involved in many tunnel fire accidents. The involvement probability of heavily loaded vehicles in fire tunnel accidents is higher in contrast to other types of vehicles compared to their frequency of appearance. Their percentage is even higher when they carry flammable substances [
13]. The same has been concluded by [
9] study of 156 tunnel fire accidents in China, which recommended that large trucks, especially those carrying hazardous substances, should be tracked and managed during their tunnel passing. Therefore, developing an automated tool to track and efficiently monitor those vehicles’ passage is necessary to ensure safer dangerous goods passage from tunnels. As previously stated, this paper emphasizes the significance of an automated tool for identifying and recognizing ADR [
14] vehicles before they enter tunnels. This tool is a software component interfaced with the Resources Management System (RMS) proposed by [
15], which is currently being validated by the EGNATIA SA motorway in Greece. This ADR detection tool’s overall goal is to record, statistically visualize, and thus manage efficiently the motorway passage of vehicles carrying dangerous goods from the tunnels of the specific road operator. After the short introduction, a quick reference is given to the ADR regulation and the principles of Quantitative Risk Assessment (QRA) in tunnels, then
Section 2 states the problem and the approach followed towards the reduction of tunnel incidents.
Section 3 and
Section 4 present the authors’ approach, detection algorithm in detail, and detection application capabilities. In
Section 5, the proposed application and algorithm are put to the test, and evaluation detection is outlined, while in
Section 6, the results are discussed. Finally,
Section 7 concludes the paper.
1.1. Requirements According to the ADR Regulation
ADR is the acronym for the “European Agreement on the International Carriage of Dangerous Goods by Road”. It refers to the French “Accord Europeen Relatif au Transport International des Marchandises Dangereuses par Route”. The ADR is a set of laws for dangerous goods packaging, load securing, classification, and labeling that apply to the European Union (EU) road transport. They were accepted for the first time in Geneva in 1957. The ADR has now been signed by all EU members and implemented by national laws. The ADR promotes road safety by requiring that dangerous goods are handled only by trained personnel. Therefore, a specialized driving license is required for drivers of dangerous cargo transporters, and an ADR certificate is obtained after special training. Part 7 of the Regulation contains specific regulations regarding the carriage, loading, unloading, and handling of dangerous goods. Moreover, Annex B is devoted to vehicles and their particular requirements. (Annex B: Provisions concerning transport equipment and transport operations [
16]).
ADR vehicles are those that transport toxic and flammable substances. According to the relevant legislation, ADR signs must be placed on vehicles carrying dangerous cargo’s front and rear sides. These are rectangular plates that are 40 cm × 30 cm in size, bright orange in color, and are split horizontally into two sections. In most cases, the upper section of these plates specifies the Hazard Identification Number (2 or 3 figures, sometimes preceded by an X), and the lower section specifies a 4-figure UN number. Typical examples are 30/1202 (diesel fuel or heating oil), 33/1203 (gasoline), 23/1965 (hydrocarbon gas mixture), 23/1978 (propane), 225/1073 (refrigerated oxygen in liquid form), and 606/3291 (clinical or medical waste).
1.2. QRA in Tunnels
Quantitative Risk Assessment (QRA) was applied long ago, firstly in the nuclear and then in the process and chemical industry. Nowadays, it applies to many everyday activities such as air, land, and sea transport, all types of industrial sectors, and occupational safety. The main questions (in simple words) that have to be answered during a QRA process are:
What might go wrong;
How often this might happen;
What are the consequences;
How harmful (i.e., life-threatening, environment and assets) these consequences might be.
Different organizations prepare QRA guidelines in various sectors, mainly referring to dangerous-to-life situations. That is one of the main reasons that different scenarios of fire accidents have to be included in the QRA of tunnels according to the guidelines of the Organisation for Economic Co-operation and Development (OECD), the European Union (EU), and the World Road Association (PIARC). In the OECD/PIARC/EU Dangerous Goods QRA model [
17,
18,
19], 13 scenarios are included covering the major dangers that may result in numerous victims and injuries, along with serious damage to the tunnels’ structural integrity, namely fire, explosion, and toxic release. Scenarios include the following: HGV fire 20 MW, HGV fire 100 MW, BLEVE of LPG (cylinder), Motor spirit pool fire, VCE of motor spirit, BLEVE of LPG (bulk), VCE of LPG (bulk), Torch fire of LPG (bulk), BLEVE of carbon dioxide (bulk), Chlorine release, Ammonia release, Acrolein release (bulk and cylinder) [
20]. Furthermore, a quantitative risk assessment process has been proposed by [
21] for trucks carrying hydrogen, and an overview of fire characteristics and smoke control methods have been outlined by [
6]. The above shows the importance of knowing precisely the substance entering a tunnel at any time.
2. Problem Statement
According to the bibliography, there are a limited number of tools for the process of humanless automated recording of dangerous goods traveling over the motorway. An initial attempt using image processing and Optical Character Recognition (OCR) has been proposed by [
22]. Their paper uses a two-stage image processing and an OCR engine for this purpose as the authors of this paper. Nevertheless, the evaluation results are limited and of low accuracy. Ref. [
23], implemented a deep learning algorithm and application for the automatic detection of accidents inside tunnels using CCTV inputs. Other approaches include using inductive loops or piezoelectric circuits to detect large trucks passing, as mentioned by [
24]. However, they fail to catch the trucks’ dangerous material being transported. Moreover, several works have been mentioned in the literature regarding automated robotic systems and algorithms for detecting structural integrity issues in tunnels, as noted by [
25].
The main objective of this research effort under the HMRT (Holistic Management of Road Tunnels—ODOS in Greek) project is to create an intelligent communication system for managing fire risks in tunnels. This paper focuses on the proposed algorithm and application implementation as well as the authors’ implementation and evaluation in this direction.
A fire incident inside a tunnel caused by vehicles carrying dangerous and/or non-dangerous goods can lead to high levels of carbon monoxide and other toxic gases and the release of flammable, volatile liquids or gases on the road inside the tunnel, all potential fire hazards. Therefore, the developed application aims to support road tunnel operators in responding appropriately in the event of potential incidents by taking appropriate actions toward the users (e.g., evacuation) and the response teams, ensuring, in this way, a higher level of safety for these critical infrastructures.
The initial step to all the above is recognizing the vehicle carried substance. The materials carried by each vehicle can be deduced strictly from the ADR sign. The number and type of substances (i.e., toxic, flammable, explosive) can be controlled over time by tracking vehicles before entering a tunnel and visualizing them on a dashboard. During rush hours or when multiple dangerous substances are being transported simultaneously, tunnel operators can decide whether to delay the passing of ADR trucks, reducing the risk of an accident. Furthermore, if an ADR vehicle passes through the tunnel and causes an accident, tunnel operators will know the vehicle’s cargo ahead of time. As a result, they will be better prepared to respond appropriately to a potential incidental event (i.e., in case of substance release, to know in advance if this substance is toxic or flammable; therefore, be prepared to evacuate the tunnel and guide the emergency response team adequately). The proposed HMRT-EF (EF stands for dangerous goods in Greek) application for automatically detecting ADR trucks and its three-stage detection algorithm, ADR-Det, are presented in the following section.
3. Proposed ADR-Detection Algorithm
The authors proposed a new detection algorithm called ADR-Det, for the process of real-time or post-processing detection of trucks carrying dangerous goods. The proposed algorithm is part of an ADR-detection application called HMRT-EF that can process such images in real-time or post-process images taken by cameras at toll stations (batch post-processing).
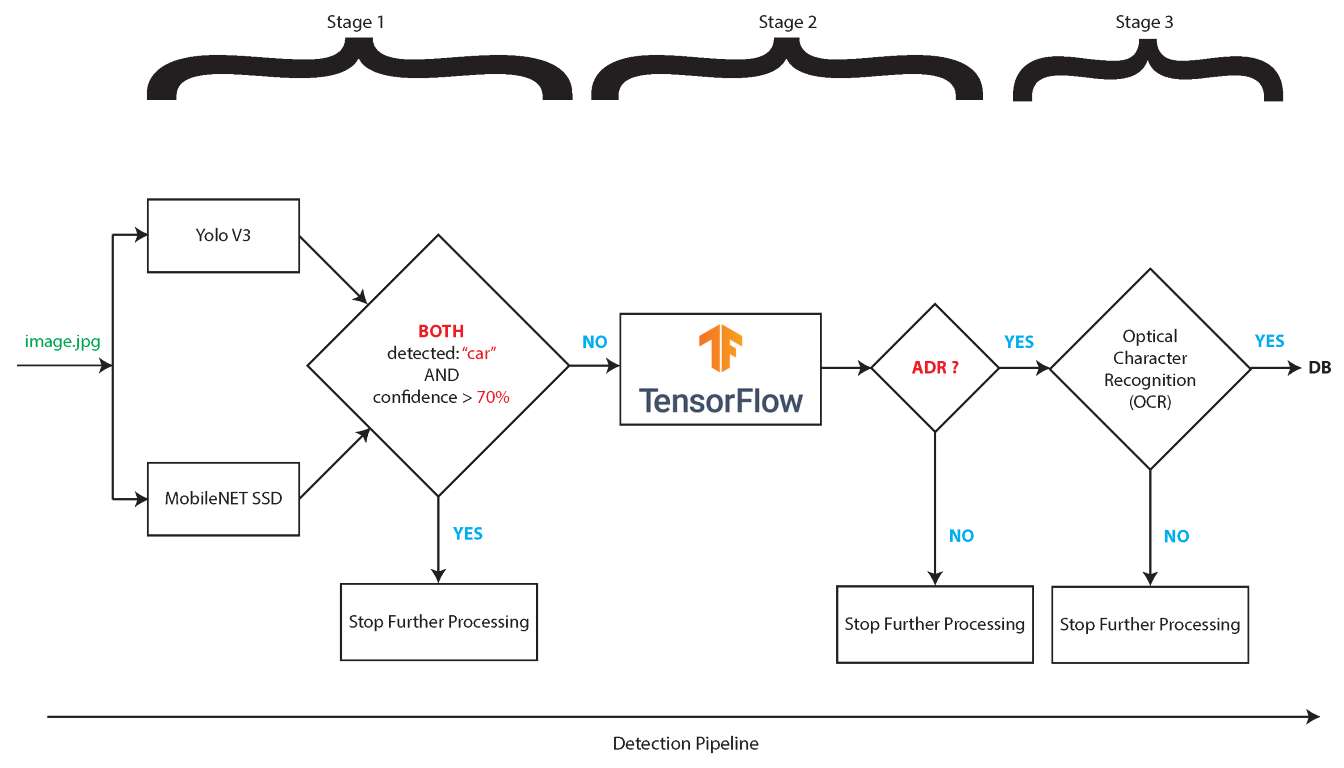
For the ADR-Det training process, photos have been taken from the toll post cameras of the EGNATIA SA motorway in Greece. The ADR-Det algorithm includes three stages of operation as illustrated in
Figure 1. Accurate detection of low-resolution gray-scale ADR photos was achieved by separating the process into three (3) stages:
- Stage 1:
Detection of large vehicles (heavy or truck). In this stage, two pre-trained Convolutional Neural Networks (CNN) are used, and if the detection is positive for a truck by both algorithms, stage 2 is executed.
- Stage 2:
Detection of ADR contours. In this stage, ADR Regions of Interest (ADR-ROIs) are detected and stored in a special folder. It is achieved using a trained Faster-RCNN that includes a single ADR class at its final classification step.
- Stage 3:
Optical Character Recognition of ADR contours. This stage processes those photos that exit Stage 2, potentially containing ADR-ROIs. Optical Character Recognition (OCR) detects the ADR number and category. The results and other vehicle properties, such as timestamp, toll-post id, and vehicle sign, are stored in the HMRT-EF application’s database.
The proposed algorithm has been trained to be successfully applied even using low-quality images of 750 × 480 px and 96 dpi resolution, with a typical size of 40–68 Kbytes. For the process of accurate detection, even with such a low-depth analysis of image snapshots.
In [
26], some preliminary results of the ADR-Det algorithm are presented. These experiments were conducted using low-quality motorway images taken at toll posts. The algorithm executes in 3 stages, operating like a pipeline. Stage 1 detected small vehicles (primarily cars) using Yolo and MobileNET SSD. MobileNET SSD and Yolo successfully detect small vehicles at confidence levels exceeding 95%. However, the confidence level drops to approximately 50% when identifying large vehicles that potentially carry ADR signs. Therefore, reverse logic was used. Based on that alteration to the algorithm, small vehicles are excluded from the later stages of the algorithm when both Yolo and MobileNET SSD agree that, at specified confidence levels, an image contains a small vehicle. This reverse logic ensures much higher success rates.
Moreover, false-positive cases are dealt with when they exit Stage 2, translating to no text detection on ADR-annotated images. Such images are separated into a different folder, specified in the software settings. Finally, the built-in HMRT-EF application database containing all possible 4-digit ADR cases is combined with the four (4) figures located on the lower part of the ADR signs.
Stage 2 uses TensorFlow to attempt to detect ADR-ROIs. Images that do not contain such a region are excluded from further processing. When they potentially contain such regions, there are passed onto Stage 3. The success rate of TensorFlow exceeds in more than 95% of cases to detect such a region and can even achieve success rates above 99%. Images that progress to Stage 3 and are processed using EasyOCR. The ADR-ROIs are extracted and passed onto EasyOCR. This approach offers two benefits: (a) detection is more focused on what is requested by the software, and (b) detection times are much lower.
The ADR-Det algorithm has been developed in Python 3, using TensorFlow 2 [
27]. Furthermore, for the ADR contour detection and vehicles’ classification process, Python OpenCV library [
28,
29] has been used. Finally, for the ADR optical character recognition process, the EasyOCR library has been utilized as mentioned by [
30]. The ADR-Det implementation has been designed initially focusing on standalone HMRT-EF application support. A primary concern during this implementation of the ADR-Det algorithm and the application included was to achieve close to real-time performance. Therefore, the datasets selected for the CNNs and the algorithms had to be as lightweight as possible. Using those requirements, memory usage during execution does not exceed 1.5 GB of RAM. CPU resources are used to the maximum extent, utilizing multiple cores and vectorization capabilities. Such provisions have been considered to provide a portable version. Moreover, CPU consumption of the algorithm that will detect dangerous goods in real-time may also provide Augmented Reality (AR) meta-information or even feed this information directly to a database. To use the ADR-Det algorithm as a real-time detection tool, at least 8 CPU cores are required, processing up to 0.86 images/s.
Nevertheless, in order to provide portable and real-time ADR detection functionality, ARM portable devices (RPi Broadcom and Nvidia Tegra SoCs), the ADR-Det algorithm has been excluded by the HMRT-EF application and has been cloud ported. That is, offered as a service using an appropriate HMRT-EF application for portable embedded devices and as a standalone application for PCs (×64) for non-cloud post-processing cases. The HMRT-EF standalone application functionality and logic follow.
4. HMRT-EF Application
The authors implemented a standalone application called HMRT-EF. For validation and evaluation purposes of the ADR-Det algorithm, the HMRT-EF application is part of the Holistic Resource and Emergency Situations Management on Motorways and Road Tunnels project (EF stands for dangerous goods in Greek). The HMRT-EF application has been developed using Python 3 and PyQt (developed by [
31]), and HMRT-EF User Interfaces are illustrated in
Figure 2. The HMRT-EF application includes the following components:
The main control process (Main process UI thread). The main control process is responsible for executing the ADR-Det algorithm with specified parameters set by the HMRT-EF settings UI. For the ADR-Det algorithm cloud implementation, the HMRT-EF application uses the HTTP POST method to initialize the ADR-Det cloud execution, receiving a 128 byte token generated by concatenating the cloud system’s timestamp and a randomly generated nonce value. This value is the output directory where the ADR value results and detected ADR vehicles with the annotated ADR contours, as marked by the ADR-Det algorithm’s execution, can be retrieved by the user using the HTTP GET method.
The settings UI, where the user can set the HMRT-EF application parameters.
The HMRT-EF application SQLite service where the ADR values and their corresponding descriptive carried substances are stored. This SQLite service also includes a class interface for the queries performed by the main control process, as indicated at the 3rd stage of the ADR-Det algorithm. The SQLite service also includes an appropriate Manager to add, remove or update ADR notations.
The HMRT-EF Web User Interface (UI), shows the detected ADR signs, detection timestamp, vehicle license plate, and dangerous cargo description (followed by the ADR plate numbers). There is no implementation for the standalone HMRT-EF, and the information is stored in the appropriate CSV delimiter results file.
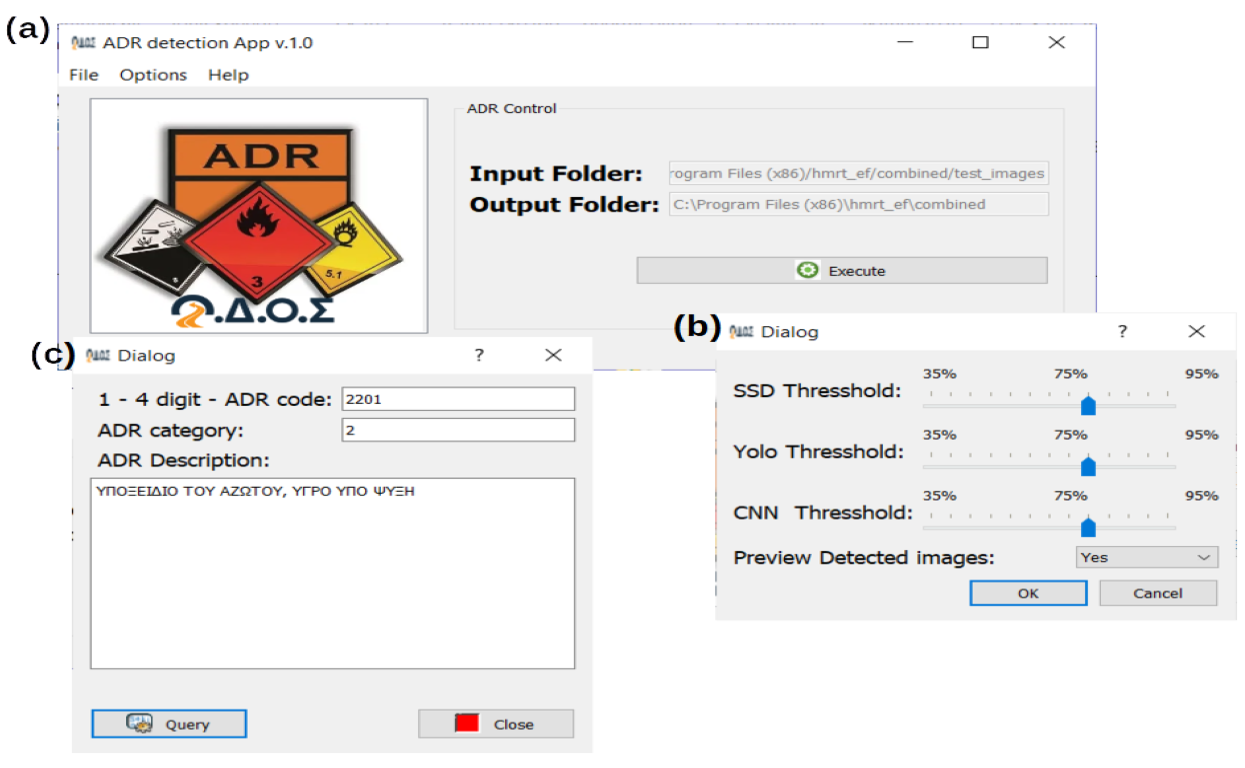
The HMRT-EF standalone implementation is a cross-platform (Windows, Linux, macOS), cross-architecture (×86, ×86-64, ARM) application that operates as follows: First, the user selects the input folder where the images reside (
Figure 2a). These images will be tested using the ADR-Det algorithm. Then the user selects an output folder (
Figure 2a). The ADR-Det detection algorithm output in this output folder is added into two separate sub-folders, ADR and non-ADR. The ADR folder includes the ADR-detected images, while non-ADR contains the non-ADR ones. The application control engine automatically copies the images from the input folder when the execution button is pressed. Moreover, an appropriate results.csv file is being generated in this folder, including the output image filenames, the detected ADR code numbers, and their ADR categories and description.
The HMRT-EF application components are illustrated in
Figure 2, (see
Figure 2a), including the Main Window UI controller, the settings dialog UI (see
Figure 2b), and the HMRT-EF ADR search dialog UI (see
Figure 2c). This dialog is used to manually search ADR numbers in the HMRT-EF SQLite database, including the ADR codes, categories, and descriptions of dangerous goods. In addition, the SQLite database engine performs queries based on the EasyOCR results at the final stage of the HMRT-EF algorithm. These queries are used to generate the final results.csv of detected trucks carrying dangerous goods.
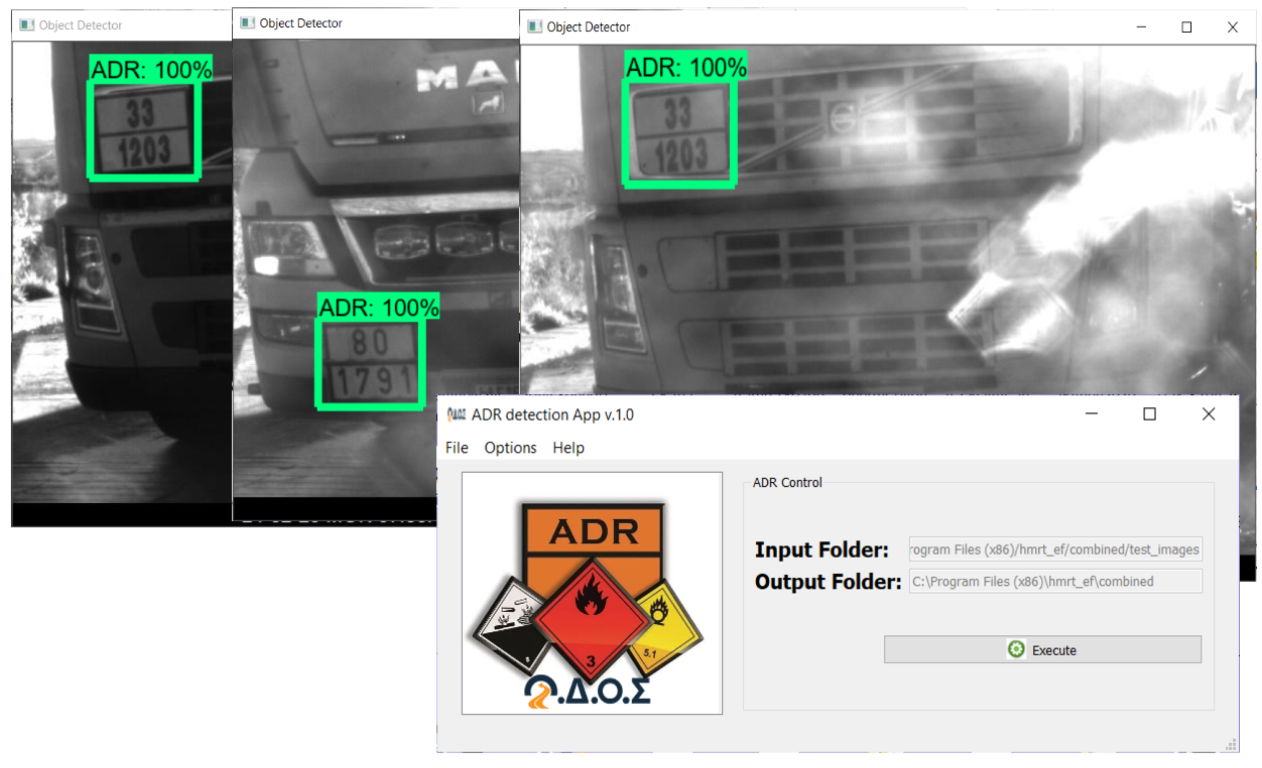
Figure 3 shows the annotated ADR detection output of the ADR-Det algorithm. In addition, the implemented HMRT-EF application Faster-RCNN network of the ADR-Det algorithm has been trained using low-resolution (96dpi) photographs of dimensions of 752 × 480 px. Finally,
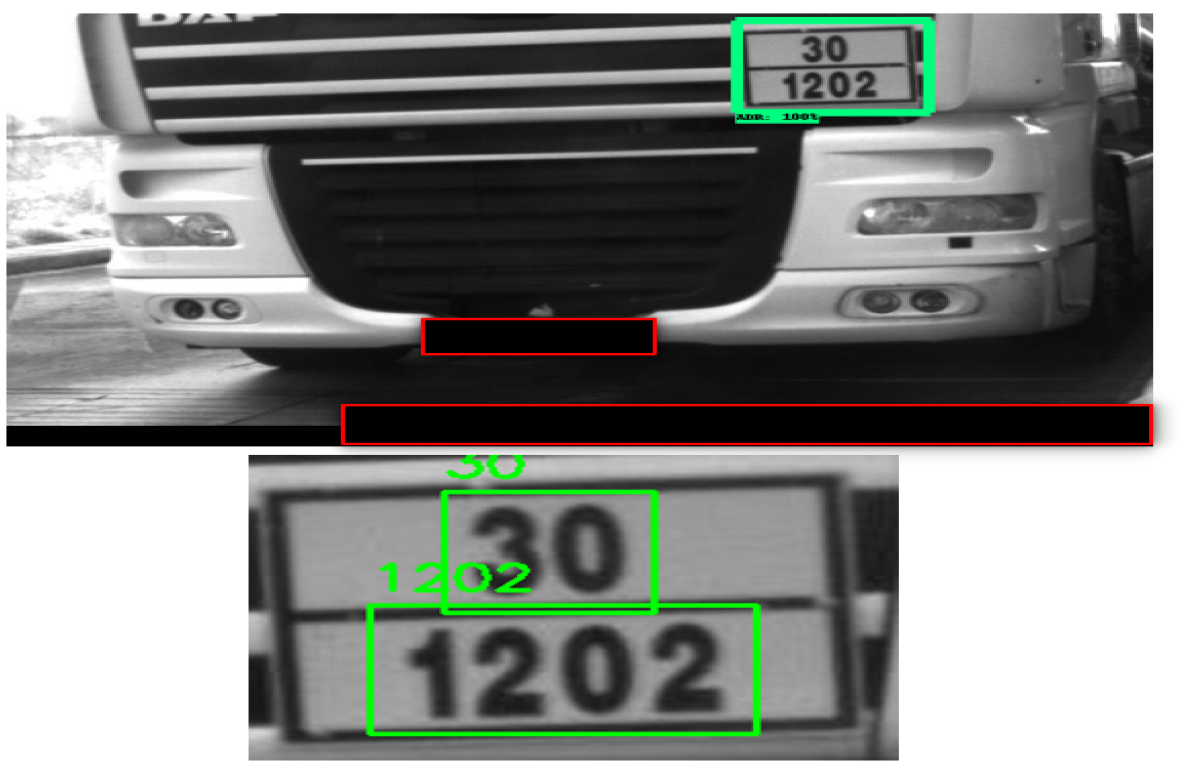
Figure 4 illustrates the EasyOCR detected numbers of an ADR image Region of Interest (ROI) when the EasyOCR detection is set to verbose in the settings UI of the HMRT-EF application.
ADR-Det experimentation via the HMRT-EF application and ADR detection results and discussion are given out in the following sections. Regardless of the authors’ experimentation, it is set as future work to implement a tool-set of annotation tools and scripts to automate training the Faster-RCNN algorithm neural network using different resolution image data sets as input.
5. Experimental Scenarios and Results
The dataset used in this section was examined in detail, extracting photos of vehicles with fully or partially visible ADR signs. In addition, certain basic statistics were also determined, such as the total number of vehicles and those with visible ADR signs, per hour, for March 2021, on two stations. These statistics are summarized in
Table 1. Moreover,
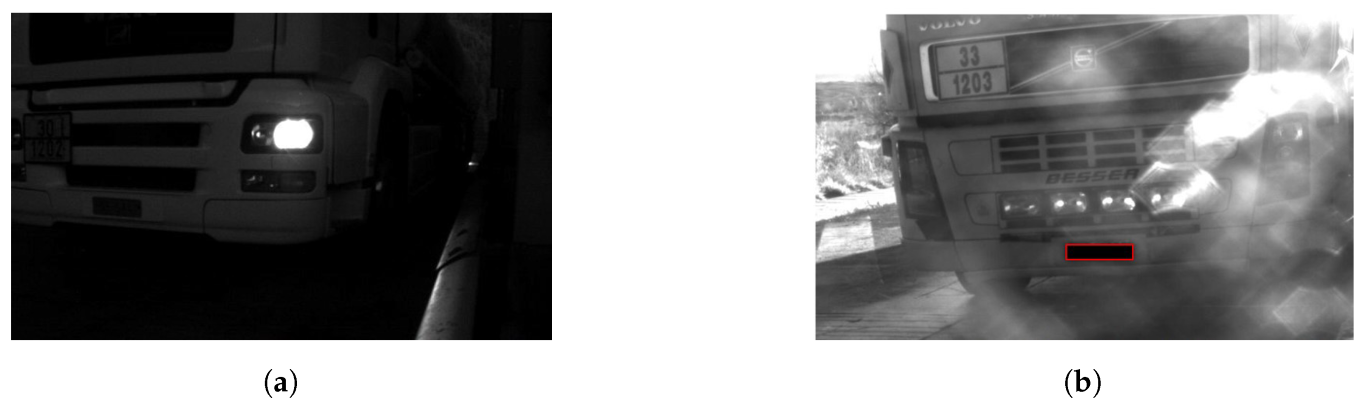
Figure 5a,b show two typical examples of highly problematic photos that make detection practically impossible. The first two ADR-Det algorithm validation experiments, outlined below, were conducted at 10:00 a.m. and 3:59 p.m.
For the ADR-Det algorithm evaluation process, three experimental scenarios were employed to assess the algorithm’s performance in execution time and detection accuracy under various input datasets. These were:
ADR-Det algorithm stage 2 ADR signs detection evaluation.
ADR-Det algorithm Optical Character Recognition (OCR) process evaluation and improvements.
ADR-Det performance evaluation and requirements for its use in embedded mobile devices.
The images used for the ADR-Det training and validation have been taken from the EGNATIA SA toll post cameras installed to take snapshots of the vehicle’s front part, close to the license plate. However, these images were of low-resolution and had color depth (752 × 480 × 8-bits, 96 dpi, 40–65 KB in size). In addition, the camera modules are placed in the toll posts without proper perimetric lightning or force-activated infrared capabilities and, in some cases, without extreme care, especially at night, as shown in
Figure 5a,b. This made it hard to detect the vehicle’s ADR and license plates in such cases, even for the naked eye. Consequently, since no other camera equipment providing high-resolution image datasets was available at the toll posts, it was necessary to train the proposed algorithm to process low-resolution images, excluding the zero visibility ones from the training process.
5.1. ADR-Det Stage 1 Detection Validation
Using the toll post images of two toll post stations, the authors selected photos in the 6 h ranging from 10:00:00 a.m. up until 15:59:59 p.m. in March 2021. This evaluation step examines the number of photos exiting ADR-Det algorithm stage 1 (recognized as containing large vehicles by the algorithm). The results are shown in
Table 2.
5.2. ADR-Det Stage 2 Detection Validation
The experiment described in
Section 5.1 is part of the ADR-Det validation process, examining the number of vehicles exiting the ADR-Det stage 2. Photos potentially contain (including false positives) vehicles carrying ADR signs.
Table 3, column 3 presents the percentage of the stage 1 detected big vehicles (
Table 3, column 2) with detected ADR signs. As part of the validation process, the authors manually checked each detected image. The last column shows the photos containing either fully or partially visible ADR signs from the authors’ manual control. Again, the difference between columns 3 and 4 is attributed to false positives (≈73.4% of the total dataset’s images), meaning trucks with no ADR sign.
5.3. ADR-Det Stage 2 Evaluation Using Selected Datasets
In this experiment, three evaluation data sets have been fed as input to the ADR-Det stage 2 part of the algorithm:
- ∘
500 ADR images
- ∘
250 non ADR images
- ∘
Total of 250 images, where 200 were non-ADR images and 50 were ADR images
The ability of stage 2 accurate ADR detection has been evaluated using the following experimental cases since the ADR-Det stage 2 part of the algorithm is the most critical for detecting trucks carrying ADR signs. Therefore, the evaluation results per dataset have been performed regarding the CNN’s detection accuracy and presented in the following subsections.
5.3.1. ADR-Det Stage 2 Detection Evaluation Using a Dataset of 500 ADR Images
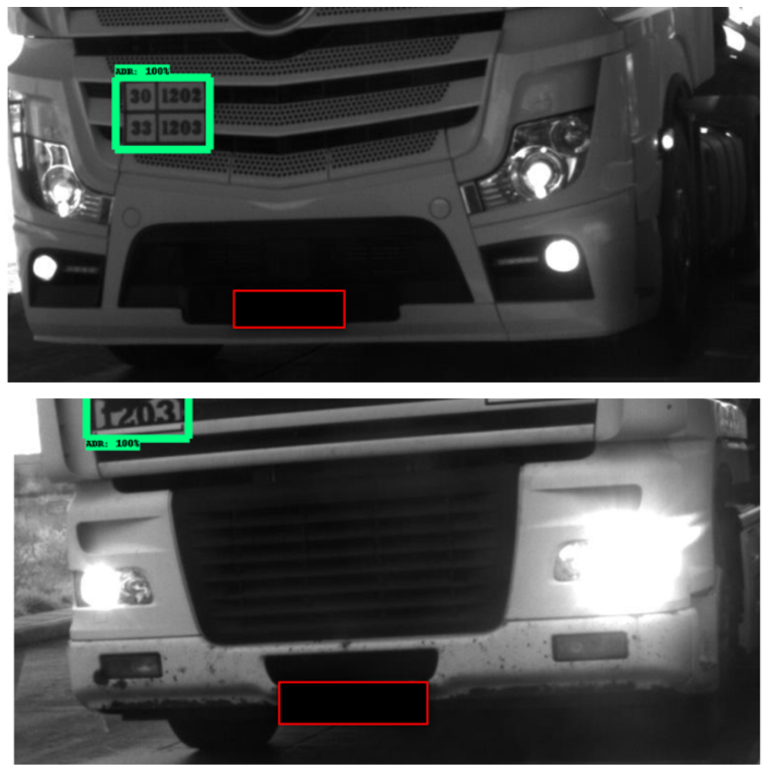
In this experiment, the ADR-Det algorithm stage 2 is put to the test in terms of detection accuracy. 500 photographs were selected for this evaluation scenario, all depicting vehicles with ADR plates and fed to the stage 2 of the ADR-Det algorithm. The experimentation results have shown that 498 out of 500 (99.60%) have been correctly detected. The average confidence rate was 99.98% ± 2.24%. The minimum percentage of certainty was 50.32%, and the maximum percentage of certainty was 100.00% (typical in most cases). In the experimental photographs, the authors have also included vehicles with 2 ADR plates, vehicles with partially out-of-frame ADR plates, and diamond-shaped ADR plates.
Figure 6 illustrates ADR algorithm detection capability.
5.3.2. ADR-Det Stage 2 Detection Evaluation Using a Dataset of 250 Non ADR Images
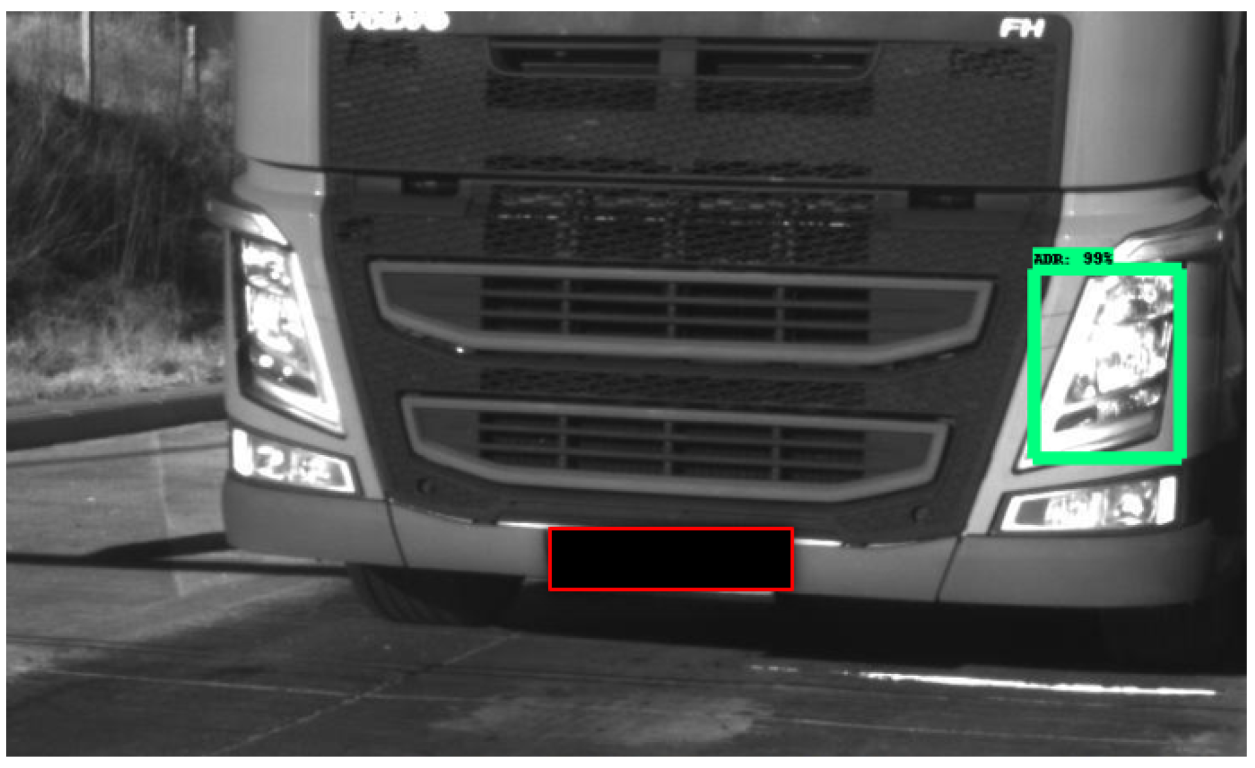
In this experimental case, 250 photos were selected, all of which depicted a large vehicle without any ADR license plates. False-positive results showed ADR 20 out of 250 vehicles (8.00%). Correct MH-ADR detection results showed MH-ADR 230 out of 250 vehicles (92.00%). The average percentage of certainty was 88.53% ± 16.48%, with a minimum percentage of certainty of 51.82% and a maximum of 100.00% (3 out of 20 false positives). The following
Figure 7 includes a false-positive ADR result.
5.3.3. ADR-Det Stage 2 Detection Evaluation Using a Dataset of 200 Non-ADR Images and 50 ADR Images
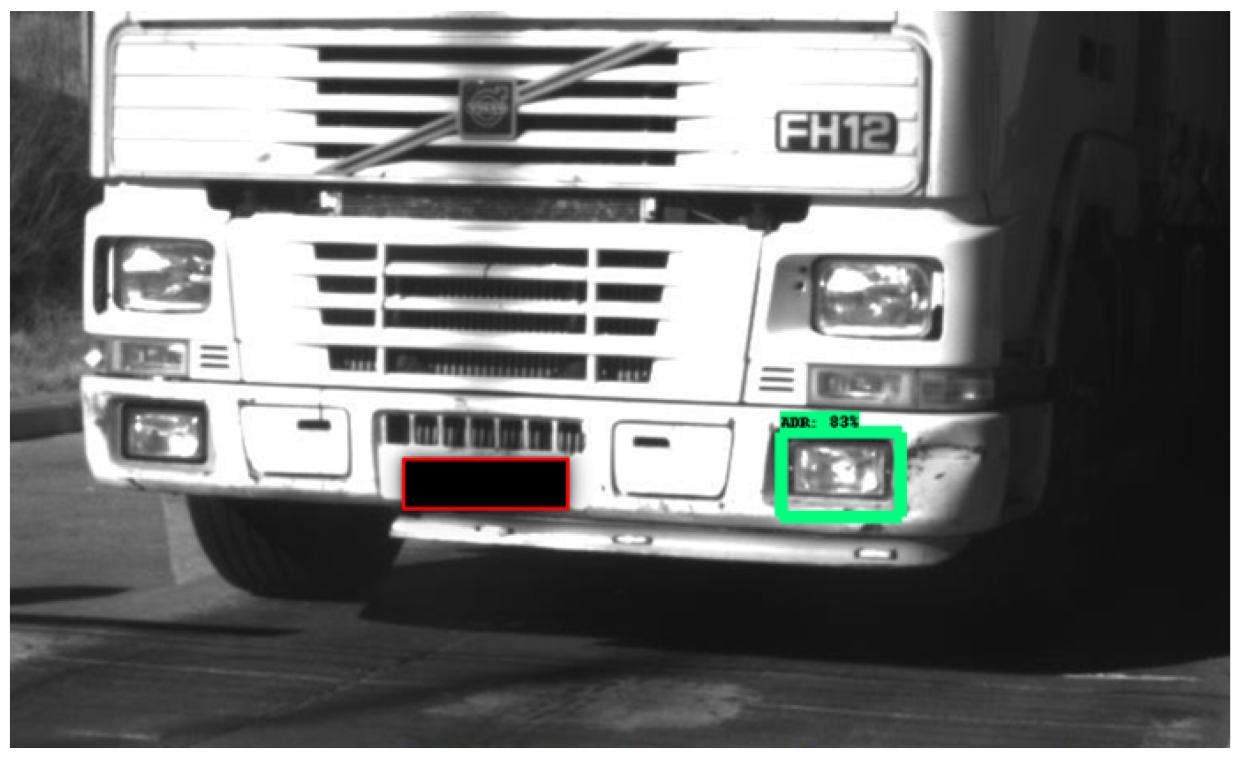
In this ADR-Det evaluation experiment, 250 photographs of large vehicles were selected, of which 200 were without ADR plates, and the rest depicted vehicles with ADR plates. False positives were detected in 18 out of 250 vehicles (7.2%), while 232 out of 250 vehicles (92.8%) have been correctly detected. Vehicles with ADR license plates have also been detected correctly (50 out of 50), i.e., 100%, with an average certainty of 99.96%. In total, including all 250 photos, the detection success percentage is 87.17% ± 9.41%, with a minimum percentage of certainty of 51.82% and a maximum of 100% (3 out of 18 gave a false-positive result). The following
Figure 8 includes a false-positive non-ADR result. It is obvious that from these experimental results, detections with a confidence level below 80% are false positive detections.
5.4. ADR-Det Stage 3 OCR Evaluation
This experimental scenario has been conducted where 100 photos from ADR vehicles have been chosen. The whole set of photos is coming from the toll posts before the tunnel’s entrance under examination in the project HMRT (the tunnel is located in North Greece). The specific set includes photos taken during the daytime from February until March 2020. For the specific period interval, it has been calculated that 1.3% of all vehicles passing through the specific tunnel are ADR vehicles. Results are presented in
Table 4.
As it can be derived from
Table 4 the results are very satisfactory (>90%). More specifically, the EasyOCR algorithm recognizes at least two digits in the upper part of the ADR sign in 92% of the cases (91% recognition of 2 digits, 1% recognition of 3 digits) with an additional 7% recognition of 1 digit. On the other hand, EasyOCR recognizes at least four digits in 84% of the cases (81% recognition of 4 digits, 3% recognition of 5 digits, respectively), and in 11% it recognizes three digits (out of the total 4). Thus, in both levels of the ADR sign (upper and lower), only 1% of the cases remain unrecognizable.
Improvements to the ADR-Det Optical Character Recognition Process
The second experimental scenario involved the uniform doubling in dimensions of the region of interest identified by TensorFlow, using bicubic interpolation. That way, the resolution was artificially increased four-fold before the optical character recognition stage. This filtering approach is achieved in a few milliseconds (250–300 ms).
Table 5 shows that the EasyOCR algorithm now succeeds in recognizing at least two digits in the upper part of the ADR sign in 90% of the cases while achieving a cumulative success rate of 97% with 3 and 4 digits in the lower part.
5.5. ADR-Det Performance Evaluation
The fourth experimental scenario was based on a dataset of ≈86 K photos given to the authors by the motorway and tunnel operator. This large dataset was taken from the MAL-1H and MAL-1K stations, spanning the entire month of March 2021. Since two photos are taken from every vehicle, the software automatically stops the second photo from entering the detection pipeline. That way, identical results are prevented from appearing while at the same time doubling performance. Performance and measurements were recorded on the authors’ reference HMRT-EF application, running only on software (not involving a GPU). The results are summarized in
Table 6.
As shown in
Table 6, of the ≈86 K photos, half do not pass onto Stage 1. Of the photos entering the detection pipeline, 64.8% progress onto Stage 2, and only 2.81% make it onto Stage 3. Finally, 1.69% of the original, unique photos are OCR’d. The average processing time using a 6-cores/12 threads system is ≈0.45 sec/photo, yielding a rate of 2.23 ± 0.1 photos/sec. ADR-Det stage 1 utilizes, on average, about 90% of the CPU, while Stages 2 and 3 utilize about 80% of the CPU. Since the test system is equipped with a 6-core/12-Threads CPU, the detection processing rate is approximately 2.69 s per single-core/2-Threads for each photo and a speedup value of
per core and
per thread.
6. Discussion of the Results
The results coming out from the experimentation are very promising. First, the ADR-Det algorithm provides an 87–94% accurate detection of trucks during stage 1 of the algorithm. Then during the detection process of ADR signs, the ADR-Det algorithm scores an accuracy score of up to 96%. Finally, the authors executed several experimental scenarios at the ADR-Det stage 2 part and validated their approach, providing 92% mean accuracy in most cases of both ADR-Det stages 1 and 2.
Regarding OCR, the ADR-Det algorithm does produce significant results. It correctly recognizes the digits in ADR signs in more than 90% of the images in the upper part of the sign and more than 97% in the lower part. However, because the numbers used are specific, the success rate of recognizing the digit that leads to the correct identification of the hazardous substance transported is more than 95% (as not every combination of digits is used), as explained below.
In the results, we do not expect to see all ten digits, particularly in the lower part of the sign (e.g., all possible combinations for ADR hazardous substances up to now start with 0, 1, 2, and 3 (2..9, X) as the first digit). However, even if the algorithm is unable to recognize all of the digits, this type of encoding greatly simplifies the recognition of the hazard substance; for example, if the algorithm recognizes three out of four digits of the lower part of the sign and these digits are 965, the missing number is undoubtedly the first one. It must be either 1 or 2, as these are the only available UN numbers at the moment (UN 1965: Hydrocarbon gas mixtures, UN 2965: Boron trifluoride diethyl etherate).
The upper part of the ADR sign is the hazard identifier number. It usually consists of two digits (but may contain three digits in some cases). The lower ADR sign part describes the substance carried with at least three digits (maximum of 4). Therefore, it is sufficient to ensure 100% successful recognition of the upper part, if the hazardous substance transported with the specific ADR vehicle (lower part) is detected. That is, if at least three out of four or two out of three consecutive lower part digits of the carried substance are recognized.
The combination of the upper part of the sign with the lower part results in only one substance. More specifically, if the upper part of the sign includes digit number two, it refers to gases (therefore, it can only have hydrocarbon gas mixture as a hazardous substance). If it includes the digit number four, it refers to solids (therefore, it can only have boron). Similar considerations and examples can be given for other combinations of digits.
Cross comparison of the overall accuracy of ADR-Det algorithm with Existing License Plate Recognition tools for short distances varies from 82 to 92% for low contrast, dirty, reflected, or deformed images up to 92–97% for clear images. Nevertheless, in most cases, these images include 150–300 dpi 3-channel color images, 7–20 times the size of the toll post images used. This limitation of single channel 96 dpi and 40–65 KB in size toll post images, provided the mean accuracy of the ADR-Det algorithm’s detection close to 92% making it a very useful tool for the EGNATIA SA motorway operators. As mentioned by the operators, such an automated tool of at least 85% accuracy, using images taken from their existing infrastructure, shall provide significant statistical results as well as real-time information on the ADR-denoted cargo on the road in cases of catastrophic tunnel incidents.
Additionally, the ADR-Det algorithm has the potential to achieve better than 97% if trained using a high-resolution imagery input. The authors have raised these concerns to the motorway operators for further improvements of their toll post cameras or even the acquisition of the author’s proposed embedded 8-core ARM ADR-Det implementation, including at least 8 or 16 MegaPixel (MP) camera modules.
Regarding HMRT-EF application performance, it achieved a mean processing time of 0.45 sec per photo for its three stages using a 12-core CPU that is real-time efficient and 2.6–3.2 s for a single-core CPU close to real-time efficiency. Furthermore, using 8 or 16 cores makes it possible for the authors’ proposed algorithm to be also implemented in portable embedded ARM devices used for real-time detection. However, if this is not possible, the authors also have implemented a cloud-based version of their ADR-Det algorithm.
The developed HMRT-EF application tool has also been implemented as a standalone application of the ADR-Det algorithm. In addition, the HMRT-EF application tool also includes an integrated database containing all ADR substances and their UN numbers. This database can eventually be used to query and identify the carried substance offline, or even if the ADR-Det algorithm identifies fewer digits during the ADR-Det stage 3 detection process.
7. Conclusions
The development of a tool called HMRT-EF for the automated recognition of the hazardous substance carried by an ADR vehicle is presented in this paper. The tool receives photographs from the toll cameras before the tunnel entrance in both directions as input. As a result, operators in the specific tunnel’s control room may know in advance how many ADR vehicles are about to cross the tunnel and what substance they are carrying.
The authors implemented a three-stage automated ADR CNN algorithmic process, called the ADR-Det algorithm, and included or provided as an external service interface by their HMRT-EF application. The ADR-Det algorithm can take as input low-resolution images taken from the toll posts and provide real-time feedback to the road operators passing information of vehicles carrying dangerous goods.
The provided HMRT-EF application has also been implemented as a service for portable ARM detectors implemented by the authors to be included in their HMRT Resources Management System (RMS) implementation. As an HMRT service, It will be used to assess the movement of the ADR vehicles along the road between toll stations. HMRT-RMS information from the data extraction of past vehicles’ transit from toll post entries will be displayed using the appropriate HMRT dashboard. Furthermore, the estimation of ADR vehicle placement in real-time can be inferred using Google geolocation services on the HMRT RMS map. The authors set the latter as future work.
The appliance of HMRT-EF, apart from delivering post-processing ADR information and for real-time use at an industrial operational level, shall effectively monitor the carried hazardous substances throughout the motorways. HMRT-EF provided as a real-time service will minimize actions taken by the authorities in cases of a fire-tunnel accident and will increase preventive measures towards fire and toxic release accidents.
Furthermore, the successful installation of the implemented tool as a service, using portable ARM devices in most toll posts, is expected to reduce the number of fire accidents, leading to the achievement of the ADR regulation objectives and the minimization of fatalities and injuries in tunnel fire accidents. The authors also set future work to further test their ADR-Det algorithm via the HMRT-EF application provided as a service using additional photos and present their results in a subsequent paper.
Finally, concerning privacy protection and the GDPR directive, it is emphasized that data entrusted to the authors by the road operator are used exclusively to develop the system. In all circumstances, any visible license plate, date and time entry, and photo ID are redacted before use in any publication. No part or member of the project team has access to the Ministry of Infrastructures and Transport databases or the Ministry of Civil Protection/Traffic Police. Consequently, it is impossible to identify vehicle owners. Moreover, all photos are of low quality, gray-scale, and cameras are positioned on the lower-left side of the vehicles’ direction. On rare occasions, one can see a person’s silhouette inside small vehicles and nothing more, making face detection impossible. Since the system rejects all small vehicles at the first stage, the only visible part of large vehicles proceeding to later processing is below the windshield.


