Article

Algorithms for Bidding Strategies in Local Energy Markets: Exhaustive Search through Parallel Computing and Metaheuristic Optimization

1
Department of Electrical and Electronic Engineering, Universidad Nacional de Colombia, Bogotá 10100, Colombia
2
Department of International Studies, GERS, Weston, FL 33331, USA
3
Department of Electrica Engineering, Khalifa University, Abu Dhabi 127788, United Arab Emirates
*
Author to whom correspondence should be addressed.
Algorithms 2021, 14(9), 269; https://doi.org/10.3390/a14090269
Submission received: 15 August 2021 / Revised: 29 August 2021 / Accepted: 2 September 2021 / Published: 16 September 2021
(This article belongs to the Special Issue Metaheuristic Algorithms in Optimization and Applications 2021)

Abstract

:
The integration of different energy resources from traditional power systems presents new challenges for real-time implementation and operation. In the last decade, a way has been sought to optimize the operation of small microgrids (SMGs) that have a great variety of energy sources (PV (photovoltaic) prosumers, Genset CHP (combined heat and power), etc.) with uncertainty in energy production that results in different market prices. For this reason, metaheuristic methods have been used to optimize the decision-making process for multiple players in local and external markets. Players in this network include nine agents: three consumers, three prosumers (consumers with PV capabilities), and three CHP generators. This article deploys metaheuristic algorithms with the objective of maximizing power market transactions and clearing price. Since metaheuristic optimization algorithms do not guarantee global optima, an exhaustive search is deployed to find global optima points. The exhaustive search algorithm is implemented using a parallel computing architecture to reach feasible results in a short amount of time. The global optimal result is used as an indicator to evaluate the performance of the different metaheuristic algorithms. The paper presents results, discussion, comparison, and recommendations regarding the proposed set of algorithms and performance tests.

1. Introduction and State of Art

These days, there are multiples changes in the structure of transmission and distribution of electric energy that allows the integration of new technologies notions in generation, storage, electric mobility [1,2], and energy metering [3]. As a result of these system changes, electricity dependence and energy transactions have increased. The Local Energy Markets (LEM) is an opportunity for small grid actors to actively take part in the bidding process. LEM allows local transactions that empower consumers, producers, and prosumers in the goal of creating energy balances [4].
LEM are defined locally in terms of residential customers close enough in the same geographical and social area. However, the larger the number of actors, the harder the synchronization, control, and optimal market operation. To replicate and achieve optimal local energy market responses, it is necessary to guarantee coordination among the different market participants and appropriate tools for proper decision making [4,5].
The CEC (Congress on Evolutionary Computation) and GECCO (Genetic and Evolutionary Computation Conference) 2021 competition on “Evolutionary Computation in the Energy Domain: Smart Grid Applications” called for participants to develop metaheuristic optimization solutions for LEMs operation under complex conditions such as those that include trading energy in an LM (Local Market) [6]. Considering several explicit mathematical formulations, these problems cannot be solved efficiently due to the complex nature of LEM models. Heuristic and metaheuristic algorithms have been shown to be a reliable option in problems that include energy transactions [7]. An example of this is the different set of evolutionary algorithms explored for the solution of a bi-level energy market problem of nine participants in [6,7]. Track 1 of a 2021 competition includes a complex bi-level market problem with nine different participants. The upper-level agents try to maximize their profits, depending on the solution of the lower level problem. This interdependency between decisions makes the problem not an easy task [6,8]. Therefore, the complexity of this problem with the high number of variables is adequate for the application of different heuristics-based algorithms and special computational structures [6].
More complex computational architectures had been required for the development of electrical networks, control strategies, and optimal decisions. In order, to obtain optimal and feasible solutions in recent times for the planning and operation of complex systems with a high number of devices, one of the proposed architectures is the use of Parallel Computing (PC). PC allows the execution of tasks in parallel, thus avoiding the long processing times required in the execution of activities sequentially [9]. In this work, a parallel architecture is used to reach a global optimum in a bi-level local market with different agents using brute force [10,11]. In this way, not only a complex optimization problem is solved, but it is also possible to measure the performance of different metaheuristic algorithms.
The remainder of this document includes the following: Section 1.1—a summary of the state-of-the-art for different approaches in terms of metaheuristic algorithm for SMGs operation planning and PC power system applications. The next section is a presentation of a test case. Section 3 is a presentation of the HyDE-DF (hybrid-adaptive differential evolution with a decay function), HHO (Harris Hawks Optimization), WOA (whale optimization algorithm), and DEEPSO (Differential Evolutionary Particle Swarm Optimization) algorithms. Section 4 presents the algorithm for PC; then, it presents the evaluation of a metaheuristic algorithm using PC global optimal. Finally, the last section shows the conclusion of the work.

State of Art

In recent years, the concerns of fossil fuel reduction and climate change, combined with the gradual decrease in costs of unconventional sources, are pushing the incorporation of renewable energy or other types of sources on isolated networks (PV, EV, Genset, BESS) or small grids that allow local energy transactions, as seen in LEM. Nevertheless, the changeable and undefined nature of renewable energy has created significant challenges for power networks because the power produced by renewable energy is not completely dispatchable and therefore cannot be controlled. For this reason, new approaches have developed to integrate large amounts of renewable energy in smart grids and local markets, leading them to operate in a more effective, efficient, economical, and sustainable direction [4,12].
A local grid could include loads and distributed energy resources, storage, and controllable loads, and it should be managed in a controlled manner whether or not it is interconnected to the main power grid [12]. A local small grid could deliver auxiliary services to TSO or DSO could operate energy arbitrage (store energy when the price is low to sell it or use it when the price is high) and actively participate in energy markets, in addition to participating in the distribution systems with the sell or bid of additional or required energy. However, to ensure that these activities are achievable, a small grid has to optimize the utilization of its resources, pursuing economic profit. Due to the nature of renewable energy sources, load forecasting elements, and the energy market, the time horizon for the optimization and dispatch is the day-ahead. On the other hand, LEMs whose energy prices can vary hourly may require optimization with an equivalent time horizon. Thus, day-ahead and intra-day optimal load balances are the most important requirements in an LEM.
The operation of LEMs is one of the main problems in recent years due to the increased number of agents in the grid. The growing interest in these systems has been the result of [13,14], the integration of renewable sources, DGs price reduction, community self-resilience strategies, market flexibility, and dynamic loads, among other factors. LEM requires two main elements: a market controller that creates conditions and policies to carry out the local balance and maximize their economic gains [8], and an energy controller that distributes and schedules the available energy request and resources [8]. A good number of publications had been conducted in the area of autonomous generation and load control, including intermittent sources and demand response [15,16,17,18,19,20,21,22,23]; however, few have investigated the operation of autonomous market controllers [8]. Some efforts have focused on the theoretical assessment of optimal strategies. The solutions include the performance evaluation of real customer behavior, making the problem complex [24].
Since these types of problems are normally non-convex with a wide search space, they can become NP-hard problems [25]. This characteristic results in high computation time that limits the possibility of mathematical simplifications that allow finding points closer to the global optimal solution. Different alternatives have emerged to solve these problems. (a) Metaheuristic solutions search for problem optimization in efficient time; nevertheless, the formulation does not guarantee global optimal solutions. (b) Exhaustive searches guarantee feasible and global optimal solutions with the evaluation of various combinations of different decision variables. The last process can be cumbersome, making the problem unfeasible for applications that require responses in time frames of a day or hours.
Metaheuristic algorithms are presented as possible strategies for optimal bidding in an LEM. Different computational strategies for optimal agents bidding are assessed in [6]. In that research, the authors evaluate different LEM strategies based on the community storage and agent’s revenues, cost, and local electricity consumption. The evaluation results suggest different opportunities to increase the energy transactions in the system. On the other hand, parallel structures are useful when problems depicts high complexity, which leaves the exhaustive enumeration as the only way to find the global optimum [11]. However, this search was previously dependent on human calculations, which led it to becoming error-prone, exhausting, and without coherent results that allowed concise conclusions. Nowadays, with the development of computers and more suitable structures for the parallelization of activities, brute force algorithms have become feasible possibilities to support the exhaustive search and the solutions of these problems. This computational development was initially shown with the use of Message Passing Interfaces—MPI architectures. Currently, cloud or fog architectures, along with FPGA and GPU architectures, are used in the parallel processing of operations. In the case of power systems, some parallelization applications have been shown in solving different problems. Some researchers have used parallel architectures mainly for the solution of power flow [26], transient stability [27,28,29], EMT analysis [30,31], and the integration of renewable energy sources [32] problems. Reduced applications in power systems have been cited in the exhaustive search for solutions through brute force algorithms.
2. Materials: Case Studies from Bi-Level Optimization Competition

The energy market problem in this research considers a bi-level optimization problem, where:
(1)
Multiple agents interact through bids/offers;
(2)
Agents can be consumers, producers, or prosumers;
(3)
Agents try to maximize their profits;
(4)
Agents have access to the local and main grid; and
(5)
The system tries to maximize the energy transacted
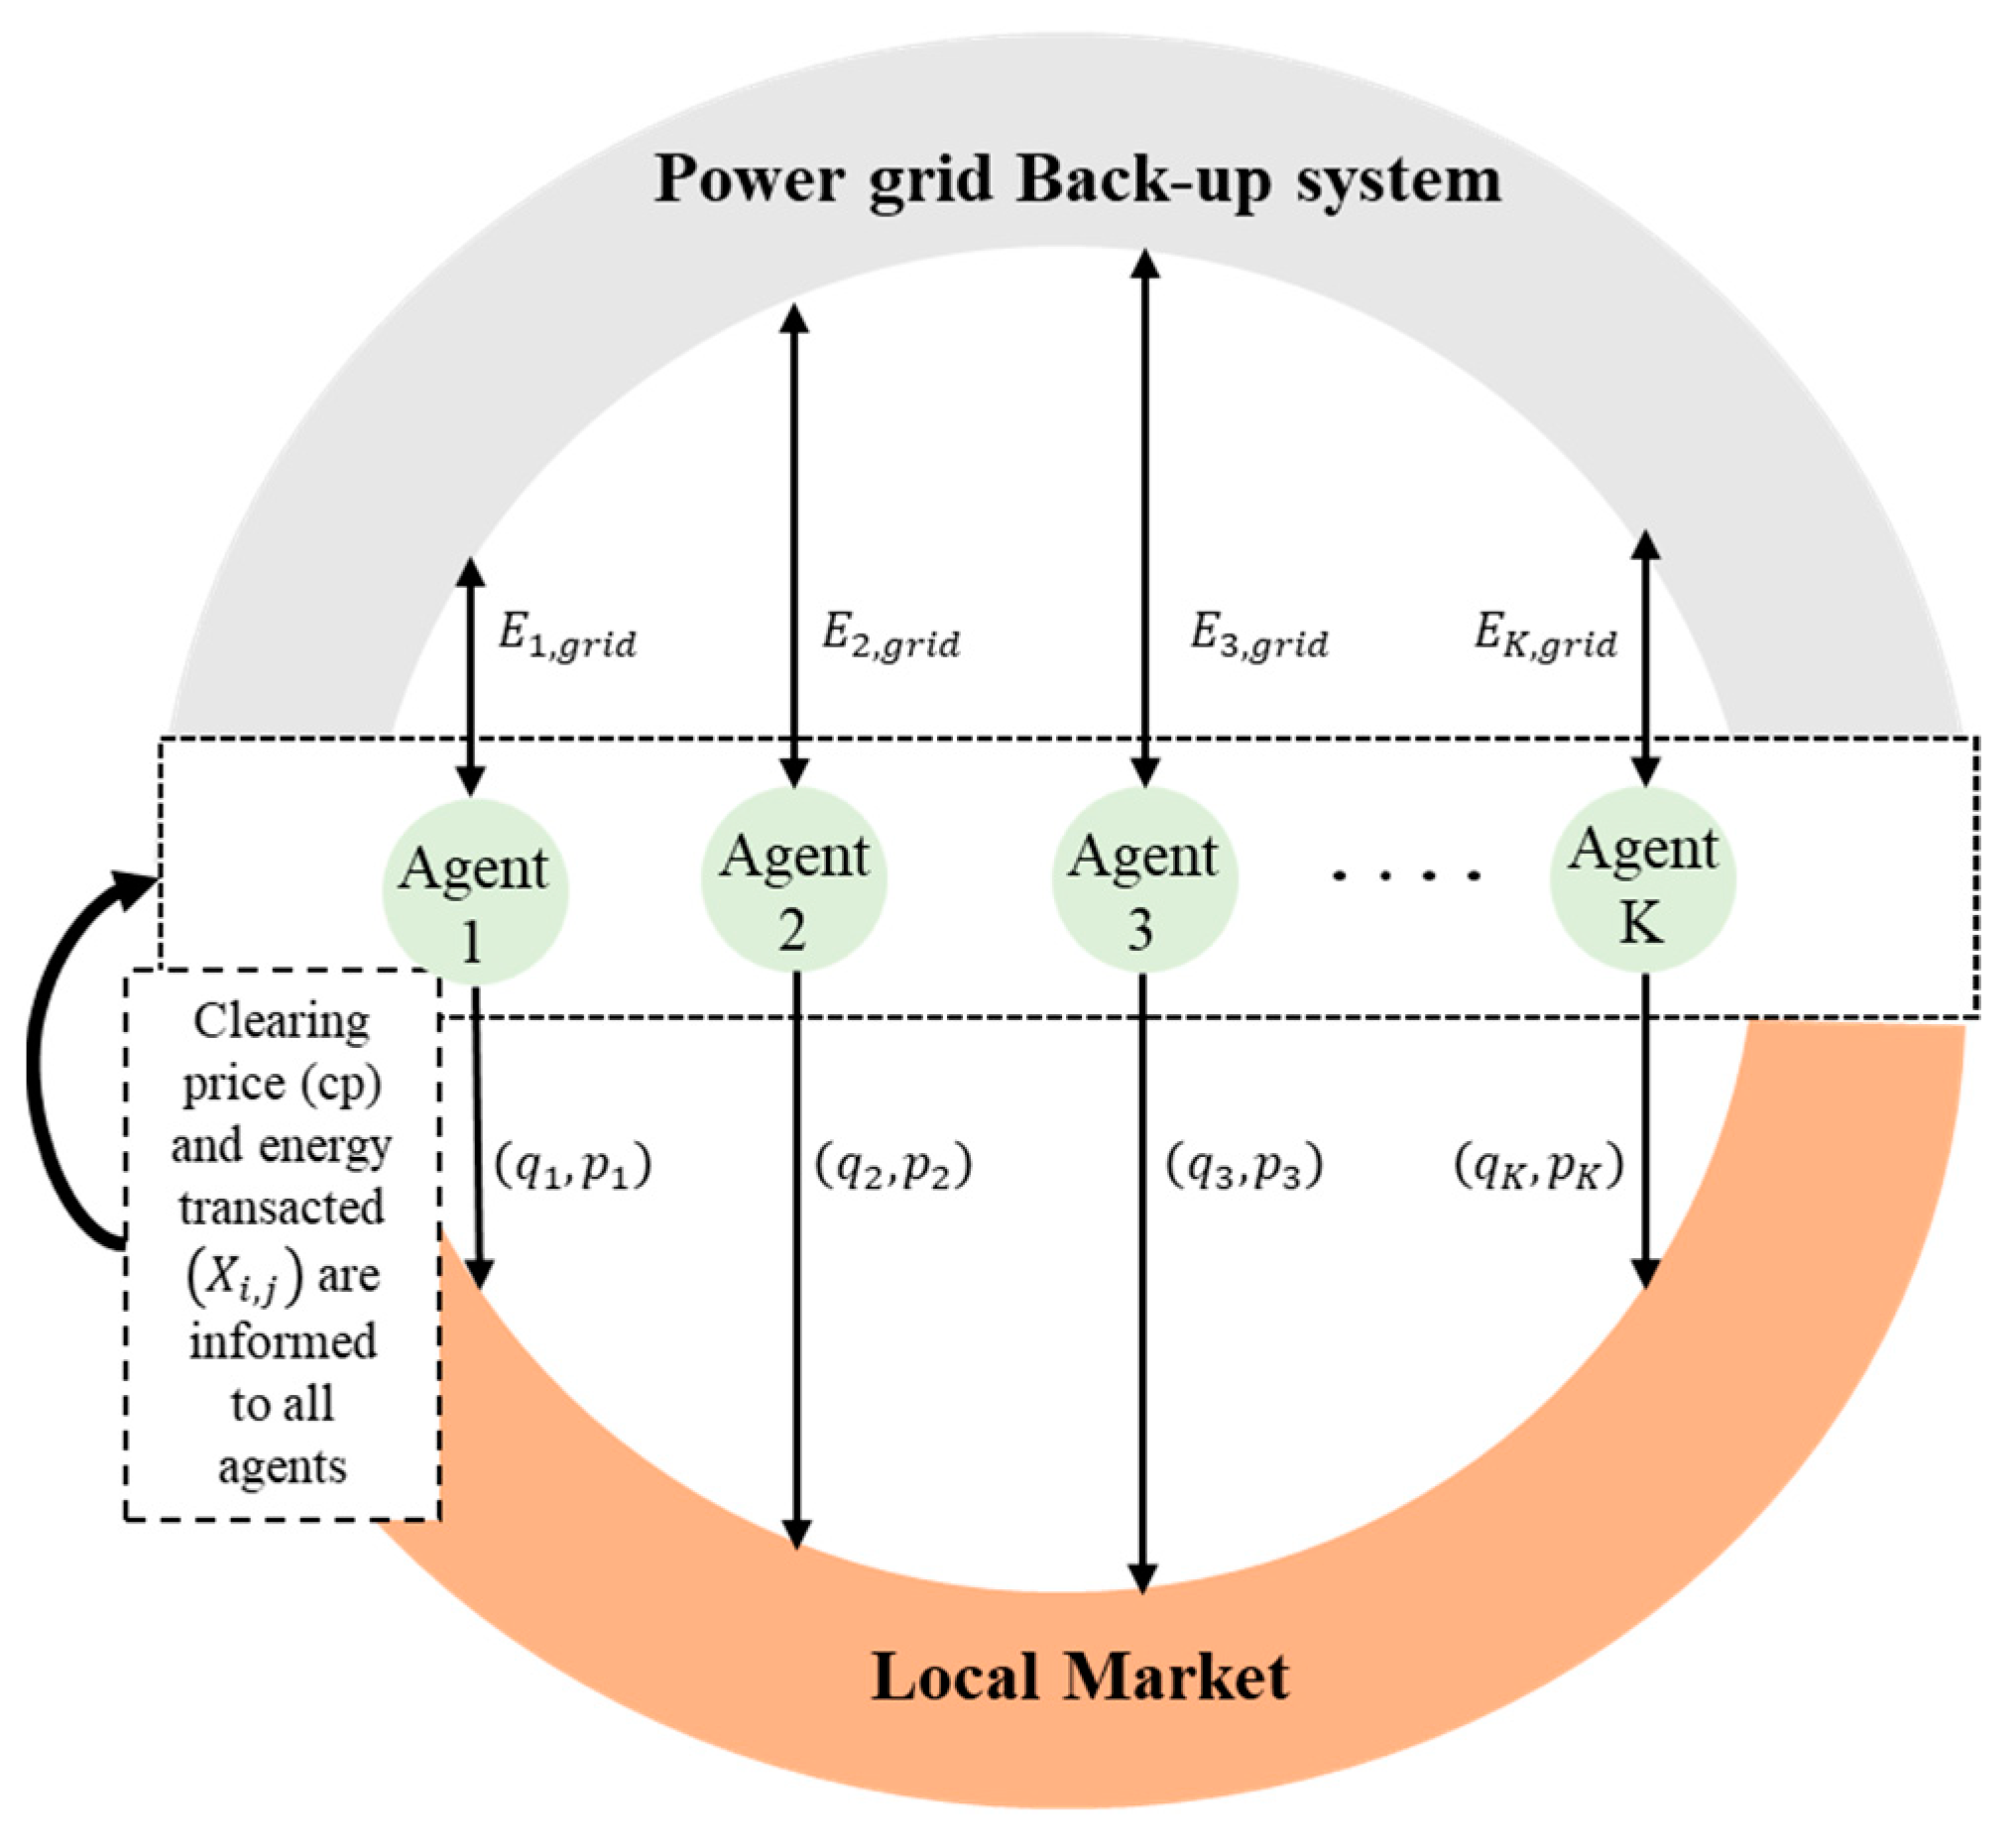
All operations are firstly transacted in the local market and later complemented by the interaction with the main grid. Figure 1 illustrates the problem architecture including the system and the agents involved.
Following the structure of previous years, this year’s competition presents two tracks but, in this paper, only the analysis and results of track 1 will be presented. The first test bed proposes a bi-level optimization problem for bidding strategies in local energy markets with agents in the upper level trying to maximize their profits [6].

2.1. Track 1: Bi-Level Optimization of Bidding Strategies in LEM

The case considers an LEM where multiple agents interact to maximize system transactions. Agents that interact in the problem include consumers, producers, and prosumers. The main concern is to maximize the transactions locally and interact, if required, with the power grid back-up system. The problem is formulated using a bi-level problem formulation. The lower level maximizes the internal transactions; the upper level looks for agents’ profit maximization.
The solution of the problem does not allow independent optimization for both levels. The solutions must guarantee that the clearing price (cp) is reached in the lower level, and the solution affects the interaction with the wholesale market. cp is affected by agents’ strategies for selling and buying energy. The bidding process uses merit order for the allocation of generation and load offers.
The system profit maximization follows Equations (1)–(3):
max j P j N p i C i N c
P j = i c p x j , i + c F E s e l l j , g r i d c m G j
C i = j c p x j , i + c G E b u y g r i d , i
where:
P j : Producers’ profits
C i : Cost for consumer agents
c p : LEM clearing price
x j , i : Energy sold by the agent
c F : LEM clearing price
E s e l l j , g r i d : Energy sold by the agent
c m : Marginal price of generation unit
G j : Energy produced by generation unit
c G : Grid price
E b u y g r i d , i : Energy bought by agent i

2.2. Algorithm Structure

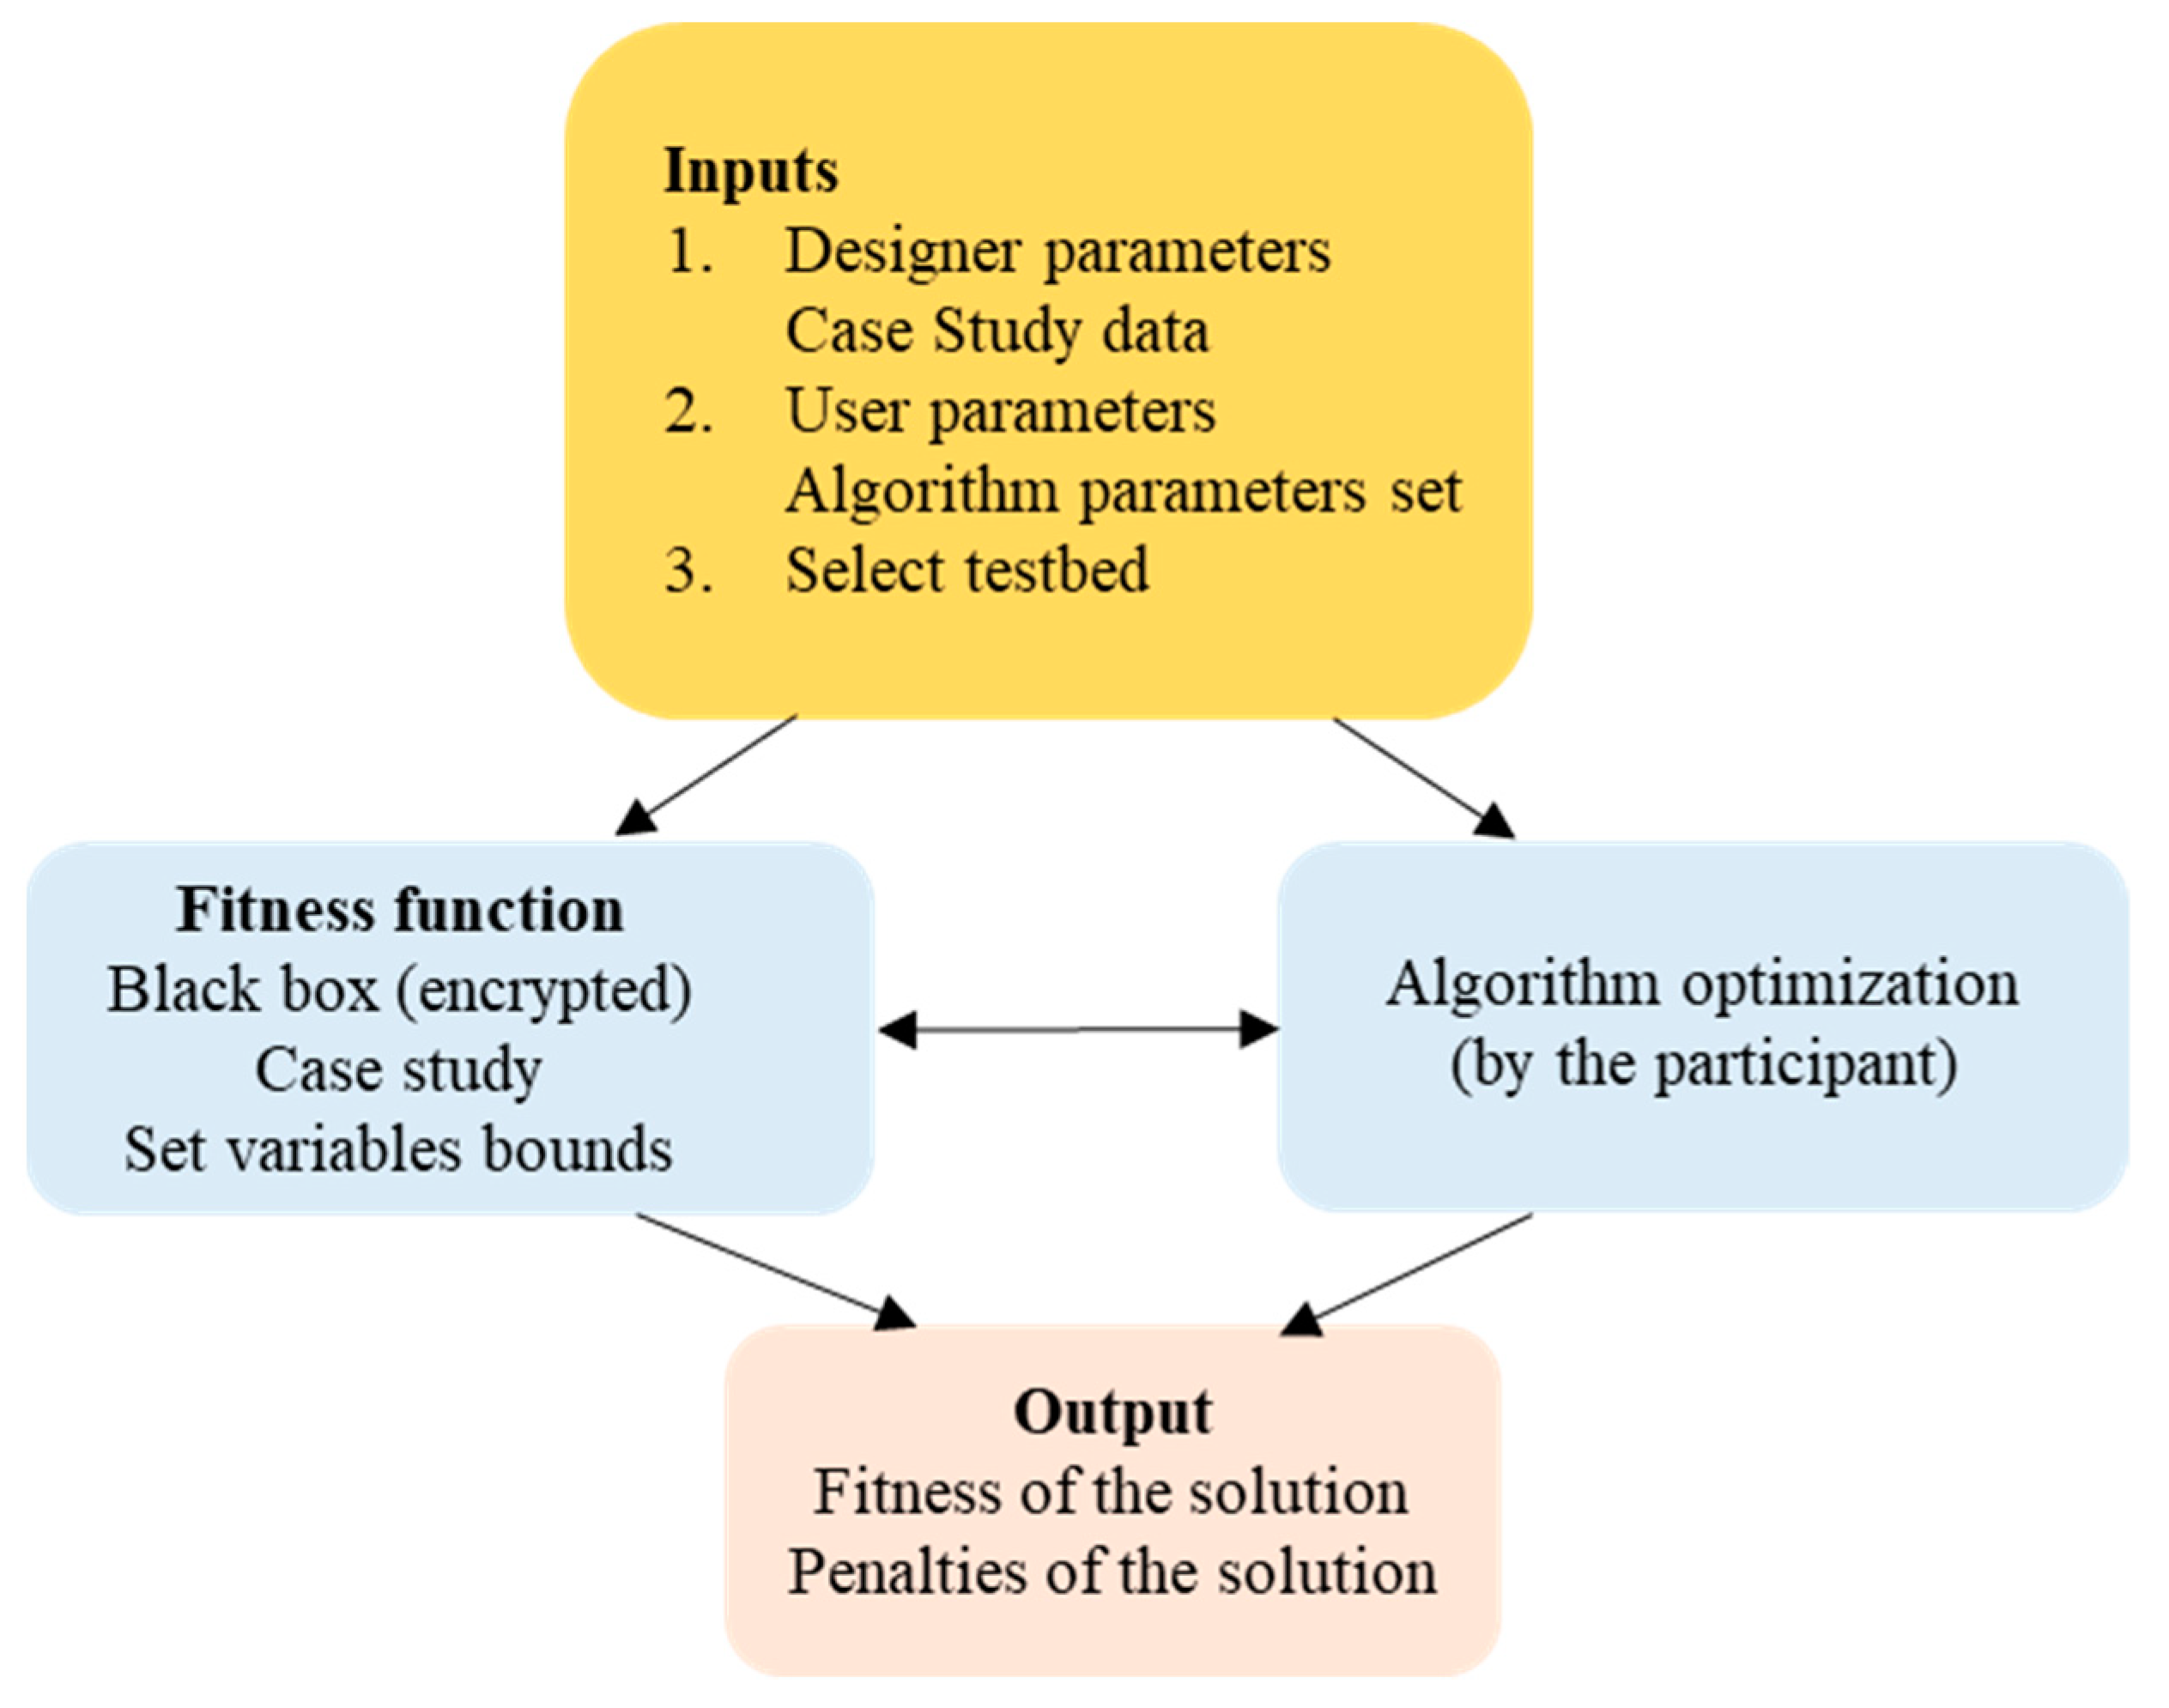
The case study and evaluation platform require two codes: the first code is provided by the competition organizers, and the second is proposed by each competitor. The organizers’ codes include decision parameters, bounds, and some algorithm settings. The main algorithm evaluates the algorithm performance of different competitors using an encrypted code [7]. The evaluation outputs include fitness, penalties, and violations. The platform structure is summarized in Figure 2.

2.3. Fitness Function Encoding

The optimization function is based on the maximum profits from the interaction of multiple agents in the LEM. Each agent transaction is sent in tuples that include quantity and price ( q k , p k ). Bids and offers are collected all day in t periods that go from 1 h to 24 h Bids and offers are represented with positive and negative signs. Consumer agents can send bids in the range [ 0 ,   L m a x ], producer agents send offers in the range [ P m a x ,   0 ], and prosumers can send offers and bids in the range [ P m a x ,   L m a x ]. LEM prices are in the range [ c F , c G ]. The solution structure is shown in Figure 3.

2.4. Problem Formulation

The problem structure is represented by an objective function and a set of constraints and assumptions.

2.4.1. Objective Function

The objective function maximizes the transaction on the LEM for all agents in the system. The objective function is represented by the average profit of producers, consumers, and prosumers, as shown in Equation (4). The lower the value of the objective function, the better the profits among the agents in the LEM.
F i t n e s s ( X ) = m e a n ( P r o f i t s ) + s t d ( P r o f i t s )

2.4.2. Model Assumptions

  • Local and wholesale markets are considered [7].
  • Consumers make bids, producers make offers, and prosumers can make both.
  • No initialization tweaks are allowed.
  • A maximum of 10,000 evaluations are allowed in the competition.
  • The maximum generation capacity for generator agents is 2 kW.
  • Bound tariffs consider a flat feed-in tariff c F = 0.095 units and c G = 0.20 units.

2.4.3. Distance to Global Optima

To evaluate the performance of different metaheuristic algorithms, a distance to optimal is included in this article. The metric is shown in Equation (5).
d o p t = F i t n e s s ( X ) G l o b a l o p t G l o b a l o p t

3. Methods: Heuristic Algorithms and Parallel Computing Algorithm

3.1. HyDE-DF Algorithm

HyDE-DF is a Hybrid-Adaptive Differential Evolutionary with a Decay Function algorithm proposed in [33]. It is an improvement of the HyDE algorithm presented in [34], which uses a mutation strategy called “DE/target −to −perturbed_best/1” and self-adaptive mechanisms. This algorithm has been applied to smart grid problems showing high competitiveness.
The HyDE-DF version implements a decay function that prevents fast convergence unto the best individual in the population. It incorporates a re-initialization mechanism that is active if several successive iterations do not exhibit improvement, replacing the individuals with a new population around the best solution.

3.2. HHO Algorithm

Harris’s hawks optimization (HHO) [35] is a population-based, gradient-free, nature-inspired optimization algorithm that emulates hawks and rabbits in a predation scenario. Hawks (candidate solutions) perch randomly on some locations and wait to detect a prey; hawks move toward the rabbit, but the prey escape, jumping randomly to its new position. The hawks will pretend to reduce their prey energy (minimize the objective function), looking for positions where the rabbit will be tired.
HHO balances exploration and exploitation through random jumps. It implements a gradual transition from these two states simulating the behavior of Harris’s hawks, in which they cooperate to surround the prey. These are features that have allowed the algorithm to have a satisfactory performance in engineering problems [35].

3.3. DEEPSO Algorithm

DEEPSO is an ensemble-heuristic algorithm that is a mix of “Differential Evolution” (DE) and “Evolutionary Particle Swarm Optimization” (EPSO) that is already a hybrid approach. A robust algorithm results from the combination of these techniques that orients the optimum in a globally correct direction [36]. To find a successful self-adaptive scheme, several variations of DE have been generated [36].
“Stochastic star”, one of the features of this algorithm, allows additional communication probability between individuals. This scheme increases the shear in space of the algorithm to not fall into local optima. Although [36] does not arise from a deductive proof, it offers results that are superior to other unassembled algorithms. The results are supported by the algorithms’ responses for solving complex problems [12].

3.4. HHO–DEEPSO–HyDE-DF Algorithm Tuning

For the hybrid algorithm used, HHO–DEEPSO–HyDE-DF, different parameter combinations were tested, looking for the best mean expected value and robustness in the solution of Track 1. For HHO, DEEPSO, and HyDE-DF, several values of the population and number of iterations were probed; additionally, for the HyDE-DF phase, the use or not of an adaptative DE, the mutation, and the crossover factor were also varied.
A total of 20,736 combinations were probed; for each combination, 10 runs were executed (none exceeded the 10,000 function evaluations). It took 45.8 h distributed in 192 workers.

3.5. Parallel Computing Algorithm for Exhaustive Search

The use of exhaustive or brute force search algorithms is the result of the computers era, where high computational burden can be supported with current processor structures. These algorithms are simple to implement but have high computational cost, sometimes making them infeasible. Exhaustive search algorithms require two main stages: (a) Enumeration, listing all the possible candidate solutions, and (b) Solutions check, confirming if the candidate solutions meet the problem’s constraints. The general basic algorithm followed by this type of development is summarized in Figure 1. The algorithm (Algorithm 1) shows P as the problem’s solution space, Λ as a null space, and c as a candidate solution. The algorithm keeps working with the calculation of different candidate solutions until all candidates are evaluated. Figure 1 shows in green two strategies to speed up the algorithm evaluation. The first is the reduction of the search space. The second is the algorithm’s parallelization.
Algorithm 1: Exhaustive Search Algorithm. (Procedure Exhaustive Search).
1:Search Space Reduction
2:Perform Algorithm Parallelization
3:   c <- first (P)
4:   while c A do
5:    if valid(P,c) then
6:      Output(P,c)
7:    C<- next (P,c)
8:    end while

3.5.1. Search Space Reduction

A large list of candidate solutions might require large evaluation periods. Reference [37] shows that exhaustive search algorithms can be limited in memory rather than in execution time. However, algorithms that require days, months, or years are not desired in the solution of real-life problems. Reference [11] recommends design space reduction before performing the optimization. Additional analysis will often lead to dramatic reductions in the number of candidate solutions and may turn an intractable problem into a trivial one. In some cases, the analysis may reduce the entire candidate list to only a set of valid solutions; that is, it may yield an algorithm that directly enumerates all the feasible solutions without wasting time with tests and the generation of invalid candidates. The algorithm should balance search space reduction and the available computational resources and time.

3.5.2. Algorithm Parallelization

Exhaustive search algorithms are easy to implement. However, they may result in long computation time. Large serial evaluations can show fast results in seconds or minutes when only small sets of candidates are computed. Unfortunately, the story is not the same when millions or quintillions of candidates appear on a problem. In those conditions, not only fast processors are required, but also, appropriate computing structures allow simultaneous evaluations. Reference [10] shows the result of the evaluation of an optimization problem of fisheries management. The results showed an acceleration of 12× using an exhaustive search algorithm using a parallel CPU–GPU computing structure. The results allowed the identification of global maxima. An algorithm parallelization strategy is suggested as a speed-up strategy in exhaustive search. Previous algorithm and acceleration strategies were used in the evaluation of exhaustive search, as described in Section 4.

3.5.3. Algorithm Parallelization

The day-ahead local energy market bidding optimization problem has nine agents: three consumers, three producers, and three prosumers. Prosumer agents are consumers with PV generation capabilities. The agent data correspond to a derivation of standard power profiles of residential houses and PV systems based on the open datasets available in [38]. As shown in Figure 1, each agent has a pair of values corresponding to each period’s quantity and price in the day-ahead market. Consequently, each agent has 48 variables, and the solution gathers all agents within a vector with 432 variables. However, most of the variables are fixed, since the lower and upper boundaries are the same. Table 1 shows the fixed variables and the variables that can change for the quantity and price by the agent and period. The empty cells represent the fixed variables. The last column presents the number of variables that can change by period for all agents. This analysis reduces the number of variables from 432 to 206.
The exhaustive search methodology evaluates all possible solutions of the 206 variables. This paper refers to the number of possible values for each variable as states. Defining the states as N, the number of possible solutions is defined as:
T o t a l = N 206 .
Evaluating only two states of the solution ( N = 2 ), the number of possible solutions is 1.02 × 10 62 . The workstation that evaluates all possible solutions is an Intel Xeon E5-26700/2.60 GHz/Ram 128 GB/16 cores. The workstation can evaluate in parallel 10,000 solutions in 18 s using 16 cores. Considering the number of solutions to evaluate, the workstation is not capable of evaluating them in an acceptable time. However, the problem’s nature allows dividing the exhaustive search by period, since the behavior of the agents for all periods are independent. To reduce the required time to perform the exhaustive search, the problem is fractioned and analyzed by period, reducing the number of variables from 206 to 6 regarding periods 1 to 7 and 20 to 24, 8 for period 8, 10 for periods 9 to 10 and 19, and 12 corresponding to periods 11 to 18. Using (1) to calculate the new number of possible solutions with N = 2 , this number is reduced from 1.02 × 10 62 to 36,864, allowing the workstation to evaluate all possibilities in 66.35 s. Table 2 presents the summary of the states, combinations, and expected simulation time by period.
The first fitness of the initial solution is G l o b a l o p t = 183.16. After evaluating the 36.864 possible solutions, the fitness of the final solution is G l o b a l o p t = 1.5910. The final solution corresponds to the combination of the variable values of the best solution found by period. If the initial solution is the best solution of one period, the variable values in the final solution regarding that period are the values of the initial solution.
This reduction allows increasing the states to perform a more detailed search in the optimization problem search space. Table 3 presents the new settings of all combinations by period. The number of combinations is 344,393,472, and the expected evaluation time is 619,908.25 s (7.17 days). After evaluating all combinations, the fitness of the final solution improves from G l o b a l o p t   = 1.5910 to G l o b a l o p t = 1.4741.

4. Results: Algorithms Performance Analysis Using Global Optimum Results through Parallel Computing

Different metaheuristic algorithms were tested to solve the LEM problem. The test included two phases of evaluation. The algorithms are run initially using an exploration strategy and later exploitation. The exploration stage is the process of identifying new optimal regions while searching for the best solution. On the other hand, the exploitation consists of probing a limited region of search with the expectation of improving the already identified optimal point.
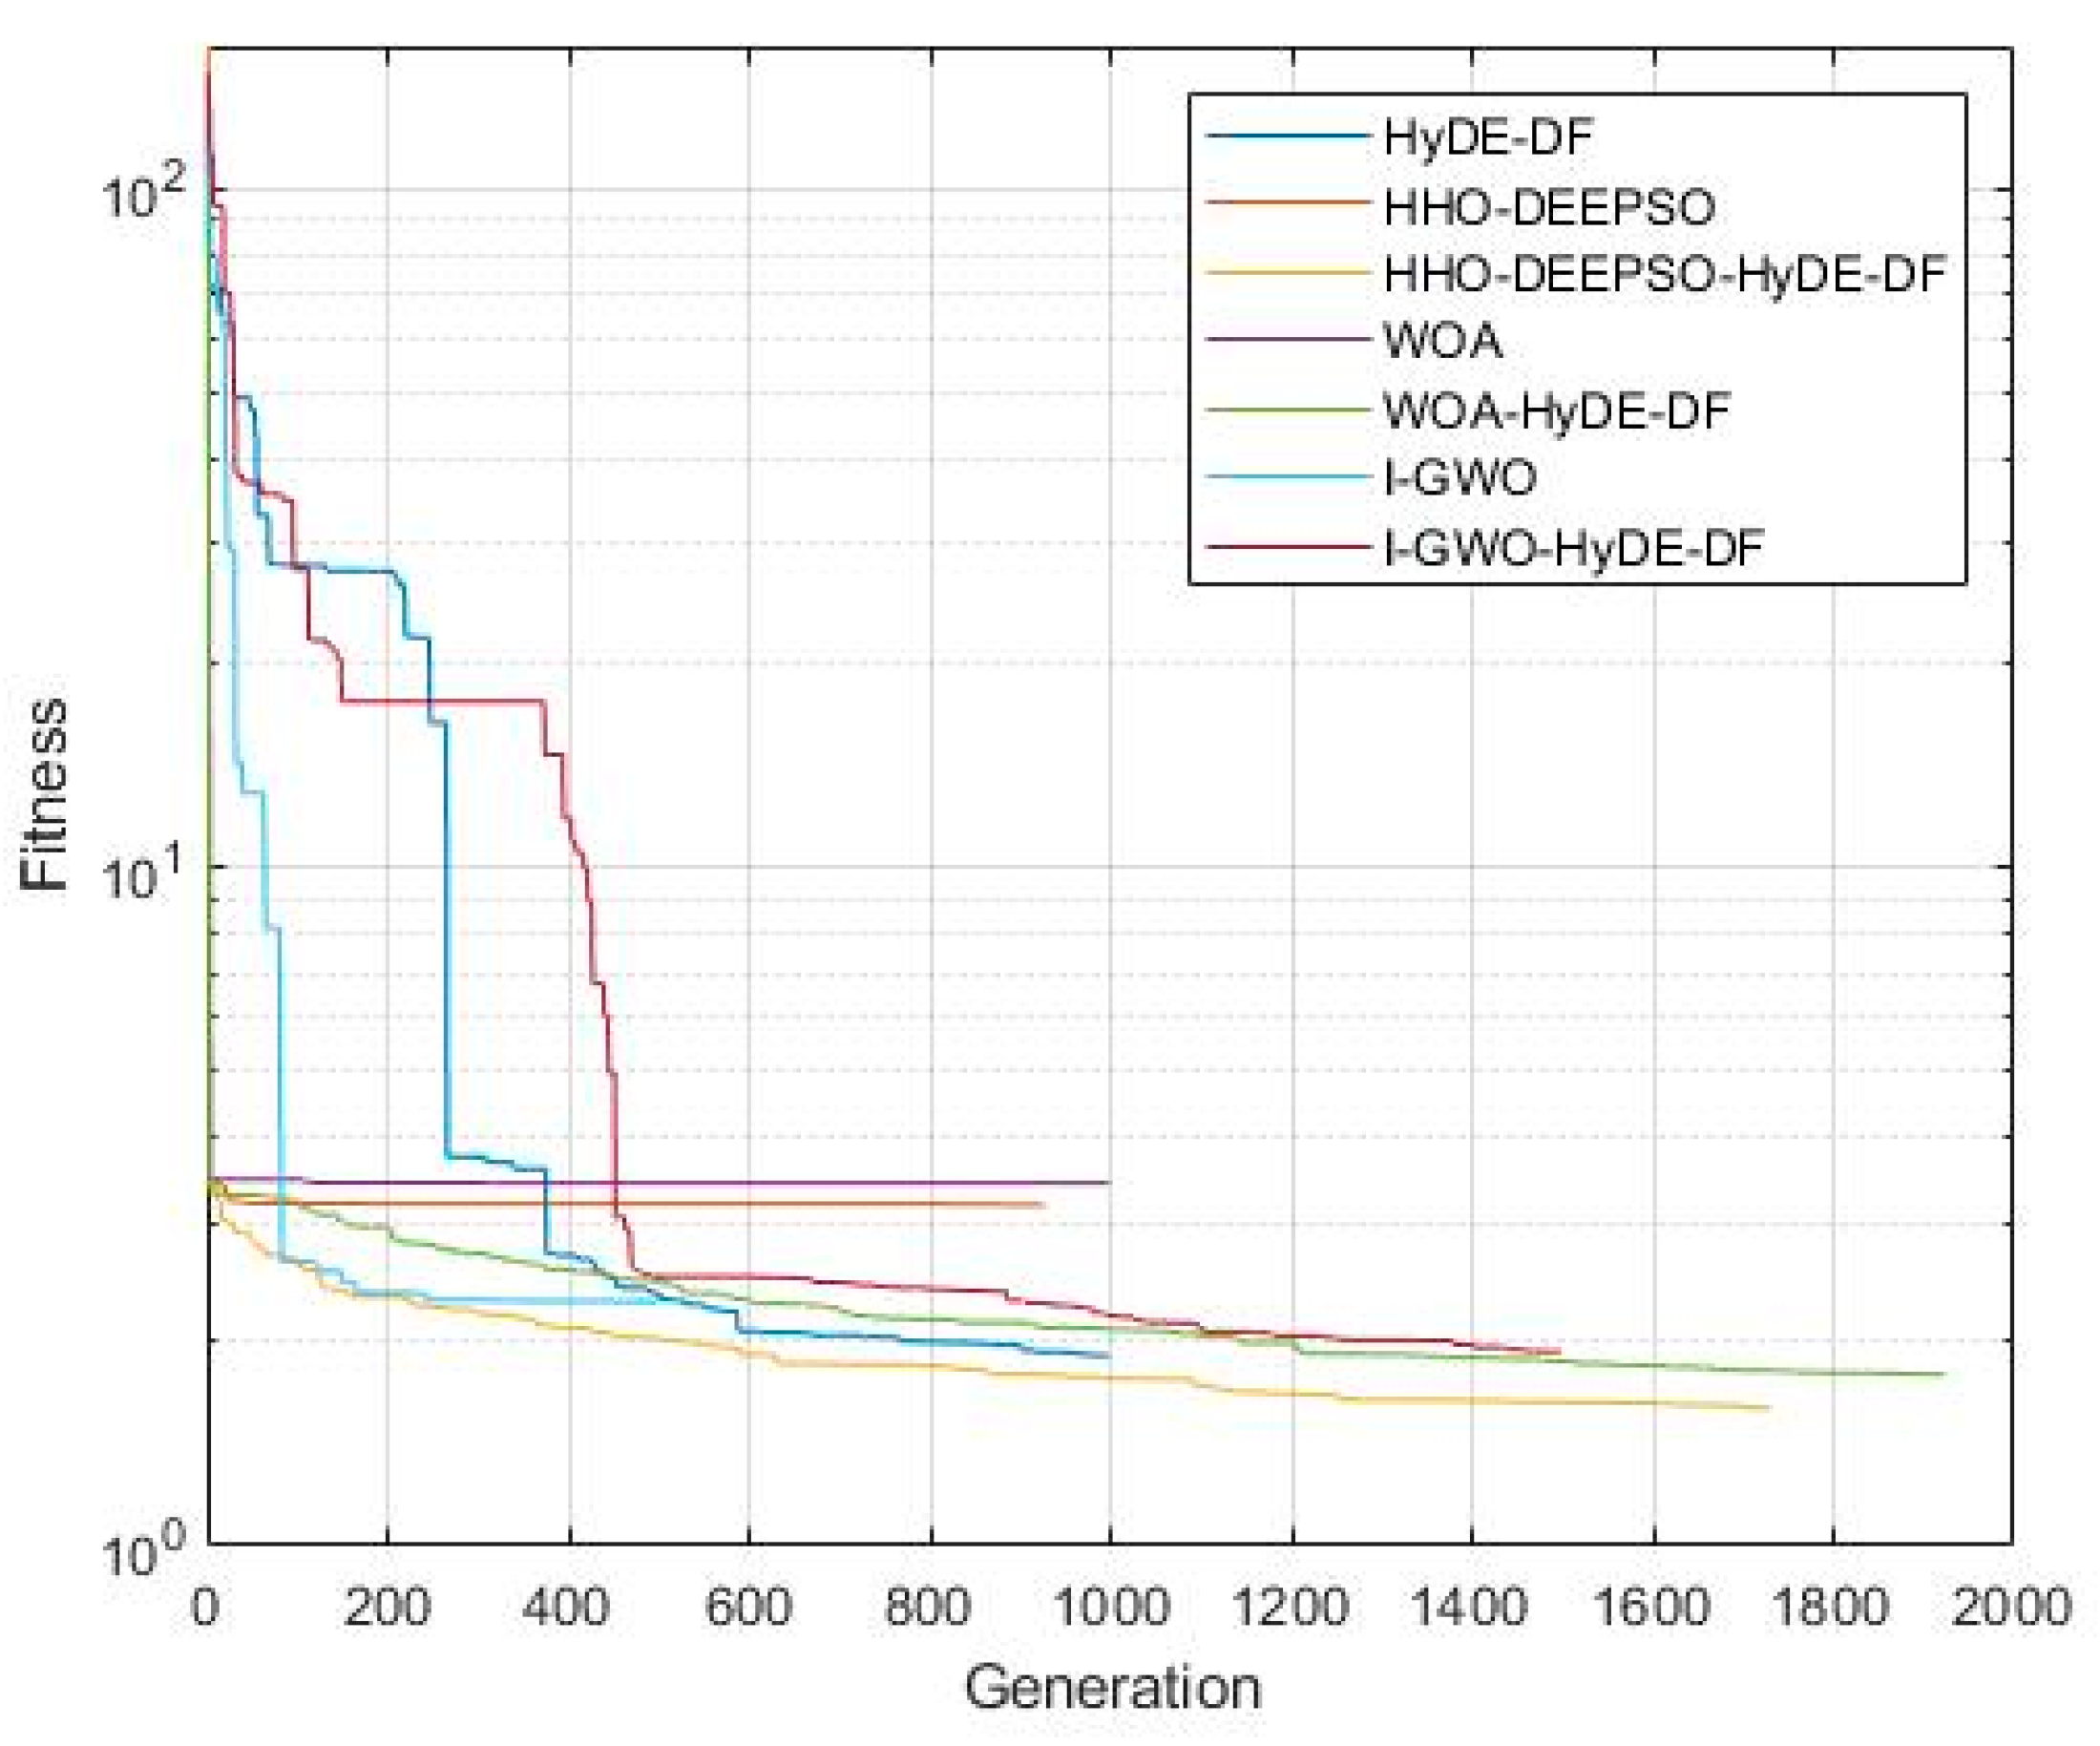
The list of tested algorithms is summarized in Table 4. The results show the minimum and average fitness. Some of the algorithms show better performance during the exploration phase but not the exploitation phase. Figure 4 shows the convergence rate for different strategies. A faster convergence rate shows a positive exploration phase, while better optimal points resulted in a better exploitation phase; e.g., HyDE-DF was superior to all in the exploitation phase. Some of the strategies included hybrid metaheuristic techniques such as HHO-DEEPSO, I-GWO, and WOA. It results in better average optimal points, since their implementation did easily fall in local optima.
The distance to global optimal shows that the lower the magnitude is, the closer the fitness is to the global optimum point.
HHO–DEEPSO–HyDE-DF was probed with 20,736 runs where the most significant parameters were the population and number of iterations of each step. The best results appeared with HHO and DEEPSO phases, which have a low population (three individuals) but a high number of iterations, while the population of the HyDE-DF phase was slightly higher (five individuals) with adaptative DE. The results for some parameters combinations are displayed in Table 5. The Big O notation resulting from these functions to describe algorithm efficiency in order to evaluate computational complexity gives a polynomial order of growth.
Some parameters’ combinations with non-adaptative DE for HyDE-DF show better fitness (1.52 inclusive), but their results present high variance, and they were not repeatable. The results showed on average an inferior performance. Table 6 and Table 7 show the results of the run for the HHO–DEEPSO–HyDE-DF solution reported in Table 4. The green cells represent fixed variables. Table 6 shows the results for bids or offer quantities for each agent. Table 7 represents prices. Positive and negative signs indicate bids and offers.

5. Conclusions

The solution of complex non-convex problems present in academia and industry requires the use of alternative algorithms such as the use of metaheuristics. However, these do not guarantee finding the global optimal solution. As a result of the advancement of PC architectures, this article described a search strategy and algorithm parallelization that allows global optimum in feasible times. The PC architecture is used to run an exhaustive search algorithm in local stations and clusters with multiple cores. PC architecture is also used to perform the parameter tuning of the metaheuristic algorithm that attained the best results, reducing the computation time required in that activity. In this paper, we evaluated the performance of different metaheuristic algorithms using the global optimal that has previously been found using PC. The algorithms are evaluated in terms of distance to optimal solution and ranking position.
The strategy allowed us to verify the performance and results of different algorithms in solving the bi-level local market problem. In this way, the distance to the optimum of different strategies was verified. The strategy with the best performance was HHO–DEEPSO–HyDE-DF, achieving results 10% less effective than the global optimum achieved. In this way, this article shows the results of different metaheuristic algorithms to maximize the energy transactions in the system. To evaluate the performance of such strategies, an efficient parallel computing algorithm is created. The results allow the verification of global optima and the evaluation of different strategies based on the distance to the optimal solution, giving a contribution in the industry sector and academic field with optimization research problems.

Author Contributions

Conceptualization, A.A., D.R., W.G., D.F.G., A.A.S. and S.R.; methodology, A.A., D.R., W.G., D.F.G., A.A.S. and S.R.; software, A.A., D.R., W.G., D.F.G. and A.A.S.; validation, A.A., D.R. and S.R.; writing—original draft preparation, A.A., D.R., W.G., D.F.G., A.A.S. and S.R.; writing—review and editing, A.A., D.R., W.G., D.F.G. and A.A.S.; visualization, A.A.; supervision, S.R. All authors have read and agreed to the published version of the manuscript.

Funding

This research was supported by Universidad Nacional de Colombia, and by Khalifa University under Award No. kkjrc-2019-trans 2.

Institutional Review Board Statement

Not applicable.

Informed Consent Statement

Not applicable.

Data Availability Statement

Not applicable.

Conflicts of Interest

The authors declare no conflict of interest.

References

  1. Kroposki, B.; Bernstein, A.; King, J.; Vaidhynathan, D.; Zhou, X.; Chang, C.-Y.; Dall’Anese, E. Autonomous Energy Grids: Controlling the Future Grid with Large Amounts of Distributed Energy Resources. IEEE Power Energy Mag. 2020, 18, 37–46. [Google Scholar] [CrossRef]
  2. Kwasinski, A.; Weaver, W.; Balog, R.S. Microgrids and Other Local Area Power and Energy Systems; Cambridge University Press: Cambridge, UK, 2016. [Google Scholar]
  3. Barai, G.R.; Krishnan, S.; Venkatesh, B. Smart metering and functionalities of smart meters in smart grid—A review. In Proceedings of the 2015 IEEE Electrical Power and Energy Conference (EPEC), London, ON, Canada, 26–28 October 2015; pp. 138–145. [Google Scholar]
  4. Mengelkamp, E.; Diesing, J.; Weinhardt, C. Tracing local energy markets: A literature review. It-Inf. Technol. 2019, 61, 101–110. [Google Scholar] [CrossRef]
  5. Samper, M.E.; Vargas, A.; Rivera, S. Fuzzy assessment of electricity generation costs applied to distributed generation. comparison with retail electricity supply costs. In Proceedings of the 2008 IEEE/PES Transmission and Distribution Conference and Exposition: Latin America, Bogota, Colombia, 13–15 August 2008; pp. 1–7. [Google Scholar] [CrossRef]
  6. Lezama, F.; Soares, J.; Vale, Z. Optimal Bidding in Local Energy Markets using Evolutionary Computation. In Proceedings of the 2019 20th International Conference on Intelligent System Application to Power Systems (ISAP), New Delhi, India, 10–14 December 2019. [Google Scholar]
  7. Soares, J.; Lezama, F.; Canizes, B.; Vale, Z. WCCI/GECCO 2021 Competition Evolutionary Computation in Uncertain Environments: A Smart Grid Application; 2021; pp. 1–18. Available online: http://www.gecad.isep.ipp.pt/ERM-competitions/wp-content/uploads/2021/01/CEC2021_GECCO_Guidelines.pdf (accessed on 16 March 2020).
  8. Ghorani, R.; Fotuhi-Firuzabad, M.; Moeini-Aghtaie, M. Optimal Bidding Strategy of Transactive Agents in Local Energy Markets. IEEE Trans. Smart Grid 2019, 10, 5152–5162. [Google Scholar] [CrossRef]
  9. Landau, R.H.; Paez, M.J.; Bordeian, C.C. Computational Physics; Wiley-VCH: Weinheim, Germany, 2007. [Google Scholar]
  10. Wilson, G.; Harding, S.; Hoeber, O.; Devillers, R.; Banzhaf, W. Parallel Exhaustive Search vs. Evolutionary Computation in a Large Real World Network Search Space. In Proceedings of the 2012 IEEE Congress on Evolutionary Computation, Brisbane, QLD, Australia, 10–15 June 2012. [Google Scholar]
  11. Wright, J.; Nikolaidou, E.; Hopfe, C.J. Exhaustive Search; Does It Have a Role in Explorative Design? IBPSA: Newcastle, UK, 2016. [Google Scholar]
  12. Garcia-Guarin, J.; Rodriguez, D.; Alvarez, D.; Rivera, S.; Cortes, C.; Guzman, A.; Bretas, A.; Aguero, J.R.; Bretas, N. Smart Microgrids Operation Considering a Variable Neighborhood Search: The Differential Evolutionary Particle Swarm Optimization Algorithm. Energies 2019, 12, 3149. [Google Scholar] [CrossRef] [Green Version]
  13. Qu, B.M.; Ding, T.; Huang, L.; Wu, X. Toward a Global Green Smart Microgrid. IEEE Electrif. Mag. 2020, 8, 55–69. [Google Scholar] [CrossRef]
  14. Mohammed, A.; Refaat, S.S.; Bayhan, S.; Abu-Rub, H. AC Microgrid Control and Management Strategies: Evaluation and Review. IEEE Power Electron. Mag. 2019, 6, 18–31. [Google Scholar] [CrossRef]
  15. Soares, J.; Lezama, F.; Canizes, B.; Vale, Z. WCCI/GECCO 2020 Competition Evolutionary Computation in Uncertain Environmens: A Smartgrid Application. 2019. Available online: http://www.gecad.isep.ipp.pt/ERM-competitions/wp-content/uploads/2019/12/WCCI2020_Guidelines.pdf (accessed on 16 March 2020).
  16. Carlo Sim, M.; Bonilla, J.A.; Rivera, S.; Arevalo, J.C.; Santos, F. Uncertainty cost functions for solar photovoltaic generation, wind energy generation, and plug-in electric vehicles: Mathematical expected value and verification by Monte Carlo simulation. Int. J. Power Energy Convers. 2019, 10, 171–207. [Google Scholar]
  17. Arango, D.; Urrego, R.; Rivera, S. Economic Dispatch in Microgrids with Renewable Energy Using Interior Point Algorithm and Lineal Constrainst. Ingeniería Y Ciencia 2017, 13, 123–152. [Google Scholar] [CrossRef] [Green Version]
  18. Garcia-Guarin, J.; Alvarez, D.; Bretas, A.; Rivera, S. Schedule optimization in a smart microgrid considering demand response constraints. Energies 2020, 13, 17. [Google Scholar] [CrossRef]
  19. Chen, J.; Yang, B.; Guan, X. Optimal demand response scheduling with Stackelberg game approach under load uncertainty for smart grid. In Proceedings of the 2012 IEEE 3rd International Conference on Smart Grid Communications (SmartGridComm), Tainan, Taiwan, 5–8 November 2012; pp. 546–551. [Google Scholar]
  20. Parhizi, S.; Khodaei, A.; Shahidehpour, M. Market-based versus price-based microgrid optimal scheduling. IEEE Trans. Smart Grid 2018, 9, 615–623. [Google Scholar] [CrossRef] [Green Version]
  21. Deng, R.; Yang, Z.; Chen, J.; Chow, M.-Y. Load Scheduling with Price Uncertainty and Temporally-Coupled Constraints in Smart Grids. IEEE Trans. Power Syst. 2014, 29, 2823–2834. [Google Scholar] [CrossRef]
  22. Radhakrishnan, B.M.; Srinivasan, D.; Mehta, R. Fuzzy-Based Multi-Agent System for Distributed Energy Management in Smart Grids. Int. J. Uncertain. Fuzziness Knowl. Based Syst. 2016, 24, 781–803. [Google Scholar] [CrossRef]
  23. Khodaei, A.; Bahramirad, S.; Mohammad, S. Microgrid planning under uncertainty. IEEE Trans. 2015, 5, 2417–2425. [Google Scholar] [CrossRef]
  24. Bray, R.; Woodman, B.; Judson, E. Future Prospects for Local Energy Markets: Lessons from the Cornwall LEM; University of Exeter Energy Policy Group: Stocker, UK, 2020. [Google Scholar]
  25. Valencia-Zuluaga, T.; Agudelo-Martinez, D.; Arango-Angarita, D.; Acosta-Urrego, C.; Rivera, S.; Rodríguez-Medina, D.; Gers, J. A Fast Decomposition Method to Solve a Security-Constrained Optimal Power Flow (SCOPF) Problem through Constraint Handling. IEEE Access 2021, 9, 52812–52824. [Google Scholar] [CrossRef]
  26. Huang, S.; Dinavahi, V. Real-time contingency analysis on massively parallel architectures with compensation method. IEEE Access 2018, 6, 44519–44530. [Google Scholar] [CrossRef]
  27. Chai, J.S.; Zhu, N.; Bose, A.; Tylavsky, D.J. Parallel Newton type methods for power system stability analysis using local and shared memory multiprocessors. IEEE Trans. Power Syst. 1991, 6, 1539–1545. [Google Scholar] [CrossRef]
  28. Shu, J.; Xue, W.; Zheng, W. A parallel transient stability simulation for power systems. IEEE Trans. Power Syst. 2005, 20, 1709–1717. [Google Scholar] [CrossRef]
  29. Aristidou, P.; Fabozzi, D.; van Cutsem, T. Dynamic Simulation of Large-Scale Power Systems Using a Parallel Schur-Complement-Based Decomposition Method. IEEE Trans. Parallel Distrib. Syst. 2014, 25, 2561–2570. [Google Scholar] [CrossRef] [Green Version]
  30. Zhou, Z.; Dinavahi, V. Parallel Massive-Thread Electromagnetic Transient Simulation on GPU. IEEE Trans. Power Deliv. 2014, 29, 1045–1053. [Google Scholar] [CrossRef]
  31. Song, Y.; Chen, Y.; Yu, Z.; Huang, S.; Chen, L. A fine-grained parallel EMTP algorithm compatible to graphic processing units. In Proceedings of the 2014 IEEE PES General Meeting Conference Exposition, National Harbor, MD, USA, 27–31 July 2014; pp. 1–6. [Google Scholar]
  32. Huang, S.; Dinavahi, V. Fast Batched Solution for Real-Time Optimal Power Flow with Penetration of Renewable Energy. IEEE Access 2018, 6, 13898–13910. [Google Scholar] [CrossRef]
  33. Lezama, F.; Soares, J.; Faia, R.; Vale, Z. Hybrid-Adaptive Differential Evolution with Decay Function (HyDE-DF) Applied to the 100-Digit Challenge Competition on Single Objective Numerical Optimization. In Proceedings of the GECCO’19 the Genetic and Evolutionary Computation Conference Companion, Prague, Czech Republic, 13–17 July 2019; pp. 7–8. [Google Scholar]
  34. Lezama, F.; Soares, J.; Faia, R.; Pinto, T.; Vale, Z. A New Hybrid-Adaptive Differential Evolution for a Smart Grid Application Under Uncertainty. In Proceedings of the 2018 IEEE Congress on Evolutionary Computation (CEC), Rio de Janeiro, Brazil, 8–13 July 2018; pp. 1–8. [Google Scholar]
  35. Heidari, A.A.; Mirjalili, S.; Faris, H.; Aljarah, I.; Mafarja, M.; Chen, H. Harris hawks optimization: Algorithm and applications. Futur. Gener. Comput. Syst. 2019, 97, 849–872. [Google Scholar] [CrossRef]
  36. Miranda, V.; Alves, R. Differential Evolutionary Particle Swarm Optimization (DEEPSO): A successful hybrid. In Proceedings of the 2013 BRICS Congress on Computational Intelligence and 11th Brazilian Congress on Computational Intelligence, Ipojuca, Brazil, 8–11 September 2013; pp. 368–374. [Google Scholar]
  37. Nievergelt, J. Exhaustive Search, Combinatorial Optimization and Enumeration: Exploring the Potential of Raw Computing Power. In SOFSEM 2020: Theory and Practice of Computer Science; Hlaváč, V., Jeffery, K.G., Wiedermann, J., Eds.; Springer: Berlin/Heidelberg, Germany, 2000; Volumn 1963, pp. 18–35. [Google Scholar]
  38. IEEE-PES. ISS Data Sets. Available online: https://site.ieee.org/pes-iss/data-sets/ (accessed on 16 March 2020).
  39. Nadimi-Shahraki, M.H.; Taghian, S.; Mirjalili, S. An improved grey wolf optimizer for solving engineering problems. Expert Syst. Appl. 2021, 166, 113917. [Google Scholar] [CrossRef]
  40. Mirjalili, S.; Lewis, A. The Whale Optimization Algorithm. Adv. Eng. Softw. 2016, 95, 51–67. [Google Scholar] [CrossRef]
  41. Mirjalili, S.; Gandomi, A.H.; Mirjalili, S.Z.; Saremi, S.; Faris, H.; Mirjalili, S.M. Salp Swarm Algorithm: A bio-inspired optimizer for engineering design problems. Adv. Eng. Softw. 2017, 114, 163–191. [Google Scholar] [CrossRef]
  42. Saremi, S.; Mirjalili, S.; Lewis, A. Grasshopper Optimisation Algorithm: Theory and application. Adv. Eng. Softw. 2017, 105, 30–47. [Google Scholar] [CrossRef] [Green Version]
Figure 1. Local market and grid as a back-up.
Algorithms 14 00269 g001
Figure 2. Structure of fitness function.
Algorithms 14 00269 g002
Figure 3. Solution representation track 1.
Algorithms 14 00269 g003
Figure 4. Fitness evolution for some tested algorithm.
Algorithms 14 00269 g004
Table 1. Fixed and changeable decision variables for nine agents.
PeriodQuantityPriceTotal
A1A2A3A4A5A6A7A8A9A1A2A3A4A5A6A7A8A9
1 XXX XXX6
2 XXX XXX6
3 XXX XXX6
4 XXX XXX6
5 XXX XXX6
6 XXX XXX6
7 XXX XXX6
8 X XXX X XXX8
9 X XXXX X XXXX10
10 X XXXX X XXXX10
11 XXXXXX XXXXXX12
12 XXXXXX XXXXXX12
13 XXXXXX XXXXXX12
14 XXXXXX XXXXXX12
15 XXXXXX XXXXXX12
16 XXXXXX XXXXXX12
17 XXXXXX XXXXXX12
18 XXXXXX XXXXXX12
19 XX XXX XX XXX10
20 XXX XXX6
21 XXX XXX6
22 XXX XXX6
23 XXX XXX6
24 XXX XXX6
Total0001291024242400012910242424206
Table 2. Combinations, states, and expected simulation time with two states.
PeriodsVariables per PeriodStates per PeriodCombinations per PeriodTime per Period (s)
1–762640.1152
8822560.4608
9–1010210241.8432
11–1812240967.3728
1910210241.8432
20-2462640.1152
Total in 24 Periods2064836,86466.3552
Table 3. Combinations, states, and expected simulation time with different number of states.
PeriodsVariables per PeriodStates per PeriodCombinations per PeriodTime per Period (s)
1–76101,000,0001800
88816,777,21630,198.98
9–1010660,466,176108,839.1
11–1812416,777,21630,198.98
1910660,466,176108,839.1
20–246101,000,0001800
Total in 24 Periods206178344,393,472619,908.25
Table 4. Metaheuristic algorithm results over 20 runs.
AlgorithmAverage FitnessFitness VarianceMinimum Fitness d o p t
HHO–DEEPSO–HyDE-DF1.61920.000891.56300.10
WOA–HyDE-DF1.71360.00401.59220.94
HyDE-DF [33]1.91490.004841.80870.51
I-GWO–HyDE-DF1.94090.011411.73430.74
CE_CMAES2.22232.88191.60730.86
I-GWO [39]2.36140.159981.84230.66
CBBOCauchyDEEPSO2.87360.036232.38930.77
HHO [35]2.95030.023312.69910.74
WOA [40]3.18590.087212.21330.77
SSA [41]3.435817.5022.22310.96
GOA [42]49.724246.0523.6281.00
Table 5. Some tuning combinations (HyDE-DF iterations necessary to complete 10,000 fitness function evaluations).
PhaseAverage Fitness
HHODEEPSOHyDE-DF
IterationsIndividualsIterationsIndividualsIndividuals
7360351.6192
5360351.6219
515701151.7339
711507101.8373
715503102.0692
715603102.1056
Table 6. Bid or offer quantity by agent.
Hours
A123456789101112131415161718192021222324
10.1990.1180.5310.1050.0390.0450.0800.0040.1330.1160.1750.1320.1800.1640.1910.1560.1650.1230.1570.2940.4160.3180.2160.259
20.8682.0711.7630.0820.0610.0820.0720.9722.2051.3440.0610.0680.0670.0650.1040.0700.0530.1780.1870.6680.3780.3931.5450.238
30.1610.0820.0820.0800.0880.0830.0680.1310.1800.1990.1060.0650.1100.1900.1910.2870.3090.2270.2480.2160.2560.2100.2360.263
40.2320.1000.5220.0920.0380.0440.064−0.0520.000−0.224−0.203−0.285−0.467−0.539−0.1700.000−0.163−0.244−0.0650.1700.3820.3250.1900.314
50.7762.8751.9340.0580.0520.0950.0500.7662.0900.917−0.496−0.442−0.381−0.457−0.2780.000−0.242−0.203−0.0590.4350.2980.2801.4510.260
60.1910.0890.1010.0850.0890.0710.0720.088−0.002−0.113−0.402−0.405−0.278−0.232−0.532−0.236−0.287−0.1080.0200.1200.2510.2360.2180.291
7−0.873−1.958−1.9770.000−0.001−0.028−0.465−1.227−1.681−1.185−0.018−0.458−0.0110.0000.000−0.165−0.5460.000−0.492−0.809−0.242−0.763−0.384−1.756
8−1.737−1.875−1.680−0.564−0.064−0.0070.000−1.924−1.919−0.534−0.2780.000−1.4150.000−0.642−1.213−0.473−0.156−0.789−1.113−1.894−1.790−1.958−1.820
9−1.237−1.658−1.648−0.1880.000−0.4100.000−0.123−1.447−1.459−0.349−1.784−0.332−0.780−0.264−0.166−0.035−0.006−0.276−1.992−0.178−0.932−1.9650.000
Table 7. Prices for each agent.
Hours
A123456789101112131415161718192021222324
10.1990.1970.1950.1940.1940.1950.1970.1980.2000.2000.2000.2000.2000.2010.2000.1990.1980.1980.1980.1980.1990.2010.2010.199
20.1990.1970.1950.1940.1940.1950.1970.1980.2000.2000.2000.2000.2000.2010.2000.1990.1980.1980.1980.1980.1990.2010.2010.199
30.1990.1970.1950.1940.1940.1950.1970.1980.2000.2000.2000.2000.2000.2010.2000.1990.1980.1980.1980.1980.1990.2010.2010.199
40.1990.1970.1950.1940.1940.1950.1970.0950.1500.0990.1190.1730.1100.1280.1000.1940.1730.1020.1470.1980.1990.2010.2010.199
50.1990.1970.1950.1940.1940.1950.1970.1980.2000.2000.1480.1120.1020.0990.1350.1840.0970.1170.1590.1980.1990.2010.2010.199
60.1990.1970.1950.1940.1940.1950.1970.1980.1230.1200.0950.1050.1370.1760.1260.1890.0970.1120.1980.1980.1990.2010.2010.199
70.0980.0970.1080.1230.1370.1840.1600.1000.0950.0950.1840.1220.1460.1850.1370.1660.1380.1460.1580.1270.1430.1240.0970.095
80.1080.1010.0990.1610.1190.1370.1200.0990.0990.1270.1470.1040.1100.1350.1310.1460.1670.1020.1340.1270.0950.1040.0960.122
90.1220.1000.0970.1230.1570.1280.1120.1450.0970.0950.1290.1470.1140.1270.1350.1050.1620.1850.1530.0950.1100.1120.0990.165
Publisher’s Note: MDPI stays neutral with regard to jurisdictional claims in published maps and institutional affiliations.