
The Buy-Online-Pick-Up-in-Store Retailing Model: Optimization Strategies for In-Store Picking and Packing

 , , and
Abstract
:1. Introduction
2. Literature Review
3. The Picking Problem
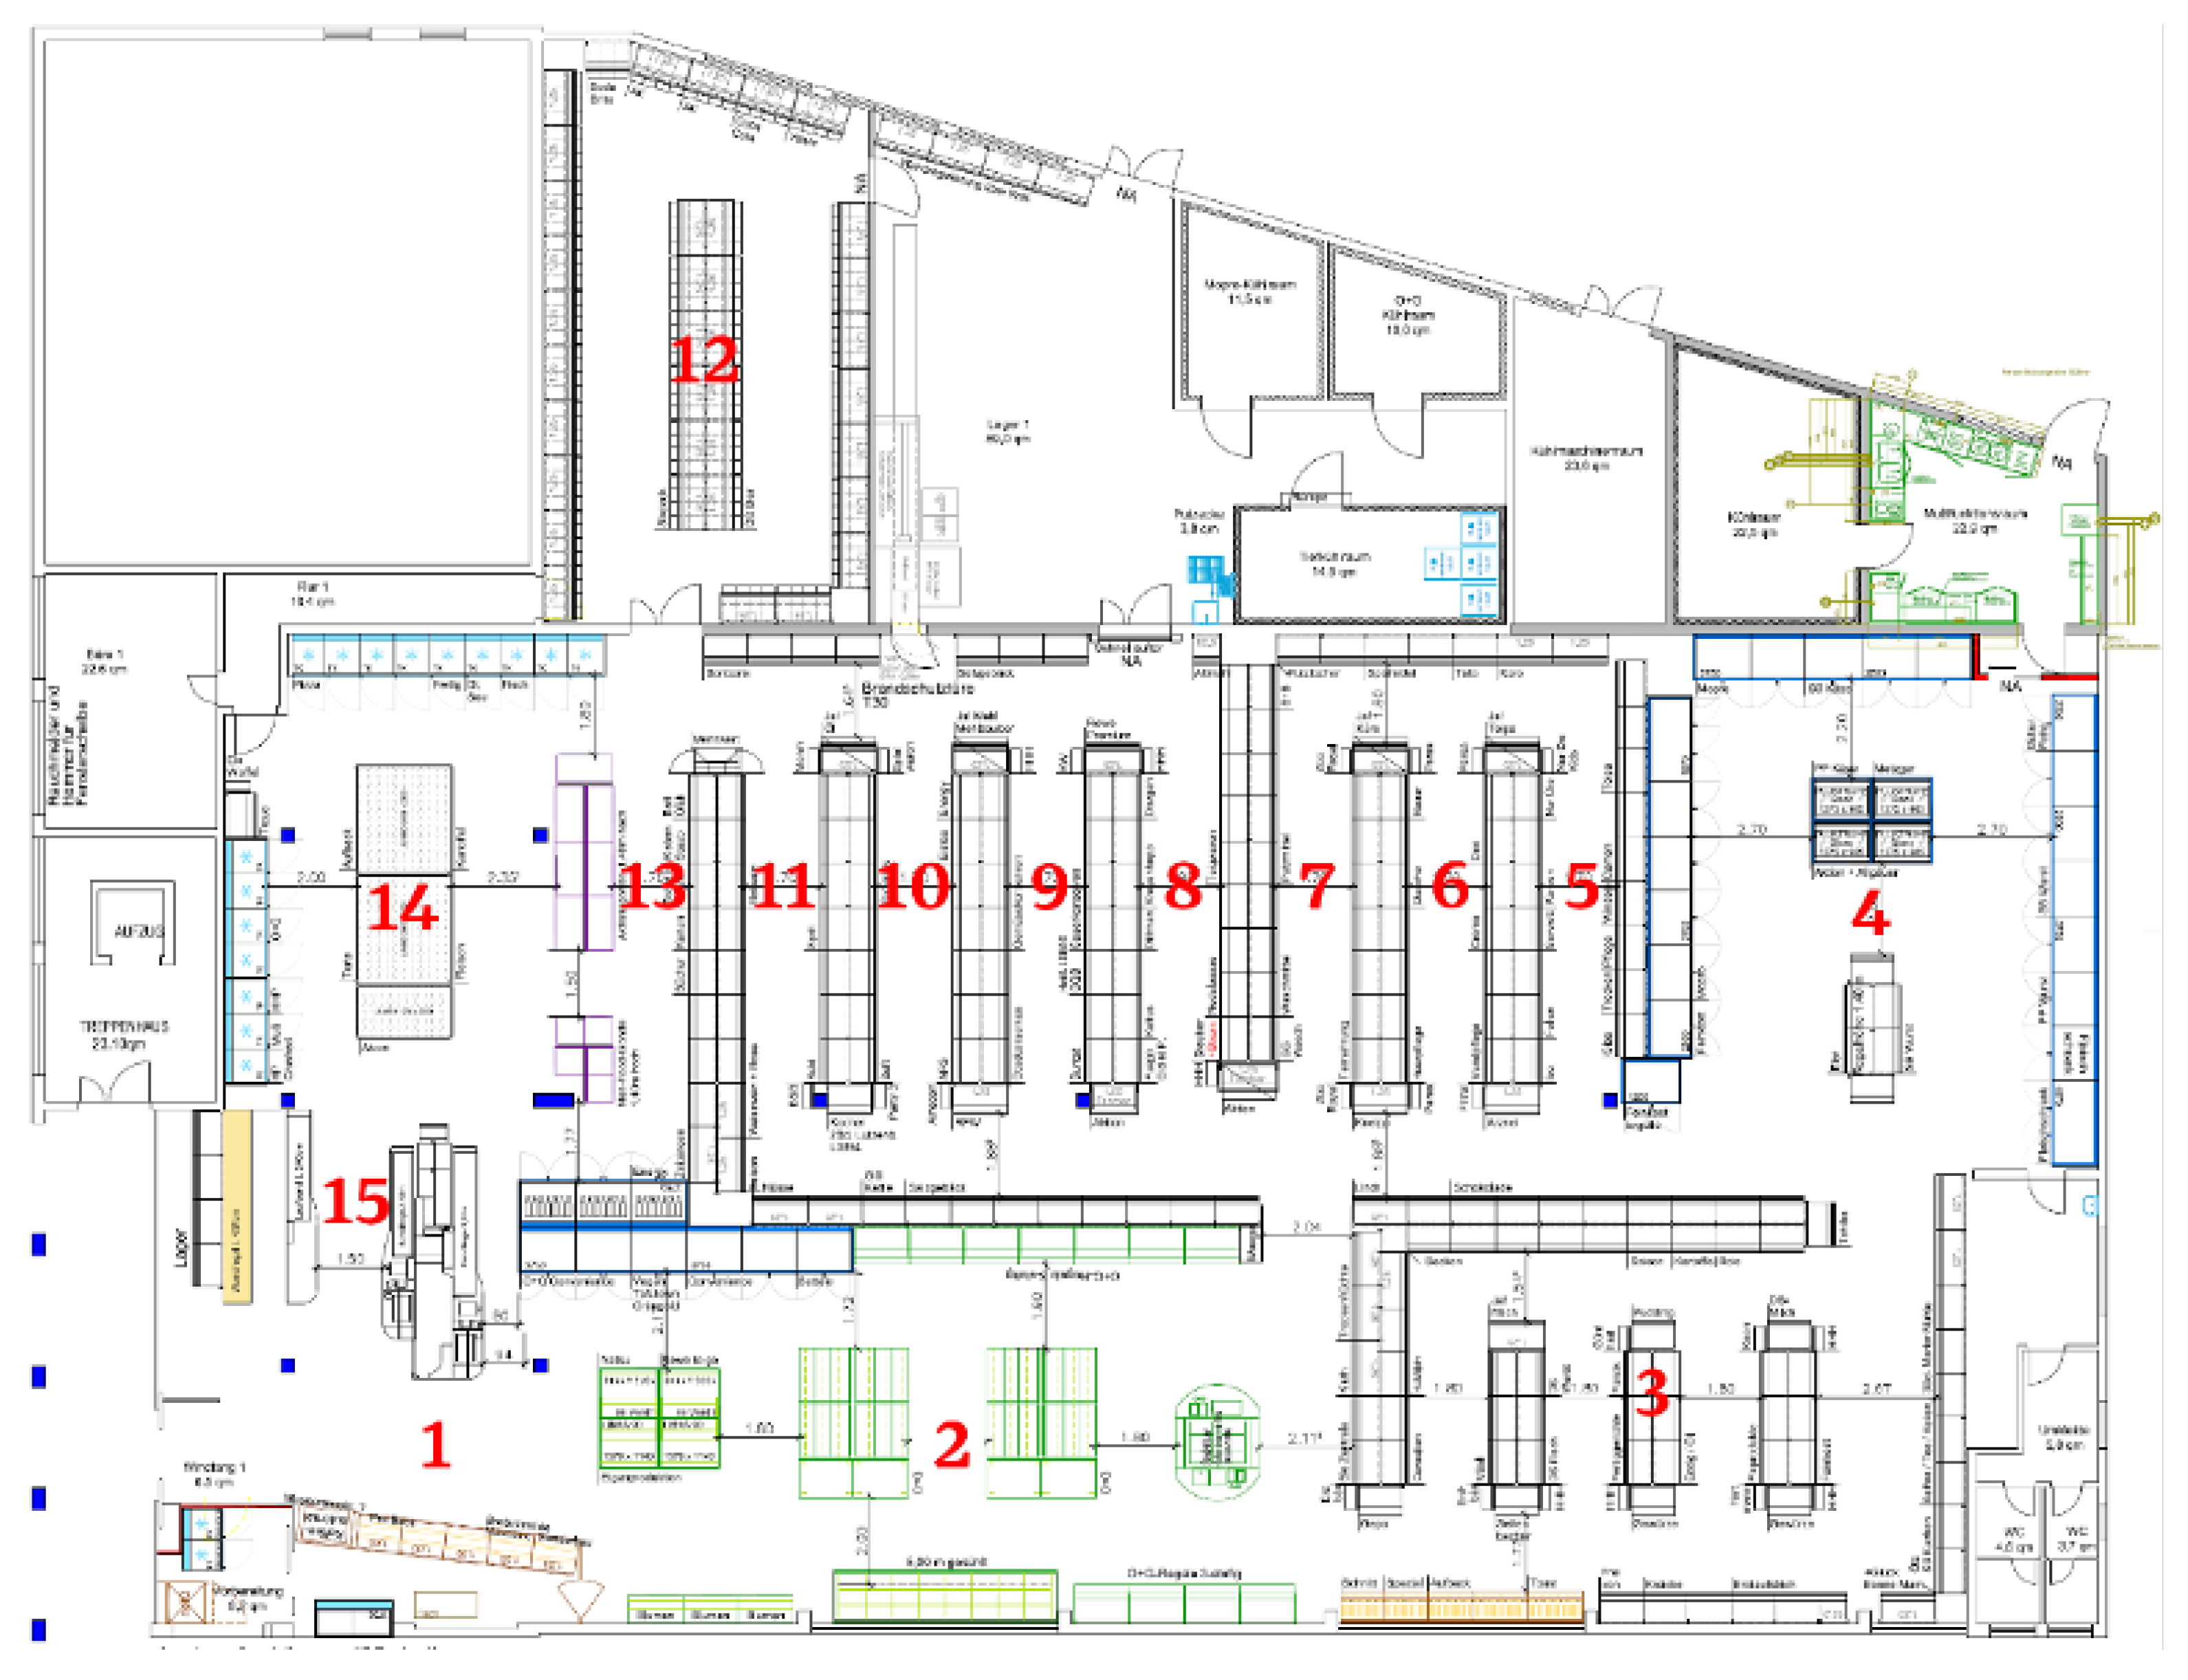
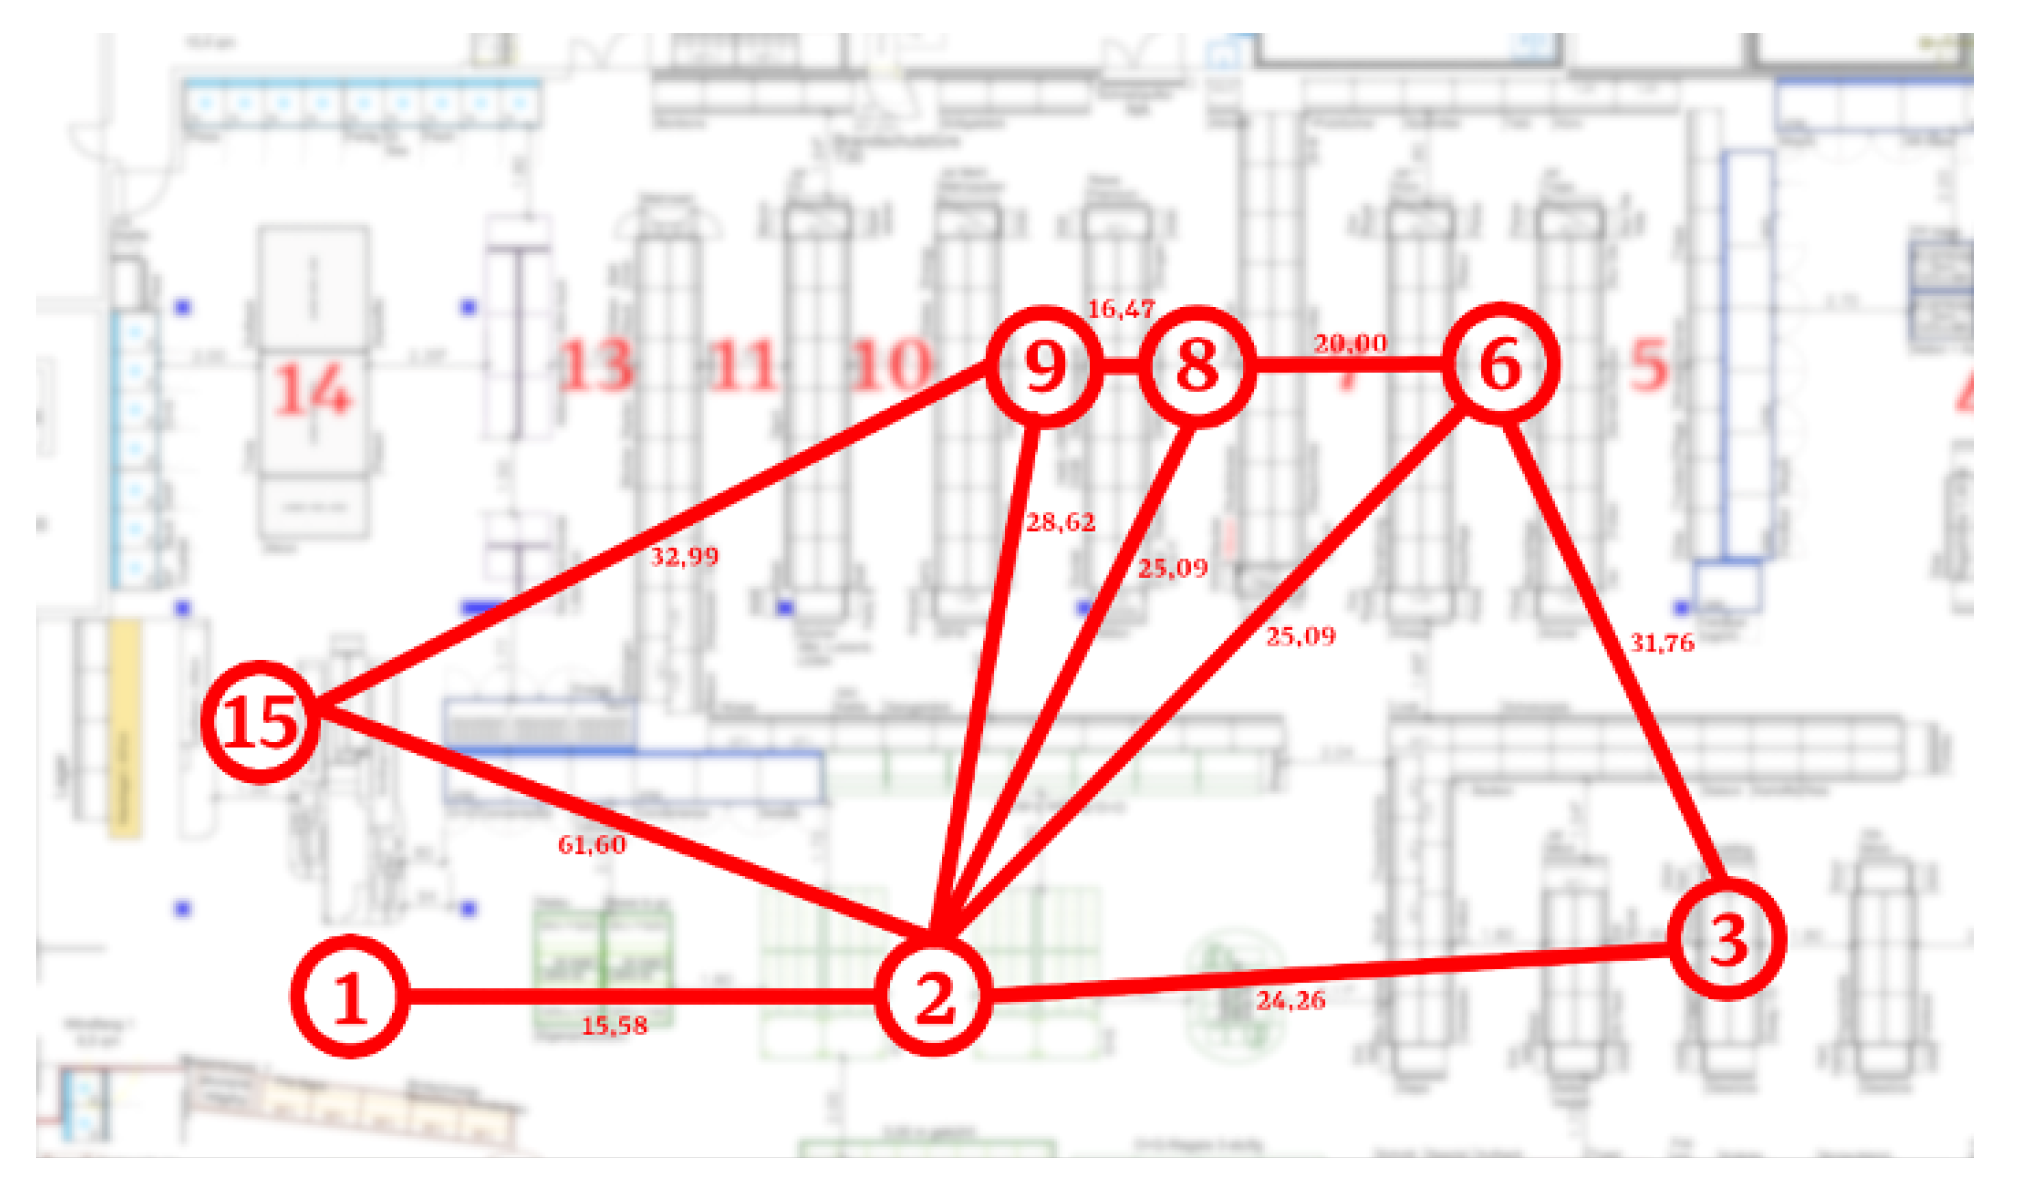
3.1. Problem Statement
3.2. The Open Traveling Salesman Problem
3.3. The Sequential Ordering Problem
3.4. The Relaxed SOP
4. The Packing Problem
5. Combined Picking and Packing
- TSP solution in which products are scanned and packed at the cashier (this will be referred to as TSP + cashier);
- SOP solution in which products are scanned and packed at the cashier (this will be referred to as SOP + cashier);
- SOP solution in which products are scanned and packed during the picking operation by using a scan-as-you-pick device (this will be referred to as pick-scan-pack model for SOP);
- Relaxed SOP solution in which products are scanned and packed at the cashier (this will be referred to as Relaxed SOP + cashier);
- Relaxed SOP solution in which products are scanned and packed during the picking operation by using a scan-as-you-pick device (this will be referred to as pick-scan-pack model for Relaxed SOP).
6. Experimental Simulations
6.1. Picking
6.1.1. No Optimization
6.1.2. The TSP Solution
6.1.3. The SOP Solution
6.1.4. The Relaxed SOP Solution
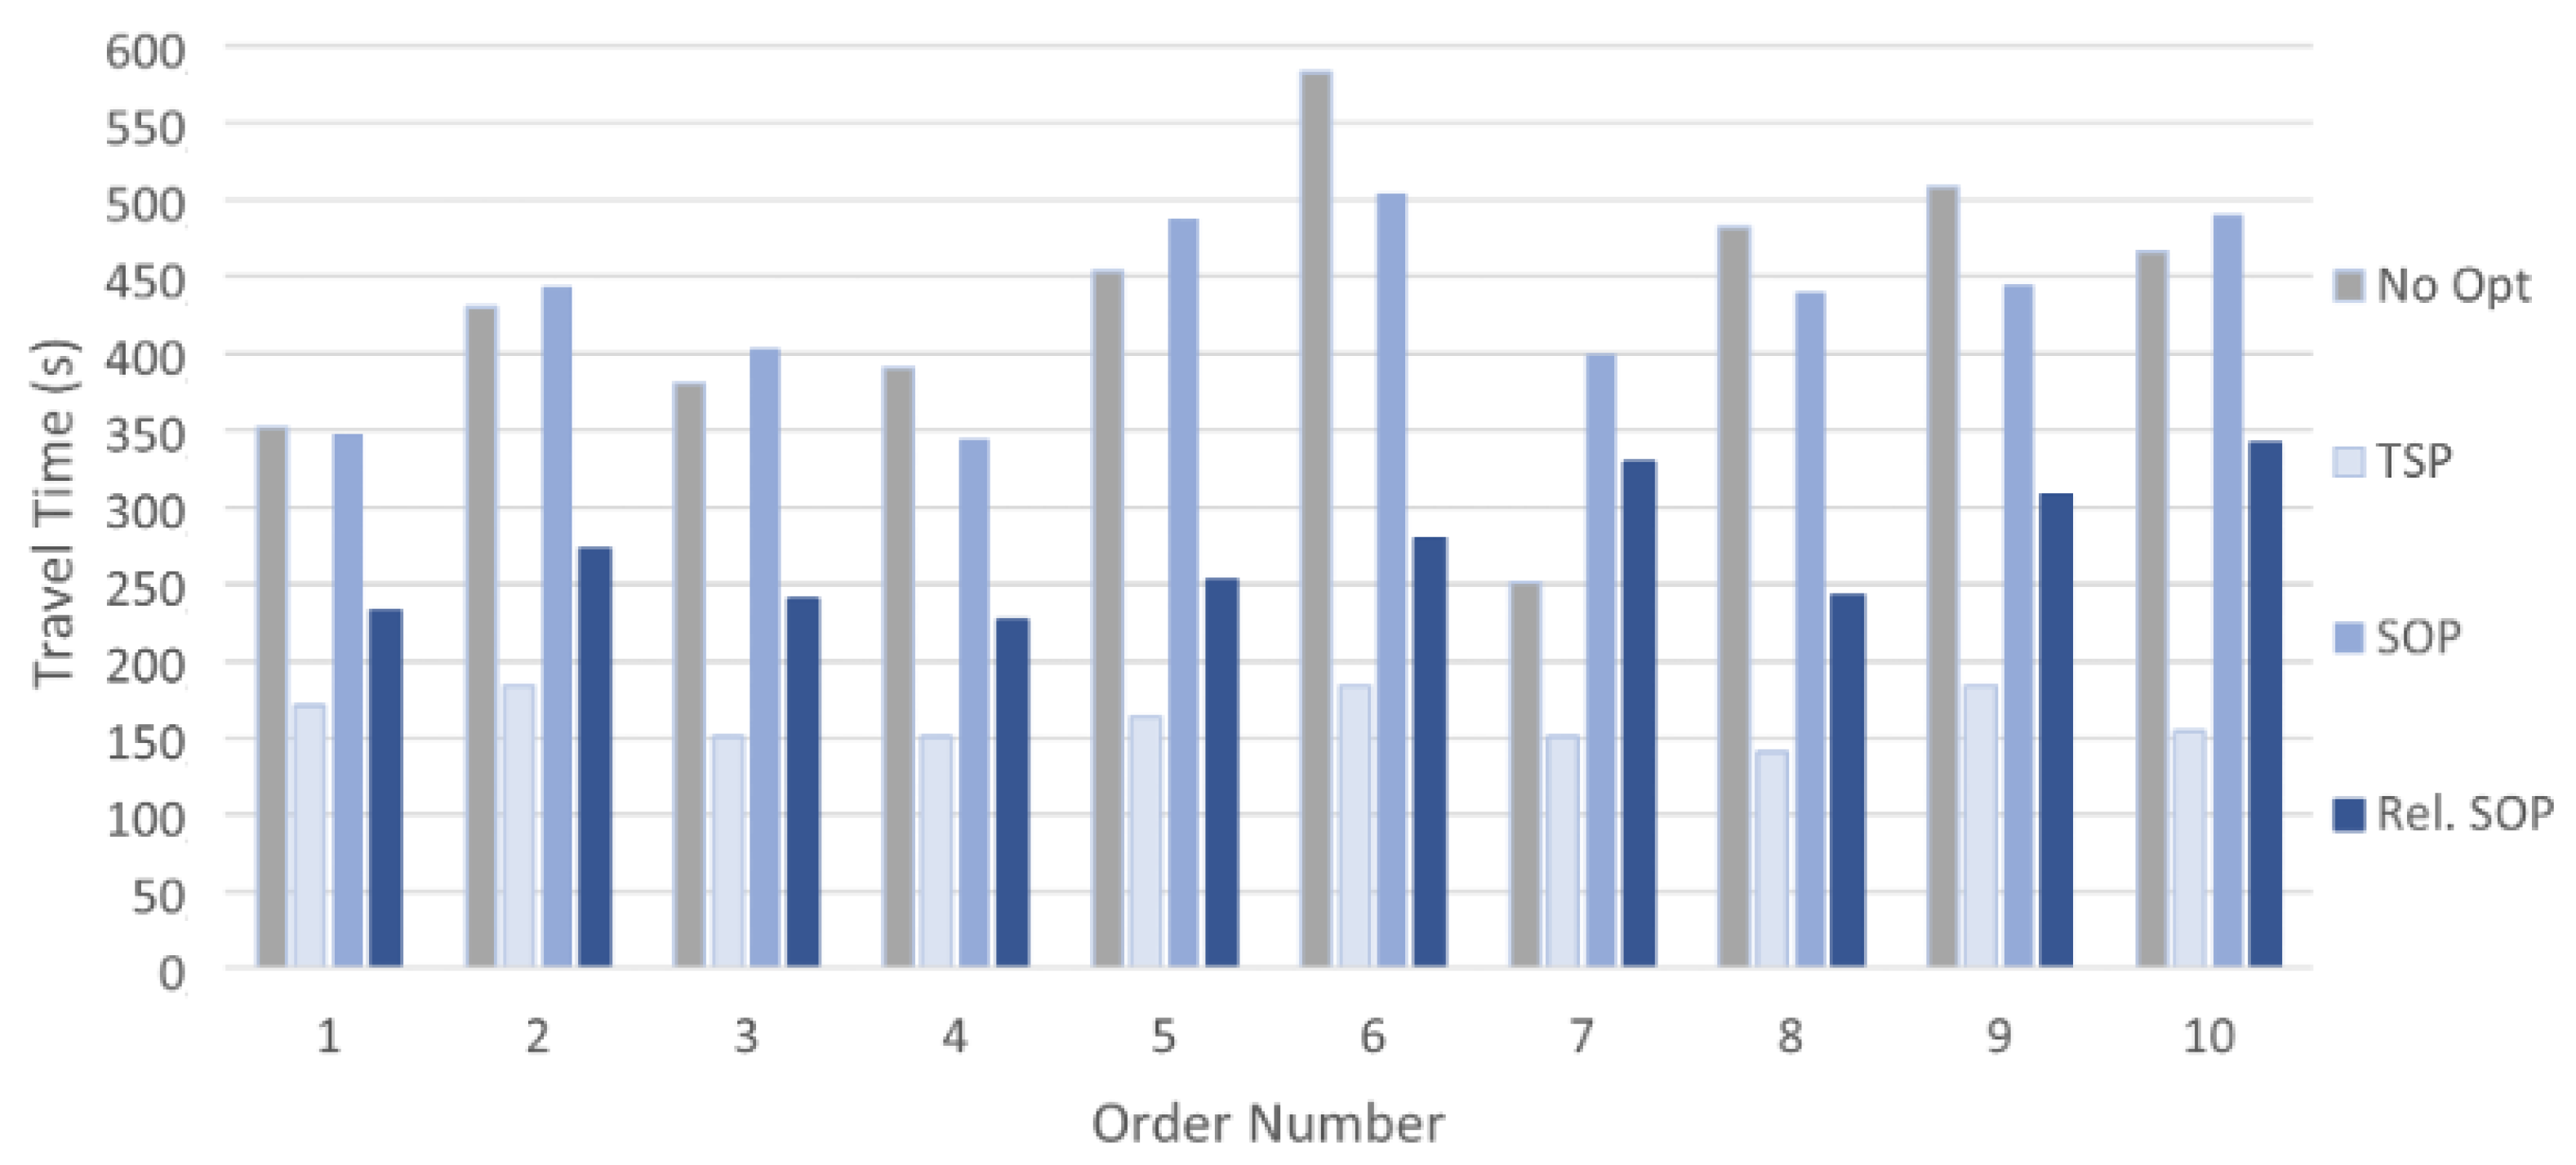
6.1.5. Time Performance Analysis
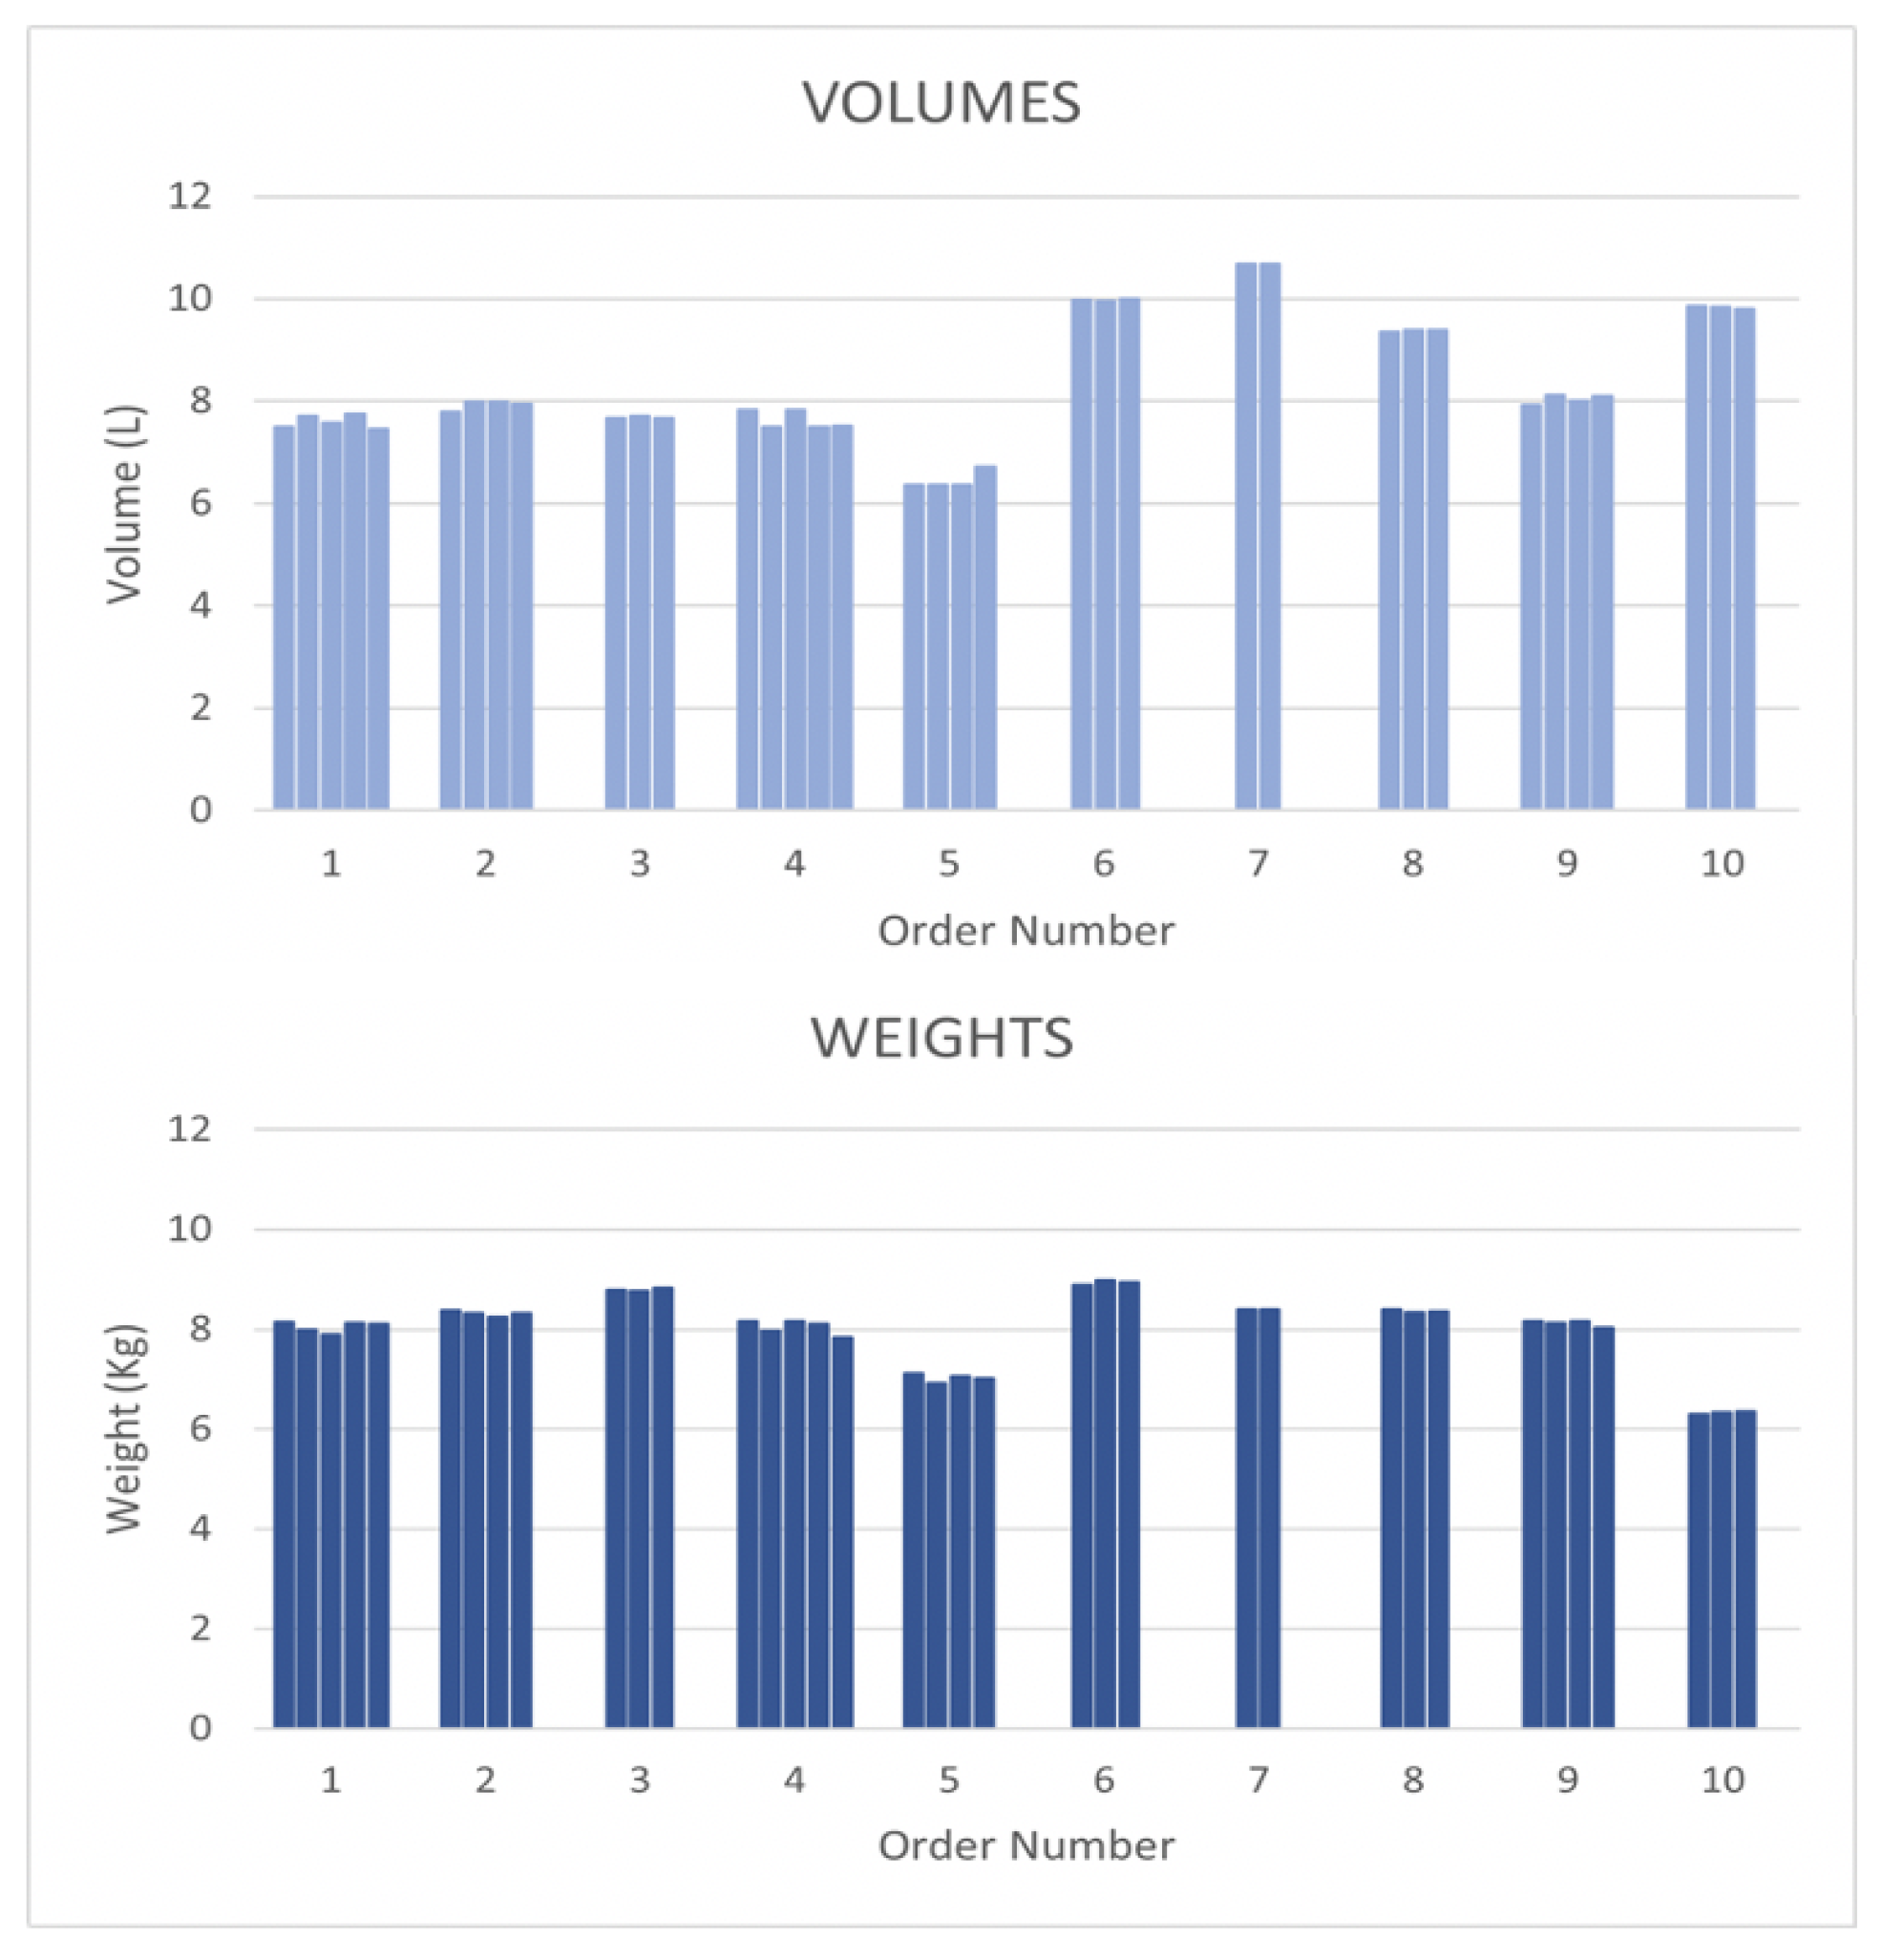
6.2. Packing
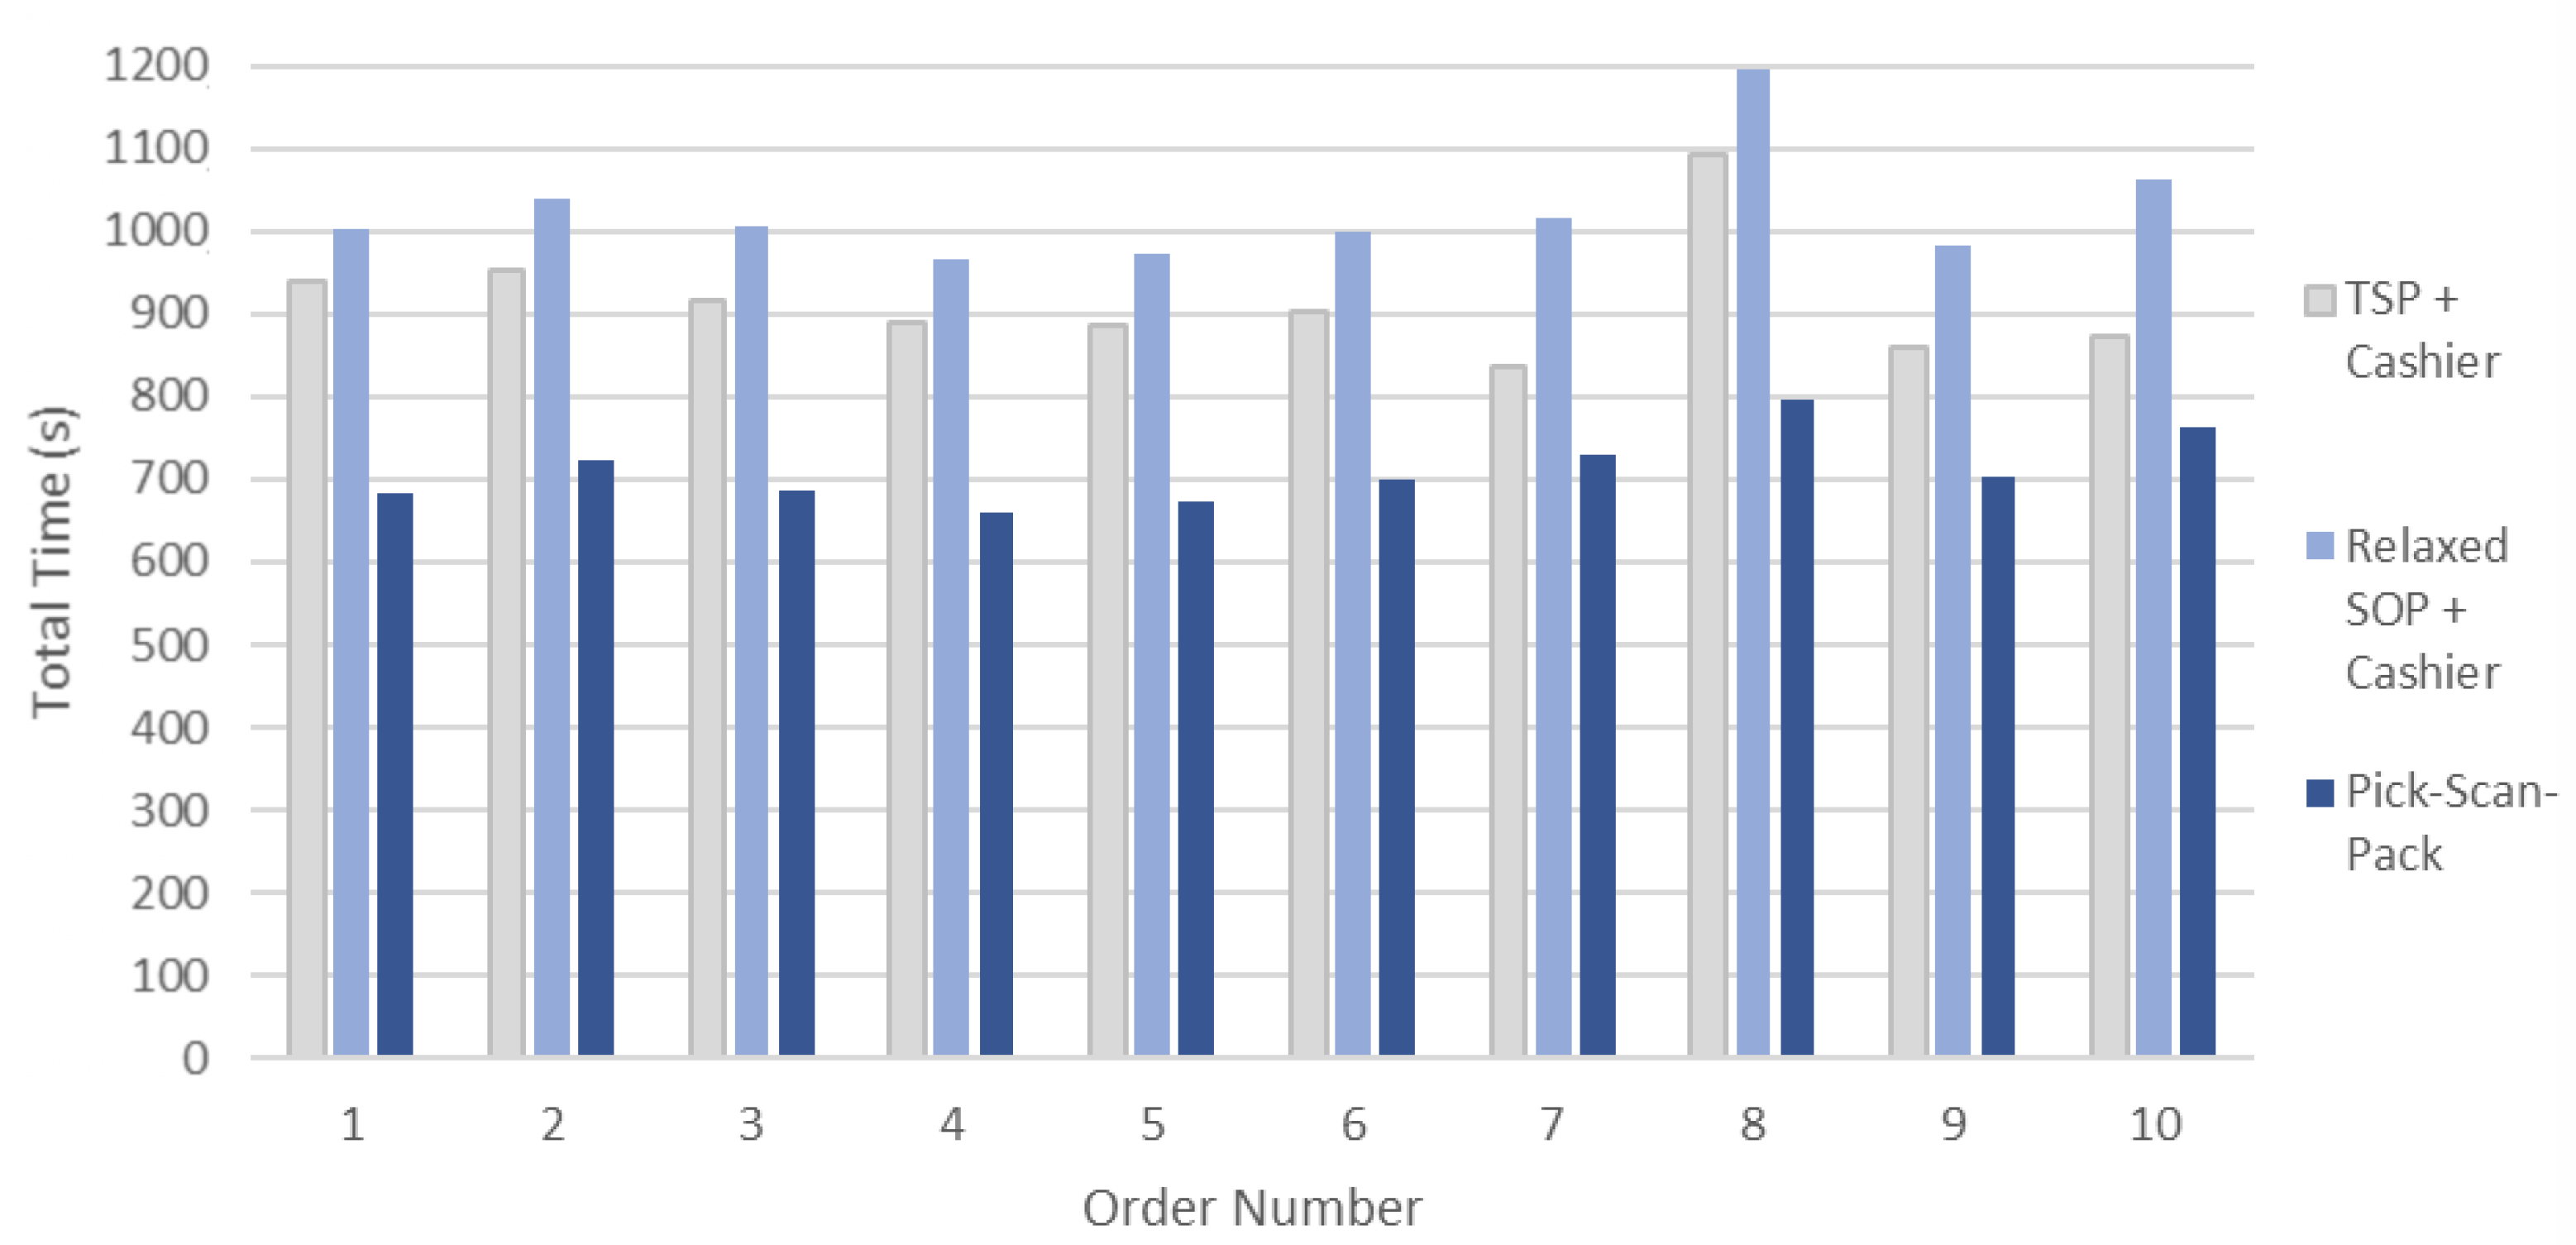
6.3. Picking and Packing
- TSP + cashier;
- Relaxed SOP + cashier; and
- pick-scan-pack model for Relaxed SOP.
- Prevents product damaging without excessively increasing picking time.
- Allows the integration of picking and packing operations.
7. Conclusions
Author Contributions
Funding
Data Availability Statement
Conflicts of Interest
References
- Hübner, A.; Wollenburg, J.; Holzapfel, A. Retail logistics in the transition from multi-channel to omni-channel. Int. J. Phys. Distrib. Logist. Manag. 2016, 46, 562–583. [Google Scholar] [CrossRef]
- Bell, D.R.; Gallino, S.; Moreno, A. How to win in an omni-channel world. MIT Sloan Manag. Rev. 2014, 56, 45–55. [Google Scholar]
- Rigby, D. The future of shopping. Harv. Bus. Rev. 2011, 89, 65–76. [Google Scholar]
- Wollenburg, J.; Hübner, A.; Kuhn, H.; Trautrims, A. From bricks-and-mortar to bricks-and-clicks: Logistics networks in omni-channel grocery retailing. Int. J. Phys. Distrib. Logist. Manag. 2018, 48, 415–438. [Google Scholar] [CrossRef]
- Jin, M.; Li, G.; Cheng, T.C.E. Buy online and pick up in-store: Design of the service area. Eur. J. Oper. Res. 2018, 268, 613–623. [Google Scholar] [CrossRef]
- Kong, R.; Luo, L.; Chen, L.; Keblis, M.F. The effects of BOPS implementation under different pricing strategies in omnichannel retailing. Transp. Res. Part E Logist. Transp. Rev. 2020, 141, 102014. [Google Scholar] [CrossRef]
- Fan, C.; Liu, Y.; Yang, X.; Chen, X.; Hu, J. Online and offline cooperation under buy-online, pick-up-in-store: Pricing and inventory decisions. J. Ind. Manag. Optim. 2019, 15, 1455–1472. [Google Scholar] [CrossRef]
- Saha, K.; Bhattacharya, S. ‘Buy online and pick up in-store’: Implications for the store inventory. Eur. J. Oper. Res. 2020, 294, 906–921. [Google Scholar] [CrossRef]
- Lin, X.; Zhou, Y.; Hou, R. Impact of a “Buy-online-and-pickup-in-store” Channel on Price and Quality Decisions in a Supply Chain. Eur. J. Oper. Res. 2021, 294, 922–935. [Google Scholar] [CrossRef]
- Lu, J.; Yang, Y.; Han, S.; Tsao, Y.; Xin, Y. Coordinated inventory policies for meeting demands from both store and online BOPS channels. Comput. Ind. Eng. 2020, 145, 106542. [Google Scholar] [CrossRef]
- Shi, X.; Dong, C.; Cheng, T.C.E. Does the buy-online-and-pick-up-in-store strategy with pre-orders benefit a retailer with the consideration of returns? Int. J. Prod. Econ. 2018, 206, 134–145. [Google Scholar] [CrossRef]
- Kim, E.; Park, M.; Lee, J. Determinants of the intention to use Buy-Online, Pickup In-Store (BOPS): The moderating effects of situational factors and product type. Telemat. Inform. 2017, 34, 1721–1735. [Google Scholar] [CrossRef]
- Difrancesco, R.M.; van Schilt, I.M.; Winkenbach, M. Optimal in-store fulfillment policies for online orders in an omni-channel retail environment. Eur. J. Oper. Res. 2021, 293, 1058–1076. [Google Scholar] [CrossRef]
- MacCarthy, B.L.; Zhang, L.; Muyldermans, L. Best Performance Frontiers for Buy-Online-Pickup-in-Store order fulfilment. Int. J. Prod. Econ. 2019, 211, 251–264. [Google Scholar] [CrossRef]
- Masae, M.; Glock, C.H.; Grosse, E.H. Order picker routing in warehouses: A systematic literature review. Int. J. Prod. Econ. 2020, 224, 107564. [Google Scholar] [CrossRef]
- Filipe, S.; Marques, S.H.; Salgueiro, M.F. Customers’ relationship with their grocery store: Direct and moderating effects from store format and loyalty programs. J. Retail. Consum. Serv. 2017, 37, 78–88. [Google Scholar] [CrossRef] [Green Version]
- Hui, S.K.; Fader, P.S.; Bradlow, E.T. The Traveling Salesman Goes Shopping: The Systematic Deviations of Grocery Paths from TSP-Optimality. Mark. Sci. 2009, 28, 566–572. [Google Scholar] [CrossRef]
- Chou, X.; Loske, D.; Klumpp, M.; Gambardella, L.M.; Montemanni, R. In-Store Picking Strategies for Online Orders in Grocery Retail Logistics. In Proceedings of the International Conference on Optimization and Decision Science (ODS), Rome, Italy, 14–17 September 2021. [Google Scholar]
- Chou, X.; Ognibene Pietri, N.; Loske, D.; Klumpp, M.; Montemanni, R. Optimization Strategies for In-Store Order Picking in Omnichannel Retailing. In Advances in Production Management Systems. Artificial Intelligence for Sustainable and Resilient Production Systems. APMS 2021. IFIP Advances in Information and Communication Technology; Dolgui, A., Bernard, A., Lemoine, D., von Cieminski, G., Romero, D., Eds.; Springer: Cham, Switzerlands, 2021; Volume 631, pp. 603–611. [Google Scholar] [CrossRef]
- Montemanni, R.; Smith, D.H.; Rizzoli, A.E.; Gambardella, L.M. A Sequential ordering problems for crane scheduling in port terminals. Int. J. Simul. Process. Model. 2009, 5, 348–361. [Google Scholar] [CrossRef]
- Martello, S.; Toth, P. Knapsack Problems: Algorithms and Computer Implementations; John Wiley & Sons, Inc.: New York, NY, USA, 1990. [Google Scholar]
- Erbayrak, S.; Özkır, V.; Yıldırım, U.M. Multi-objective 3D bin packing problem with load balance and product family concerns. Comput. Ind. Eng. 2021, 159, 107518. [Google Scholar] [CrossRef]
- Velednitsky, M. Short combinatorial proof that the DFJ polytope is contained in the MTZ polytope for the Asymmetric Traveling Salesman Problem. Oper. Res. Lett. 2017, 45, 323–324. [Google Scholar] [CrossRef] [Green Version]
- Bektaş, T.; Gouveia, L. Requiem for the Miller–Tucker–Zemlin subtour elimination constraints? Eur. J. Oper. Res. 2014, 236, 820–832. [Google Scholar] [CrossRef]
- Dantzig, G.; Fulkerson, R.; Johnson, S. Solution of a Large-Scale Traveling-Salesman Problem. J. Oper. Res. Soc. Am. 1954, 2, 393–410. [Google Scholar] [CrossRef] [Green Version]
- Gambardella, L.M.; Montemanni, R.; Weyland, D. An enhanced ant colony system for the sequential ordering problem. Oper. Res. Proc. 2011, 355–360. [Google Scholar]
- Jamal, J.; Shobaki, G.; Papapanagiotou, V.; Gambardella, L.M.; Montemanni, R. Solving the sequential ordering problem using branch and bound. In Proceedings of the IEEE Symposium Series on Computational Intelligence (SSCI), Honolulu, HI, USA, 27 November–1 December 2017; pp. 1–9. [Google Scholar]
- Papapanagiotou, V.; Jamal, J.; Montemanni, R.; Shobaki, G.; Gambardella, L.M. A comparison of two exact algorithms for the sequential ordering problem. In Proceedings of the IEEE Conference on Systems, Process and Control (ICSPC), Kuala Lumpur, Malaysia, 18–20 December 2015; pp. 73–78. [Google Scholar]
- Ognibene Pietri, N.; Chou, X.; Jamel, J.; Loske, D.; Klumpp, M.; Montemanni, R. The Picking and Packing Problem in Buy-Online-Pick-up-in-Store Retailing. In Proceedings of the Operations Research Conference (OR) 2021, Bern, Germany, 31 August–3 September 2021. submitted for publication. [Google Scholar]
- Maschler, M.; Solan, E.; Zamir, S. Game Theory; Cambridge University Press: Cambridge, UK, 2013; pp. 176–180. [Google Scholar]
- Liebmann, H.; Zentes, J. Handelsmanagement; Vahlen: Munich, Germany, 2001. [Google Scholar]
- Bernard, S. Cashiers’ work time: Between a productivity mentality and a service mentality. Sociol. Trav. 2007, 49, e129–e144. [Google Scholar] [CrossRef]


| 1 | 2 | 3 | 4 | 5 | 6 | 7 | 8 | 9 | 10 | 11 | 12 | 13 | 14 | 15 | |
|---|---|---|---|---|---|---|---|---|---|---|---|---|---|---|---|
| 1 | 15.58 | 39.84 | 49.84 | 44.20 | 40.67 | 37.14 | 40.67 | 44.20 | 47.73 | 51.26 | 70.33 | 65.96 | 74.83 | 77.18 | |
| 2 | 15.58 | 24.26 | 34.26 | 28.62 | 25.09 | 21.56 | 25.09 | 28.62 | 32.15 | 35.68 | 54.75 | 50.39 | 59.25 | 61.60 | |
| 3 | 39.84 | 24.26 | 24.06 | 29.07 | 31.76 | 28.24 | 31.76 | 35.29 | 38.82 | 42.35 | 61.42 | 57.06 | 65.92 | 68.28 | |
| 4 | 49.84 | 34.26 | 24.06 | 21.91 | 25.44 | 28.97 | 32.50 | 36.02 | 39.55 | 43.08 | 62.15 | 57.79 | 66.65 | 69.01 | |
| 5 | 44.20 | 28.62 | 29.07 | 21.91 | 16.47 | 20.00 | 23.53 | 27.06 | 30.59 | 34.12 | 53.18 | 48.82 | 57.69 | 60.04 | |
| 6 | 40.67 | 25.09 | 31.76 | 25.44 | 16.47 | 16.47 | 20.00 | 23.53 | 27.06 | 30.59 | 49.66 | 45.29 | 54.16 | 56.51 | |
| 7 | 37.14 | 21.56 | 28.24 | 28.97 | 20.00 | 16.47 | 16.47 | 20.00 | 23.53 | 27.06 | 46.13 | 41.76 | 50.63 | 52.98 | |
| 8 | 40.67 | 25.09 | 31.76 | 32.50 | 23.53 | 20.00 | 16.47 | 16.47 | 20.00 | 23.53 | 29.66 | 25.29 | 34.16 | 36.52 | |
| 9 | 44.20 | 28.62 | 35.29 | 36.02 | 27.06 | 23.53 | 20.00 | 16.47 | 16.47 | 20.00 | 26.13 | 21.76 | 30.64 | 32.99 | |
| 10 | 47.73 | 32.15 | 38.82 | 39.55 | 30.59 | 27.06 | 23.53 | 20.00 | 16.47 | 16.47 | 22.60 | 18.24 | 27.11 | 29.46 | |
| 11 | 51.26 | 35.68 | 42.35 | 43.08 | 34.12 | 30.59 | 27.06 | 23.53 | 20.00 | 16.47 | 19.07 | 14.71 | 23.57 | 25.92 | |
| 12 | 70.33 | 54.75 | 61.42 | 62.15 | 53.18 | 49.66 | 46.13 | 29.66 | 26.13 | 22.60 | 19.07 | 13.77 | 22.64 | 29.69 | |
| 13 | 65.96 | 50.39 | 57.06 | 57.79 | 48.82 | 45.29 | 41.76 | 25.29 | 21.76 | 18.24 | 14.71 | 13.77 | 17.59 | 14.26 | |
| 14 | 74.83 | 59.25 | 65.92 | 66.65 | 57.69 | 54.16 | 50.63 | 34.16 | 30.64 | 27.11 | 23.57 | 22.64 | 17.59 | 7.20 | |
| 15 | 77.18 | 61.60 | 68.28 | 69.01 | 60.04 | 56.51 | 52.98 | 36.52 | 32.99 | 29.46 | 25.92 | 29.69 | 14.26 | 7.20 |
| Order 1 | Order 2 | Order 3 | Order 4 | Order 5 | |||||
|---|---|---|---|---|---|---|---|---|---|
| Zone | Zone | Zone | Zone | Zone | |||||
| / | 1 | / | 1 | / | 1 | / | 1 | / | 1 |
| 51.26 | 11 | 51.26 | 11 | 51.26 | 11 | 51.26 | 11 | 51.26 | 11 |
| 25.92 | 12 | 25.92 | 12 | 22.04 | 12 | 25.92 | 12 | 25.92 | 12 |
| 29.46 | 10 | 29.46 | 10 | 29.46 | 10 | 29.46 | 10 | 29.46 | 10 |
| 29.46 | 12 | 16.47 | 11 | 16.47 | 11 | 29.46 | 12 | 16.47 | 11 |
| 29.46 | 10 | 16.47 | 10 | 16.47 | 10 | 29.46 | 10 | 16.47 | 10 |
| 29.46 | 12 | 16.47 | 11 | 29.46 | 12 | 29.46 | 12 | 16.47 | 11 |
| 29.46 | 10 | 16.47 | 10 | 29.46 | 10 | 29.46 | 10 | 25.92 | 12 |
| 27.06 | 6 | 29.46 | 12 | 29.46 | 12 | 29.46 | 12 | 29.46 | 10 |
| 31.76 | 3 | 29.46 | 10 | 29.46 | 10 | 29.46 | 10 | 29.46 | 12 |
| 68.28 | 15 | 29.46 | 12 | 16.47 | 11 | 38.82 | 3 | 29.46 | 10 |
| 29.46 | 10 | 42.35 | 3 | 68.28 | 15 | 16.47 | 11 | ||
| 27.06 | 6 | 68.28 | 15 | 42.35 | 3 | ||||
| 31.76 | 3 | 28.24 | 7 | ||||||
| 28.24 | 7 | 28.24 | 3 | ||||||
| 52.98 | 15 | 68.28 | 15 | ||||||
| 351.58 s | 430.40 s | 380.63 s | 390.50 s | 453.92 s | |||||
| Order 6 | Order 7 | Order 8 | Order 9 | Order 10 | |||||
| Zone | Zone | Zone | Zone | Zone | |||||
| / | 1 | / | 1 | / | 1 | / | 1 | / | 1 |
| 51.26 | 11 | 51.26 | 11 | 15.58 | 2 | 51.26 | 11 | 44.20 | 9 |
| 25.92 | 12 | 16.47 | 10 | 28.62 | 9 | 22.04 | 12 | 16.47 | 8 |
| 25.92 | 11 | 29.46 | 12 | 16.47 | 8 | 29.46 | 10 | 25.09 | 2 |
| 25.92 | 12 | 25.92 | 11 | 16.47 | 9 | 16.47 | 11 | 28.62 | 9 |
| 25.92 | 11 | 35.68 | 2 | 35.29 | 3 | 25.92 | 12 | 20.00 | 11 |
| 16.47 | 10 | 24.26 | 3 | 35.29 | 9 | 29.46 | 10 | 42.35 | 3 |
| 16.47 | 11 | 68.28 | 15 | 16.47 | 8 | 29.46 | 12 | 42.35 | 11 |
| 16.47 | 10 | 31.76 | 3 | 29.46 | 10 | 23.53 | 8 | ||
| 29.46 | 12 | 35.29 | 9 | 29.46 | 12 | 31.76 | 3 | ||
| 29.46 | 10 | 35.29 | 3 | 29.46 | 10 | 31.76 | 8 | ||
| 29.46 | 12 | 31.76 | 8 | 16.47 | 9 | 31.76 | 3 | ||
| 29.46 | 10 | 31.76 | 3 | 23.53 | 6 | 35.29 | 9 | ||
| 27.06 | 6 | 31.76 | 8 | 23.53 | 9 | 16.47 | 8 | ||
| 31.76 | 3 | 31.76 | 3 | 35.29 | 3 | 20.00 | 6 | ||
| 35.29 | 9 | 31.76 | 6 | 39.84 | 1 | 56.51 | 15 | ||
| 35.29 | 3 | 56.51 | 15 | 77.18 | 15 | ||||
| 583.42 s | 251.33 s | 481.89 s | 508.29 s | 466.19 s | |||||
| Order 1 | Order 2 | Order 3 | Order 4 | Order 5 | |||||
|---|---|---|---|---|---|---|---|---|---|
| Zone | Zone | Zone | Zone | Zone | |||||
| / | 1 | / | 1 | / | 1 | / | 1 | / | 1 |
| 39.84 | 3 | 39.84 | 3 | 39.84 | 3 | 39.84 | 3 | 39.84 | 3 |
| 31.76 | 6 | 31.76 | 6 | 38.82 | 10 | 38.82 | 10 | 28.24 | 7 |
| 27.06 | 10 | 16.47 | 7 | 16.47 | 11 | 16.47 | 11 | 23.53 | 10 |
| 16.47 | 11 | 23.53 | 10 | 25.92 | 12 | 25.92 | 12 | 16.47 | 11 |
| 25.92 | 12 | 16.47 | 11 | 29.69 | 15 | 29.69 | 15 | 25.92 | 12 |
| 29.69 | 15 | 25.92 | 12 | 29.69 | 15 | ||||
| 29.69 | 15 | ||||||||
| 170.75 s | 183.69 s | 150.75 s | 150.75 s | 163.69 s | |||||
| Order 6 | Order 7 | Order 8 | Order 9 | Order 10 | |||||
| Zone | Zone | Zone | Zone | Zone | |||||
| / | 1 | / | 1 | / | 1 | / | 1 | / | 1 |
| 39.84 | 3 | 15.58 | 2 | 15.58 | 2 | 39.84 | 3 | 15.58 | 2 |
| 31.76 | 6 | 24.26 | 3 | 24.26 | 3 | 31.76 | 6 | 24.26 | 3 |
| 23.53 | 9 | 38.82 | 10 | 31.76 | 6 | 23.53 | 9 | 31.76 | 6 |
| 16.47 | 10 | 16.47 | 11 | 20.00 | 8 | 16.47 | 10 | 20.00 | 8 |
| 16.47 | 11 | 25.92 | 12 | 16.47 | 9 | 16.47 | 11 | 16.47 | 9 |
| 25.92 | 12 | 29.69 | 15 | 32.99 | 15 | 25.92 | 12 | 20.00 | 11 |
| 29.69 | 15 | 29.69 | 15 | 25.92 | 15 | ||||
| 183.69 s | 150.75 s | 141.06 s | 183.69 s | 154.00 s | |||||
| Order 1 | Order 2 | Order 3 | Order 4 | Order 5 | ||||||||||
|---|---|---|---|---|---|---|---|---|---|---|---|---|---|---|
| Zone | Zone | Zone | Zone | Zone | ||||||||||
| / | 1 | / | / | 1 | / | / | 1 | / | / | 1 | / | / | 1 | / |
| 47.73 | 10 | 14.10 | 51.26 | 11 | 14.70 | 51.26 | 11 | 14.70 | 47.73 | 10 | 14.10–14.70 | 51.26 | 11 | 14.70 |
| 29.46 | 12 | 14.10 | 25.92 | 12 | 14.10 | 16.47 | 10 | 14.10 | 16.47 | 11 | 13.50 | 25.92 | 12 | 14.10 |
| 16.47 | 11 | 13.50 | 25.92 | 11 | 13.50 | 16.47 | 11 | 13.50 | 25.92 | 12 | 12.90 | 25.92 | 11 | 13.50 |
| 16.47 | 10 | 12.90–13.50 | 25.92 | 12 | 12.90 | 25.92 | 12 | 12.90 | 29.46 | 10 | 11.85–12.90 | 16.47 | 10 | 11.85–12.90 |
| 27.06 | 6 | 11.25 | 29.46 | 10 | 9.65–12.90 | 25.92 | 11 | 12.15 | 29.46 | 12 | 11.30–11.85 | 29.46 | 12 | 11.25–11.85 |
| 31.76 | 3 | 11.25 | 29.46 | 12 | 9.65 | 25.92 | 12 | 11.85 | 29.46 | 10 | 9.65–11.25 | 29.46 | 10 | 10.65-11.25 |
| 61.42 | 12 | 11.25 | 22.04 | 11 | 9.05 | 29.46 | 10 | 11.85–11.25 | 29.46 | 12 | 9.65 | 29.46 | 12 | 9.65 |
| 29.46 | 10 | 9.90–11.25 | 16.47 | 10 | 8.75–9.05 | 29.46 | 12 | 11.25–9.65 | 29.46 | 10 | 8.75–9.20 | 29.46 | 10 | 9.05–9.65 |
| 29.46 | 12 | 9.65 | 38.82 | 3 | 8.10–8.50 | 29.46 | 10 | 9.65–9.05 | 38.82 | 3 | 8.50 | 16.47 | 11 | 9.05 |
| 29.46 | 10 | 6.45–9.65 | 28.24 | 7 | 6.65 | 16.47 | 11 | 9.05 | 38.82 | 10 | 5.85–8.10 | 16.47 | 10 | 8.75 |
| 29.46 | 15 | 23.53 | 10 | 5.85–6.45 | 16.47 | 10 | 8.75 | 29.46 | 15 | 23.53 | 7 | 8.50 | ||
| 27.06 | 6 | 4.50–4.95 | 38.82 | 3 | 8.50 | 28.24 | 3 | 8.50 | ||||||
| 31.76 | 3 | 3.35 | 38.82 | 10 | 5.85 | 38.82 | 10 | 5.85 | ||||||
| 68.28 | 15 | 16.47 | 11 | 3.95–3.65 | 16.47 | 11 | 3.80 | |||||||
| 25.92 | 15 | 42.35 | 3 | 3.35 | ||||||||||
| 68.28 | 15 | |||||||||||||
| 348.21 s | 444.14 s | 403.33 s | 344.52 s | 488.04 s | ||||||||||
| Order 6 | Order 7 | Order 8 | Order 9 | Order 10 | ||||||||||
| Zone | Zone | Zone | Zone | Zone | ||||||||||
| / | 1 | / | / | 1 | / | / | 1 | / | / | 1 | / | / | 1 | / |
| 70.30 | 12 | 14.10 | 47.73 | 10 | 13.50 | 39.84 | 3 | 12.90 | 47.73 | 10 | 14.10–14.70 | 44.20 | 9 | 13.25 |
| 25.92 | 11 | 13.50 | 16.47 | 11 | 13.50 | 31.76 | 6 | 11.85 | 16.47 | 11 | 13.50 | 23.53 | 6 | 12.90 |
| 25.92 | 12 | 11.25–12.90 | 25.92 | 12 | 11.25 | 31.76 | 3 | 11.25–11.85 | 16.47 | 10 | 12.90–13.50 | 30.58 | 11 | 11.85–12.90 |
| 29.46 | 10 | 10.95–11.25 | 61.42 | 3 | 9.10 | 24.26 | 2 | 10.70 | 29.46 | 12 | 11.25–12.90 | 42.35 | 3 | 10.65–11.25 |
| 29.46 | 12 | 9.65 | 38.82 | 10 | 8.75 | 24.26 | 3 | 9.35–10.65 | 49.65 | 6 | 11.25 | 31.76 | 8 | 10.40 |
| 25.92 | 11 | 9.05 | 38.82 | 3 | 6.00 | 35.29 | 9 | 9.35 | 31.76 | 3 | 11.25 | 31.76 | 3 | 10.35 |
| 16.47 | 10 | 8.75–9.05 | 42.35 | 11 | 5.40 | 16.47 | 8 | 9.20 | 39.84 | 1 | 11.25 | 24.26 | 2 | 9.65 |
| 38.82 | 3 | 8.50 | 42.35 | 3 | 4.95 | 16.47 | 9 | 7.60–8.75 | 47.73 | 10 | 9.65–10.95 | 28.62 | 9 | 9.05 |
| 35.29 | 9 | 8.50 | 24.26 | 2 | 3.95 | 16.47 | 8 | 7.45–7.60 | 29.46 | 12 | 9.05–9.65 | 16.47 | 8 | 7.75 |
| 16.47 | 10 | 6.45 | 35.68 | 11 | 3.80 | 16.47 | 9 | 7.30 | 25.92 | 11 | 9.05 | 16.47 | 9 | 7.30–7.45 |
| 27.06 | 6 | 6.45 | 25.92 | 15 | 35.29 | 3 | 7.15 | 42.35 | 3 | 8.10 | 16.47 | 8 | 6.00–6.60 | |
| 31.76 | 3 | 5.25–6.00 | 35.29 | 9 | 7.15 | 35.29 | 9 | 2.90–5.10 | 20.00 | 6 | 5.85–6.00 | |||
| 31.76 | 6 | 4.95 | 16.47 | 8 | 6.30–6.60 | 32.99 | 15 | 31.76 | 3 | 5.35 | ||||
| 31.76 | 3 | 3.35–4.95 | 31.76 | 3 | 3.35–5.35 | 31.76 | 8 | 5.10 | ||||||
| 68.28 | 15 | 68.28 | 15 | 31.76 | 3 | 2.90–3.95 | ||||||||
| 68.28 | 15 | |||||||||||||
| 504.68 s | 399.76 s | 440.16 s | 445.13 s | 490.05 s | ||||||||||
| Order 1 | Order 2 | Order 3 | Order 4 | Order 5 | ||||||||||
|---|---|---|---|---|---|---|---|---|---|---|---|---|---|---|
| Zone | Zone | Zone | Zone | Zone | ||||||||||
| / | 1 | / | / | 1 | / | / | 1 | / | / | 1 | / | / | 1 | / |
| 47.73 | 10 | 4 | 47.73 | 10 | 4 | 47.73 | 10 | 4 | 47.73 | 10 | 4 | 47.73 | 10 | 4 |
| 16.47 | 11 | 4 | 16.47 | 11 | 4 | 16.47 | 11 | 4 | 16.47 | 11 | 4 | 16.47 | 11 | 4 |
| 25.92 | 12 | 4-3 | 25.92 | 12 | 4-3 | 25.92 | 12 | 4-3 | 25.92 | 12 | 4-3 | 25.92 | 12 | 4-3 |
| 42.21 | 6 | 3 | 25.92 | 11 | 3 | 25.92 | 11 | 3 | 29.46 | 10 | 3-2 | 25.92 | 11 | 3 |
| 31.76 | 3 | 3 | 16.47 | 10 | 3-2 | 16.47 | 10 | 3-2 | 38.82 | 3 | 2 | 16.47 | 10 | 3-2 |
| 38.82 | 10 | 3-2 | 23.53 | 7 | 2 | 38.82 | 3 | 2 | 68.28 | 15 | 23.53 | 7 | 2 | |
| 29.46 | 15 | 28.24 | 3 | 2-1 | 42.35 | 11 | 1 | 28.24 | 3 | 2-1 | ||||
| 31.76 | 6 | 1 | 25.92 | 15 | 42.35 | 11 | 1 | |||||||
| 56.51 | 15 | 25.92 | 15 | |||||||||||
| 232.38 s | 272.56 s | 239.62 s | 226.68 s | 252.56 s | ||||||||||
| Order 6 | Order 7 | Order 8 | Order 9 | Order 10 | ||||||||||
| Zone | Zone | Zone | Zone | Zone | ||||||||||
| / | 1 | / | / | 1 | / | / | 1 | / | / | 1 | / | / | 1 | / |
| 51.26 | 11 | 4 | 47.73 | 10 | 4 | 39.84 | 3 | 4-3 | 47.73 | 10 | 4 | 40.67 | 6 | 4 |
| 25.92 | 12 | 4-3 | 16.47 | 11 | 4 | 24.26 | 2 | 3 | 16.47 | 11 | 4 | 23.53 | 9 | 4 |
| 25.92 | 11 | 3 | 25.92 | 12 | 3 | 25.09 | 6 | 3 | 25.92 | 12 | 4-3 | 20.00 | 11 | 4-3 |
| 16.47 | 10 | 3-2 | 29.46 | 10 | 3 | 20.00 | 8 | 3 | 25.92 | 11 | 3 | 20.00 | 9 | 3 |
| 16.47 | 9 | 2 | 38.82 | 3 | 3-2 | 16.47 | 9 | 3-2 | 16.47 | 10 | 3 | 16.47 | 8 | 3 |
| 23.53 | 6 | 2 | 42.35 | 11 | 2-1 | 16.47 | 8 | 2 | 47.73 | 1 | 3 | 25.09 | 2 | 3 |
| 31.76 | 3 | 2-1 | 42.35 | 3 | 1 | 31.76 | 3 | 2-1 | 39.84 | 3 | 3-2 | 24.26 | 3 | 3-2 |
| 31.76 | 6 | 1 | 24.26 | 2 | 1 | 68.28 | 15 | 31.76 | 6 | 2 | 31.76 | 6 | 2 | |
| 56.51 | 15 | 61.60 | 15 | 23.53 | 9 | 2-1 | 20.00 | 8 | 2 | |||||
| 32.99 | 15 | 16.47 | 9 | 2 | ||||||||||
| 35.29 | 3 | 1 | ||||||||||||
| 68.28 | 15 | |||||||||||||
| 279.62 s | 328.98 s | 242.17 s | 308.37 s | 341.83 s | ||||||||||
| Order 1 | Order 2 | Order 3 | Order 4 | Order 5 | |
|---|---|---|---|---|---|
| No Opt | 351.58 | 430.40 | 380.63 | 390.50 | 453.92 |
| TSP | 170.75 | 183.69 | 150.75 | 150.75 | 163.69 |
| SOP | 348.21 | 444.14 | 403.33 | 344.52 | 488.04 |
| Rel. SOP | 232.38 | 272.56 | 239.62 | 226.68 | 252.56 |
| Order 6 | Order 7 | Order 8 | Order 9 | Order 10 | |
| No Opt | 583.42 | 251.33 | 481.89 | 508.29 | 466.19 |
| TSP | 183.69 | 150.75 | 141.06 | 183.69 | 154.00 |
| SOP | 504.68 | 399.76 | 440.16 | 445.13 | 490.05 |
| Rel. SOP | 279.62 | 328.98 | 242.17 | 308.37 | 341.83 |
Publisher’s Note: MDPI stays neutral with regard to jurisdictional claims in published maps and institutional affiliations. |
© 2021 by the authors. Licensee MDPI, Basel, Switzerland. This article is an open access article distributed under the terms and conditions of the Creative Commons Attribution (CC BY) license (https://creativecommons.org/licenses/by/4.0/).
Share and Cite
Pietri, N.O.; Chou, X.; Loske, D.; Klumpp, M.; Montemanni, R. The Buy-Online-Pick-Up-in-Store Retailing Model: Optimization Strategies for In-Store Picking and Packing. Algorithms 2021, 14, 350. https://doi.org/10.3390/a14120350
Pietri NO, Chou X, Loske D, Klumpp M, Montemanni R. The Buy-Online-Pick-Up-in-Store Retailing Model: Optimization Strategies for In-Store Picking and Packing. Algorithms. 2021; 14(12):350. https://doi.org/10.3390/a14120350
Chicago/Turabian StylePietri, Nicola Ognibene, Xiaochen Chou, Dominic Loske, Matthias Klumpp, and Roberto Montemanni. 2021. "The Buy-Online-Pick-Up-in-Store Retailing Model: Optimization Strategies for In-Store Picking and Packing" Algorithms 14, no. 12: 350. https://doi.org/10.3390/a14120350
APA StylePietri, N. O., Chou, X., Loske, D., Klumpp, M., & Montemanni, R. (2021). The Buy-Online-Pick-Up-in-Store Retailing Model: Optimization Strategies for In-Store Picking and Packing. Algorithms, 14(12), 350. https://doi.org/10.3390/a14120350