Article

Hierarchical Fuzzy Expert System for Organizational Performance Assessment in the Construction Industry

1
DPR Construction, Redwood City, CA 94061, USA
2
School of Construction Management, Purdue University, West Lafayette, IN 47907, USA
*
Author to whom correspondence should be addressed.
Algorithms 2020, 13(9), 205; https://doi.org/10.3390/a13090205
Submission received: 29 July 2020 / Revised: 16 August 2020 / Accepted: 19 August 2020 / Published: 21 August 2020
(This article belongs to the Special Issue Fuzzy Hybrid Systems for Construction Engineering and Management)

Abstract

:
Organizations have been trying to increase their efficiency and improve their performance in order to achieve their goals. Various factors determine organizational success. The construction industry is a project-based industry which is exceptionally dynamic. The need to identify the weak points and search for solutions to improve the performance of the construction organization is extremely crucial. The industry has always focused on the measure of project success. Previous research works have primarily focused on the measurement of financial or tangible assets. However, there is a lack of understanding of qualitative factors and their combined effect on organizational performance. Therefore, the objectives of this paper are to identify and study the success factors—both financial and non-financial factors. The potential success factors are collected from the literature review and construction experts through a questionnaire to evaluate their effect on organizational performance. The collected data have been analyzed using the Analytic Hierarchy Process (AHP) to shortlist the critical success factors. Thereafter, the Hierarchical Fuzzy Expert System has been used to build a prediction model based on the selected factors. The developed research/model benefits both researchers and practitioners to predict accurate company performance.

1. Introduction

Construction is a diverse, project-based industry [1]. The project-based nature of the construction industry makes every project unique [2]. Moreover, the market structure is exceptionally fragmented, making it very competitive and challenging for any particular organization to dominate [3]. The unique nature of concerns and challenges often render the generalizable decision rules and frameworks for organizational phenomena unusable [4]. The financial and tangible assets gained are often translated to organizational success. In a review of project success factors conducted, it was noted that project success was considered only as a subject of implementation in the 1980s [5].
The approach towards the subject has evolved over the years. It is now extended from inception to the closing out of the project. Today, the literature in this field spans the entire product life cycle from product success to business success. This change has led to a shift in emphasis from project success to organizational success. The need to examine architectural/engineering/construction (A/E/C) organizations and the factors that impact the performance of organizations is now necessary to compete in an ever-changing marketplace [6].
Organizations have been trying to increase their efficiency and improve their performance in order to achieve their goals. Organizational success is determined by various factors that impact organizational performance. The uncertainty and uniqueness of projects are inherent characteristics of this industry, making it a conglomeration of unpredictable variables. Furthermore, the lack of performance measurements for the construction industry makes it challenging to evaluate these variables. Hence, developing a useful construction performance assessment model has been very difficult [7,8,9,10]. Globalized competition and customer needs forced construction companies to assess their performance beyond the financial measures—that is, profitability, turnover, etc. [11]. Profit and success are considered the main drivers of any organization. Achieving success depends on many factors that have a direct effect on the performance of organizations. Most construction organizational success factors are qualitative rather than quantitative. Thus, making it essential to determine these success factors, which can then be used later to predict and improve organizational performance.
Modeling the performance of construction organizations from a financial perspective has been extensively researched; however, modeling the performance considering non-financial aspects has not received sufficient attention from researchers. The ability to predict construction organization performance will enable practitioners to identify weak points, which will lead to search solutions to improve efficiency, which will ultimately increase profits and success [7].
Studies conducted in the construction industry have laid more emphasis on the measurement of project performance rather than company performance. Moreover, studies have focused on individual or a combination of a few factors. Due to the limited scope, the whole system has not been evaluated, thus making it necessary to understand and identify the underlying relationship between the factors amongst categories and across different categories that impact an organization’s performance. Alternatively, different prediction models need to be developed depending on the organization size, specialty contractors and types of contracts undertaken—for example, Engineering Procurement and Construction (EPC), Construction Management at Risk (CMR), Architectural and Design firms, General Contractor.
Therefore, the objectives of this paper are to identify and study the success factors—both financial and non-financial factors—to investigate the factors that impact the organization’s performance in the construction industry. Moreover, another objective is to develop a comprehensive prediction model based on the non-financial and financial factors that impact an organization’s performance. The following sections present the research background, objectives, methodology, model building, validation, and conclusion and recommendations for future studies.

2. Background

2.1. Critical Success Factors

Determining factors for project success or failure has been of keen interest to both academicians and industry professionals. Most of the factors identified have focused on project execution rather than organizational success. Cooke-Davies [12] mentioned that, although project management literature does not illustrate much corporate success, both direct and indirect links exist. Organizational effectiveness depends upon the successful management of the projects [4]. Project success brings about a beneficial change to the organization and vice-versa [12]. Similarly, any improvement in the organization’s structure will improve the chances of project success. Several critical success factors influence project success—for example, top management support, communication, and sufficient resources are derivatives of organizations. Furthermore, the study recognizes important factors that link project success and corporate success. These factors are categorized into five areas, which are, general corporate strategy, business operations, research and development, IT/IS development, and facilities management. The paper stresses that every factor deals with people, as they are the ones who execute the project. Thus, it is necessary to include the influence of people in organizations. Pinto and Covin [4] and Muller and Jugdev [5] have discussed that project success is dependent on the interaction of individuals, project teams, and organizational success.
Chinowsky and Meredith [
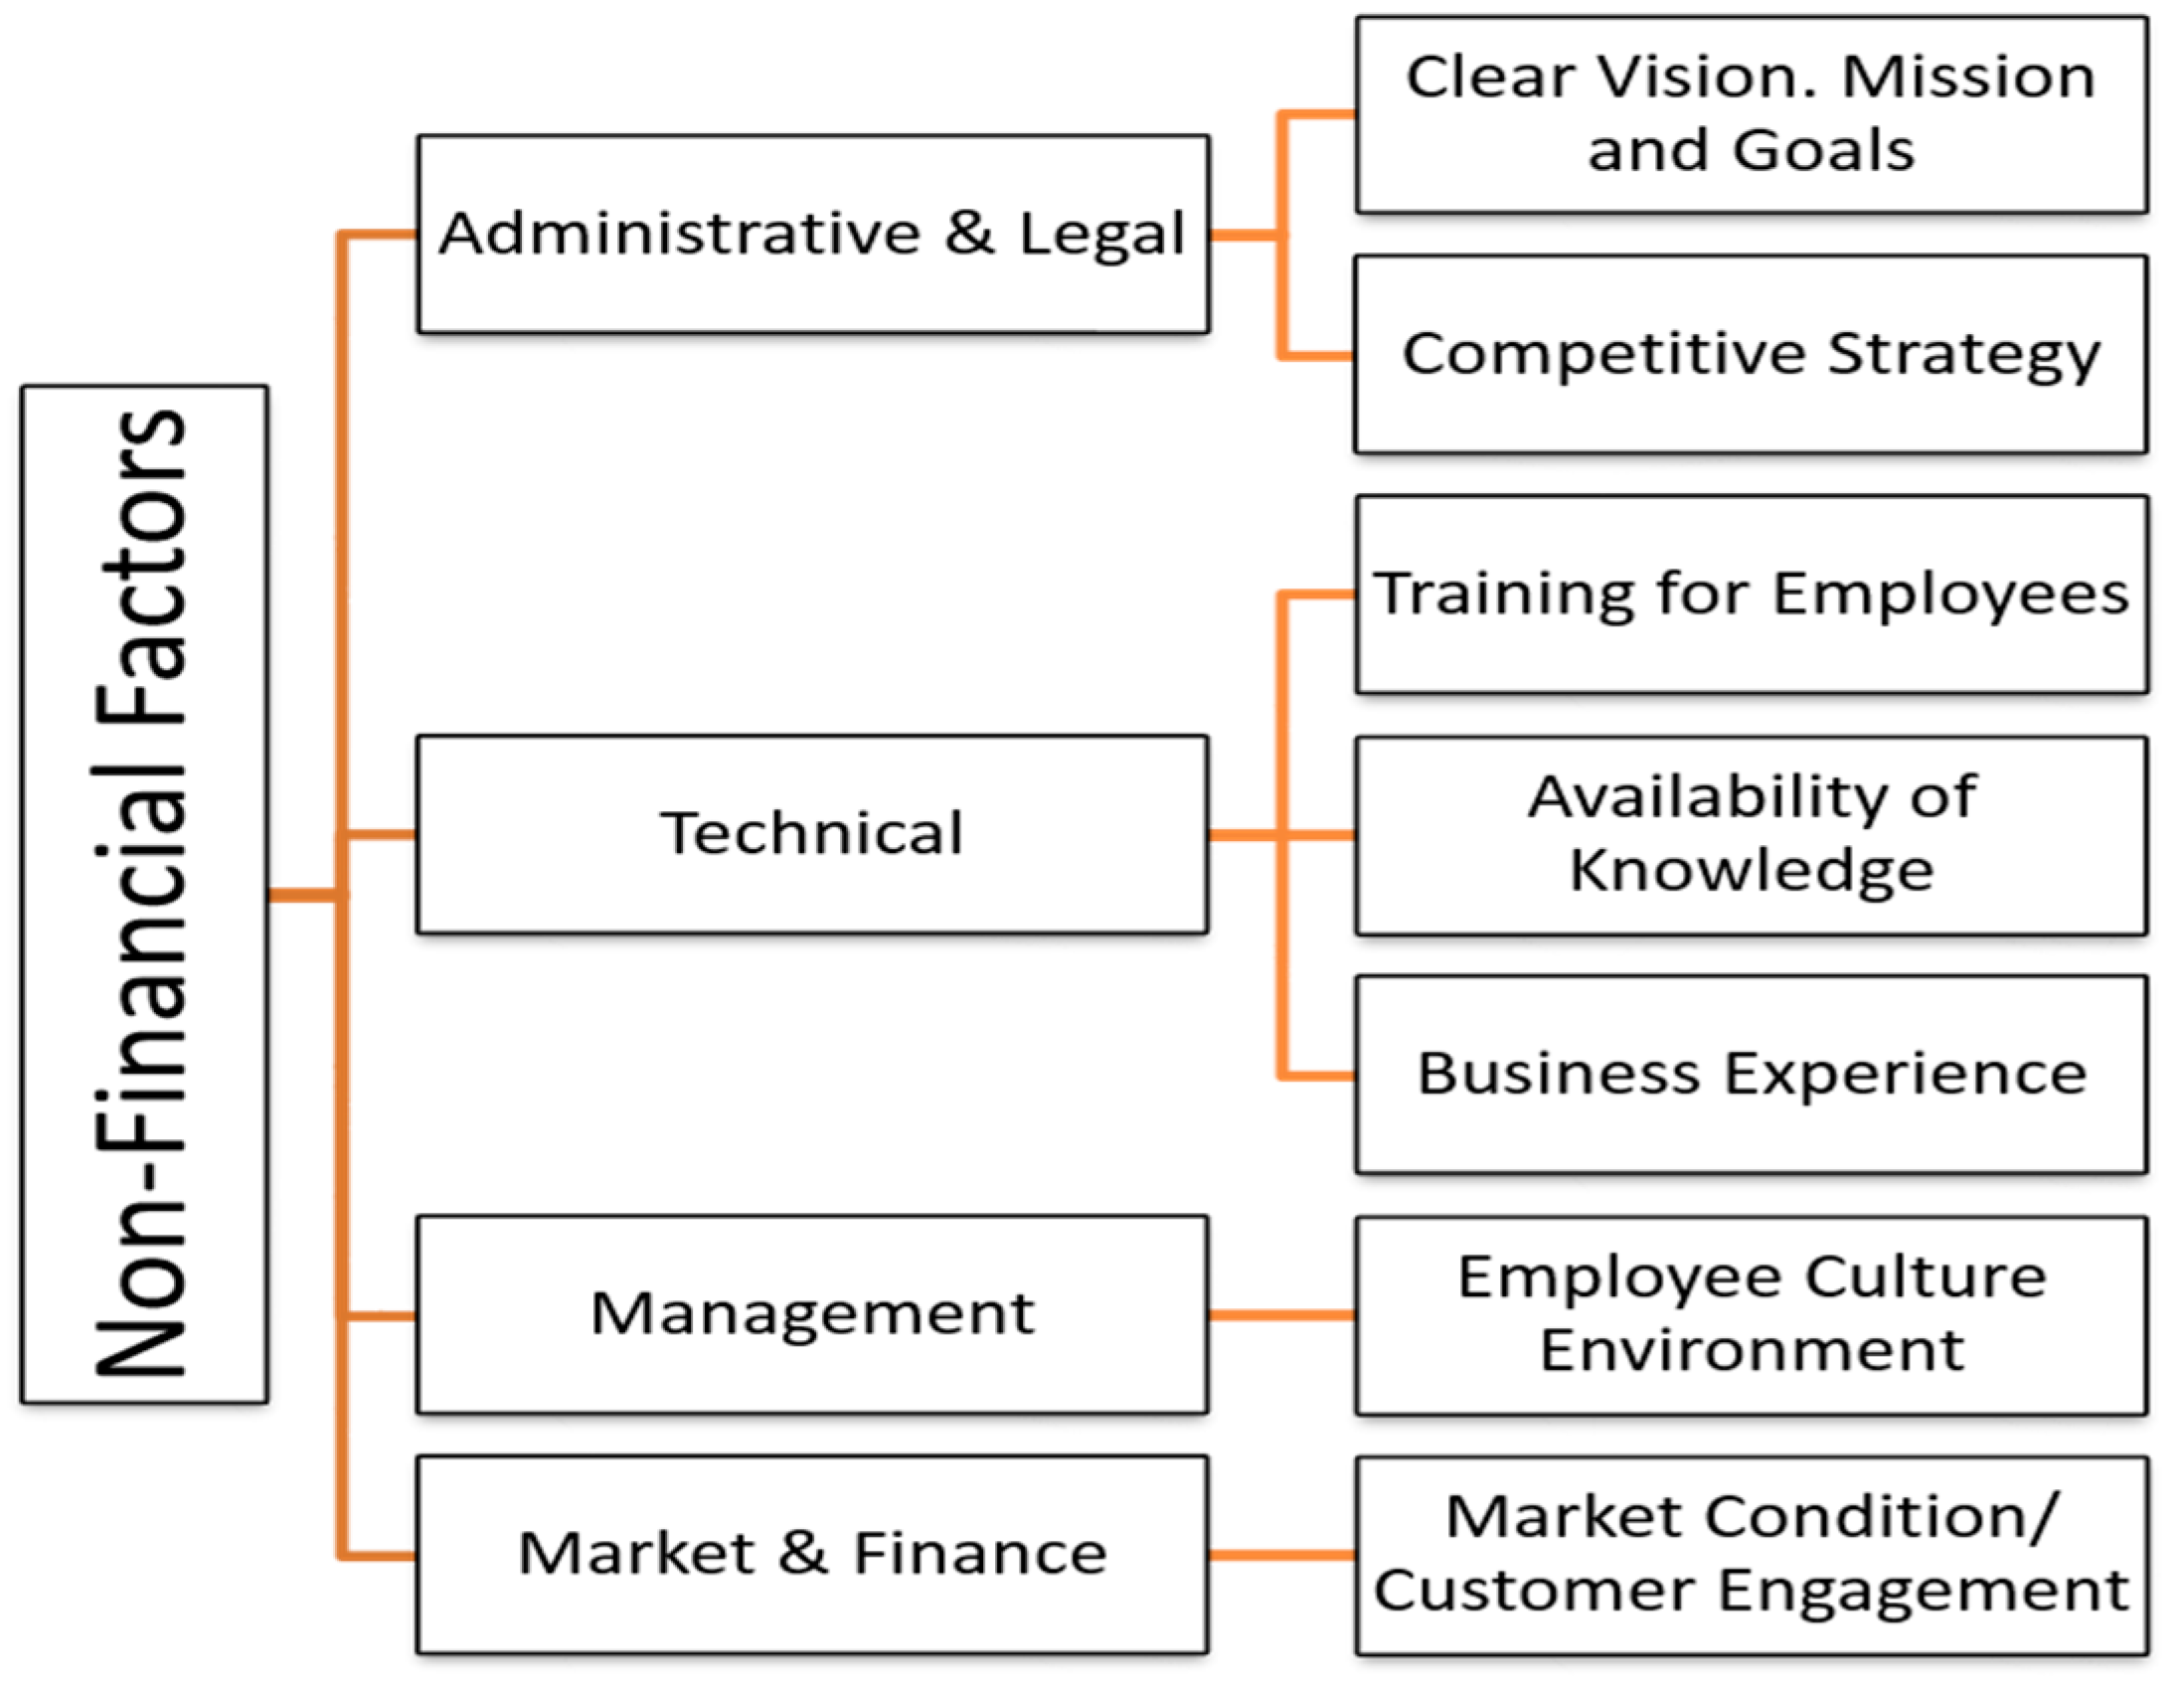
13] proposed the concept of seven guiding principles of strategic management for the construction industry. These include vision, mission, goals, core competencies, and knowledge resources, education, finance, markets, and competition. Knowledge and information are now considered as critical factors that influence a company’s lifespan. They are rated higher than land, capital, or labor [14]. A good knowledge database will allow organizations to leverage against their competitors in the future and thus give organizations a competitive edge [15]. Unfortunately, knowledge, being an intangible asset, is difficult to measure and hence is often forgotten in the process [14]. Organizations are conceptualized as the product of thought and action of their members [16] or, as Weick [17] stated, the body of thought by organizational thinkers. Human elements are the assets of organizations that are capable of learning, evolving, innovating, and creatively propelling the growth of an organization, which is essential for the long-run survival of the organization. It has been noted that the majority of Human Resource Accounting (HRA) techniques have been designed for industries such as accounting firms, banks, insurance companies, and financial service firms, where human resources represent a substantial share of the organization value [14]. However, construction organizations lack such initiatives that are designed to evaluate employee performance, satisfaction, and compensation. Factors such as organization employee culture and engagement are essential aspects of an organization. Another critical factor is the feedback system, as this is incredibly crucial for the implementation of the metric system and evaluating the performance of the organization. Feedback evaluation is one of the critical success factors that aids in analyzing and improving organization performance [18]. The earliest seminal works in the field of economics by Viner [19] on long-run average cost cycles show that economies of scale help organizations to grow efficiently up to a certain critical production level. The expansion of a firm that results in reduced cost is called the economy of scale. There are two types of economies of scale—internal and external. Internal economies of scale are long term phenomena achieved by the appropriate adjustment of scale of operations to the successive output [19]. Technical economies allow organizations to capitalize on the processes and assets developed. Large firms benefit from established credit lines. Large firms can achieve risk-bearing economies as they can afford to take higher risks and take up high-risk projects. Firm size is one of the factors that can impact an organization’s growth. If the firm is too big, the management communication can be inefficient due to poor communication and coordination problems. Factors, such as the morale of employees, are intangible and, hence, are difficult to account for in an organization’s growth by just looking at financial statements.
Large firms also experience inefficiencies due to the principle-agent problem. Viner [19] also pointed out that the internal economy of scale is independent of the external economy of scale. The external economy of scale refers to the positive developments or increase in output generated by the industry as a whole. Similar to the internal pecuniary economy of scale, the external pecuniary economy of scale also benefits organizations when there is an increase in the number of suppliers, and offer more competitive prices. Challenging Viner’s theory of the impact of firm size and economies of scale on the organization performance, Simon and Bonini proposed a stochastic mechanism using Gibrats law for firm growth and the skewed distribution of firm sizes [20]. The results show that the distribution of the percentage of change in the size of firms in a given size class is the same for firms in all size classes. Thus, the expected rate of growth is independent of the current size of a firm.

2.2. Existing Performance Metrics

Benchmarking has been defined as a continuous, systematic process for evaluating the products, services, and work processes of organizations that are recognized as representing best practices for the purpose of organization improvement [21]. A company is a complex structure, comprising of various interconnected components that influence its performance [22]. Performance prediction of construction organizations includes the identification of the weak points in order to improvise processes and to increase profits [23]. The attention of organizations is usually focused on improving the efficiency of its tangible assets as they can be measured and evaluated [18]. In the process, the organizations often do not consider the invisible and intangible assets that impact the overall performance. A good metric system empowers an organization [18]. In a recent study and analysis of a case study by Gustavsson [24], a need for new collaborative project practice development and organizational change has been discussed. Company performance is usually assessed by the evaluation of measurable characteristics of performance indicators [25]. At the same time, it is crucial to understand that the productivity or output in the construction industry is not homogeneous; that is, outputs cannot be measured in a cubic meter.
Given the diverse nature of the construction industry, it is impossible to aggregate all types of outputs and measure them with one physical measurement unit. It is essential to understand the heterogeneous results and develop ways to analyze them [26].
The existing literature shows that numerous models were developed to measure performance by using critical success factors, performance measures, and indicators. Academics have a tendency to characterize projects as similar entities; thus, these studies have been done looking at the broader picture rather than for a particular case [4]. These studies mostly address metric requirements for the manufacturing industries rather than construction. It is important to note that product life in the manufacturing industry goes through a standard process. The performance is usually measured at a per-unit cost. The repetitive process makes it possible to standardize the process and improve overall performance. The project management studies have been shifting focus to organizational strategies and operations. World manufacturers are now competing on crucial success factors other than price/cost. Unarguably, the characteristics and properties of goals and challenges may be similar. However, too often, academics have generalized decision rules for organizational phenomena, while practitioners have been stressing the unique nature of their concern [4]. The closest initiative to measure construction performance was based on total quality management [27].
One of the earliest measurement instruments developed to measure the project performance was proposed by Pinto and Slevin [28]. The Project Implementation Profile (PIP) allows for the assessment of an organization’s ability to carry a project through its full implementation [29]. The PIP was a support tool to enable managers to assess the status of their project by seeking answers to questions related to 10 critical success factors [28]. The process required participants to give responses on a 5-point Likert scale. These responses were used to assess success or failure in terms of schedule, budget overrun, quality of work, client satisfaction, and the utility of the final project. It is important to note that the tool was developed focused more on project success rather than organization success.
In 1992, members of the Houston Business Roundtable (HBR) embarked on the journey of establishing performance metrics. This process included sending out a survey to member companies of HBR to determine four main preliminary tasks: determine the interest in HBR companies in a metric system; identify activities that should be measured; determine how to measure activities; collect information and analyze information. After confirming a 90% interest and willingness from a HBR member, the HBR members decided on ten activities that were selected for benchmarking. The ten factors were costs (actual vs. authorized), schedule (actual vs. estimated), scope changes, reengineering work, construction labor (actual vs. estimated), worker hours per drawing, project cost distribution, field defects, and percent of rejected welds [27].
Studies conducted in the construction industry have laid more emphasis on the measurement of project performance rather than company performance [11]. Bontis and Dragonetti [14] proposed the Balanced Score Card (BSC). The framework emphasized qualitative measures at the organizational level and advocated the balance between measures of financial and non-financial success. Another example of performance measurement and management framework is the Performance Prism. The first part of this framework encourages assessing stakeholder satisfaction and assessing the needs of the stakeholder. The second part is to understand the needs of the organization (i.e., the reciprocal relationships) as well as on how to align strategies, processes, and capabilities [30]. The Prism focuses on significant measures and connects the performance practices within the organization. These frameworks are more than a decade old.
Hence, in order to keep up with the ever-changing markets, many new studies are being carried out. Performance measurement has always been a challenge in the construction industry [29]. The construction industry has not seen much improvement in productivity and performance measurement, as in the manufacturing sector [31]. Industry groups in several different countries have initiated benchmarking programs focused mainly on construction performance measures [32]. The earliest concepts of benchmarking systems in the construction industry were introduced in the 1990s and were initiated by countries such as the United States of America, the United Kingdom (UK), Chile, Japan, and Brazil. In 1993, the Construction Industry Institute introduced the first benchmarking system in the public sector of the construction industry. This was followed by the Construction Excellence Program launched by the Construction Best Practice Program (CBPP) and the Key Performance Indicators (KPIs) program launched by the UK Best Practice Program in 1988 [29]. In 2008, the Construction Sector Council, a Canada based organization, launched a program to measure and benchmark project performance in the Canadian construction industry. The metrics developed benchmarks to measure: project cost, time, safety and quality performance; labor productivity; rework; project conditions and management practices related to health. The goal of the program was to develop benchmarks to assess labor productivity and project performance [29]. Again, the study was based on project success factors.
Costa et al. [32] summarized various benchmarking systems employed by the construction industry from four different countries (i.e., Brazil, Chile, the UK, and the US). The benchmarking initiatives are: 1. Key Performance Indicators in the UK; 2. National Benchmarking System for Chilean Construction Industry (NBS-Chile); 3. CII benchmarking system and metric in the US; 4. The performance measurement for benchmarking in the Brazilian Construction Industry.
These programs have generated recommendations, such as: Classification of performance measures, establishing frameworks that allow performance to performance management; 3. developing collaborative learning processes; inventing new measures and developing a framework for performance assessment.
Another framework proposed by the Canadian Construction Innovation Council (CCIC) evolved from the project success factors to a framework that encompasses factors that impact the organization’s functioning. The metrics developed by the CCIC would be relevant to the project and organization level and also allow for the indication and assessment of performance at the organization level. This framework included factors that are categorized into seven main performance categories. The factors are costs (estimated, actual and predicted), time (estimated, actual and predicted), quality (levels of client satisfaction), safety (incidents and lost time), innovation (procurement, management, technology), and sustainability (design and construction). The major drawback of this framework is that it required accurate data for a large number of factors, and the analysis followed was even more complicated [29]. Organizations that focus on satisfying customers with greater efficiency and effectiveness have the edge over their competitors [33]. Studies have shown that practitioners have been able to determine that improving communication has a significant impact on construction practice. It allows better customer engagement, leading to the better performance of organizations. Neely et al. [33] stress the importance of metrics associated with quality, time, cost, and flexibility, thus relating the performance of organizations with project success.
Attempts have also been made to understand the relationship between the internal and external factors affecting organizational performance. Empirical studies carried on the construction market structure show that the construction industry is highly fragmented, which makes it very competitive [3].
Studies have been carried out to identify the relationship between market fragmentation and organizational diversification [3]. Choi and Russell [34] used 12 years of data of publicly traded companies to identify any relation between diversification and profitability. However, no significant difference in profitability was found in companies categorized by different diversification level.
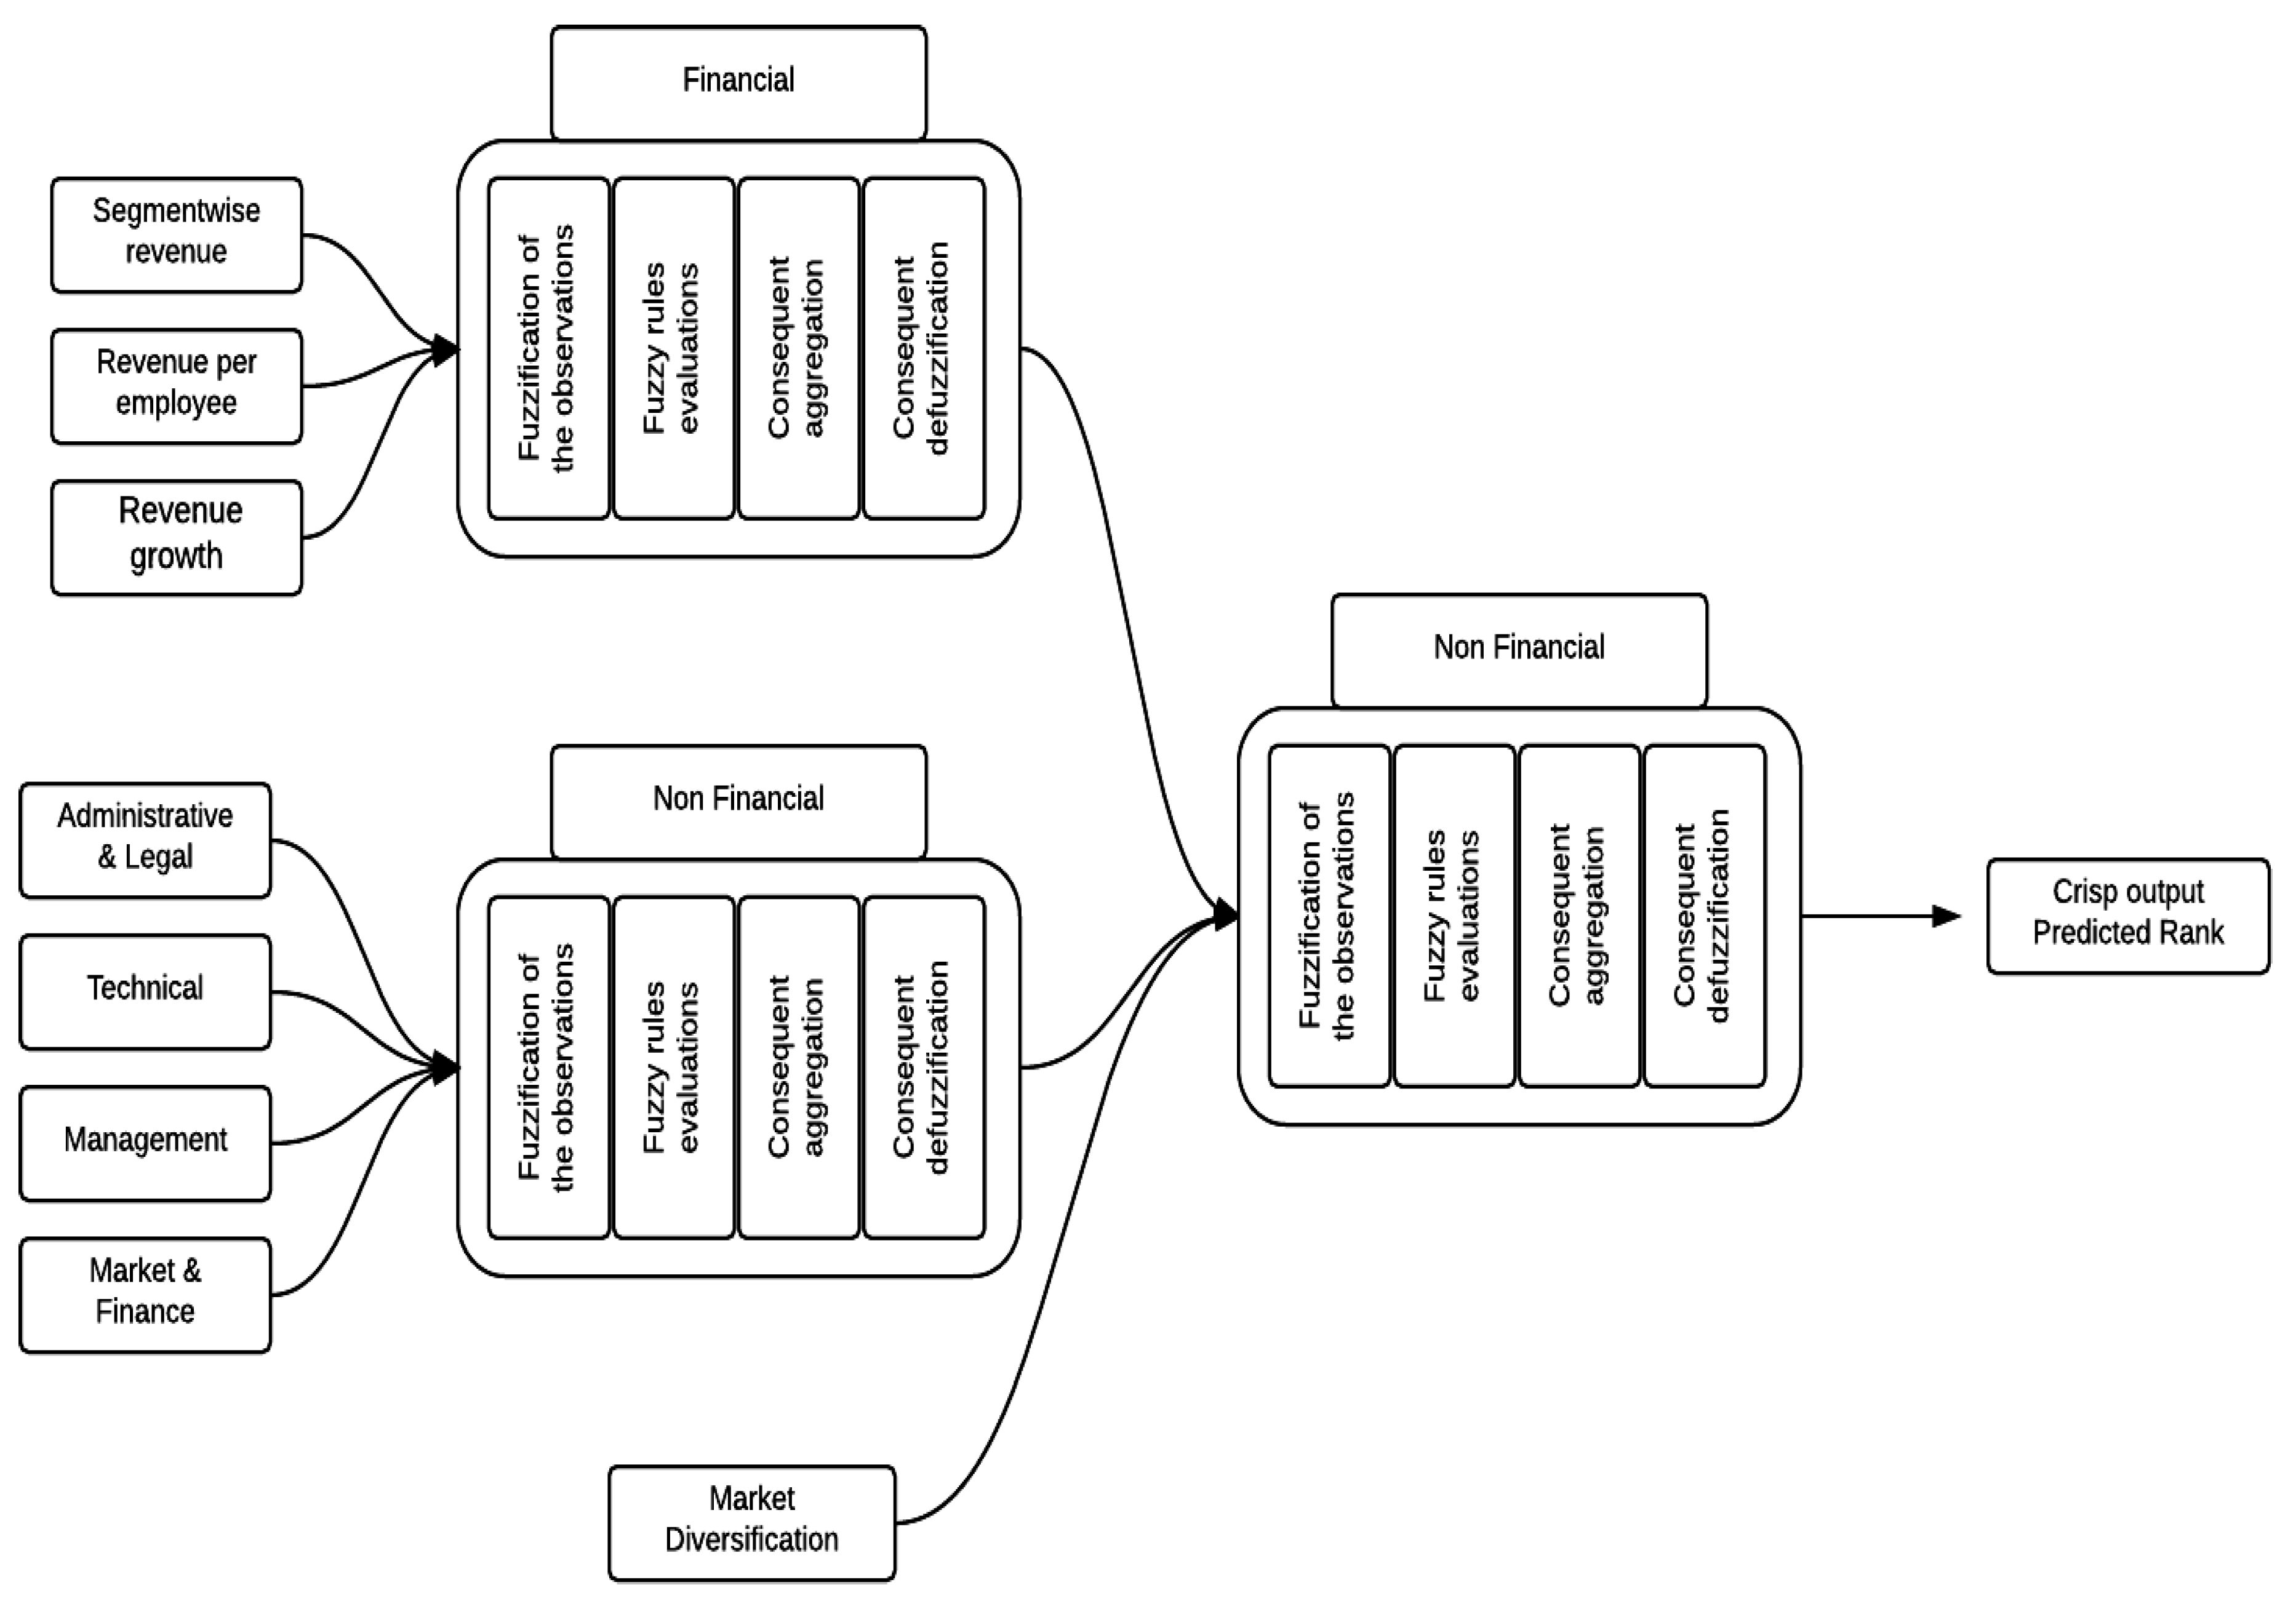
In a previous study by Zayed et al. [23], nine critical success factors (CSFs) were defined as the most significant to develop a prediction model for organizational performance. The Artificial Neural Network (ANN) model was used to assess the most significant success factors, as ANN provides the contributing weight of each factor after the completion of the training process. Another study developed a fuzzy logic model with the same data aiming to develop the best fit model for performance prediction [7].

2.3. Modelling Techniques Adopted—Fuzzy Approach

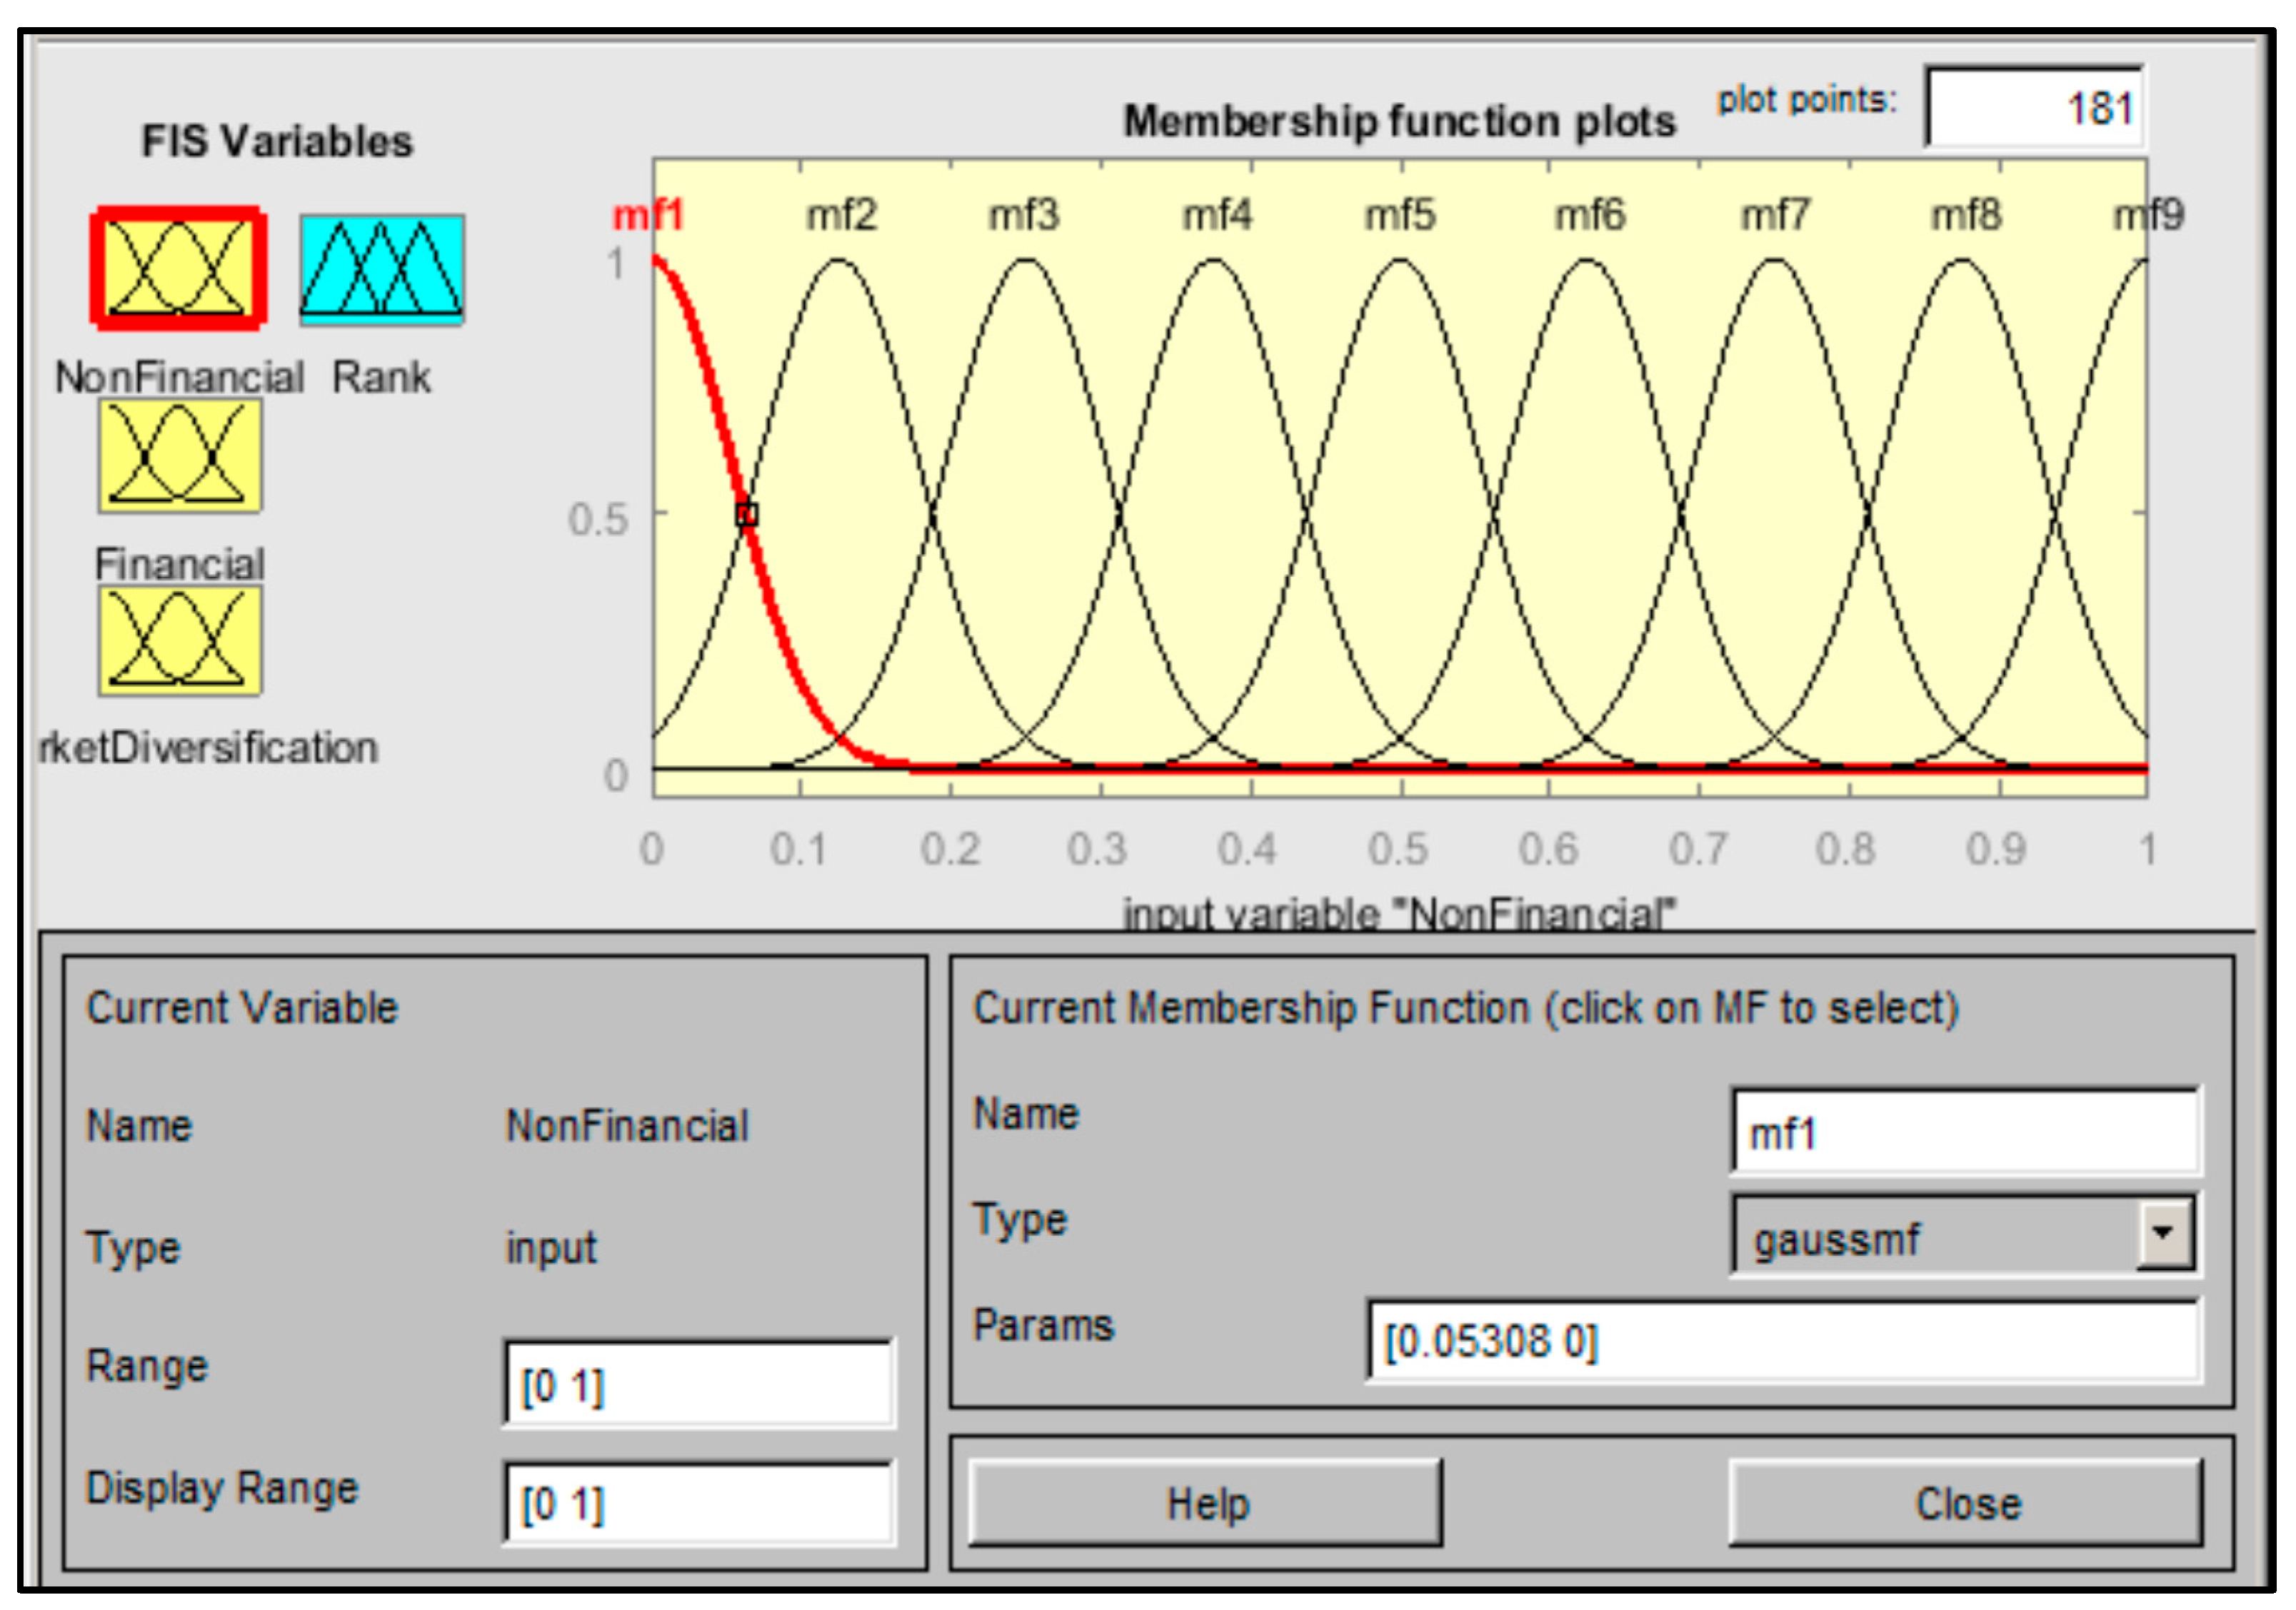
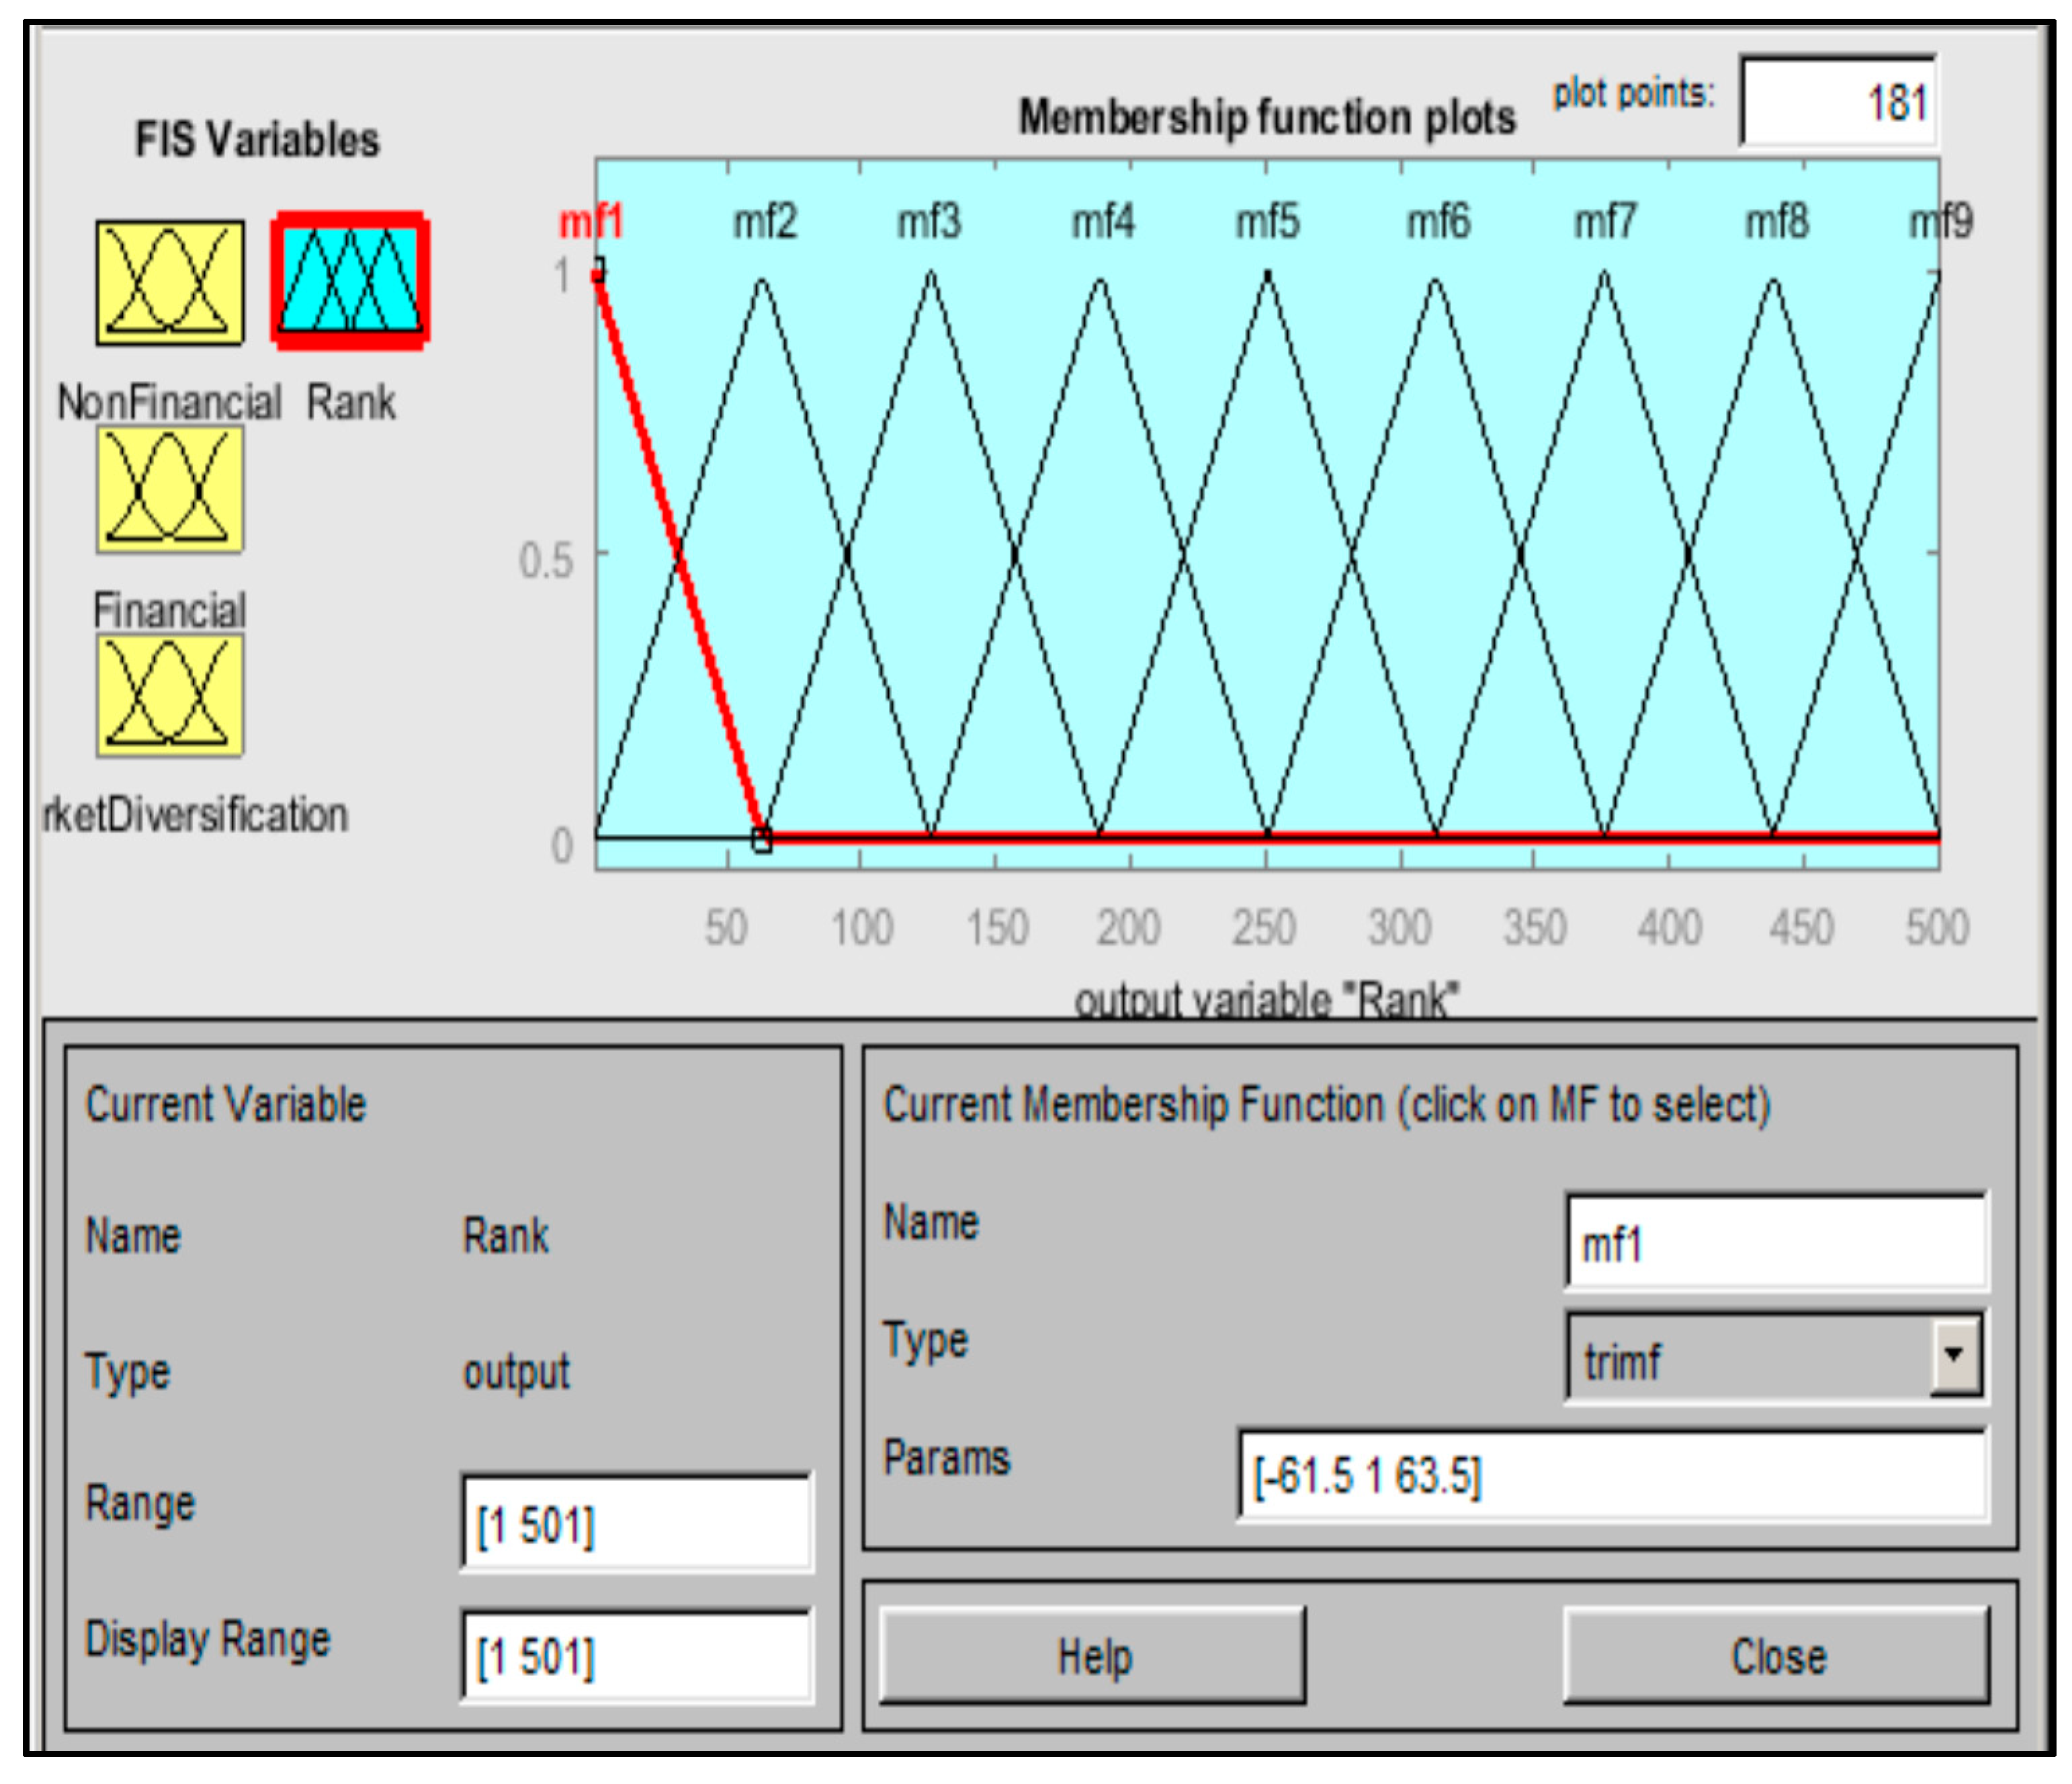
Lotfi Zadeh introduced fuzzy logic as a powerful modeling technique that can be used for understating the uncertainty and qualitative aspects of human nature [35]. Fuzzy techniques have been widely utilized in several studies over the past decade. It has the ability to virtually connect humans to computers by analyzing linguistic inputs to stem numerical outputs [36]. Traditionally, a set of inputs has sharp and crisp boundaries, where elements are either in or out of a set, and the ranking of membership of a variable is zero or one [37]. However, in the real world, information is mainly ambiguous and incomplete. That is when fuzzy logic is applicable, as elements are allowed to have partial memberships ranging from zero to one (i.e., zero is no membership, and one is full membership) [38].
Zayed et al. [23], has previously developed prediction models for the performance of construction organizations using the Artificial Neural Network (ANN) model and regression. A total of 18 factors were identified from the literature review. Based on the responses received from industry experts (5-point Likert scale was used), these factors were evaluated and allotted ranks using ANN training (i.e., ranking the factors to determine the relative importance of each variable and the highest impact on the model). Analysis of weights of the trained neural network is used to derive the contribution percentages. The higher value implies that the variable contribution to classification/prediction is also high. Based on the ANN rankings, nine factors with the highest contributing factor were shortlisted from the pool of 18 factors.
However, this advantage comes at the cost of the minimized interpretability of the model output. The black box quality of an ANN model makes it next to impossible to gain insight into a problem based on an ANN model. The regression technique allows the user to sequentially remove possible explanatory variables that do not contribute to the fit of the model [39]. Regression techniques permit hypothesis testing concerning both the univariate and multivariate association amongst each explanatory variable and the outcome of interest. However, it fails to recognize or identify the highly nonlinear factors or correlation among variables [39]. Human reasoning being more approximate than precise often makes it difficult to measure and determine the measure of factors affecting a particular cause.

2.4. Challenges and Limitations of Existing Metrics

The process of developing a successful performance prediction model is a very long and tedious task. It takes the analysis of a large number of factors from a broad stratum of projects. The data requirements are immense. Additionally, the project values, life-cycle, location, etc., are the variables that need to be accounted for. The time taken to develop the program, identify potential participants, introduce the concept, obtain feedback, revise parameters, and re-evaluate can be extremely long.
Furthermore, it is a challenge to convince firms to provide data for on-going projects and data for any changes that may be observed after the suggested actions. Once a benchmark has been developed, it becomes a significant strategic asset. CII took almost eight years to derive a functional benchmarking model with a considerable number of projects to make meaningful assessments at the project level [40]. Despite the awareness and importance–performance measurement data, companies, or knowledge bodies have not been able to establish data banks [32]. Existing empirical studies only focus on a few factors and attempt to establish a relationship. These factors can be internal—that is, within the organization—and external, related to market conditions. Previous studies have focused on individual or combination of a few factors. Due to the limited scope, the whole system was not evaluated, thus making it necessary to understand and identify the underlying relationship between the factors amongst categories and across different categories that impact an organization’s performance.
The data from companies vary as the companies that execute small projects only form a fraction of the total industry turnover. Only large organizations can afford to execute projects with a minimal profit margin, as they have in house capabilities, established processes, established lines of credit, and qualify for large projects. However, it is essential to note that small organizations barely manage to stay afloat. It will thus be necessary to account for the organization size while developing a prediction model. Alternatively, different prediction models need to be developed depending on the organization size, specialty contractors, and types of contracts undertaken—for example, Engineering Procurement and Construction (EPC), Construction Management at Risk (CMR), Architectural and Design firms, General Contractor.

3. Framework and Methodology

The existing literature shows that numerous models were developed to measure performance by using critical success factors, performance measures, and indicators. However, they mostly address metric requirements for the manufacturing industries rather than construction. Studies conducted in the construction industry have placed more emphasis on the measurement of project performance rather than company performance [11]. The methodology, shown in Figure 1, is summarized stepwise as follows:
  • A literature review was conducted to identify the factors that impact the performance of the construction organizations. Factors shortlisted from the literature review were analyzed for their impact on the performance of the construction organization. These factors were also referred to as Critical Success Factors (CSFs).
  • Based on the literature review conducted, factors that have an impact on organizational performance were shortlisted. The proposed performance assessment model included both qualitative and quantitative factors. The model was developed in order to determine the overall performance in terms of the category of rank. Due to the nature of the research question, the researcher adopted a mixed-method qualitative and quantitative approach.
  • A questionnaire was designed to evaluate the impact and implementation of the shortlisted non-financial CSFs in their respective organizations. The questionnaire also asked about the participant’s total number of experiences, the designation held in the current organization, and the name of the organization. The questionnaire was distributed to professionals across the construction industry via in-person interaction, emails, and an online Qualtrics survey.
  • Simultaneously, a database for quantitative factors was compiled for all organizations, whose employees participated in the survey. From this data, factors representing financial trend analysis and market diversification of organization were calculated.
  • Analytic Hierarchical Process (AHP) was used to shortlist 18 qualitative factors. The impact rating of the 18 factors was derived from participants as an expert opinion. The results of this process was validated from the Best Subset Regression function. The subset with the highest Rsq and adjusted Rsq was used for modeling purposes.
  • A performance assessment model for the construction organization was developed using a Hierarchical Fuzzy Expert System. As the number of factors was extensive and their values were on different scales, it was recommended to use the Hierarchical Fuzzy Expert System (HFES).
  • The first layer of HFES was developed by building two sub-models of the fuzzy expert system for non-financial (qualitative) factors and financial (quantitative) factors. The input variables were the respective sub-factors, and the output was the impact value of the combined effect of sub-factors.
  • The output from the first layer was used as input for the second layer of the fuzzy expert system. The input variables were assigned fuzzy membership, and fuzzy relations were established. The defuzzification gave the category of the rank of the organization.
  • The model was tested and mathematically validated by Average Validity Percentage (AVP) and Average Invalidity Percentage (AIP) in order to determine the accuracy in assessing the performance of the construction organization [41].

4. Study Variables

The study aims at evaluating organizational performance based on both financial and non-financial parameters. Hence, the study variables were categorized into three broad categories—that is, Non-financial parameters, Financial parameters, and Market Conditions—as presented in Figure 2.

4.1. Independent Variables

This study aims at assessing the qualitative factors with quantitative factors. Independent variables are the input variables that determine the value of output or dependent variable. Based on the literature review, 18 qualitative factors were shortlisted for non-financial critical success factors, as shown in Figure 2. These factors have previously been investigated in a study conducted by Elwakil et al. [42] and Rathore and Elwakil [7]. The qualitative variables were categorized into four categories—i.e., Administrative and Legal; Technical; Management and Market and Finance—as presented in Figure 3.
A total of 18 quantitative factors were identified for the study. These include financial factors representing organization growth and market diversification. Based on the publicly available financial information, factors pertaining to revenue and annual growth were included in the model. A longitudinal database of revenue for organizations for the past five years was compiled. The factors included annual growth rate in revenue, three years cumulative, percent of different market segment revenue, productivity (revenue/employee), the total number of years in business, and firm size (number of employees), as shown in Figure 3. Figure 4 shows the financial factors compiled from the publicly available data. Additionally, the Market Diversification of an organization was measured by Entropy, which was computed using Equation (1).

4.2. Dependent Variables

The dependent variable was the rank of the organization published by ENR Top 400 Contractors and ENR Top 500 Design Firm Sourcebook 2015 [43]. The rank was inversely proportional to the revenue of the organization in the year 2015. The higher the revenue earned, the smaller the rank. To maintain the confidentiality of the organizations, the rank was categorized into categories—i.e., 1–100, 101–200, 201–300, 301–400, 401–500, and 501 and above. This variable was also the output in the model.

5. Data Collection

The data collection procedure included a literature review and the identification of potential critical success factors. Eighteen non-financial factors were shortlisted. Then, the questionnaire designed to assess the impact and implementation of these factors in the construction industry was prepared. A total of 300 questionnaires were sent out to organizations, out of which 130 responses were received—that is a response rate of 43.3%. Approximately 40 responses were incomplete or had missing information about the company they worked for, which made it impossible to link the financial information. Hence, incomplete responses were excluded. Ninety percent of responses were used for this study, as presented in Figure 5 and Figure 6. Out of the 90 responses, 72 responses were used for training and modeling purposes, and 18 responses were kept aside for validation purposes. The following results were obtained from the responses to the survey questionnaire. The total number of variables, including qualitative and quantitative, added up to 32 variables. Since the number of variables was very high, it was imperative to rank and determine the significant factors. To rank the factors, Regression Best Subset Analysis was carried out using Minitab © 17 and Analytic Hierarchy Process (AHP), followed by Hierarchical Fuzzy Expert System modeling using Fuzzy Logic Toolbox Matlab 2015. The model was tested and validated mathematically by Average Validity Percentage (AVP) and Average Invalidity Percentage (AIP).
E n t r o p y = i = 1 n ln 1 p i
where pi: Revenue share of the ith segment in total firm revenue, n: Number of Market segments.

6. Model Building and Analysis

The total number of independent variables, both qualitative and quantitative, added up to a total of 32 variables. The number of variables was vast, and hence to perform further analysis, we needed to shortlist the factors that contributed to the performance of an organization. For the initial analysis of data, to check for correlation between variables, regression analysis using Minitab © was carried out. Such results did not indicate a high correlation between factors; instead, the number of variables was vast, and no correlation could be identified, hence making it all the more necessary to reduce the factors. Different methods exist to shortlist the factors. Since we were dealing with 18 qualitative factors, the Analytic Hierarchy Process was a suitable method to determine the significance of factors by comparison with other factors within a category.

6.1. Analytic Hierarchy Process (AHP)

The Analytic Hierarchy Process (AHP), developed by Thomas Saaty in 1977, is a multi-criteria decision-making process of qualitative factors when arranged in a hierarchical process [44]. The process allows for making complex decisions by aiding users in organizing information pertaining to thoughts, knowledge, and judgment into a hierarchical framework and quantifying the effect of the qualitative factors by a sequence of pairwise comparison judgments [44]. In this study, AHP was used to evaluate the significance of qualitative factors on organizational performance. The procedure to carry out AHP, as shown in Figure 6, consists of the following steps:
  • First, the hierarchy of factors is established, as well as the selection of criteria. The top-level shows the goal of the problem “Organizational Performance.” The intermediate levels contain the qualitative or non-financial parameters that are categorized into four main categories (i.e., Administrative and Legal, Technical, Management, and Market and Finance). The next level or sub-level includes 18 sub-factors (i.e., Clear Vision; Mission and Goals; Competitive Strategy; Organizational Structure; Political Conditions; Number of Full-Time Employees; Usage of International Aspects (ISO); Availability of knowledge Usage of IT; Business Experience; Product Maintenance; Employee Culture Environment; Employee Compensation and Motivation; Applying Total Quality Management; Training; Quick Liquid Assets; Feedback Evaluation; Research and Development; Market Conditions/Customer Engagement. The layout of the hierarchy helps decision-makers to assess the relationship between factors, as well as showing if the factors have the same magnitude [45].
  • The second step involves the priority setting of criteria by pairwise comparison matrices for the main factors. Based on the impact rating of the 18 factors, a matrix is assigned with an overall rating for four main factors—i.e., Administrative and Legal, Technical, Management and Market and Finance, and their subfactors. Figure 7 shows the analysis of pairwise comparison matrices for average values of main factors and their sub-factors.
  • The third step is assigning priorities and establishing a pairwise comparison for sub-factors within each main category. This step involves the average values of the sub-factor within one main factor. The AHP methodology applied to these matrices gives the weight factor of each factor (Wi). Table 1 shows the weights of factors.
  • The fourth step is Consistency Analysis. This step verifies the consistency of the pairwise comparison matrix. Weights can be accepted if the matrix is consistent. Therefore, consistency index (CI) and the consistency ratio (CR) are calculated using Equations (2) and (3) [45].
    CI   =   λ m a x     m m 1
    CR = CI RI
    where CI is the matrix consistency index, m is matrix size, and λmax is the maximum eigen value.
  • Table 2 shows CI and CR for the main factors. It also shows that CI for main factors is 0.00000149, and CR is 0.00, which is less than 0.10. This means that the primary matrix is consistent, and the weight vectors generated for this matrix are acceptable.
  • The process is repeated for sub-factors. Table 3 shows the weights for the main factors and sub-factors, followed by a calculation of Average Decomposed weight. The decomposed weight is calculated by multiplying the main factor weight by its sub-factor weight. The decomposed weight represents the overall weight of each of the sub-factors [45]. Overall Sub-factor Decomposed Weight is calculate using Equation (4).
    S D W i j = W i ( V i j )
    where Wi is the weight of factor i and Vij is the weight of sub-factor j within the factor i.
  • The graphical presentation in Figure 8 shows the Average decomposed weights. It can be seen that the weight of factors are ranked very carefully. In this case, it becomes essential that an appropriate cutoff weight is chosen to shortlist factors. To select a cutoff weight, we need to consider the mean of the average weights and find the most considerable difference in weights between two factors. The average decomposed weight of all sub-factors is 0.0556. The difference between the weights of sub-factor, Availability of knowledge and Employee Compensation and Motivation is 0.00197. Hence, this is taken as the cutoff weight. Thus, from the AHP method, we shortlisted seven factors—i.e., Market Condition/Customer Engagement, Employee Culture Environment, Clear Vision Mission Goals, Business Experience, Competitive Strategy, Training for Employees, and Availability of Knowledge. To verify the factors, the next step is to verify the results with stepwise regression in Minitab 17.

6.2. Regression Analysis

In this step, the Best Subset Regression function was used where Rsq increases with the number of variables added to the equation; however, Rsq(adj) varies as a peak, and it increases only if the added variable contributes to a better fit of the equation. The best subset reported is the highest Rsq and Rsqadj value. Additionally, Mallow’s coefficient Cp should be equal or close to equal to the number of variables, as shown in Table 4 [45].
For this data, the best subset identified included 20 factors (qualitative and quantitative). After multiple iterations for various subsets shortlisted from AHP, the best subset analysis was carried out. The highest Rsq value achieved was 88.92%, Rsqadj, at 78.97%. Figure 9 shows the seven shortlisted qualitative variables for modeling purposes. There are two main reasons for this. Firstly, the model deals with personal opinions, which are highly qualitative and difficult to model. Secondly, the majority of participants who responded in the survey fall between rank 1 to 200. Therefore, this model can best predict the ranking for organizations that fall between this range. This was the main reason for not utilizing the regression prediction model to assess organizational performance assessment.

6.3. Fuzzy Logic Modelling

Human reasoning, being more approximate than precise, often makes it difficult to measure and determine the measure of factors affecting a particular cause. Fuzzy logic can be used as a tool to understand the imprecision and qualitative aspects of natural language and imprecise cognitive reasoning [35]. Fuzzy logic-based systems are used to analyze and process linguistic inputs to derive outputs or decisions [46]. Matlab R2015a Fuzzy Logic ToolBox software is used to process fuzzy logic inference.

6.3.1. Hierarchical Fuzzy Expert System

The hierarchical fuzzy model consists of sub-models, which correspond to the three main categories. In addition to the sub-model, there is one more model that combines the outputs of these sub-models in order to generate the rank of the organization. The fuzzy structure of each of the models is identical. The membership function assigned to input variables and the knowledge-based rules differ. When dealing with a high number of variables, as in this study, the total number of shortlisted independent variables is 20, developing a single layer fuzzy model is not recommended.
The qualitative variables were measured on a different scale compared to quantitative variables. For example, the annual growth rate was measure in percentage, and Entropy was measured in fractions or decimal values. Assigning weight to the membership on one layer is extremely difficult. The weight for an individual factor can be used for comparison within the same category. However, a sub-factor from the non-financial category cannot be compared to sub-factors from the financial category.
Additionally, for every variable, there should be 7–9 rules. To build a one-layer fuzzy model, the minimum number of rules required is more than 140 rules for 20 variables. The hierarchical model allows us to work with fewer rules. The sub-model for this study will be built using only 7–8 factors [47]. With a usable data set of 75 responses from the survey, the hierarchical system allows us to develop the prediction model. The set of responses required for knowledge-based rule training and testing is satisfied.
There are three models—two sub-models for financial and non-financial factors, and the third model for the second layer of the fuzzy model—which combine inputs of financial, non-financial, and market diversification factors, as shown in Figure 10. Since there is only one factor under market diversification, a separate sub-model will not be developed. The steps involved are as follows.

6.3.2. Assigning Membership Function

The existing literature review shows that different forms of membership function are used depending on the type of problem. The factor’s fuzzy membership is such that the real input can be converted into a fuzzy number value in the range [0,1].
  • For all the independent variables, the values were normalized so that they could be brought to scale between 0.0 to 1.0. The normalized data were calculated using Equation (5).
    z i = ( x i x m i n ) / ( x m a x x m i n )
  • The independent variables are assigned Gaussian membership function with a range from 0.0 to 1.0. In this study, we are dealing with expert opinions, and hence instead of giving it a crisp boundary, it is assigned a waveform membership. The membership function value and the corresponding range are shown in Table 5.
  • The relative weight of each factor at the first level of the hierarchy is determined—the normalized global weights calculated for each main factor and sub-factor. This step was carried out for sub-factors of financial and non-financial categories. Since only one factor falls under market diversification, the weight of only one factor was calculated at the factor level. The normalized global weights allow the sub-factors to be compared to each other. The globalized weight is calculated by multiplying the weight of the individual subfactor to the weight of the main factor [45]. The last column shows the normalized global weights. It shows that the Market condition and Customer Engagement factor is the highest weight at 1.000, closely followed by the Employee Culture Environment, which is second highest at 0.984, as shown in Table 6.
  • The next step involves the development of if–then rules—that is, the impact of sub-factor on the output—as shown in Table 7.
  • The independent factors serve as input factors. The normalized input values of the linguistic variables are multiplied by the sub-factor weight to evaluate the equivalent impact, as shown in Table 8.
  • The crisp output value received from the first layer of the hierarchical fuzzy model acts as input for the next layer of the hierarchy model.
  • The second level of the hierarchical fuzzy model is developed using the Fuzzy Logic Toolbox in Matlab R2015. The input variables for the second layer, which are numeric values, are assigned membership functions.
  • The input membership function shape is assigned Gaussian wave membership with five membership functions for each main factor. The range of each membership function is from zero to one, as shown in Figure 11.

6.3.3. Fuzzy Inference

The Mamdani type fuzzy model is selected in the fuzzy logic toolbox of Matlab R2015 with the maximum and minimum rule. The Mamdani is easier to understand and work with the consequent of the systems. The Mamdani method uses a simple structure of the Minimum operator, as shown in Equation (6).
R j = I f   x 1   i s   A 1   j   a n d   x 2   i s   A 2   j   a n d   x 3   i s   A 3   j .. a n d   x n   i s   A n   j   y   is   B j
where Rj is the j-th rule, A i   j (j = 1,2, N, i = 1, 2, n), and Bj is the fuzzy subsets of the inputs and outputs, respectively.
The minimum operator is used to calculate the firing strength of each fuzzy rule. The firing strength is directly proportional to the impact on the output. The rules are setup up in the if–then format.

6.3.4. Defuzzification

There are multiple defuzzification methods. In this study, the output factor is assigned a triangular shape with nine membership functions. The reason for the nine membership function is to increase the sensitivity and accuracy of the model, as shown in Figure 12. Output membership function maps the height corresponding to the firing strength of rules [48]. In this layer of fuzzy process, the output values are obtained through the defuzzification of the value of the centroid of the triangular membership assigned to the output variable. This numeric output is the predicted rank of the organization.

6.4. Verification of the Developed Model

To verify the developed model, 20% of the data set was left for testing purposes. To determine whether the model is verified or not when using results comparison as in this study, two terms can be used to determine the validity of the model, Average Validity Percent (AIP), and Average Invalidity Percent (AIP). The AVP represents the validation percent out of 100, and AIP represents the prediction error [49]. These two terms are shown in Equations (7) and (8).
AIP = ( i = 1 n | 1 ( E i C i ) | ) 100 / n
AVP = 100 AIP
where AIP is Average Invalidity Percent, AVP is Average Validity Percent, Ei is Estimated value, and Ci is Actual value.
Table 9 shows the validation data with a comparison of categories of actual organization rank and the predicted category of organization rank. The Average Invalidity Percentage is 36.667%. Therefore, the average validity percentage is 64.334%. Thus the model is stable.

7. Conclusion, Limitations, and Future Research Work

7.1. Summary

The performance of a construction organization depends on several success factors. Only a few research studies have focused on identifying and measuring the non-financial performance of the construction organization. This paper represents the development of a comprehensive framework to assess the performance of construction organizations based on 20 factors categorized into financial, non-financial, and market diversification, using a hierarchical fuzzy approach. The seven qualitative or non-financial critical success factors (i.e., Clear Vision, Mission, and Goals, Competition Strategy, Availability of Knowledge, Business Experience, Employee Culture Environment, Market Condition, and Customer Engagement) were selected using the Analytic Hierarchy Process (AHP) ranking system. In order to assess the combined impact of factors on the overall organization performance, they were modeled using a hierarchical fuzzy expert system. Fuzzy inputs and outputs and the rules governing them are designed using the data responses collected from industry professionals. The study is a step towards understanding a detailed analysis of factors that may impact overall performance. The developed models, methodology, and approach can help the construction companies to:
  • Determine the critical success factors that they need to improve to leverage the company performance.
  • Evaluate company performance rather than just project performance.
  • Predict company performance.

7.2. Conclusion

During this research, multiple points of observation and concern have been concluded from data response and analysis, such as:
  • The industry professionals rate the impact of Customer Engagement and Employee Cultural Environment as very high.
  • The ranking of the impact of critical success factors, such as Product Maintenance, Research, and Development, Usage of International Standards, and Political conditions, is very low. The average decomposed weight from the AHP process shows that construction industry rates impact investment in the Research and Development of in-house technologies to a low and medium extent. They mainly rely on products from computing firms.
  • The political condition in the USA is more conducive. In a previous study, in the survey which was sent out to middle eastern countries, the impact of political conditions factor was rated as high and very high [42].
  • The developed Hierarchical Fuzzy Model is based on the expert opinions of industry professionals. It is necessary to establish specific parameters or rubric, following which they answer the questionnaire. Personal bias leads to extensive outliers, thus making the model inefficient.
  • It is also observed that the majority of participants have rated the employee culture environment of their respective organizations as high and very high. However, the rating for employee compensation is low. This either represents that the employees of these organizations are not paid well, or the participants favor a better employee culture environment over employee compensation. This represents a personal bias in the responses.

7.3. Limitations

The developed model uses AHP to shortlist qualitative factors and hierarchical fuzzy expert system techniques to assess organizational performance. There are some inherent limitations in this model, such as:
  • The critical success factors have been shortlisted from the literature review and the impact rating from participants. There is a possibility that a factor could be left out if the frequency of appearance is low.
  • Furthermore, based on geographical conditions and socio-economic conditions, the model can only predict the ranking of organizations that fall in that geographic location.
  • The total number of collected questionnaires is 130. The model accuracy can be improved by increasing the number of participant responses that are used to develop knowledge-based rules of the fuzzy expert system, as well as considering companies that are widespread across the range of rankings.
  • The majority of the construction firms from which responses were received were not publicly listed. This limited the number of key financial performance factors, indicating factors that could be included in the model.
  • The first layer structure is not one of the types of Hierarchical Structures in MATLAB, so due to technical constraints, only the second layer of the hierarchical fuzzy expert model could be developed in Matlab R2015. The first layer was manually calculated to compute the combined impact of sub-factors in the sub-model.
  • The effect of choosing different methods of fuzzification and defuzzification methods and membership functions type.
  • Furthermore, the model can only predict the category of the rank, not the exact rank. To be able to make the model more accurate, data over a wide range of rank need to be collected.

7.4. Recommendation for Future Research Work

The developed research/model helps both researchers and practitioners to predict accurate company performance. Some of the recommendations and future works that can enhance the model and the research, in general, are listed below:
  • Develop rubrics for survey participants to rate their opinion without bias.
  • Collect quantitative information to validate the responses to qualitative questions.
  • Include more quantitative financial factors to improve the accuracy of the model by assessing the overall performance.
  • Reduce personal bias; multiple participants from the same organizations should participate in the survey.
  • Use the sensitivity analysis to evaluate the effect of the omitted factors in the shortlisting process.
  • The study shows a need for the further investigation of critical success factors to select the optimum number and nature for modeling the organization’s performance.
  • There is a need for considering the self-confidence of decision-makers through the social network [50,51].
  • The results of this research will lead to a new generation of specific and accurate company performance models and fully automated models/systems that might partially replace expert opinion techniques.

Author Contributions

Writing—original draft preparation, Z.R.; writing—review and editing, Z.R. and E.E. All authors have read and agreed to the published version of the manuscript.

Funding

This research received no external funding.

Conflicts of Interest

The authors declare no conflict of interest.

References

  1. Ozorhon, B. Analysis of construction innovation process at project level. J. Manag. Eng. 2013, 29, 455–463. [Google Scholar] [CrossRef]
  2. Veshosky, D. Managing innovation information in engineering and construction firms. J. Manag. Eng. 1998, 14, 58–66. [Google Scholar] [CrossRef]
  3. Kim, H.J.; Reinschmidt, K.F. Market structure and organizational performance of construction organizations. J. Manag. Eng. 2012, 28, 212–220. [Google Scholar] [CrossRef]
  4. Pinto, J.K.; Covin, J.G. Critical factors in project implementation: A comparison of construction and R&D projects. Technovation 1989, 9, 49–62. [Google Scholar]
  5. Müller, R.; Jugdev, K. Emerald Article: Critical success factors in projects: Pinto, Slevin, and Prescott-the elucidation of project success. Int. J. Manag. Proj. Bus. 2012, 5, 757–775. [Google Scholar] [CrossRef]
  6. Liu, H.; Wang, M.J.; Skibniewski, M.J.; He, J.S.; Zhang, Z.S. Identification of critical success factors for construction innovation: From the perspective of strategic cooperation. Front. Eng. Manag. 2014, 1, 202–209. [Google Scholar] [CrossRef] [Green Version]
  7. Rathore, Z.; Elwakil, E. A Framework of Organization Performance Assessment in the Construction Industry Using Fuzzy Approach. In Proceedings of the Canadian Society for Civil Engineering’s 5th International/11th Construction Specialty Conference, Vancouver, BC, Canada, 8 June 2015. [Google Scholar]
  8. Elwakil, E. Integrating analytical hierarchy process and regression for assessing construction organizations’ performance. Int. J. Constr. Manag. 2017, 17, 76–88. [Google Scholar] [CrossRef]
  9. Radwan, A.; Elwakil, E. Functional units based model for construction organizations performance. Int. J. Archit. Eng. Constr. 2015, 4, 194–203. [Google Scholar] [CrossRef]
  10. Amarkhil, Q.; Elwakil, E. Construction organization success strategy in post-conflict environment. Int. J. Constr. Manag. 2019, 23, 1–10. [Google Scholar] [CrossRef]
  11. Isik, Z.; Arditi, D.; Dikmen, I.; Birgonul, M.T. Impact of resources and strategies on construction company performance. J. Manag. Eng. 2010, 26, 9–18. [Google Scholar] [CrossRef] [Green Version]
  12. Cooke-Davies, T. The “real” success factors on projects. Int. J. Proj. Manag. 2002, 20, 185–190. [Google Scholar] [CrossRef]
  13. Chinowsky, P.S.; Meredith, J.E. Strategic management in construction. J. Constr. Eng. Manag. 2000, 126, 1–9. [Google Scholar] [CrossRef] [Green Version]
  14. Bontis, N.; Dragonetti, N.C.; Jacobsen, K.; Roos, G. The knowledge toolbox: A review of the tools available to measure and manage intangible resources. Eur. Manag. J. 1999, 17, 391–402. [Google Scholar] [CrossRef]
  15. Arthur, M.B. The boundaryless career: A new perspective for organizational inquiry. J. Organ. Behav. 1994, 15, 295–306. [Google Scholar] [CrossRef]
  16. Sims, H.P.; Gioia, D.A. The Thinking Organization; Jossey-Bass Inc. Pub: San Francisco, CA, USA, 1986. [Google Scholar]
  17. Weick, K.E. Organizational culture as a source of high reliability. Calif. Manag. Rev. 1987, 29, 112–127. [Google Scholar] [CrossRef]
  18. Hauser, J.; Katz, G. Metrics: You are what you measure! Eur. Manag. J. 1998, 16, 517–528. [Google Scholar] [CrossRef] [Green Version]
  19. Viner, J. Cost curves and supply curves. Zeitschrift Für Nationalökonomie 1932, 3, 23–46. [Google Scholar] [CrossRef]
  20. Simon, H.A.; Bonini, C.P. The size distribution of business firms. Am. Econ. Rev. 1958, 48, 607–617. [Google Scholar]
  21. Spendolini, M.J. The benchmarking processes. Compens. Benefits Rev. 1992, 24, 21–29. [Google Scholar] [CrossRef]
  22. Tang, Y.H.; Ogunlana, S.O. Modelling the dynamic performance of a construction organization. Constr. Manag. Econ. 2003, 21, 127–136. [Google Scholar] [CrossRef]
  23. Zayed, T.; Elwakil, E.; Ammar, M. A framework for performance assessment of organizations in construction industry. Int. J. Archit. Eng. Constr. 2012, 1, 199–212. [Google Scholar] [CrossRef]
  24. Gustavsson, T.K.; Gohary, H. Boundary action in construction projects: New collaborative project practices. Int. J. Manag. Proj. Bus. 2012, 5, 364–376. [Google Scholar] [CrossRef]
  25. Bititci, U.; Muir, D. Integrated performance measurement systems: A development guide. Int. J. Oper. Prod. Manag. 1997, 17, 522–556. [Google Scholar] [CrossRef]
  26. Vogl, B.; Abdel-Wahab, M. Measuring the construction industry’s productivity performance: Critique of international productivity comparisons at industry level. J. Constr. Eng. Manag. 2015, 141, 04014085. [Google Scholar] [CrossRef]
  27. Fisher, D.; Miertschin, S.; Pollock Jr, D.R. Benchmarking in construction industry. J. Manag. Eng. 1995, 11, 50–57. [Google Scholar] [CrossRef]
  28. Pinto, J.K.; Slevin, D.P. Critical factors in successful project implementation. IEEE Trans. Eng. Manag. 1987, 1, 22–27. [Google Scholar] [CrossRef]
  29. Pinto, J.K.; Mantel, S.J. The causes of project failure. IEEE Trans. Eng. Manag. 1990, 37, 269–276. [Google Scholar] [CrossRef] [Green Version]
  30. Neely, A.D.; Adams, C.; Kennerley, M. The Performance Prism: The Scorecard for Measuring and Managing Business Success; FT Prentice Hall: London, UK, 2002. [Google Scholar]
  31. Harrison, P. Can Measurement Error Explain the Weakness of Productivity Growth in the Canadian Construction Industry? 2007. Available online: https://core.ac.uk/download/pdf/7033340.pdf (accessed on 14 July 2018).
  32. Costa, D.B.; Formoso, C.T.; Kagioglou, M.; Alarcón, L.F.; Caldas, C.H. Benchmarking initiatives in the construction industry: Lessons learned and improvement opportunities. J. Manag. Eng. 2006, 22, 158–167. [Google Scholar] [CrossRef]
  33. Neely, A.; Gregory, M.; Platts, K. Performance measurement system design: A literature review and research agenda. Int. J. Oper. Prod. Manag. 1995, 15, 80–117. [Google Scholar] [CrossRef]
  34. Choi, J.; Russell, J.S. Long-term entropy and profitability change of United States public construction firms. J. Manag. Eng. 2005, 21, 17–26. [Google Scholar] [CrossRef]
  35. Zadeh, L.A. Fuzzy logic. Computer 1988, 21, 83–93. [Google Scholar] [CrossRef]
  36. Chan, A.P.; Chan, D.W.; Yeung, J.F. Overview of the application of “fuzzy techniques” in construction management research. J. Constr. Eng. Manag. 2009, 135, 1241–1252. [Google Scholar] [CrossRef] [Green Version]
  37. Nguyen, T.A.; Perkins, W.A.; Laffey, T.J.; Pecora, D. Checking an Expert Systems Knowledge Base for Consistency and Completeness. 1985. Available online: https://www.ijcai.org/Proceedings/85-1/Papers/070.pdf (accessed on 19 August 2018).
  38. Fayek, A.R.; Oduba, A. Predicting industrial construction labor productivity using fuzzy expert systems. J. Constr. Eng. Manag. 2005, 131, 938–941. [Google Scholar] [CrossRef]
  39. Sargent, D.J. Comparison of artificial neural networks with other statistical approaches: Results from medical data sets. Cancer Interdiscip. Int. J. Am. Cancer Soc. 2001, 91, 1636–1642. [Google Scholar] [CrossRef]
  40. Nasir, H.; Haas, C.T.; Rankin, J.H.; Fayek, A.R.; Forgues, D.; Ruwanpura, J. Development and implementation of a benchmarking and metrics program for construction performance and productivity improvement. Can. J. Civ. Eng. 2012, 39, 957–967. [Google Scholar] [CrossRef]
  41. Rathore, Z. A Framework for Organizational Performance Assessment in the Construction Industry. Master’s Thesis, Purdue University, West Lafayette, IN, USA, 2016. [Google Scholar]
  42. Elwakil, E.; Ammar, M.; Zayed, T.; Mahmoud, M.; Eweda, A.; Mashhour, I. Investigation and modeling of critical success factors in construction organizations. In Proceedings of the Construction Research Congress 2009, Seattle, WA, USA, 5–7 April 2009; pp. 350–359. [Google Scholar]
  43. Engineering News Record. ENR Top 400 Contractors and ENR Top 500 Design Firm Sourcebook 2015. Available online: https://www.enr.com/toplists/Sourcebook (accessed on 26 August 2018).
  44. Saaty, T.L. How to make a decision: The analytic hierarchy process. Eur. J. Oper. Res. 1990, 48, 9–26. [Google Scholar] [CrossRef]
  45. Fares, H.; Zayed, T. Hierarchical fuzzy expert system for risk of failure of water mains. J. Pipeline Syst. Eng. Pract. 2010, 1, 53–62. [Google Scholar] [CrossRef]
  46. Elwakil, E.; Zayed, T. Construction productivity fuzzy knowledge base management system. Can. J. Civil Eng. 2018, 45, 329–338. [Google Scholar] [CrossRef] [Green Version]
  47. Fayek, A.R.; Tsehayae, A.A. Modeling Construction Labor Productivity Using Fuzzy Logic and Exploring the Use of Fuzzy Hybrid Techniques. In Proceedings of the IEEE 2012 Annual Meeting of the North American Fuzzy Information Processing Society (NAFIPS), Berkeley, CA, USA, 6–8 August 2012; pp. 1–6. [Google Scholar]
  48. Chao, L.C.; Skibniewski, M.J. Fuzzy logic for evaluating alternative construction technology. J. Constr. Eng. Manag. 1998, 124, 297–304. [Google Scholar] [CrossRef]
  49. Dawood, T.; Elwakil, E.; Novoa, H.M.; Delgado, J.F. Pressure Data-Driven Model for Failure Prediction of PVC Pipelines. Eng. Fail. Anal. 2020, 28, 104769. [Google Scholar] [CrossRef]
  50. Zhang, Z.; Kou, X.; Yu, W.; Gao, Y. Consistency improvement for fuzzy preference relations with self-confidence: An application in two-sided matching decision making. J. Oper. Res. Soc. 2020, 22, 1–4. [Google Scholar] [CrossRef]
  51. Zhang, Z.; Gao, Y.; Li, Z. Consensus reaching for social network group decision making by considering leadership and bounded confidence. Knowl. Based Syst. 2020, 10, 106240. [Google Scholar] [CrossRef]
Figure 1. Research framework.
Algorithms 13 00205 g001
Figure 2. Study variables.
Algorithms 13 00205 g002
Figure 3. Non-financial critical success factors.
Algorithms 13 00205 g003
Figure 4. Financial critical success factors.
Algorithms 13 00205 g004
Figure 5. Data response.
Algorithms 13 00205 g005
Figure 6. Layers/Levels in the Analytic Hierarchy Process.
Algorithms 13 00205 g006
Figure 7. Pairwise comparison matrix.
Algorithms 13 00205 g007
Figure 8. Decomposed weights for sub-factors.
Algorithms 13 00205 g008
Figure 9. Shortlisted qualitative variables.
Algorithms 13 00205 g009
Figure 10. Overall Hierarchical Fuzzy Model.
Algorithms 13 00205 g010
Figure 11. Membership functions assigned to the input variable.
Algorithms 13 00205 g011
Figure 12. Membership function assigned to the Output variable.
Algorithms 13 00205 g012
Table 1. Eigen vector weights (Wi) for the main factors.
FactorsWeight (Wi) Eigen VectorsC.I. = max − N/N − 1C.R. = C.I./R.I
Administrative and Legal0.28130.000001490.00000000
Technical0.2653
Management0.2349
Market and finance0.2185
Table 2. Random Consistency Index.
N12345678910
RI000.580.91.121.241.321.411.451.49
Table 3. Factor and sub-factor weights.
FactorsAve. Weight-Main FactorsAve. Sub-Factors WeightAve. Decomposed Weight
Administrative and Legal0.2813
Clear Vision Mission and Goals 0.22440.0631
Competitive Strategy 0.21760.0612
Organization Structure 0.20630.0580
Political Conditions 0.15660.0441
No. of Full-time Employees 0.19510.0549
Technical0.2653
Usage if International Standards (ISO) 0.13360.0355
Availability of Knowledge 0.22840.0606
Usage of IT 0.21590.0573
Business Experience(no. of years) 0.23380.0620
Product Maintenance 0.18830.0499
Management0.2349
Employee Culture Environment 0.26960.0633
Employee Compensation and Motivation 0.24950.0586
Applying Total Quality Management (TQM) 0.22070.0518
Training for employees 0.26010.0611
Market and Finance0.2185
Employee Culture Environment 0.23610.0516
Employee Compensation and Motivation 0.24620.0538
Applying Total Quality Management (TQM) 0.21400.0468
Training for employees 0.30370.0663
Table 4. Regression analysis best subset.
SourceDFAdj SSAdj MSF-Valuep-Value
Regression356.5660.1878.940.000
Growth Rate 1 year10.00730.00730.350.557
CAGR 3 years10.00000.00000.000.994
General Building10.01750.01750.830.367
Manufacturing10.31130.311314.840.000
Power10.12740.12746.070.018
WWS10.41730.417319.890.000
Industrial10.13370.13376.370.016
Transportation10.01400.01400.670.419
Hazardous Waste10.41510.415119.780.000
Telecom10.28150.281513.420.001
% CM at risk10.03730.03731.780.190
Revenue per employee ($MIL)10.23400.234011.160.002
No. of employees10.01370.01370.660.423
Total number of years in business10.04530.04532.160.150
Market diversification entropy10.08501.085051.710.000
Clear vision mission and goals40.48510.12125.780.001
Competitive strategy20.64490.322415.370.000
Availability of knowledge30.03240.01080.520.674
Business experience30.28850.09624.580.008
Employee cultural environment30.30150.10054.790.006
Training for employee30.05750.01910.910.443
Market condition/customer engagement20.11030.05522.630.085
Error390.81830.0209
Total747.3846
Table 5. Membership function range value.
RangeMembership Function
0.0–0.2Very High
0.2–0.4High
0.4–0.6Moderately low
0.6–0.8Low
0.8–1.0Very Low
Table 6. Factor and sub-factor weights, globalized weights and normalized weights.
Main FactorsFactor WeightSub-FactorSub-Factor WeightStd DevGlobal WeightNormalized Global Weights
Non-financial64.84Clear Vision Mission and Goals15.214.14986.410.904
Competitive Strategy15.304.31991.920.910
Availability of Knowledge15.213.29986.410.904
Business Experience (no. of years)8.354.93541.600.475
Employee Culture Environment16.494.191069.070.984
Training for employees12.694.68822.920.747
Market Conditions/Customer Eng16.743.791085.601.000
Financial30.10Growth Rate 1 year 29.375.22282.110.225
CAGR 3 year 318.379.34552.880.486
General Building 428.5418.35858.960.781
Manufacturing 52.906.4487.330.037
Power 64.218.95126.620.075
WWS 72.165.4664.900.016
Industrial/Petroleum 87.9717.28239.970.184
Transportation 93.136.5494.320.044
Hazardous Waste 101.626.3148.790.000
Telecom2.335.9370.130.021
% CM at Risk 1210.7713.59324.100.266
Revenue per employee8.637.13259.900.204
Market5.06Diversification Entropy1000506.070.441
Table 7. If-then rules for sub-factors.
Factor Impact on Organizational Performance
If Clear Vision Mission and Goals isVery HighthenImpact of non-financial factor isVery High
If Clear Vision Mission and Goals isHighthenImpact of non-financial factor isHigh
If Clear Vision Mission and Goals is Moderately low thenImpact of non-financial factor is Moderately low
If Clear Vision Mission and Goals isLowthenImpact of non-financial factor isLow
If Clear Vision Mission and Goals isVery LowthenImpact of non-financial factor isVery Low
Table 8. Sub factor weights and equivalent impact.
Rule No.Clear VisionCompetitive StrategyAvailability of KnowledgeBusiness ExpEmployee CultureTraining EmployeesMarket Conds/
Customer Eng
Equivalent ImpactCombined Impact
15.2115.3015.218.3516.4912.6916.74
10.750.500.750.500.750.330.756.38High
20.750.500.750.041.000.671.007.25High
30.750.751.000.561.001.001.008.87Very high
40.750.500.750.511.000.671.007.64High
50.751.000.750.100.750.670.757.24High
61.000.751.000.101.000.671.008.44Very high
71.001.000.750.430.750.671.008.31Very high
81.001.001.000.430.501.001.008.70Very high
90.500.500.500.280.500.330.504.61Moderate
101.001.001.000.281.001.001.009.39Very high
110.750.750.500.280.500.331.006.20High
121.000.750.500.111.000.331.007.27High
130.251.000.500.040.250.330.754.80Moderate
140.500.501.000.460.500.670.756.36High
151.000.751.000.501.001.000.758.78Very high
Table 9. Validation results.
Rank Category (C)Predicted Rank Category (E)ABS(1-(E/C))
110.00
210.50
410.75
550.00
110.00
220.00
310.67
310.67
251.50
310.67
110.00
350.67
110.00
110.00
220.00
AIP%36.11

