Abstract
Determining contingency reserve is critical to project risk management. Classic methods of determining contingency reserve significantly rely on historical data and fail to effectively incorporate certain types of uncertainties such as vagueness, ambiguity, and subjectivity. In this paper, an interval type-2 fuzzy risk analysis model (IT2FRAM) is introduced in order to determine the contingency reserve. In IT2FRAM, the membership functions for the linguistic terms used to describe the probability, impact of risk and the opportunity events are developed, optimized, and aggregated using interval type-2 fuzzy sets and the principle of justifiable granularity. IT2FRAM is an extension of a fuzzy arithmetic-based risk analysis method which considers such uncertainties and addresses the limitations of probabilistic and deterministic techniques of contingency determination methods. The contribution of IT2FRAM is that it considers the opinions of several subject matter experts to develop the membership functions of linguistic terms. Moreover, the effect of outlier opinions in developing the membership functions of linguistic terms are reduced. IT2FRAM also enables the aggregation of non-linear membership functions into trapezoidal membership functions. A hypothetical case study is presented in order to illustrate the application of IT2FRAM in Fuzzy Risk Analyzer© (FRA©), a risk analysis software.
1. Introduction
Dealing with uncertainties is an unavoidable challenge of every project. The effect of uncertainties on project objectives, which may be positive or negative, can be controlled by implementing a risk management process. Risk management starts with developing the risk management plan, which determines how risk management activities will be structured, funded, and performed. Subsequently, the risk events must be identified and documented. Then, these events must be analyzed qualitatively and quantitatively in order to be prioritized based on their probability and impact, and to determine the contingency reserve. Response strategies must be identified, assessed, and implemented in order to control the probability of occurrence and/or the impacts of the events. Finally, the effectiveness of the risk management process throughout the project must be evaluated and controlled. In this paper, to highlight the importance of uncertainties with positive effects, “risk event” and “opportunity event” are defined as uncertain events or conditions that can negatively or positively affect the project objectives, respectively.
To deal with uncertain events, there are two types of reserves in a project, namely management and contingency reserves, that must be calculated and considered in the project budget. Contingency reserve is defined as the money or time allocated in the cost or schedule baseline to reduce the overruns of project objectives due to known risks and opportunities [1,2]. The management reserve is an amount of project budget that is reserved to handle unforeseen events [2]. The project budget is the summation of the cost baseline and management reserve. The cost baseline is made up by adding the cost estimates of all work packages with contingency reserve [2]. Ahmadi-Javid et al. [3] categorized uncertain events into two main groups: (1) unknown unknowns that must be addressed with management reserve, and (2) known unknowns that must be addressed proactively (i.e., by employing avoiding, mitigating, and transferring strategies for risks and also exploiting, enhancing, and sharing strategies for opportunities) or reactively (i.e., by employing active and passive accepting strategies). Those events that are addressed by applying proactive response strategies or active acceptance response strategies are dealt with using contingency reserve. Risk and opportunity events addressed with passive acceptance response strategies are dealt with using management reserve [1,4]. Contingency reserve is a key tool for the decision makers of a project for controlling and responding to risks and opportunities.
Allocating too little or too much for the contingency reserve amounts required for a project may result in significant losses and inefficient resource management [5]. The accurate estimation of contingency leads to achieving project objectives (e.g., schedule and cost objectives) [5,6]. Moreover, different uncertainties need to be considered in calculating contingency reserve. Helton [7] first defined the dual nature of uncertainty by categorizing it into “objective uncertainty” and “subjective uncertainty.” Objective uncertainty refers to the variability that comes from the stochastic characteristic of an environment and its concepts rooted in probability theory. Subjective uncertainty stems from employing approximate reasoning and linguistically expressed expert knowledge. Fayek and Lourenzutti [8] break down subjective uncertainty into vagueness, ambiguity, and subjectivity. Vagueness results from the lack of sharpness of relevant distinctions. Ambiguity stems from the lack of certain distinctions characterizing an object, from conflicting distinctions, or from both. Subjectivity results from the influence of personal beliefs or feelings rather than facts [9]. Classic techniques of calculating the contingency reserve have serious drawbacks and fail to consider vagueness, ambiguity, and subjectivity uncertainties. On the one hand, deterministic approaches, which are based on the intuition and experience of experts, have difficulty calculating the exposure of risk events and determining the appropriate contingency applying to a single crisp value [10]. Moreover, deterministic techniques fail to consider opportunities. On the other hand, in the probabilistic approaches, the value of contingency reserve can be affected by the lack of quality and quantity in historical data, since these techniques significantly rely on historical data [5]. Additionally, probabilistic techniques assume that cost variations are inherently random. Many find it difficult to perform an accurate and precise risk assessment, since the data are either scarce or of low quality [11].
Fuzzy logic, which is based on the fuzzy set theory developed by Zadeh [12,13], fills the gap for classic techniques as it handles such uncertainties. Applying fuzzy logic, experts are able to assess the probability and impact of events with linguistic terms such as very low, medium, and high, which can be represented by fuzzy numbers [14]. Fuzzy numbers are a special type of fuzzy sets employed to represent the values of real-world parameters when the exact amounts cannot be measured due to a lack of information or knowledge [15]. Reviewing the literature shows that fuzzy logic alone or as integrated with other techniques can be employed to address the limitations associated with classic contingency reserve determination tools and techniques. A hybrid method that integrates the fuzzy set theory with the Monte Carlo simulation, proposed by Iranmanesh et al. [10], can handle both random and subjective uncertainties. However, this suggested method fails to determine the individual effect of each risk event, and instead calculates the range estimation of the combined effect of risk events. Another method proposed by Nieto-Morote and Ruz-Vila [16] combines the analytic hierarchy process (AHP) with fuzzy set theory to prioritize different risk factors in a building project. However, this proposed fuzzy AHP method [16] fails to deal with definite scales and has a high potential of encountering inconsistencies during pairwise comparison. In another study [17], fault tree analysis (FTA) and fuzzy set theory are integrated for the quantitative assessment of risk events; however, this hybrid approach is unable to handle the drawbacks of the FTA method, which does not model large systems and is inflexible for incorporating later changes. Failure mode and effect analysis (FMEA), AHP, and fuzzy set theory are combined by Abdelgawad et al. [15] to assess risks and determine contingency; however, establishing clearly defined terms for its input and output variables requires a significant effort. To capture the interdependencies among different risk events and variables, a fuzzy system dynamic model [18] has been proposed; however, it has difficulty establishing the feedback loops and the mathematical equations. Fateminia et al. [1] proposed using fuzzy arithmetic-based risk analysis method (FRAM) to fill the gap by addressing the imprecision in measurement and the subjective uncertainty inherent in experts’ estimations. FRAM applies a fuzzy arithmetic procedure that solves the problem of substantial reliance on historical data in probabilistic methods. The fuzzy arithmetic procedure employs expert judgment, linguistic scales, and fuzzy numbers resulting in the flexibility of FRAM. Moreover, experts are able to customize linguistic scales and fuzzy numbers for different types of projects and phases. FRAM also considers risk attitude in terms of its contingency calculation and output determination methods. Compared to fuzzy FMEA [15], FRAM does not rely on complicated failure cause-and-effect scenarios in its computation procedures. Moreover, FRAM does not depend on feedback loops with complex mathematical equations when several variables are considered in the fuzzy system dynamics model [18]. Moreover, FRAM addresses the measurement imprecision and the subjective uncertainty of experts’ opinions when assessing the probability and impact of risks and opportunities. Finally, FRAM enables risk analysts to estimate contingency at different levels of confidence.
FRAM has limitation despite all the mentioned advantages. To implement FRAM in practice, it is necessary to determine the membership functions of linguistic terms pertaining to risk probability, risk impact, opportunity probability, and opportunity impact. FRAM does not propose a systematic method for determining the membership functions of linguistic terms for probability and impact, which are the foundations of its risk analysis process. Moreover, FRAM fails to aggregate the opinions of different subject matter experts (SMEs) about the membership functions of the aforementioned linguistic terms. The membership functions of linguistic terms can vary depending on how the characteristics of each project affect experts’ judgements based on their risk attitude, knowledge, experience, and so on. In general, the two main categories of estimating membership functions are expert-driven and data-driven approaches [19]. In expert-driven approaches, the elicitation of membership functions is considered as a process of knowledge acquisition via eligible experts. The most common method in expert-driven approaches is the AHP [20], which enables experts to perform pairwise evaluations of alternatives in order to determine their membership function. Membership functions in data-driven approaches, however, are elicited based on the organization (structuring) of data, such as in fuzzy clustering [21]. There are some limitations to eliciting membership functions through the aforementioned approaches. For example, AHP, as the most common expert-driven method, is not applicable in forming the membership functions of risk analysis linguistic terms in FRAM. To employ AHP, all risks and opportunities must be considered as alternatives for pairwise comparison, which can be impossible or very time-consuming. Moreover, the aggregation of different opinions of SMEs is impossible through AHP. Besides, according to Pedrycz and Wang [19], there are no explicit performance indexes invoked by the AHP approach. However, since industries suffer from accessing qualified data about risk management, data-driven approaches are not applicable in most cases. Moreover, they may cause fuzzy sets that are not semantically meaningful, which means that fuzzy clustering could result in some “crowded” fuzzy sets with unclear meaning and they would need to be optimized [19]. These further adjustments during the optimization process could hinder the interpretability aspect. Various optimization methods are employed to adjust fuzzy sets including the simulated annealing algorithm [22], genetic algorithm [23,24], and tabu search [25].
To address these gaps, the objective of this paper is to propose an interval type-2 fuzzy risk analysis model (IT2FRAM) that extends FRAM [1] for determining contingency reserve. The proposed method employs interval type-2 fuzzy sets (introduced by Zadeh [14]) in order to provide a broader knowledge representation and approximate reasoning for computing with words. Because “words mean different things to different people” [26,27], wider knowledge representation in terms of a spread in membership values through type-2 fuzzy sets is more useful as compared to the standard fuzzy sets [27,28,29,30,31]. IT2FRAM aggregates the opinion of SMEs using optimized interval type-2 fuzzy sets. The principle of justifiable granularity [11] is employed for determining the optimized interval type-2 membership functions of risk analysis concepts (i.e., linguistic variables including probability and impact). This principle provides an alternative to clustering methods in constructing information granules based on the criteria of coverage and specificity of data [32]. However, fuzzy arithmetic using type-2 membership functions versus type-1 membership functions is computationally more demanding [21]. Thus, type-2 membership functions are type-reduced to type-1 or a standard membership function to perform the fuzzy arithmetic and the calculate crisp output values. The statistical representation of the optimized interval type-2 membership function is used to form a standard membership function, consequently enabling it to be used in a software tool such as the Fuzzy Risk Analyzer© (FRA©). A hypothetical case study is presented to illustrate the application of IT2FRAM in FRA©.
The rest of this paper is organized as follows. First, the basic definitions of required fuzzy arithmetic operations, type-2 fuzzy sets, and the principle of justifiable granularity are discussed and are necessary to model. Second, the use of IT2FRAM to determine the contingency reserve of projects is described. This model is developed to determine the optimized membership values of linguistic terms of probability and impact for risk and opportunity events. Then, a hypothetical case study was used to show how IT2FRAM can be implemented in practice using FRA©. Finally, the contributions and results of this research are presented, and potential future extensions are discussed.
2. Preliminaries Required in IT2FRAM
Fuzzy arithmetic operations, type-2 fuzzy set concepts, and the principle of justifiable granularity are applied in IT2FRAM. Fuzzy arithmetic enables IT2FRAM to employ natural language to assess risk and opportunity events and in turn, determine project contingency reserve by employing fuzzy numbers, which represent linguistic scales. The initial membership functions of linguistic terms are formed using interval type-2 fuzzy set concepts. The intervals of type-2 fuzzy sets are optimized applying the principle of justifiable granularity. Then, the optimized interval type-2 fuzzy sets are converted into standard fuzzy sets.
2.1. Fuzzy Arithmetic Operations in IT2FRAM
A fuzzy set is defined as a set of elements with a degree of membership varying between 0 and 1. The elements of crisp sets, however, have membership degrees of either 1 (fully belong in the set) or 0 (do not belong in the set) [12,33]. IT2FRAM uses either the α-cut technique (standard fuzzy arithmetic) or the extension principle based on different t-norms (extended fuzzy arithmetic) to perform fuzzy arithmetic operations. The standard fuzzy arithmetic is based on interval analysis and discretizes the input fuzzy numbers into several α-cuts. Then, the α-cut of the output is achieved by interval calculations on each α-level cut of the inputs. Subsequently, the union of the α-cuts is applied to gain the final fuzzy set based on the representation theorem. The mathematical representation of standard fuzzy arithmetic is illustrated in the following:
where A(x) and B(y) are input fuzzy numbers and C(z) is an output fuzzy number. The α-cuts of the input fuzzy numbers are represented by Aα and Bα, and ⊛ represents the basic arithmetic operations. The accumulation of fuzziness results in the overestimation of uncertainty in a standard fuzzy arithmetic method [34]. Extended fuzzy arithmetic is preferred in recent applications because of its capability to reduce uncertainty overestimation problems using any t-norm other than min t-norm [35,36,37]. Extended fuzzy arithmetic, developed by Zadeh [12,13,14], extends the domain of a function on fuzzy sets. It generalizes a common point-to-point mapping of a function to a mapping between fuzzy sets. As presented, in extended fuzzy arithmetic, the membership degree of each output is calculated by taking the supremum of the t-norms of the membership degrees of the inputs:
where t can be one of the common four t-norm operators on fuzzy sets, fuzzy number C(z) is the output, and fuzzy numbers A(x) and B(y) are the inputs. The t-norm t is a binary operation, , which is commutative, associative, and non-decreasing in each argument, and for each . The strength and continuity of common fuzzy t-norms (minimum, algebraic product, Lukasiewicz, and drastic product) are different. In terms of strength, the minimum t-norm is the highest and the drastic product t-norm is the lowest [34]. Furthermore, the changes in output fuzzy numbers result in continuous t-norms, which are less sensitive to the changes in input fuzzy numbers compared to non-continuous t-norms.
Various defuzzification methods are suggested in the literature. As illustrated in Figure 1, the single value (defuzzification) methods include the smallest of maximum (SOM), middle of maximum (MOM), largest of maximum (LOM), and the center of area (COA). The best representation of the shape of the output fuzzy number is the COA.
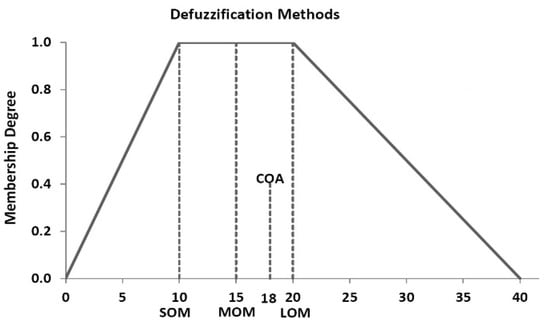
Figure 1.
Defuzzification methods used in the interval type-2 fuzzy arithmetic-based risk analysis model (IT2FRAM) and implemented in Fuzzy Risk Analyzer (FRA©): smallest of maximum (SOM), middle of maximum (MOM), largest of maximum (LOM), and center of area (COA).
The level of confidence associated with the range of output fuzzy number, represented by the confidence level, can be determined from the corresponding α-cut level (or possibility degree) and ranges between 0 and 1. The possibility degree is the difference between 1 and the confidence level (1—confidence level).
2.2. Associated Concepts of Type-2 Fuzzy Set
In IT2FRAM, the interval type-2 fuzzy sets are employed to represent the different opinions of a group of decision makers, or SMEs. This section presents brief introductions to the basic definitions, equations, and theorems associated with type-2 fuzzy sets, and the detailed theoretical background can be found in Mendel [26], Mendel and John [38], and Mendel et al. [39].
Definition 1.
A type-2 fuzzy set, denoted by
and represented by a type-2 fuzzy set membership function where and , is defined as
in which
.
can be expressed as
where denotes union over all admissible
and .
Definition 2.
If
is called an interval type-2 fuzzy set. Thus:
Interval type-2 fuzzy sets are a special case of general type-2 fuzzy set. Interval type-2 fuzzy sets can be defined based on vertical slice representation as
Definition 3.
Primary membership of
is the domain of a secondary membership function. Thus, in Equation (6), the primary membership of
is
, . The secondary grade is the amplitude of secondary membership function. For an interval type-2 fuzzy set, all secondary grades are equal to 1.
Definition 4.
Footprint of uncertainty (FOU) of
is the bounded region depicting the uncertainty in the primary membership function. It can be represented as the union of all the primary membership functions:
This is vertical slice representation of FOU.
In the case of an interval type-2 fuzzy set, FOU conveys all the necessary information; the secondary grades do not convey any new information. Knowledge of FOU is highly useful, because it highlights the inherent uncertainties of the type-2 fuzzy set membership functions whose shape indicates the nature of uncertainties. Furthermore, it helps in choosing appropriate type-2 fuzzy set membership functions. Some of the commonly used FOUs are shown in Figure 2.
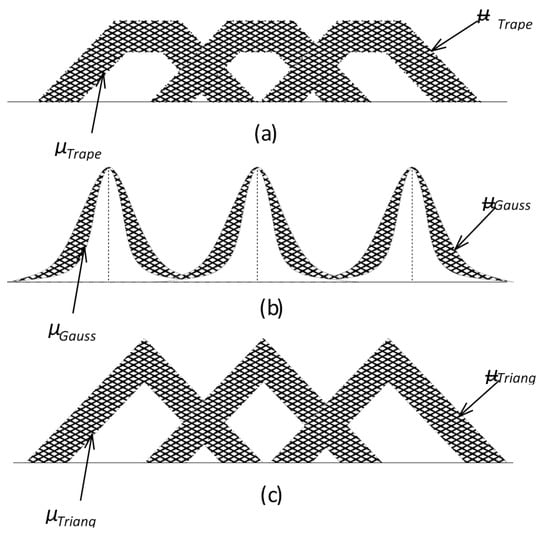
Figure 2.
Some commonly used footprints of uncertainty (FOUs) for type-2 fuzzy sets with primary membership functions: (a) trapezoidal, (b) Gaussian, and (c) triangular.
2.3. Interval Type-2 Fuzzy Set Modeling Using Uncertainty Degree
There are two methods of constructing interval type-2 fuzzy set models from data. One is the interval approach [28,40] and the other is the fuzzistics approach [27,30,31]. The former method involves the use of statistics to realize the interval type-2 fuzzy set modeling, whereas the latter uses a kind of uncertainty measure (mostly centroid) of interval type-2 fuzzy sets in order to ensure that an identified interval type-2 fuzzy set model captures the uncertainty of the collected data. In addition to the well studied centroid of interval type-2 fuzzy sets [27,30,31], other uncertainty measures exist in the literature [41]. In Li et al. [41], the uncertainty measure is called the “uncertainty degree of interval type-2 fuzzy sets” and it is based on the lower and upper α-cuts of interval type-2 fuzzy sets. This method provides a type-1 fuzzy set if all the uncertainties in the interval end points data vanish. This method is applied in modeling the interval type-2 fuzzy sets from the data collected from surveys. The brief description of uncertainty degree method in modeling interval type-2 fuzzy sets, as adapted from Li et al. [41], is described below.
Suppose p words need to be modeled using interval type-2 fuzzy sets. To model these, data need to be collected from a group of SMEs. Let us assume n subjects are surveyed. Thus, for each word we get n intervals . The sample mean for left end points, mean for right end points, and the standard deviation for the left end points, for right end points are given as follows:
Statistically, the word should be contained within the data. For some subjects, the word should be contained in the data . The following equation was used to determine the end points’ uncertainty degree [41]:
Li et al. [41] have shown that in the case of , the interval type-2 fuzzy set reduces to a type-1 fuzzy set.
2.4. Principle of Justifiable Granularity
The principle of justifiable granularity is used in IT2FRAM to determine the optimum value of upper and lower bounds of intervals in interval type-2 fuzzy sets. One of the fundamentals of granular computing is the principle of justifiable granularity, which is about constructing information granules based on the available experimental evidence resulting in a form of a collection of one-dimensional numeric data, D = {x1, x2, ..., xN} where xk ∈ R. A given information granule Ω must satisfy two requirements of high specificity and appropriate experimental evidence (coverage). High specificity refers to the required level of abstraction of information granules and implies their tangible semantic of them. Higher specificity represents more specific (less abstract) information granules. Moreover, an “experimentally justified information granule” means that an information granule should be supported by the available experimental evidence. The following definitions and equations are adapted from Pedrycz (2005) [21], Pedrycz and Homenda [32], and Pedrycz (2018) [42].
Definition 5.
The numeric evidence accumulated within the bounds of information granule Ω (coverage) must be as high as possible. Therefore, the existence of the information granule Ω is justified as it reflects the existing experimental data D. For instance, if the information granule Ω is a set of numeric data, then the more data contained within the bounds of Ω, the better, and the set is more legitimate. Coverage is related to the ability of information granules to represent numeric data. Coverage is expressed as the cardinality (count) of the data X included in the interval [m,b], assuming m in the numeric representative of a data set, such as a median.
Definition 6.
The information granule Ω must be specific, which means that the resulting information granule must be semantically meaningful. This implies that the smaller the information granule Ω is, the better. In general, specificity is a measure of how detailed the formed information granule is. Some substantial requirements are: (1) specificity is the highest when there is only one element in the formation granule, (i.e., sp({x}) = 1); (2) if two information granules have the relationship A ⊂ B, then sp(A) > sp(B); and (3) specificity is the lowest when the information granule Ω is constructed as an entire universe of discourse. We can view specificity as a decreasing function of the size of information granules. In the case of an interval, we can relate specificity directly with the length of the interval and define any decreasing function of the length that is |m−b| or |m−a|. For instance, we can express the specificity of A = [m,b] in the following detailed form:
or exp(−|m − a|) for the lower bound of the interval. Alternatively, we can satisfy the formulation of the specificity measure with the relative length of all the possible values assumed by numeric data (the length). The specificity then is as follows:
Note that both Equations (14) and (15) result in the highest specificity amount when b = m, however Equation (15) is equal to the zero value of specificity for b = xmax.
sp(A) = exp(−|m − b|)
Definition 7.
Coverage and specificity measures are conflicting by nature, which means that increasing coverage decreases specificity and vice versa, and constructing the information granules is a result of tradeoff between them. Therefore, there is an optimization problem with a multiplicative form of the objective function:
Equation (16) can be realized independently for the lower and upper bound of the interval as follows:
By maximizing V(b), we achieve an optimal value of b, i.e.,
V(b) = coverage × specificity
V(b) = f1(card{xkD|med(D) < xk ≤ b}) ∗ f2(|med(D) − b|)
V(a) = f1(card{xk ∈ D|a ≤ xk < med(D)}) ∗ f2(|med(D) −a|)
bopt = arg maxb V(b).
3. Interval Type-2 Fuzzy Risk Analysis Model (IT2FRAM)
IT2FRAM is a multi-step model employing fuzzy arithmetic to analyze risk and opportunity events to determine contingency reserve for construction projects. Figure 3 presents the five steps of IT2FRAM and their outputs. In steps 1 and 2, the work, cost, and risk breakdown structures (WBS, CBS, and RBS) are determined. In step 3, the membership functions of the linguistic terms for risks and opportunities are determined using interval type-2 fuzzy sets and the principle of justifiable granularity as explained in Section 2.2, Section 2.3 and Section 2.4. Then, in step 4, the identified risks and opportunities are assessed by SMEs using linguistic terms and their related fuzzy numbers. Finally, the contingency reserve can be calculated in step 5 using fuzzy arithmetic as explained in Section 2.1.
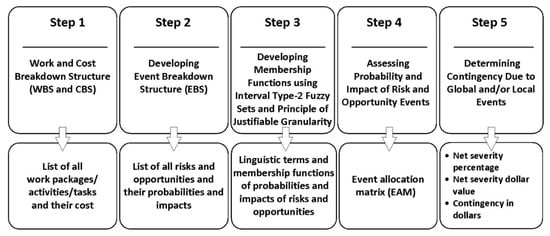
Figure 3.
Steps of IT2FRAM (modified from [1]).
In step 1, the WBS and CBS are developed. The WBS is the foundation of IT2FRAM assuming that each project contains up to a three-level WBS, namely work package, activity, and task. As an example, Figure 4 shows a three-level WBS of a wind farm project illustrated in FRA©. The CBS must be developed after establishing the WBS to determine the cost of the work packages, activities, and tasks. Developing the event breakdown structure (EBS) and the identification of potential risk and opportunity events are step 2 in IT2FRAM. Since there is no consensus on the standard categorization of risk and opportunity events [16], different combinations of risk and opportunity identification methods can be employed, ranging from information-gathering methods to analysis-based techniques. Siraj and Fayek [43] conducted a systematic review and content analysis of 130 papers from journals with high impact factors in the construction engineering and management area published between 1990 and 2017. They propose eleven categories of risk and opportunity events, which are considered as the default template of IT2FRAM. These event categories are depicted in Figure 5: resource-related, management, technical, construction, site conditions, contractual and legal, economic, financial, environmental, social, political, and health and safety.
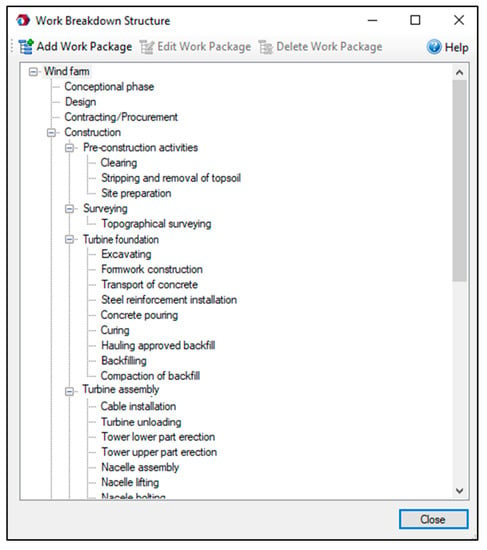
Figure 4.
Three-level work breakdown structure (WBS) comprising work packages, activities, and tasks in FRA©.
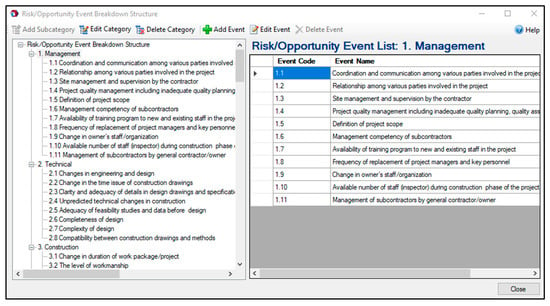
Figure 5.
Two-level event breakdown structure (EBS) in FRA©.
In step 3, the linguistic terms and scales must be established and optimized to assess the probability and impact of the events. Triangular or trapezoidal fuzzy numbers represent linguistic terms. According to Fayek and Lourenzutti [8], Pedrycz [44], and Proske [45], triangular and trapezoidal shapes are the most common shapes for fuzzy numbers that have supports with the open intervals of real numbers. Triangular fuzzy numbers are a special case of trapezoidal fuzzy numbers. In IT2FRAM and according to Hall [46], the probability and impact of events are commonly determined by five linguistic terms namely, very low, low, medium, high, and very high. A sample of triangular membership functions for risk and opportunity probability with respective linguistic terms is presented in Figure 6.
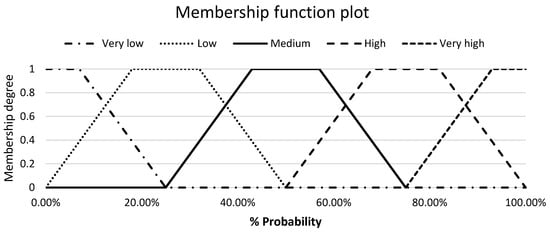
Figure 6.
Membership functions of the linguistic terms for risk probability.
Different membership functions for probability and impact must be formed and aggregated to benefit from the knowledge and experience of all decision makers and SMEs on a project. Type-1 fuzzy sets project only one crisp number for the membership degree of each linguistic term, while interval type-2 fuzzy sets return an interval. Therefore, interval type-2 fuzzy sets are preferable, and they provide more information than type-1 fuzzy sets. An interval type-2 fuzzy set also covers all opinions. Figure 7 shows a hypothetical case study of various membership functions of the linguistic term very low for risk probability as determined by seven SMEs. For instance, in Figure 7, based on the opinion of SME 1, the risks with very low probability are those risks with an occurrence probability of less than 6 percent with the full membership degree in 0. Lower and upper limits of the intervals can be determined by the lowest and the highest height of the triangular membership functions built based on the opinions of different SMEs.
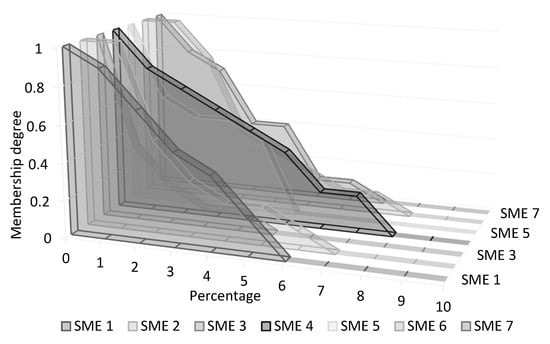
Figure 7.
Suggested membership functions of the linguistic term very low for risk probability by seven subject matter experts (SMEs).
Then, the optimal lower and upper limits of the interval type-2 fuzzy set for each linguistic term are determined by maximizing the specificity and the coverage of each horizontal interval and simultaneously applying the principle of justifiable granularity (see Section 2.4). The intrinsic contradiction between the maximization of the coverage and the maximization of the specificity results in an optimization problem with a multiplicative form of the objective function. Having these two criteria in mind, a numeric representative, a robust estimator of the sample such as median med (D), must be selected for each horizontal interval (horizontal information granule). The determination of the upper and lower bound must be realized independently but in the same way. The optimal upper bound must be obtained by maximizing the value of . in Equation (17). In the same way, the lower bound must be realized based on Equation (18). This process must be repeated for all intervals for each linguistic term. Then, the optimized horizontal intervals of each linguistic term are converted into interval type-2 fuzzy sets. Such a constructed optimized interval type-2 fuzzy set represents the aggregated opinions of all SMEs without the effect of outlier opinions. A statistically representative embedded set of the constructed optimized interval type-2 fuzzy set is used in the next steps of IT2FRAM.
In step 4, the probability and impact of events are assessed. Because of the neutral wording of events, each event can be evaluated simultaneously as a risk and an opportunity. An event allocation matrix (EAM) is employed to determine the relationships among the events and the project’s work packages, activities, and tasks on the basis of expert judgment and project context. Events are categorized as local and global. The global events impact several work packages, activities, and tasks and are evaluated for the assigned group. On the contrary, local events can only be assessed individually for each work package, activity, or task and so are assigned individually to individual work packages, activities, and tasks. IT2FRAM considers two capabilities to improve the accuracy of the result: (1) determining the percentage value (between 0 and 100 percent)f each work package, activity, or task impacted by each local or global event, and (2) determining the portion of the estimated cost of the work package, activity, or task (in terms of a percentage or dollar value) affected by each local or global event.
Finally, the contingency of a work package, activity, or task is calculated applying the following fuzzy arithmetic procedure with respect to local events. (1) First, the probability and impact of the risk and opportunity events are evaluated by decision makers or SMEs in terms of the optimized linguistic scales which were established in step 3. Due to the neutral wording, the local events are assessed two times, both as risk and opportunity. (2) Risk and opportunity severities are calculated as a percentage by the multiplication of probability and impact fuzzy numbers. (3) The net severity percentage of each local event is calculated by a summation of risk severity and opportunity severity. (4) The fuzzy number of net severity dollar value is calculated for each local event by the multiplication of its net severity percentage by the affected cost of the work package, activity, or task. (5) The total local contingency in dollars of the work package, activity, or task is calculated by the summation of the net severity (in dollars) of all local events affecting it. (6) The same procedure (1–5) must then be used to calculate the total global contingency in dollars, with the only difference being that assessing the probability and impact of each global risk event is done for the affected group of work packages, activities, and tasks, instead of each work package, activity, or task individually. (7) Finally, the total contingency of the project is calculated by subtracting the total local contingency from total global contingency, reported in dollars (see Section 2.1 for detailed fuzzy arithmetic).
4. Implementation of IT2FRAM in FRA© and Discussion
In this section, a hypothetical case study is presented as an illustration of how to implement IT2FRAM in practice. FRA© is employed to implement the fuzzy arithmetic procedures of IT2FRAM. The three-level WBS of a hypothetical onshore wind farm project includes six work packages, 11 activities, and 42 tasks. The budget is CAD 554,628,000, and the work packages and their respective costs are presented in Table 1. The default two-level EBS in FRA© (see Figure 5) was modified resulting in new EBS with 26 risk and opportunity events, six of which were global and 20 were local.

Table 1.
Cost of work packages.
For step 3, linguistic terms and their scales and respective fuzzy sets are established in order to evaluate the probability and impact of the risk and opportunity events. The opinions of different SMEs must be collected for the linguistic terms of probability and impact of events. In this hypothetical situation, it is assumed that there are seven SMEs whose opinions are essential for analyzing the risk and opportunity events. Table 2 summarizes their opinions about the membership function of the linguistic term very low for risk probability. Based on the opinion of SME 1, the linguistic term very low for risk probability ranges from 0 to 6 percent with the membership value of 1 in 0 percent. However, for SME 4 this value is different and ranges between 0 and 8 percent.

Table 2.
The membership values of the very low risk probability suggested by seven SMEs.
The interval type-2 fuzzy sets are used to consider all the membership functions suggested by different SMEs. As illustrated in Figure 8, an interval type-2 fuzzy set is formed by taking the minimum and maximum of each column in Table 2.
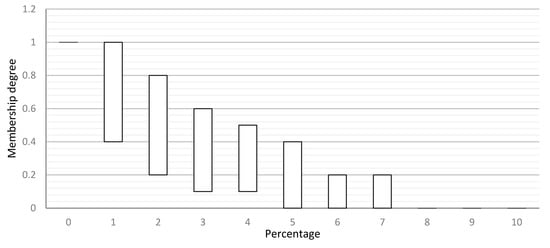
Figure 8.
Membership function of interval type-2 fuzzy set of very low before optimization.
Then, by applying the principle of justifiable granularity and taking it as a multiplicative optimization problem, the tradeoff between specificity and coverage are performed. The lower and upper bounds of the interval type-2 fuzzy set membership function of all the intervals are calculated by maximizing the coverage and the specificity of the interval simultaneously (see Section 2.4). Figure 9 shows the tradeoff results for horizontal intervals from 1 to 4 in Figure 8.
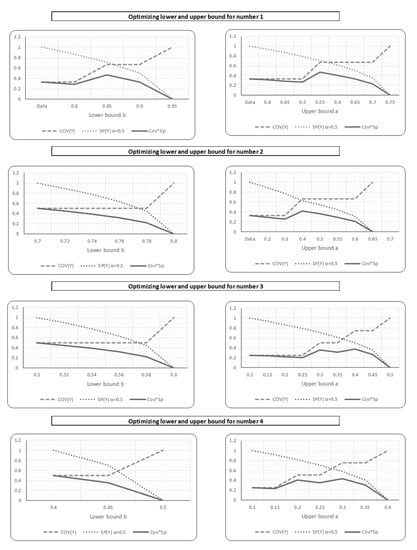
Figure 9.
Optimizing the lower and upper bounds of interval type-2 fuzzy sets.
Figure 10 shows the optimized interval type-2 fuzzy set membership function of the linguistic term very low for risk probability.
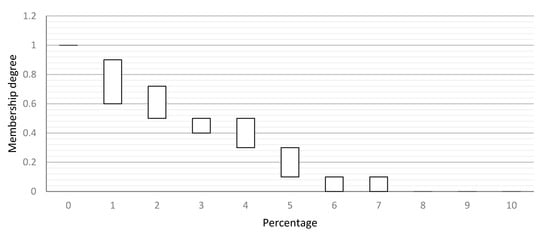
Figure 10.
Optimized interval type-2 fuzzy set membership function of very low after optimization.
Based on the theories and concepts associated with interval type-2 fuzzy sets [26,38,39], it is evident that interval type-2 fuzzy sets capture more uncertainty than their type-1 counterparts. Thus, interval type-2 membership functions are used to aggregate the opinions of all the SMEs. However, to minimize the effect of outlier opinions, the principle of justifiable granularity is used. These optimized membership functions are then type-reduced to standard membership functions for crisp output calculation. Figure 11 illustrates the process of converting interval type-2 membership function to type-1 membership function based on Section 2.2 and Section 2.3.
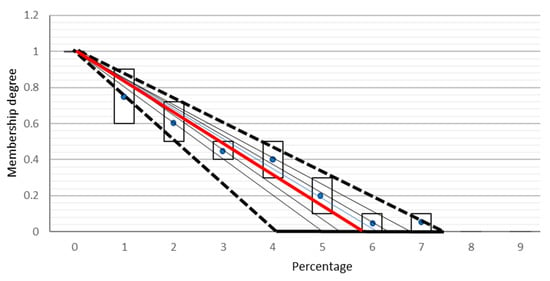
Figure 11.
Converting the optimized interval type-2 fuzzy set membership function of very low to a type-1 fuzzy set.
The aim is to find the best fit line passing through these interval fuzzy values. Statistically, the interval fuzzy values are represented by the mean and spread. The interval sets are represented by their corresponding mean points in the x–y space, which are (0,1), (1,0.75), (2,0.6), (3,0.45), (4,0.4), (5,0.2), (6,0.05) and (7,0.05). The mean values of all the interval fuzzy sets might not lie on a straight line. To find the best fit linear equation, we solve linear equations between (0,1) and the mean point of each interval set that provides an intercept value at the x axis. Solving the linear equation between points (0,1) and (1,0.75) yields the intercept on the x axis at x = 4. We draw other lines by solving the line equations between (0,1) and the other mean points. The line between (0,1) and (7,0.05) gives the intercept value on the x-axis at x = 7.37. Thus, all the calculated intercepts on the x-axis are at x = {4, 5, 5.45, 6.67, 6.25, 6.31, 7.37}. This represents a region of uncertainty between x = 4 and x = 7.37, which is a direct consequence of the differences in opinion of the SMEs. This region of uncertainty forms the FOU of the interval type-2 fuzzy set with the triangular membership function. The interval type-2 set can be modeled as described in Section 2.3. Statistically, the word being modeled should be contained within . Here, is the mean of the left end points of the interval type-2 fuzzy set and is the mean of the right end points. Assuming that the end point uncertainties disappear, then the above interval type-2 fuzzy set reduces to a type-1 fuzzy set with a = b = . The mean of these points is at = 5.86 with the standard deviation s = 1.046. The resulting type-1 fuzzy set is highlighted with red color. Similarly, the optimized membership functions are obtained for other linguistic terms. Figure 12 illustrates the optimized membership functions of all the linguistic terms for risk probability.
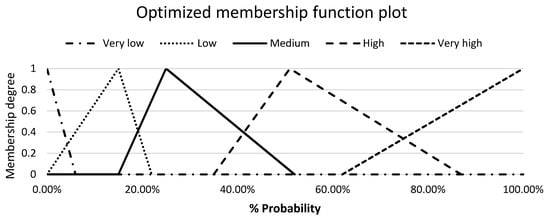
Figure 12.
Optimized membership functions of the linguistic terms for risk probability.
In step 4, as illustrated in Figure 13, the identified local and global risk and opportunity events are assigned to work packages, activities, and tasks, and the probability and impact of these events are assessed on the basis of linguistic terms (type-1 fuzzy sets determined in step 3).
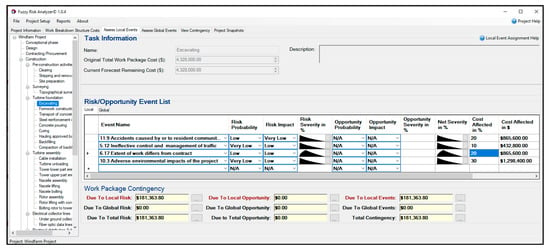
Figure 13.
Assigning and assessing the local events.
Finally, fuzzy arithmetic is employed to calculate the work package and project contingency reserve using FRA©. IT2FRAM provides the user with the choice of standard fuzzy arithmetic or extended fuzzy arithmetic, the latter of which uses four different t-norms. The resulting fuzzy value of contingency reserve can be presented both as an interval value using the confidence level and as a crisp value based on the selection of a single value (defuzzification) method (Figure 14). The defuzzified single value of the total project contingency reserve based on the COA is CAD 7,307,032, and at an α-cut level of 0.50 there is a confidence level (possibility degree) of 0.5 that the project contingency will be between CAD 932,573 and CAD 9,890,760.
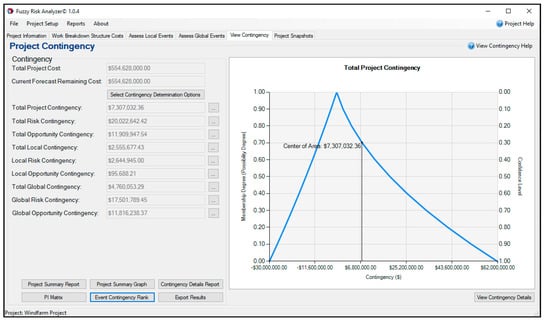
Figure 14.
Assigning and assessing the local events.
Figure 15 is the project summary graph report created by FRA© that provides a visualization of the defuzzified contingency values. This report is only available when a single defuzzified value is being used as the output in FRA©.
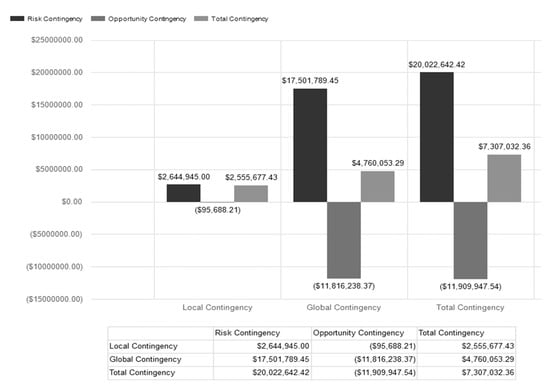
Figure 15.
Local, global, and total contingency values.
In Table 3, several contingency reserve determination methods are summarized and compared based on ten criteria. IT2FRAM provides a unique structured way to develop, optimize, and aggregate the linguistic terms. IT2FRAM addresses the limitations of the other methods of contingency reserve determination. The interval type-2 fuzzy sets in IT2FRAM capture more uncertainties, provide better knowledge representation, and consider several experts’ opinions. The principle of justifiable granularity optimizes these interval type-2 fuzzy sets by maximizing the performance index of two criteria—coverage and specificity—which helps minimize the effects of outlier opinions of SMEs. IT2FRAM provides an alternative to other methods for the elicitation of membership functions such as fuzzy clustering and AHP, which cannot be effectively applied to form the membership functions of risk analysis linguistic terms. Based on Table 3, it is clear that IT2FRAM has greater advantages than the models developed in the past and extends FRAM [1] by proposing a structured method to determine the membership functions of linguistic terms for probability and impact that are the foundations of its risk analysis process. Moreover, IT2FRAM fulfills the need to (1) aggregate the opinions of different SMEs about the membership functions of the identified linguistic terms and (2) remove outlier opinions.

Table 3.
Comparison of the contingency reserve determination methods (Modified from [1]).
5. Conclusions and Future Research
The uncertain events involved in projects make it challenging to achieve the project objectives without performing a risk and opportunity analysis and determining the contingency reserve. In this paper, type-1 fuzzy arithmetic, interval type-2 fuzzy sets, and the principle of justifiable granularity are combined to improve the project contingency reserve determination. The new method, called interval type-2 fuzzy risk analysis model (IT2FRAM), is introduced in order to develop, optimize, and aggregate the membership functions for the probability and impact of risk and opportunity linguistic terms (e.g., very low). IT2FRAM is an extension of the fuzzy arithmetic-based risk analysis model proposed by Fateminia et al. [1], which addresses the limitations of traditional techniques of project contingency determination methods. Interval type-2 fuzzy sets are employed to capture more uncertainties, provide better knowledge representation, and consider several experts’ opinions. The principle of justifiable granularity is employed to optimize interval type-2 fuzzy sets by maximizing the performance index of two criteria: coverage and specificity. IT2FRAM also provides an alternative to other methods for the elicitation of membership functions, such as fuzzy clustering and the analytical hierarchy process (AHP), which cannot be effectively applied to form the membership functions of risk analysis linguistic terms. A software tool, Fuzzy Risk Analyzer© (FRA©), was introduced to illustrate the implementation of IT2FRAM using a hypothetical case study.
The contributions of this paper are in addressing the following challenges associated with previous methods of determining project contingency reserve: (1) considering the opinions of several SMEs to develop the membership functions of linguistic terms for the probability and impact of events, (2) decreasing the effect of outlier opinions in developing the membership functions of linguistic terms, and (3) aggregating non-linear membership functions into trapezoidal membership functions.
Future research will focus on the validation of IT2FRAM using real project data and comparing the results with traditional contingency determination methods. Since it is assumed in the proposed method that WBS components and risk and opportunity events are independent, IT2FRAM will be extended to consider the interdependencies among them.
Author Contributions
Conceptualization, S.H.F.; methodology, S.H.F. and V.S.; software, S.H.F.; writing—original draft preparation, S.H.F. and V.S.; writing—review and editing, S.H.F., V.S., and A.R.F.; supervision, A.R.F.; project administration, A.R.F.; funding acquisition, A.R.F. All authors have read and agreed to the published version of the manuscript.
Funding
This research is funded by the Natural Sciences and Engineering Research Council of Canada (NSERC) Industrial Research Chair in Strategic Construction Modeling and Delivery (NSERC IRCPJ 428226–15), which is held by Aminah Robinson Fayek. The authors gratefully acknowledge the financial support provided by industry partners and NSERC through the Chair.
Conflicts of Interest
The authors declare no conflict of interest.
References
- Fateminia, S.H.; Siraj, N.B.; Fayek, A.R.; Johnston, A. Determining Project Contingency Reserve Using a Fuzzy Arithmetic-Based Risk Analysis Method. In Proceedings of the 53rd Hawaii International Conference on System Sciences, Wailea, HI, USA, 7–10 January 2020. [Google Scholar] [CrossRef]
- PMI. Guide to the Project Management Body of Knowledge (PMBoK® Guide), 6th ed.; Project Management Institute: Newton Square, PA, USA, 2017. [Google Scholar]
- Ahmadi-Javid, A.; Fateminia, S.H.; Gemünden, H.G. A method for risk response planning in project portfolio management. Proj. Manag. J. 2020, 51, 77–95. [Google Scholar] [CrossRef]
- Fateminia, S.H.; Seresht, N.G.; Fayek, A.R. Evaluating Risk Response Strategies on Construction Projects Using a Fuzzy Rule-Based System. In Proceedings of the 36th International Symposium on Automation and Robotics in Construction, Banff, AB, Canada, 21–24 May 2019. [Google Scholar] [CrossRef]
- Salah, A.; Moselhi, O. Contingency modelling for construction projects using fuzzy-set theory. Eng. Constr. Arch. Manag. 2015, 22, 214. [Google Scholar] [CrossRef]
- Bakhshi, P.; Touran, A. An overview of budget contingency calculation methods in construction industry. Procedia Eng. 2014, 85, 52–60. [Google Scholar] [CrossRef]
- Helton, J.C. Uncertainty and sensitivity analysis in the presence of stochastic and subjective uncertainty. J. Stat. Comput. Simul. 1997, 57, 3–76. [Google Scholar] [CrossRef]
- Fayek, A.R.; Lourenzutti, R.T.O. Introduction to fuzzy logic in construction engineering and management. In Fuzzy Hybrid. Computing in Construction Engineering and Management: Theory and Applications; Fayek, A.R., Ed.; Emerald Group Publishing: Bingley, UK, 2018; Chapter 1; pp. 3–35. [Google Scholar]
- Klir, G.J.; St. Clair, U.H.; Yuan, B. Fuzzy Set Theory: Foundation and Applications; Wiley-IEEE Press: Hoboken, NJ, USA, 2006. [Google Scholar]
- Iranmanesh, S.H.; Khodadadi, S.B.; Taheri, S. Risk Assessment of Software Projects Using Fuzzy Inference System. In Proceedings of the 2009 International Conference on Computers & Industrial Engineering, Troyes, France, 6–9 July 2009; pp. 1149–1154. [Google Scholar] [CrossRef]
- Hao, Y.; Kedir, N.S.; Gerami Seresht, N.; Pedrycz, W.; Fayek, A.R. Consensus Building in Group Decision-Making for the Risk Assessment of Wind Farm Projects. In Proceedings of the 2019 IEEE International Conference on Fuzzy Systems (FUZZ-IEEE), New Orleans, LA, USA, 23–26 June 2019; pp. 1–7. [Google Scholar] [CrossRef]
- Zadeh, L.A. Fuzzy sets. Inf. Control. 1965, 8, 338–353. [Google Scholar] [CrossRef]
- Zadeh, L.A. From computing with numbers to computing with words. From manipulation of measurements to manipulation of perceptions. IEEE Trans. Circuits Syst. I 1999, 46, 105–119. [Google Scholar] [CrossRef]
- Zadeh, L.A. The concept of a linguistic variable and its application to approximate reasoning—II. Inf. Sci. 1975, 8, 301–357. [Google Scholar] [CrossRef]
- Abdelgawad, M.; Fayek, A.R. Risk management in the construction industry using combined fuzzy FMEA and fuzzy AHP. J. Constr. Eng. Manag. 2010, 136, 1028–1036. [Google Scholar] [CrossRef]
- Nieto-Morote, A.; Ruz-Vila, F. A fuzzy approach to construction project risk assessment. Int. J. Proj. Manag. 2011, 29, 220–231. [Google Scholar] [CrossRef]
- Abdelgawad, M.; Fayek, A.R. Fuzzy reliability analyzer: Quantitative assessment of risk events in the construction industry using fuzzy fault-tree analysis. J. Constr. Eng. Manag. 2011, 137, 294–302. [Google Scholar] [CrossRef]
- Nasirzadeh, F.; Afshar, A.; Khanzadi, M.; Howick, S. Integrating system dynamics and fuzzy logic modelling for construction risk management. Constr. Manag. Econ. 2008, 26, 1197–1212. [Google Scholar] [CrossRef]
- Pedrycz, W.; Wang, X. Designing fuzzy sets with the use of the parametric principle of justifiable granularity. IEEE Trans. Fuzzy Syst. 2015, 24, 489–496. [Google Scholar] [CrossRef]
- Saaty, R.W. The analytic hierarchy process—What it is and how it is used. Math. Model. 1987, 9, 161–176. [Google Scholar] [CrossRef]
- Pedrycz, W. Knowledge-Based Clustering: From Data to Information Granules; Wiley-Interscience: Hoboken, NJ, USA, 2005. [Google Scholar]
- Cheng, H.D.; Chen, J.R. Automatically determine the membership function based on the maximum entropy principle. Inf. Sci. 1997, 96, 163–182. [Google Scholar] [CrossRef]
- Arslan, A.; Kaya, M. Determination of fuzzy logic membership functions using genetic algorithms. Fuzzy Sets Syst. 2001, 118, 297–306. [Google Scholar] [CrossRef]
- Lee, M.A.; Takagi, H. Integrating Design Stage of Fuzzy Systems Using Genetic Algorithms. In Proceedings of the Second IEEE International Conference on Fuzzy Systems, San Francisco, CA, USA, 28 March–1 April 1993; pp. 612–617. [Google Scholar] [CrossRef]
- Baǧiş, A. Determining fuzzy membership functions with tabu search—An application to control. Fuzzy Sets Syst. 2003, 139, 209–225. [Google Scholar] [CrossRef]
- Mendel, J.M. Uncertain Rule-Based Fuzzy Logic. Systems: Introduction and New Directions, 2nd ed.; Prentice Hall: Upper Saddle River, NJ, USA, 2001. [Google Scholar]
- Mendel, J.M. Computing with words and its relationships with fuzzistics. Inf. Sci. 2007, 177, 988–1006. [Google Scholar] [CrossRef]
- Liu, F.; Mendel, J.M. Encoding words into interval type-2 fuzzy sets using an interval approach. IEEE Trans. Fuzzy Syst. 2008, 16, 1503–1521. [Google Scholar] [CrossRef]
- Wu, D.; Mendel, J.M. Perceptual reasoning for perceptual computing. IEEE Trans. Fuzzy Syst. 2008, 16, 1550–1564. [Google Scholar] [CrossRef]
- Mendel, J.M.; Wu, H. Type-2 fuzzistics for symmetric interval type-2 fuzzy sets: Part 1, forward problems. IEEE Trans. Fuzzy Syst. 2006, 14, 781–792. [Google Scholar] [CrossRef]
- Mendel, J.M.; Wu, H. Type-2 fuzzistics for symmetric interval type-2 fuzzy sets: Part 2, inverse problems. IEEE Trans. Fuzzy Syst. 2001, 15, 301–308. [Google Scholar] [CrossRef]
- Pedrycz, W.; Homenda, W. Building the fundamentals of granular computing: A principle of justifiable granularity. Appl. Soft Comput. 2013, 13, 4209–4218. [Google Scholar] [CrossRef]
- Bezdek, J.C. Pattern Recognition with Fuzzy Objective Function Algorithms; Springer Science & Business Media: Berlin/Heidelberg, Germany, 2013. [Google Scholar]
- Pedrycz, W.; Gomide, F. An Introduction to Fuzzy Sets: Analysis and Design; MIT Press: Cambridge, MA, USA, 1998. [Google Scholar]
- Chang, P.; Pai, P.; Lin, K.; Wu, M. Applying fuzzy arithmetic to the system dynamics for the customer–producer–employment model. Int. J. Syst. Sci. 2006, 37, 673–698. [Google Scholar] [CrossRef]
- Lin, K.P.; Wen, W.; Chou, C.C.; Jen, C.H.; Hung, K.C. Applying fuzzy GERT with approximate fuzzy arithmetic based on the weakest t-norm operations to evaluate repairable reliability. Appl. Math. Modell. 2011, 35, 5314–5325. [Google Scholar] [CrossRef]
- Lin, K.P.; Wu, M.J.; Hung, K.C.; Kuo, Y. Developing a Tω (the weakest t-norm) fuzzy GERT for evaluating uncertain process reliability in semiconductor manufacturing. Appl. Soft Comput. 2011, 11, 5165–5180. [Google Scholar] [CrossRef]
- Mendel, J.; John, R. Type-2 fuzzy sets made simple. IEEE Trans. Fuzzy Syst. 2002, 10, 117–127. [Google Scholar] [CrossRef]
- Mendel, J.M.; John, R.I.; Liu, F. Interval type-2 fuzzy logic systems made simple. IEEE Trans. Fuzzy Syst. 2006, 14, 808–821. [Google Scholar] [CrossRef]
- Wu, D.; Mendel, J.M.; Coupland, S. Enhanced interval approach for encoding words into interval type-2 fuzzy sets and its convergence analysis. IEEE Trans. Fuzzy Syst. 2012, 20, 499–513. [Google Scholar] [CrossRef]
- Li, C.; Zhang, G.; Yi, J.; Wang, M. Uncertainty degree and modeling of interval type-2 fuzzy sets: Definition, method and application. Comp. Math. Appl. 2013, 66, 1822–1835. [Google Scholar] [CrossRef]
- Pedrycz, W. Granular Computing: Analysis and Design of Intelligent Systems; CRC Press: Boca Raton, FL, USA, 2018. [Google Scholar]
- Siraj, N.B.; Fayek, A.R. Risk identification and common risks in construction: Literature review and content analysis. J. Constr. Eng. Manag. 2019, 145, 03119004. [Google Scholar] [CrossRef]
- Pedrycz, W. Why triangular membership functions? Fuzzy Sets Syst. 1994, 64, 21–30. [Google Scholar] [CrossRef]
- Proske, D. Catalogue of Risks: Natural, Technical, Social and Health Risks; Springer Science & Business Media: Berlin/Heidelberg, Germany, 2008. [Google Scholar]
- Hall, E.M. Managing Risk: Methods for Software Systems Development; Pearson Education: Upper Saddle River, NJ, USA, 1998. [Google Scholar]
© 2020 by the authors. Licensee MDPI, Basel, Switzerland. This article is an open access article distributed under the terms and conditions of the Creative Commons Attribution (CC BY) license (http://creativecommons.org/licenses/by/4.0/).