Article

Multidimensional Group Recommendations in the Health Domain

by
Maria Stratigi
1,*,
Haridimos Kondylakis
2 and
Kostas Stefanidis
1
1
Faculty of Information Technology and Communication Sciences, Tampere University, 33100 Tampere, Finland
2
Institute of Computer Science (ICS), Foundation of Research & Technology-Hellas (FORTH), 70013 Iraklio, Greece
*
Author to whom correspondence should be addressed.
Algorithms 2020, 13(3), 54; https://doi.org/10.3390/a13030054
Submission received: 6 February 2020 / Revised: 21 February 2020 / Accepted: 27 February 2020 / Published: 28 February 2020

Abstract

:
Providing useful resources to patients is essential in achieving the vision of participatory medicine. However, the problem of identifying pertinent content for a group of patients is even more difficult than identifying information for just one. Nevertheless, studies suggest that the group dynamics-based principles of behavior change have a positive effect on the patients’ welfare. Along these lines, in this paper, we present a multidimensional recommendation model in the health domain using collaborative filtering. We propose a novel semantic similarity function between users, going beyond patient medical problems, considering additional dimensions such as the education level, the health literacy, and the psycho-emotional status of the patients. Exploiting those dimensions, we are interested in providing recommendations that are both high relevant and fair to groups of patients. Consequently, we introduce the notion of fairness and we present a new aggregation method, accumulating preference scores. We experimentally show that our approach can perform better recommendations to small group of patients for useful information documents.

1. Introduction

Medicine is undergoing a revolution that is transforming the nature of healthcare from reactive to preventive. These changes came to pass due to new approaches to disease, which focus on integrated diagnosis, treatment, and prevention of disease in individuals. One of the major challenges to this path is the amount and the quality of information that is available online [1] considering that health information is one of the most popular research field on the Web. Furthermore, there is a significant increase to the number of people who search online for health and medical information. In the United States, estimations show that ~80% percent of all adults have searched the Web for health information, whereas in 2006, 23% of the Europeans were utilizing the Internet to be informed about their health problems [2]. However, despite the increase in those numbers, it is very hard for a patient to accurately judge how relevant the information is to their own health issues and additionally if the source of this information is reliable.
A healthcare provider that is responsible for providing reliable sources to patients may be an optimal solution for this problem [1]. This guided solution leads to patient empowerment, meaning that a patient receives information from accurate sources, which increases the understanding of their problems and their way of thinking about them. Accordingly, the patients depend less on the doctors for the appropriate information. Additionally, patients feel autonomous and more confident about the management of their disease [3]. Most primary care providers have their patients’ health background and interests in paper, electronic, or mental records. This helps them determine what information would be the most constructive for each individual patient. However, the amount of time that a health provider can dedicate to each patient has greatly declined. Consequently, they have an even more difficult task in guiding their patients.
Aside from the guidelines provided by health providers, another support for the patients is their social circle. The use of group dynamics-based principles of behavior change have been shown to be highly effective in enhancing social support, e.g., through promoting group cohesion in physical activity [4] and in reducing smoking relapse [5]. Especially for cancer, the latest studies [6] suggest that group therapy improves the well-being of cancer patients because of enhanced discussion and social support. In these counseling meetings, the patient is directed towards the most informative and reliable sources on the Web. However, the effort of locating pertinent information for a group of participants is far greater than identifying information for just one patient.
This motivates us to concentrate our efforts on recommending to a group of patients relevant and interesting health documents that were selected by health professionals. We utilize the collaborative filtering (CF) recommendation model for this task. Our motivation for this work is to offer to a caregiver that is in charge for a group of patients a recommendation list that consists of health documents that are relevant to the group members. The relevance of the recommended documents is calculated based on the patients’ current health profiles. In addition, we would like to identify information that is equally fair to all members, meaning no member in the group is unsatisfied.
We incorporate fairness during the aggregation phase of our recommendation model. To produce group recommendations, one must first produce recommendation lists for each group member and then aggregate those into one list that is then reported back to the group. There are many methods to ensure that the aggregation is done fairly [7,8]. Intuitively, to achieve fair recommendation we consider that all the group members are equal to each other. Therefore, the group score for an item i is the average score across all the group members’ preference scores for that item. Such an approach, however, can easily ignore the opinion of the minority. For example, in a group that consists of three patients, if for all items two of the members have high relevance score, but the third is low, then the opinion of the third member is overshadowed by the other two. To counter such a drawback, we propose a new aggregation method that is done in phases. In each phase, we select one item to include in the group recommendation list. At the beginning of each phase, if there is a member that is not as satisfied as the rest of the group, we select an item based on two criteria. First, it has to have high relevance for that user, and second, it is the best one available for the rest of the group.
As we have already mentioned, to generate these recommendations we use the collaborative filtering method. The basic principle of CF is to find similarities between users. Given a target user, we locate other similar users, who are often called peers or neighbors, and utilizing the ratings that peers have given, we estimate relevance scores for the items that the target user has not yet rated. In our work, to calculate similarities between two patients, we consider their health profiles. The information that is included in these health profiles is the following; the ratings that the patient has given to health documents and the health problems they have. Additionally, each patient has been questioned about their education level and their health literacy—meaning to what degree they are able to understand basic information and services related to the health domain. Furthermore, they are periodically questioned about their psycho-emotional status. Specifically, they regularly fill in a questionnaire about their anxiety levels and cognitive closure, meaning the patient’s need when faced with a decision, to have an answer instead of continued uncertainty. We propose a new similarity measure that combines all these different sources of information to different degrees to find similarities between patients across all dimensions.
In the past, we have proposed a semantic similarity function that takes into account the patients medical profiles, showing its superiority over a traditional measure [9,10] in group recommendations in the health domain. In addition, we have focused on the notion of fairness [11], devising an aggregation method for ensuring that if the group recommendation list provides a high relevant document for a patient, then that patient may be tolerant of the existence of documents that are not relevant to him/her. However, although usually health professionals target closely related health problems, the education level, health literacy level, and psycho-emotional status of the group are of high importance, as the content that the health professional should recommend, should be based on the aforementioned axes. To this direction we further extend the dimensions considered for finding similar users and we introduce a new aggregation method called AccScores, outperforming existing ones.
More specifically, the contributions of our work are the following.
  • We demonstrate a multidimensional group recommendation model in the health domain, using collaborative filtering.
  • We propose a novel semantic similarity function that takes into account, in addition to the patients medical problems, the education, the health literacy and the psycho-emotional status of the patients, showing its superiority over a traditional measure.
  • We introduce a new aggregation method accumulating preference scores, called AccScores, showing that it dominates other aggregation methods and is able to produce fair recommendations to small groups of patients.
  • We experimentally show the value of our approach, introducing the first synthetic dataset with such information for benchmarking works in the area.
This paper significantly extends our previous work in [11], by introducing two new similarity measures and a way to combine the different similarities functions into one. Furthermore, we introduce a new aggregation method and we present the relevant experiments. To our knowledge, this is the first work in group recommendations in the health domain considering multiple dimensions for increasing the quality of the proposed recommendations. The requirements for generating such a tool originally came from the iManageCancer [12] and the BOUNCE [13] H2020 EU research projects.
The rest of this paper is structured as follows. Section 2 presents related work. Section 3 focuses on identifying similarities between users and on how to produce single user recommendations. Section 4 focuses on the group recommendations model, and Section 5 presents the synthetic dataset constructed for evaluation. Finally, Section 6 presents experimental evaluation, and Section 7 concludes the paper.

2. Related Work

Typically, recommendation approaches [14] are distinguished between content-based, which recommends items similar to those the user previously preferred (see, e.g., [15]), and collaborative filtering, which recommend items that users with similar preferences like (see, e.g., [16]). Nowadays, recommendations have more broad applications [17], beyond products, like links (friends) recommendations [18], query recommendations [19], open source software recommendations [20], diverse venue recommendations [21], sequential recommendations [22,23], or even recommendations for evolution measures [24,25].
Although traditional research on recommender systems has almost exclusively focused on providing recommendations to single users, there exist many cases where the system needs to suggest items to groups of users [26,27]. As an example consider a group of friends deciding to dine at a restaurant. Typically, for producing group recommendations, we first compute recommendations for each group member separately, and then employ an aggregation strategy across them to compile the group recommendations (see, e.g., [28,29]). Various aggregation strategies can be applied to find a consensus between users for particular items, by minimizing, for instance, the disagreements between the group members. More recently, the authors of [30] analyze the problem of recommending sets of items to groups incorporating factors, like user impact, viability, and fairness.

Recommendations in the Health Domain

Nowadays, patients turn towards the Web to inform themselves about their diseases and their possible treatment. This suffers from two main problems. First, the information found on the Web is not always accurate, and second, it is very diverse. To face these problems a personalized recommender would allow the users to have a seamless, secure, and consistent bidirectional linking of clinical research and clinical care systems, and thus empowering the patients to extract the relevant data out of the overwhelming large amounts of heterogeneous data and treatment information. The authors of [31] portray the requirements that a Health Recommender System (HRS) needs to fulfill, whereas the authors of [32] analyze common pitfalls of such systems. For a recent survey for recommender systems for health promotion, the interested reader is forwarded to [33].
In this line of work, there have been already developed many recommendation systems focusing on citizen’s wellbeing. For example, the authors of [34,35] propose web-based recommender systems that provides individualized nutritional recommendations according to the user’s health profile defined, by following the main guidelines furnished by a medical specialist, whereas the authors of [36] suggest messages relevant to the user to support the smoking cessation process. The work in [37] is a recommender system proposing physical activities using only user’s history and employing machine learning, whereas for chronic conditions, other works focus on integrating recommender systems with electronic health records [38,39], proposing the best course of treatment. Other approaches adapt past recommendations to the current state of the user for Diabetes patients [40] or propose context-aware recommendation methods [41] to establish personalized healthcare services. However, all these works use techniques that are principally found in pure group recommendations systems for composing the group recommendation list. However, we have tailored our recommendations for the health domain, exploiting the semantically annotated PHR profile of the users. This directly allows us to endorse documents that are relevant to a user not only on the level of appreciation (meaning the ratings that each item has gained), but also on the level of his personal health profile (we recommend items relevant to him because of related health artifacts). Furthermore, by introducing the concept of fairness in our approach, we make sure that the output of the group recommendation process, remains fair and unbiased towards all group members. This is particularly important in our domain, where we explicitly want all members of the group to be satisfied.
More similar works to our approach are [42,43,44,45,46]. In [42], the authors combine two health information recommendation services—a collaborative filtering and a physiological indicator-based recommender—providing to the users useful health information. The authors of [43,44] present a tool aiming to empower patients to extract relevant data out of the overwhelmingly large amounts of heterogeneous data and treatment information, by semantically annotating both the patient profiles and the past user queries. From a different perspective, the authors of [45] decouples users and items, considering properties related to users and items, based on which a collaborative filtering model is defined. On the other hand, the authors of [46] focus on helping help health providers acquire new knowledge in real-time. However, even in those works, notions like group recommendations and fairness are not considered, nor interesting profile dimensions like the educational level, the health literacy, and the psychoemotional status.
For groups there have been only a small amount of works. The authors of [47] focus on recommending video content in group-based reminiscence therapy. Besides this work, in our previous line of work, we focused on group recommendations in the health domain [9,10] by proposing a semantic similarity function that takes into account the patients medical profiles, showing its superiority over a traditional measure in group recommendations, and by introducing the notion of fairness [11], paving the way for our contribution in this paper. Nevertheless, we are not aware of any other work in the area considering dimensions like the educational level, the health literacy, and the psychoemotional status of the patients for recommending high-quality information.

3. Single User Recommendations

Assume a set of documents I and a set of patients U in a health-related recommender system. Each patient is associated with a personal profile that contains the user’s personal health information. Each user is able to score documents that they have read in the past. This set of ratings is also contained in the user’s profile.
For the documents that a user has not seen previously, the recommender estimates a relevance score r e l e v a n c e ( u , i ) , u U , i I . For computing relevance scores, in this line of work, we apply the collaborative filtering approach. That is, given a user, we first look for similar users/patients employing a similarity function that evaluates their proximity (Section 3.2). Then, we compute the documents relevance scores using the most similar users to the user in question (Section 3.3). In this paper, in addition to traditional similarity functions, we exploit the patient profiles for finding similarities, targeting at improving the quality of the recommendations.

3.1. User Profiles

To take advantage user profile information, we need as a first step to be able to record it. For this reason, besides capturing patient problems, specific short validated questionnaires (i.e., the ALGA-C questionnaire [48]) have been employed that are being answered by the members of a group. All information obtained is then modeled and stored by exploiting an ontology. The answers of the questionnaires are then used to automatically compute particular values that are stored in the patient profiles, regarding key profile areas. Among others, numerical scores (1 to 5) exists for health literacy level, educational level, cognitive closure, and anxiety that we further use for providing recommendations. Health literacy is the degree to which individuals have the ability to obtain, process, and understand basic information and services related to the health domain, needed to make appropriate health decisions [49]. Although initially the term was related to the individual educational level, it is has now been acknowledged as an inconsistent indicator of skill level [50] and, as such, we believe it should be captured individually. Cognitive closure, on the other hand, characterizes the extent to which a person, faced with a decision, prefers any answer in lieu of continued uncertainty [51]. Cognitive closure and anxiety have been related with more rapid and lower quality of decision-making and as such different type of information should be recommended to those patients.
Besides user profiling, the documents also need to have information regarding the target population concerning the aforementioned dimensions. As such, all documents entered by the caregivers are annotated with numbers regarding target population health literacy and education level. In addition, the documents are automatically annotated using ICD-10 (http://www.icd10data.com/) ontology, and all annotations are stored into the document corpus.
Concerning the rating dataset the patient, u U might rate a document i I with a score r ( u , i ) , in the range of [ 1 , 5 ] . Commonly, patients give ratings only for a few documents, whereas, concurrently, the cardinality of I is high. We denote the subset of patients that rated a document i I as U ( i ) , and the subset of documents rated by a user u U as I ( u ) .

3.2. User Similarities

The information that is available to us to find similarities between users is diverse. First, we have the ratings that each user has given to documents. Second, we can utilize the users’ personal information; their health problems, health literacy, and education levels; as well as their anxiety and cognitive closure scores. Because the knowledge that we gain from each source is distinct, we can define four different similarity functions. To better utilize all of our data, the final similarity score between two users will be the combination of the similarity scores from these four methods.

3.2.1. Similarity Based on Ratings

We assume that two patients have similar interests, and in turn are similar, if they gave similar ratings to the documents of the recommender. We employ here the Pearson correlation measure [16], which is fast to compute and performs very well in the case of collaborative filtering. It directly calculates the correlation between two users with a score from −1 for entirely dissimilar users, to 1 for identical users.
R a t S ( u , u ) = i X ( r ( u , i ) μ u ) ( r ( u , i ) μ u ) i X ( r ( u , i ) μ u ) 2 i X ( r ( u , i ) μ u ) 2
where X = I ( u ) I ( u ) , μ u denotes the mean of the ratings in I ( u ) .

3.2.2. Similarity Based on Health Information

It is quite common in health-related informatics to consider people as similar if they have similar health problems, which in turn leads to similar consumption of health documents. In this work, we use the International Statistical Classification of Diseases and Related Health Problems (ICD10), which is a standard medical classification list maintained by the World Health Organization, to keep track of and recognize similarities between health problems and users. We describe ICD10 as a tree, with health problems as its nodes. We use the 2017 version of ICD10, which includes four levels in tree representation, plus one for the root level. Because of the structure of the taxonomy (acyclic), there is only one path that connects two individual nodes. Another characteristic of the structure is that sibling nodes that appear at lower levels have greater similarity than siblings in the upper levels.
Table 1 presents an example of four pairs of sibling nodes from the ICD10 ontology, with their code id, their description, and the level they belong to. From their descriptions, we can identify that the siblings that reside in the forth level share a far greater similarity than the ones in the first level. Because of this discrepancy of the similarity of the health problems at different levels, we assign different weights to nodes taking into account their level. These weights will allow us manage differently sibling nodes at various levels. Intuitively, the goal is to have sibling nodes in the higher levels with greater similarity than those in the lower levels.
Definition 1
(Weight). Let A be a node in the ontology tree. Then,
w e i g h t ( A ) = w 2 m a x L e v e l l e v e l ( A )
where w is a constant, m a x L e v e l is the maximum level of the tree, and l e v e l ( A ) is a function that returns the level of each node.
Moreover, assume that a n c ( A ) is the direct ancestor of A. Intuitively, we need a formula that not only takes into account the distance between two nodes, but also the level that those nodes belong. To achieve that, we make use of the notion of the lowest common ancestor (LCA).
Definition 2
(LCA). Let T be a tree. The lowest common ancestor LCA(A,B) of two nodes A and B in T is the lowest node in T that has both A and B as descendants, where each node can be a descendant of itself.
Then, for counting the distance between A and B, we calculate their distance from L C A ( A , B ) . For doing so, we identify first the path that connects A (and B, respectively) with L C A ( A , B ) .
Definition 3
(Path). Let T be a tree, and A and B two nodes in T, with L C A ( A , B ) = C . p a t h ( A , C ) returns a set of nodes including A, its direct ancestor a n c ( A ) , its direct ancestor a n c ( a n c ( A ) ) , and so on, until we reach C, without including C in the set.
The distance between A and C is computed as the summation the weight of each node in the path:
d i s t ( A , C ) = n p a t h ( A , C ) w e i g h t ( n )
Overall, for computing the similarity between two nodes A and B, we use the following formula.
Definition 4
(simN). Let T be a tree, and A and B two nodes in T, with L C A ( A , B ) = C . Then,
s i m N ( A , B ) = 1 d i s t ( A , C ) + d i s t ( B , C ) m a x P a t h 2
Note that we divide the sum of the two distances with m a x P a t h 2 , to normalize the overall similarity, so that the function s i m N , returns a value in the range of [0,1]. We define m a x P a t h as follows.
Definition 5
(maxPath). Let T be a tree, and A and B two nodes in T, with A being a node in the highest level and B the root. Then,
m a x P a t h = d i s t ( A , B )
Figure 1 presents a snippet of the ICD10 ontology tree, where each node is associated with a weight (in this example, w = 0.1 ). The root has not been assigned a weight, because when calculating the path that connects a node with its ancestor, we do not include the actual ancestor in the path. Table 2 presents various similarities between nodes from Figure 1.

Overall Semantic Similarity Between Two Users

Using the measures described above, we can compute the similarity between two health problems. However, a patient typically has more than one health problem in his/her profile.
Let P r o b l e m s ( u ) be the set of health problems of a patient u U . Given two patients, u and u , their overall similarity is calculated by considering all possible pairs of health problems between them. Then, for each single problem from u, we consider only the health problem of u with the maximum similarity.
Definition 6
(SemS). Let u and u be two patients in U. The similarity based on semantic information between u and u is defined as
S e m S ( u , u ) = i ϵ P r o b l e m s ( u ) p s ( i , u ) | P r o b l e m s ( u ) |
where
p s ( i , u ) = m a x ( j ϵ P r o b l e m s ( u ) { s i m N ( i , j ) } )
Instead of the maximum function used in the above process, one can employ the average function. However, according to our experiments, such an approach leads to a large number of unrelated pairs of health problems.

3.2.3. Similarity Based on Education and Health Literacy Level

Nowadays, there are a lot of sources where users can receive information about their health problems. These sources can vary in terms of how complex and how in-depth they go to showcase the problem. A user will be more attractive to sources that are inline with his/her health literacy and education level. For example, a patient with a low health literacy score will not be interested in a document that describes their health problem in great detail, but will be drawn to a document with a clear description of how to manage it. On the other hand, a patient with a high literacy score will be far more interested in the first document.
For documents regarding the same information, people have similar interests in health documents that require the same educational and health literacy level to be comprehended. As such, the similarity between two patients is calculated by the Euclidean distance between their corresponding values.
E d u c S t a t u s S ( u , u ) = 1 ( H L i t ( u ) H L i t ( u ) ) 2 + ( E d u c L v l ( u ) E d u c L v l ( u ) ) 2 2 m a x D i f 2
H L i t ( u ) is a function that reports the health literacy level of user u and E d u c l v l ( u ) reports his/her education level. To better combine these scores with the ratings and health problems similarity scores, we normalize them so that the function returns values in the range of [ 0 , 1 ] . The variable m a x D i f represents the maximum difference between the two education or health literacy scores. Finally, as we want the similarity score and not the distance between the users we subtract the distance score from 1.

3.2.4. Similarity Based on Psycho-Emotional Status

Finally, anxiety and cognitive closure have an important impact on the documents preferred by people in specific periods of time, as anxiety and cognitive closure can change over time. As such, we use the Euclidean distance between the values of those two properties. As psychoemotional questionnaires are being answered periodically, we consider each time only the latest measurements on these.
P h y c h S t a t u s S ( u , u ) = 1 ( A n x i e t y ( u ) A n x i e t y ( u ) ) 2 + ( C o g n C l ( u ) C o g n C l ( u ) ) 2 2 m a x D i f 2
A n x i e t y ( u ) is a function that provides the anxiety level of user u and C o g n C l ( u ) provides his/her cognitive closure status. Similarly with the similarity based on education and health literacy levels, we normalize the euclidean score and subtract it from 1 to get the similarity score.

3.2.5. Similarity between Users

Having defined all the different methods to compute similarity scores between two users, we need a way to combine all the different values into a final similarity score. We propose that not all different information perspectives are equally important to all aspect of collaborative filtering, so we assign weights on each similarity score which determines their significance.
S ( u , u ) = α R a t S ( u , u ) + β S e m S ( u , u ) + γ E d u c S t a t u s S ( u , u ) + δ P h y c h S t a t u s S ( u , u )
where α + β + γ + δ = 1 .

3.3. Single User Rating Model

Let P u define the set of the most similar patients to u. Here, we refer to P u as the peers of u. Formally:
Definition 7
(Peers). Let U be a set of patients. The peers P u of a patient u U include the patients u U that are similar to u with respect to a similarity function S ( u , u ) and a threshold δ, that is, P u = { u U : S ( u , u ) δ } .
Given a patient u and his/her peers P u , if u has no liking for a document i, the relevance of i for u is computed as
r e l e v a n c e ( u , i ) = μ u + u ( P u U ( i ) ) S ( u , u ) ( r ( u , i ) μ u ) u ( P u U ( i ) ) | s ( u , u ) |
where μ u denotes the mean of the ratings in I ( u ) . Typically, after computing the relevance scores of the unrated documents for a user u, the documents A u with the top-k scores are presented to u.

4. Group Recommendations

We are not only interested in recommending valuable suggestions to single patients, but to groups of patients via the caregivers who are responsible for the groups. Specifically, we focus on suggestions that are both related and fair to the group members. In Section 3.2, we discussed about the similarity functions and the relevance function was mentioned in Section 3.3. In this section, we will examine four different aggregation methods.

4.1. Group Rating Model

Typically, the related work in recommender systems targets at satisfying the interests of individual users. Recently, group recommenders that produce suggestions for groups of users (see, e.g., [29,52]) that are in the focus of the research literature. Commonly, group recommenders predict relevance scores for the unrated items for each group member, separately, and aggregate these scores to estimate the suggestions for the group. Formally, the relevance of an item for a group is defined as follows.
Definition 8
(Relevance). Let U be a set of patients and I be a set of documents. Given a group of patients G, G U , the group relevance of a document i I for G, such that, u G , r a t i n g ( u , i ) , is
r e l e v a n c e G ( G , i ) = A g g r u G ( r e l e v a n c e ( u , i ) )
With respect to the items relevance scores, the items with the top-k best scores for the group are reported to the group.

4.2. Fairness in Group Recommendations

In this work, our aim is to identify and suggest documents highly related and fair to the patients of the group. Specifically, given set of recommendations for a group to its caregiver, it is possible to have a patient u that is the least satisfied one in the group for all documents in the recommendations list, that is, all items are not relevant to u. That is, this set of documents is not fair to u. In real life, the caregiver is responsible for the needs of all group patients, and the recommender should suggest documents that are relevant and fair to the majority of the group. Inspired by work in [30], to increase the quality of the recommendations, we exploit a fairness definition that evaluates the quality of the recommendations set. Therefore, given a patient u and a set of recommendations D, we define the degree of fairness of D for u as
f a i r n e s s ( u , D ) = | X | | D |
where X = A u D . Remember, A u are the items with the top-k relevance scores for u. Note that we only consider the intersection of the two lists as only those are going to be given to the patient. The group list is actually suggested to a caregiver, who then distributes the documents to the rest of the group according to how relevant they are to each patient. This is also why we do not take into account the ranking of each document in the group recommendation list.
To better determine the group cohesion and to understand if any member of the group is biased against, we define the group discord as the difference between the maximum and minimum fairness in the group.
g r o u p D i s c o r d ( G , D ) = m a x u G f a i r n e s s ( u , d ) m i n u G f a i r n e s s ( u , d )
The group discord takes values from 0 to 5. Ideally, we want group discord to take low values, as this will mean that the member of the group are treated equally. High values will indicate that at least one member is not as satisfied as the rest.

4.3. Aggregation Designs

For the aggregation method A g g r , we employ four different designs, each one carrying different semantics. Specifically, we divide the designs into the score-based and rank-based ones.
Score-based design predictions for documents are calculated with respect to the relevance of the documents for the group members.
In the case of the average aggregation method, our goal is to indulge the the majority of the group and report the average relevance for each document. Namely, relevance is computed as
r e l e v a n c e G ( G , i ) = u G r e l e v a n c e ( u , i ) / | G |
In turn, a rank-based design aggregates the patients recommendations lists using the positions of their elements. Here, we follow the Borda count method [53], based on which each document gets 1 point for each last place in the ranking, 2 points for each next to last place, and so forth, all the way up to k points for the first place in the ranking. The document with the more points takes the first position in the list, the item with the next more points gets the second position, and so on, up to collect the best k items. The points of each document i for the group G is calculated as follows,
p o i n t s ( G , i ) = u G ( k ( p u ( i ) 1 ) ) ,
where p u ( i ) defines the position of item i in A u .
The F a i r method [11] belongs as well to the rank-based methods. Fair considers pairs of patients in the group to make predictions. Specifically, a document i belongs to the top-k suggestions for a group G, if for a pair of patients u 1 , u 2 G , i A u 1 A u 2 , and i is the document with the maximum rank in A u 2 .
To produce recommendations, Fair incrementally creates an initially empty set D by choosing for each pair of patients u x and u y , the document in A u x with the maximum relevance score for u y (Algorithm 1). If k (i.e., documents to be reported to the group) is greater than the documents, we are able to find recommendations using the method above: we add documents to D by iterating the A u lists of the group members and adding each time the document with the maximum rank that does not appear in D.
Algorithm 1: Fair Group Recommendations Algorithm
Algorithms 13 00054 i001
In addition, we propose a new aggregation method, called AccScores method, which is inspired by the Borda method, but instead of accumulating the points of each item, we accumulate the scores of the items. We add the scores as they appear in the A u of all the group members in a set called a c c D o c . The first item we select to include in the group recommendation list is the one with the highest score in a c c D o c . After each selection, we update a helper structure a c c U s e r that consists of the users and their accumulating preference scores. For each user, we accumulate the scores of the items that were selected as they appear in the individual preference list A u . If there is a user u that has a lower score than the rest, in the next selection, we will choose an item that exists in the A u and at the same time has the highest possible score in the a c c D o c . If many users have the same lowest score, we select the user that has been chosen the least amount of times. This process is shown in Algorithm 2.
In Lines 1–10, we populate the sets a c c D o c and a c c U s e r . If all the users have the same accumulated score (Line 12), then we select the item with the highest score in a c c D o c (Line 13). Otherwise, we find the user with the lowest score (Line 15), and then we locate the item that appears both in the user’s preference list and has the highest possible score in a c c D o c (Line 16). Then, we add to the structure a c c U s e r the score of the selected item for each member (Lines 18-20). Finally, we include the item in the group recommendation list D.
Algorithm 2: AccScores Group Recommendations Algorithm
Algorithms 13 00054 i002

5. Dataset

Nowadays, it is quite common for patients to search for information related to their health problems, as well as to rate the related documents that appear on the Web. However, the profiles of such patients are not accessible and linked to those documents. For several reasons, including ethical and legal constraints, the collection and use of such a data is prohibited.
To experiment with such a dataset, we initially exploited 10,000 chimeric patient profiles [54]. These profiles contain characteristics similar to the ones existing in a real medical database. For example, we consider the patients’ admission details, demographics, socioeconomic details, labs, and medications. Additionally, we use the ICD10 ontology for describing the health problems for each patient, making this dataset ideal for our semantic similarity approach.
Then, by exploiting these profiles, we create a synthetic dataset that includes a document corpus and user ratings. Specifically:
  • Document Corpus
    -
    Create document corpus. Initially, we generated n u m D o c s documents for each node in the second level of the ontology tree that represents the ICD10 ontology. For each such document, we selected randomly n u m K e y W o r d s words from the nodes descriptions in each subsequent subtree.
    -
    Assignment of Education and Health Literacy Levels. We divide the documents based on five percentage scores e d u H L i t 1 e d u H L i t 5 that correspond to the five different education levels. We assign to the documents in each subgroup their corresponding education level. We propose that a document cannot have a vastly different education and health literacy score. A document that has high education level is improbable to be for users with low literacy score and, similarly, a document with high health literacy is not probable to have a low education level. Therefore, with equal probability, we assign to each document a health literacy score that is the same, one highest or one lowest level than that of its education level.
  • Rating Dataset
    -
    Divide the patients into groups. We assume that all patients have assigned n u m R a t i n g s ratings to documents. For doing so, we distinguish the patients between o c c a s i o n a l , r e g u l a r , and d e d i c a t e d . The users in each group gave few, average and a lot of ratings, respectively.
    -
    Assignment of Education and Health Literacy Levels. The procedure to assign education and health literacy levels to the patients is the same as the one to assign them to the documents.
    -
    Assignment of Anxiety and Cognitive Closure. Anxiety and cognitive closure scores are regularly measured for each patient since these tend to change rapidly. This is why in our methods we only take into account the most recent ones. Therefore, in our dataset, we generate one anxiety and cognitive closure score for each patient. We follow a similar method as the one for education and health literacy levels and divide the patients based on five percentage scores A n x C o g n C l 1 A n c C o g n C l 5 . However, now anxiety will be the score that will define cognitive closure. The more anxious a person is about their health problems the more he/she needs to understand them.
    -
    Simulate a power law rating distribution. When ranking documents with respect to real users preferences, the documents typically follow the power law distribution. To show this, we randomly chose p o p u l a r D o c s documents and consider them as the most popular.
    -
    Generate documents to rate. For each patient, we distinguished the ratings that he/she will give between h e a l t h R e l e v a n t and n o n R e l e v a n t . Given the assumption that patients are interested in both documents related to their health problems, as well as to other documents, we assigned ratings to both such groups of documents.
    -
    Generate ratings. Last, for each item generated above, we randomly assigned a rating from 1 to 5.
The parameters that were used to generate the datasets needed for our experiments are shown is Table 3 and Table 4, which contain the parameters for the document corpus and rating dataset, respectively. The education percentages e d u H L i t 1 e d u H L i t 5 are only showcased in Table 4, but the same values were used for the generation of document corpus.

6. Evaluation

In this section, we present the metrics we used for the experimental evaluation of the similarities functions and aggregation methods as well as the results of these evaluations.

6.1. Evaluation Measures

To evaluate the similarity functions, we used the normalized Discounted Cumulative Gain [55]. The n D C G values for all users’ recommendation lists can be averaged to get a measure of the average performance of a recommendation system. The n D C G can be calculated as follows,
n D C G u = D C G u I D C G u
where
D C G u = i = 1 k 2 r e l e v a n c e ( u , i ) 1 l o g 2 ( i + 1 )
and
I D C G u = i = 1 k 2 r ( u , i ) 1 l o g 2 ( i + 1 )
The D C G u part of the equation calculates the relevance of the items that appear in the recommendation list of a user and the I D C G u calculates the relevance of the items in an ideal scenario. Note that in an ideal recommendation list, D C G u equals to I D C G u producing an nDCG of 1.0. Then, nDCG scores are relative values on the interval 0.0 to 1.0.
To evaluate the t o p -k results of each aggregation method, we counted the average of the distance between the t o p -k recommendation list produced for the group and the list produced for each user separately. For computing the distance, we used the Kendall tau distance that numerates the number of pairwise disagreements between two ranking lists [56].
K ( t 1 , t 2 ) = | { ( i , j ) : i < j , ( t 1 ( i ) < t 1 ( j ) t 2 ( i ) > t 2 ( j ) ) ( t 1 ( i ) > t i ( j ) t 2 ( i ) < t 2 ( j ) ) } |
where t 1 ( i ) and t 2 ( i ) are the rankings of the element i in t 1 and t 2 , respectively.

6.2. Evaluation Results

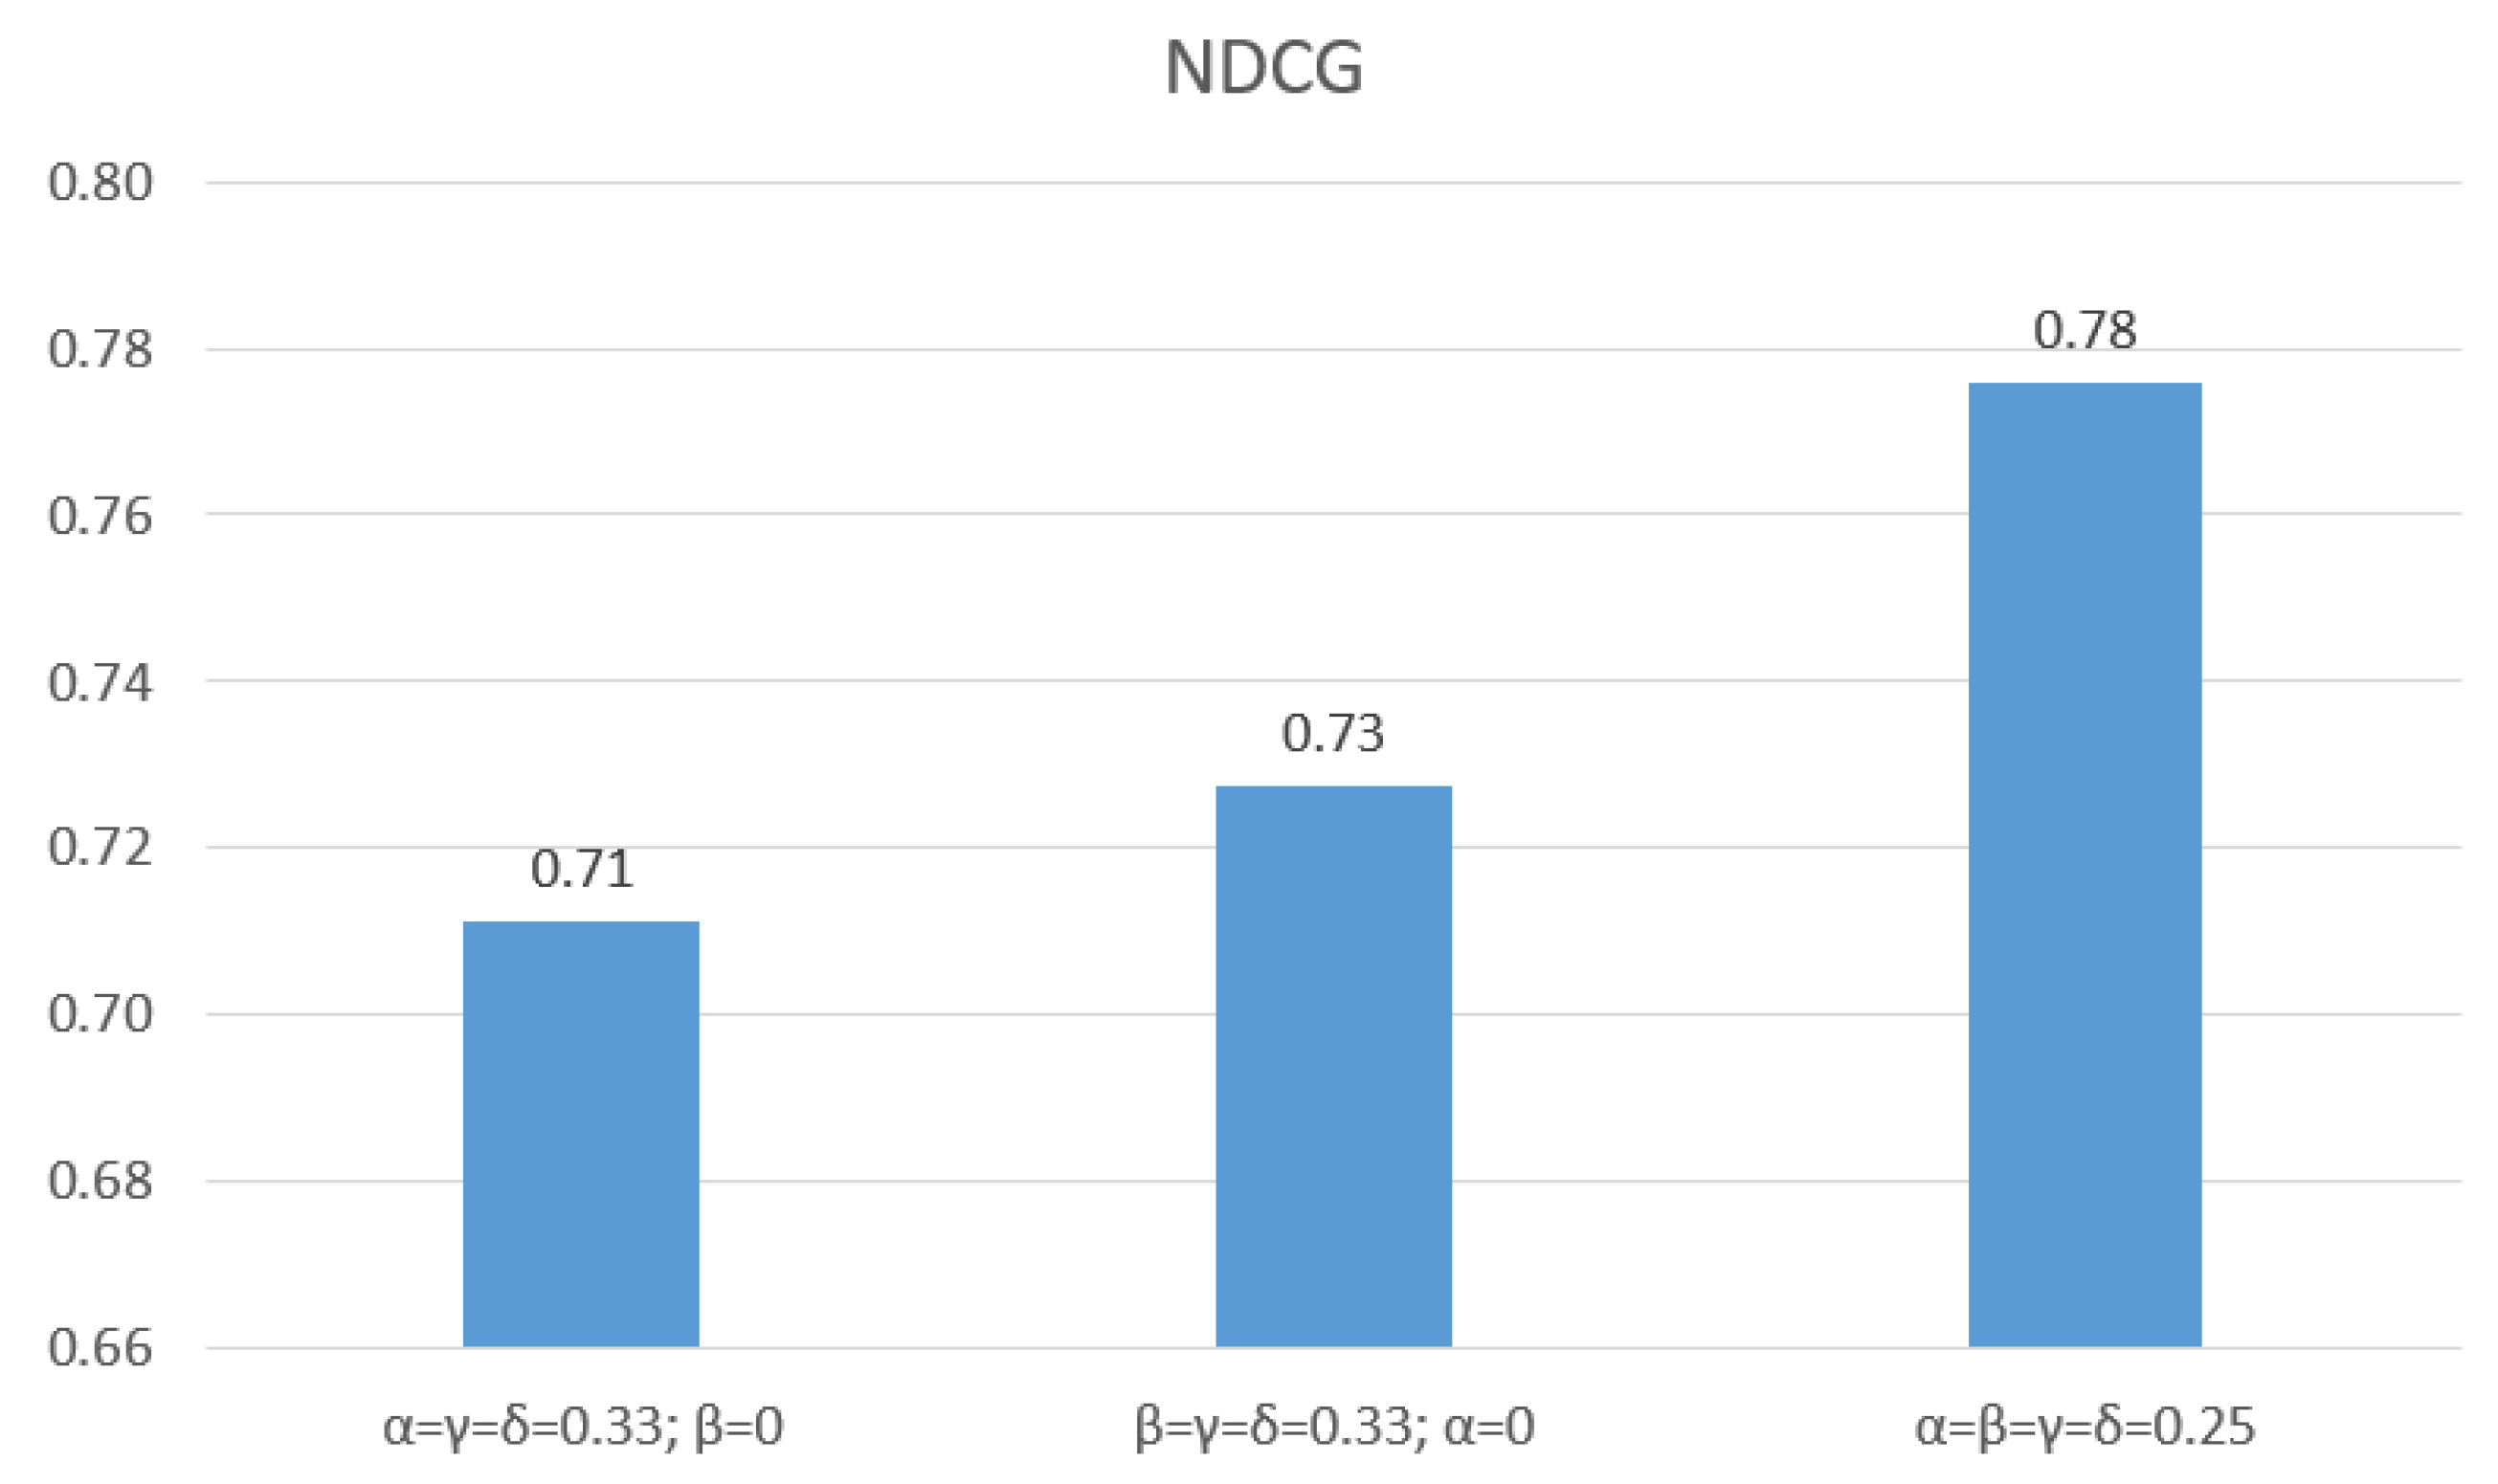
6.2.1. Evaluation of Similarity Functions

To evaluate the proposed similarity functions, we used the recommendations produced for single users. We used 50 users, for which we hidden 20% percent of their ratings. We then applied the recommendation algorithm using different values for the variables α , β , γ , and δ and predicted a score for them. We used the hidden items as the ground truth for the calculation of the I D C G . Finally, we averaged these scores. The results are shown in Figure 2. In our experiments, for computing the semantic similarity function SemS, we used the value of 0.1 for constant w that is needed in Definition 1. As a reminder, α is the weight that corresponds to the rating similarity R a t S , β to health problems similarity S e m S , γ to education/health literacy similarity E d u c S t a t u s S , and δ to anxiety/cognitive closure similarity P h y c h S t a t u s S .
In our previous work [11], we showed that S e m S outperforms R a t S . We now want to focus on what effect the E d u c S t a t u s S and P h y c h S t a t u s S has on them. When we introduce the two new similarities to the old ones, we can still observe that the S e m S gives better results. However, if we combine all the similarities we get the best n D C G values. The S e m S and R a t S similarities can compensate for the faults of each other. S e m S can find patients with similar health problems which means that they have an interest in the same documents. R a t S can find all the other patients that are not necessarily related with similar health problems, but have a similar interest in documents. The results improve further when we E d u c S t a t u s S and P h y c h S t a t u s S . They further refine the selection of the peers, so the recommendations are more accurate.
We did not make any evaluations for γ and δ on their own as the E d u c S t a t u s S and P h y c h S t a t u s S similarities offer more auxiliary and not defining information for the patients. They need another similarity to augment their knowledge in order to function as intended.

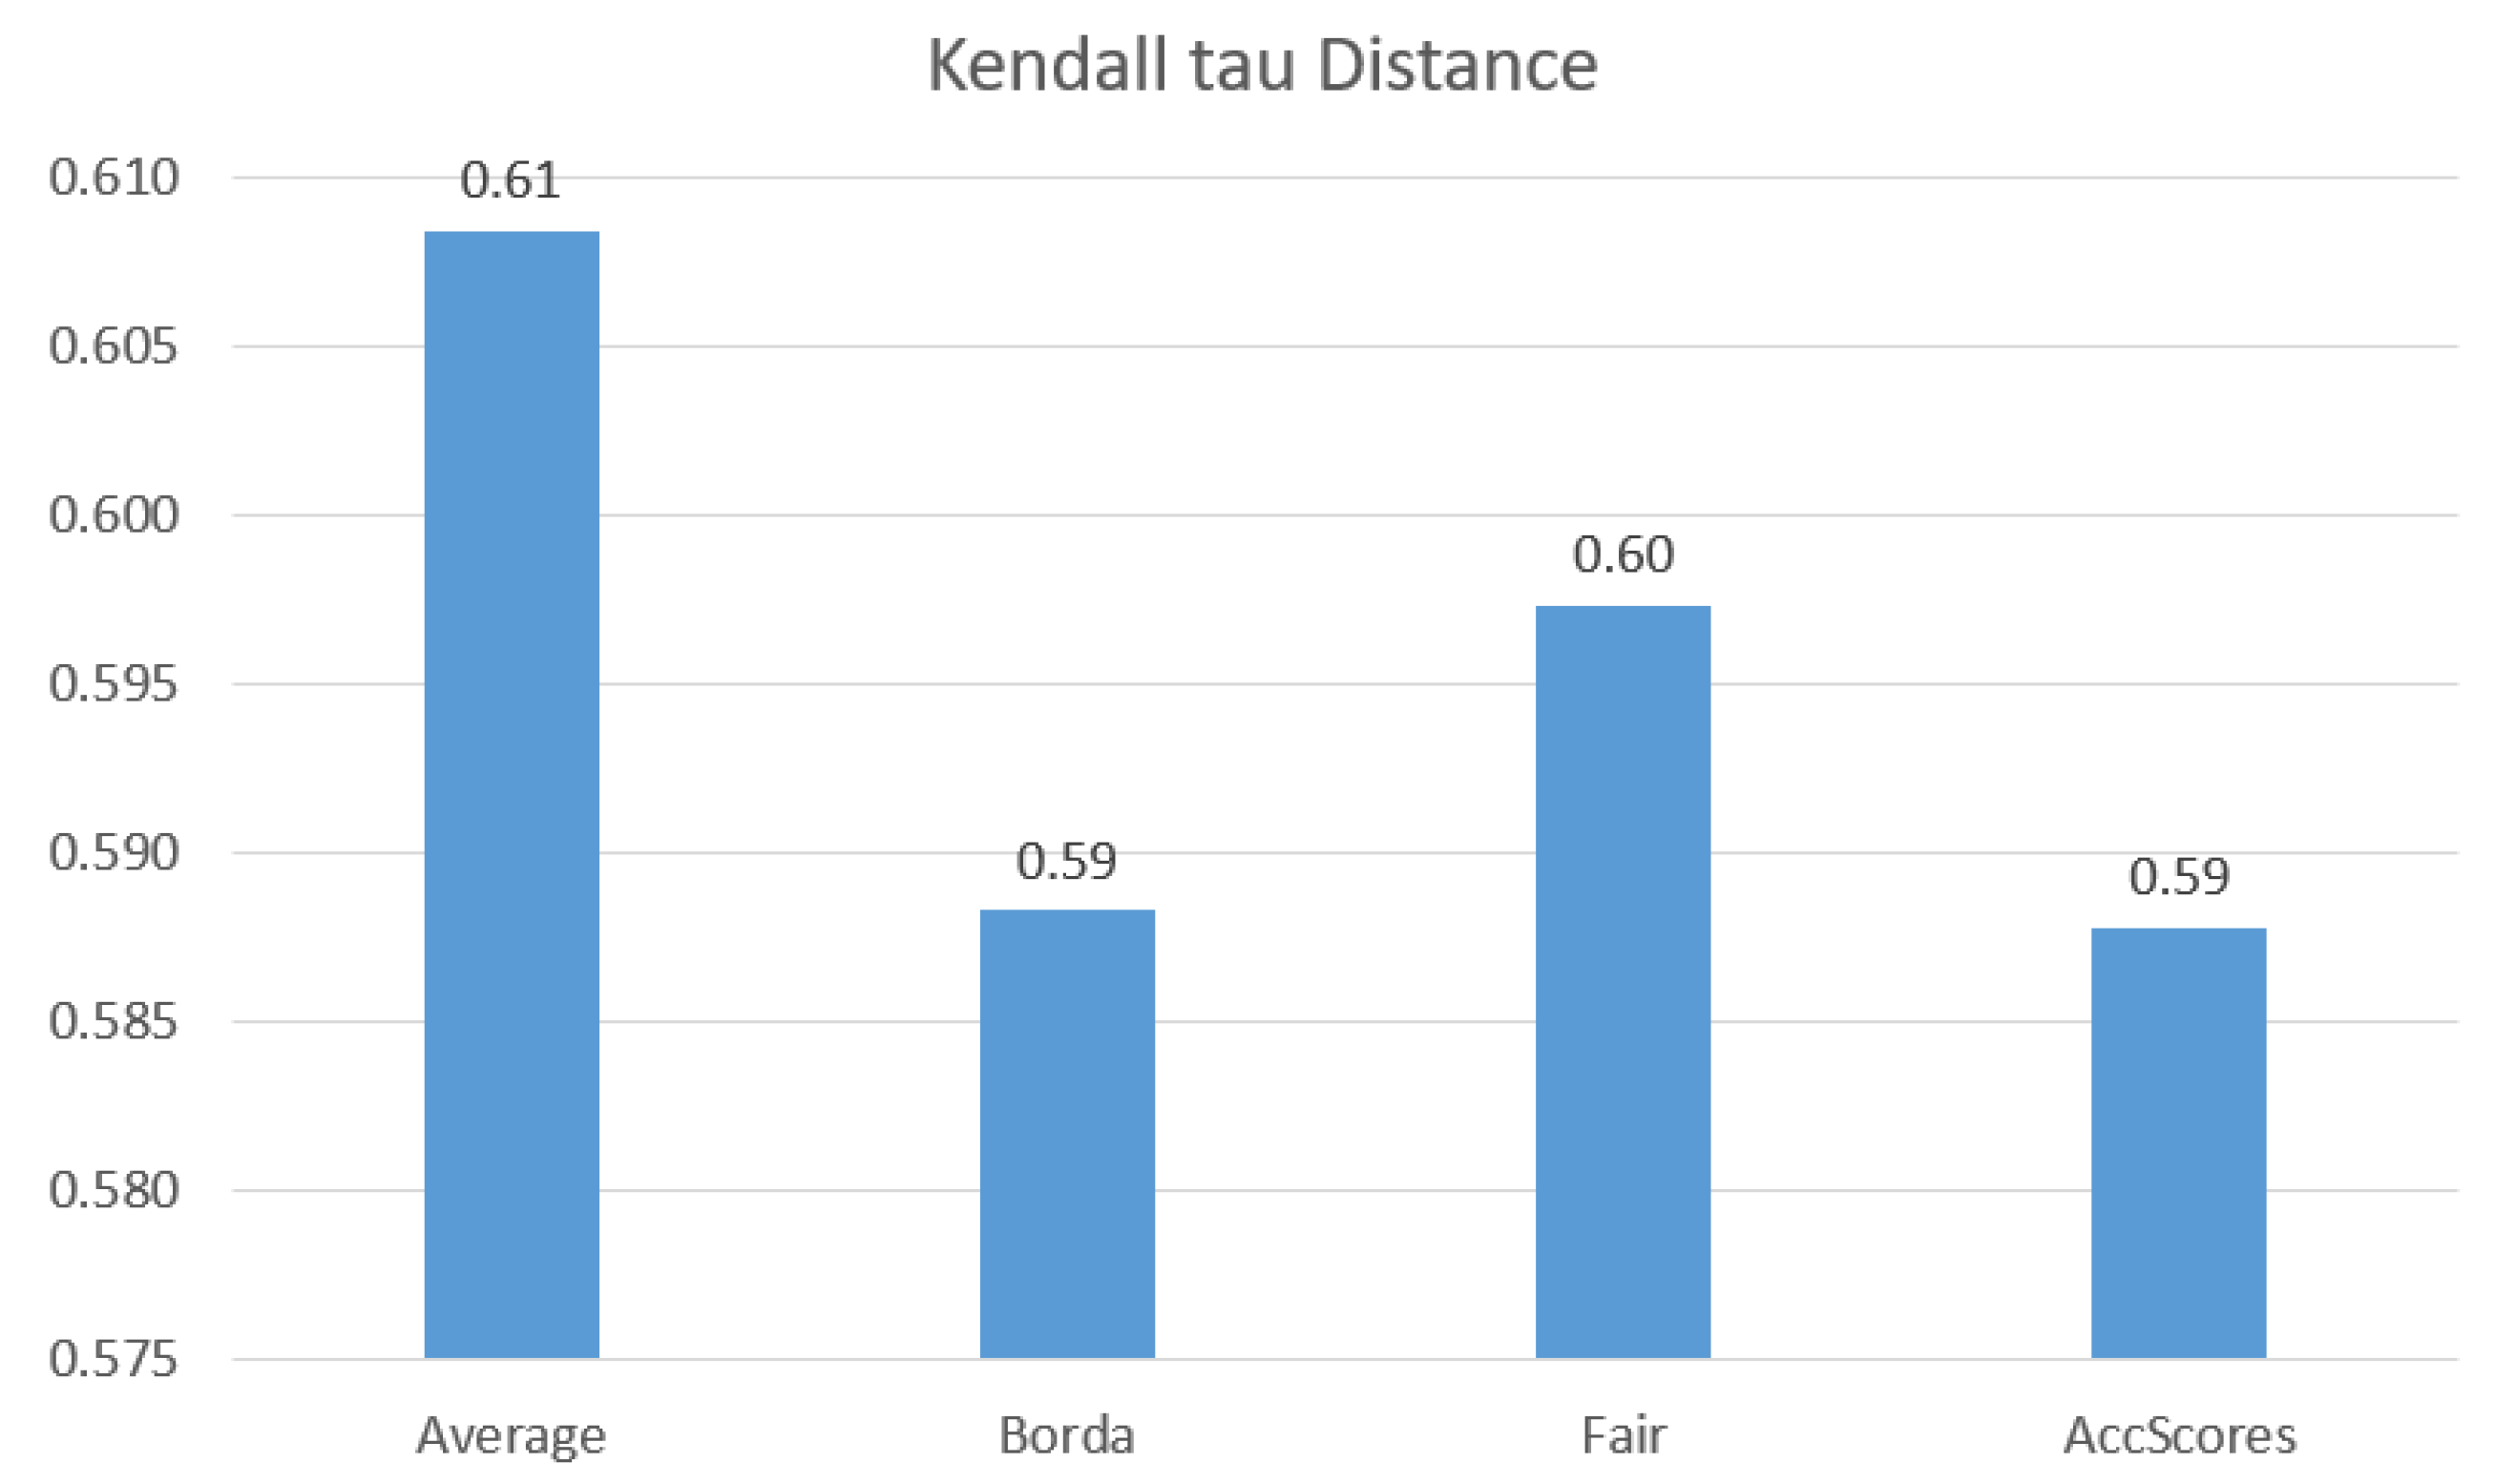
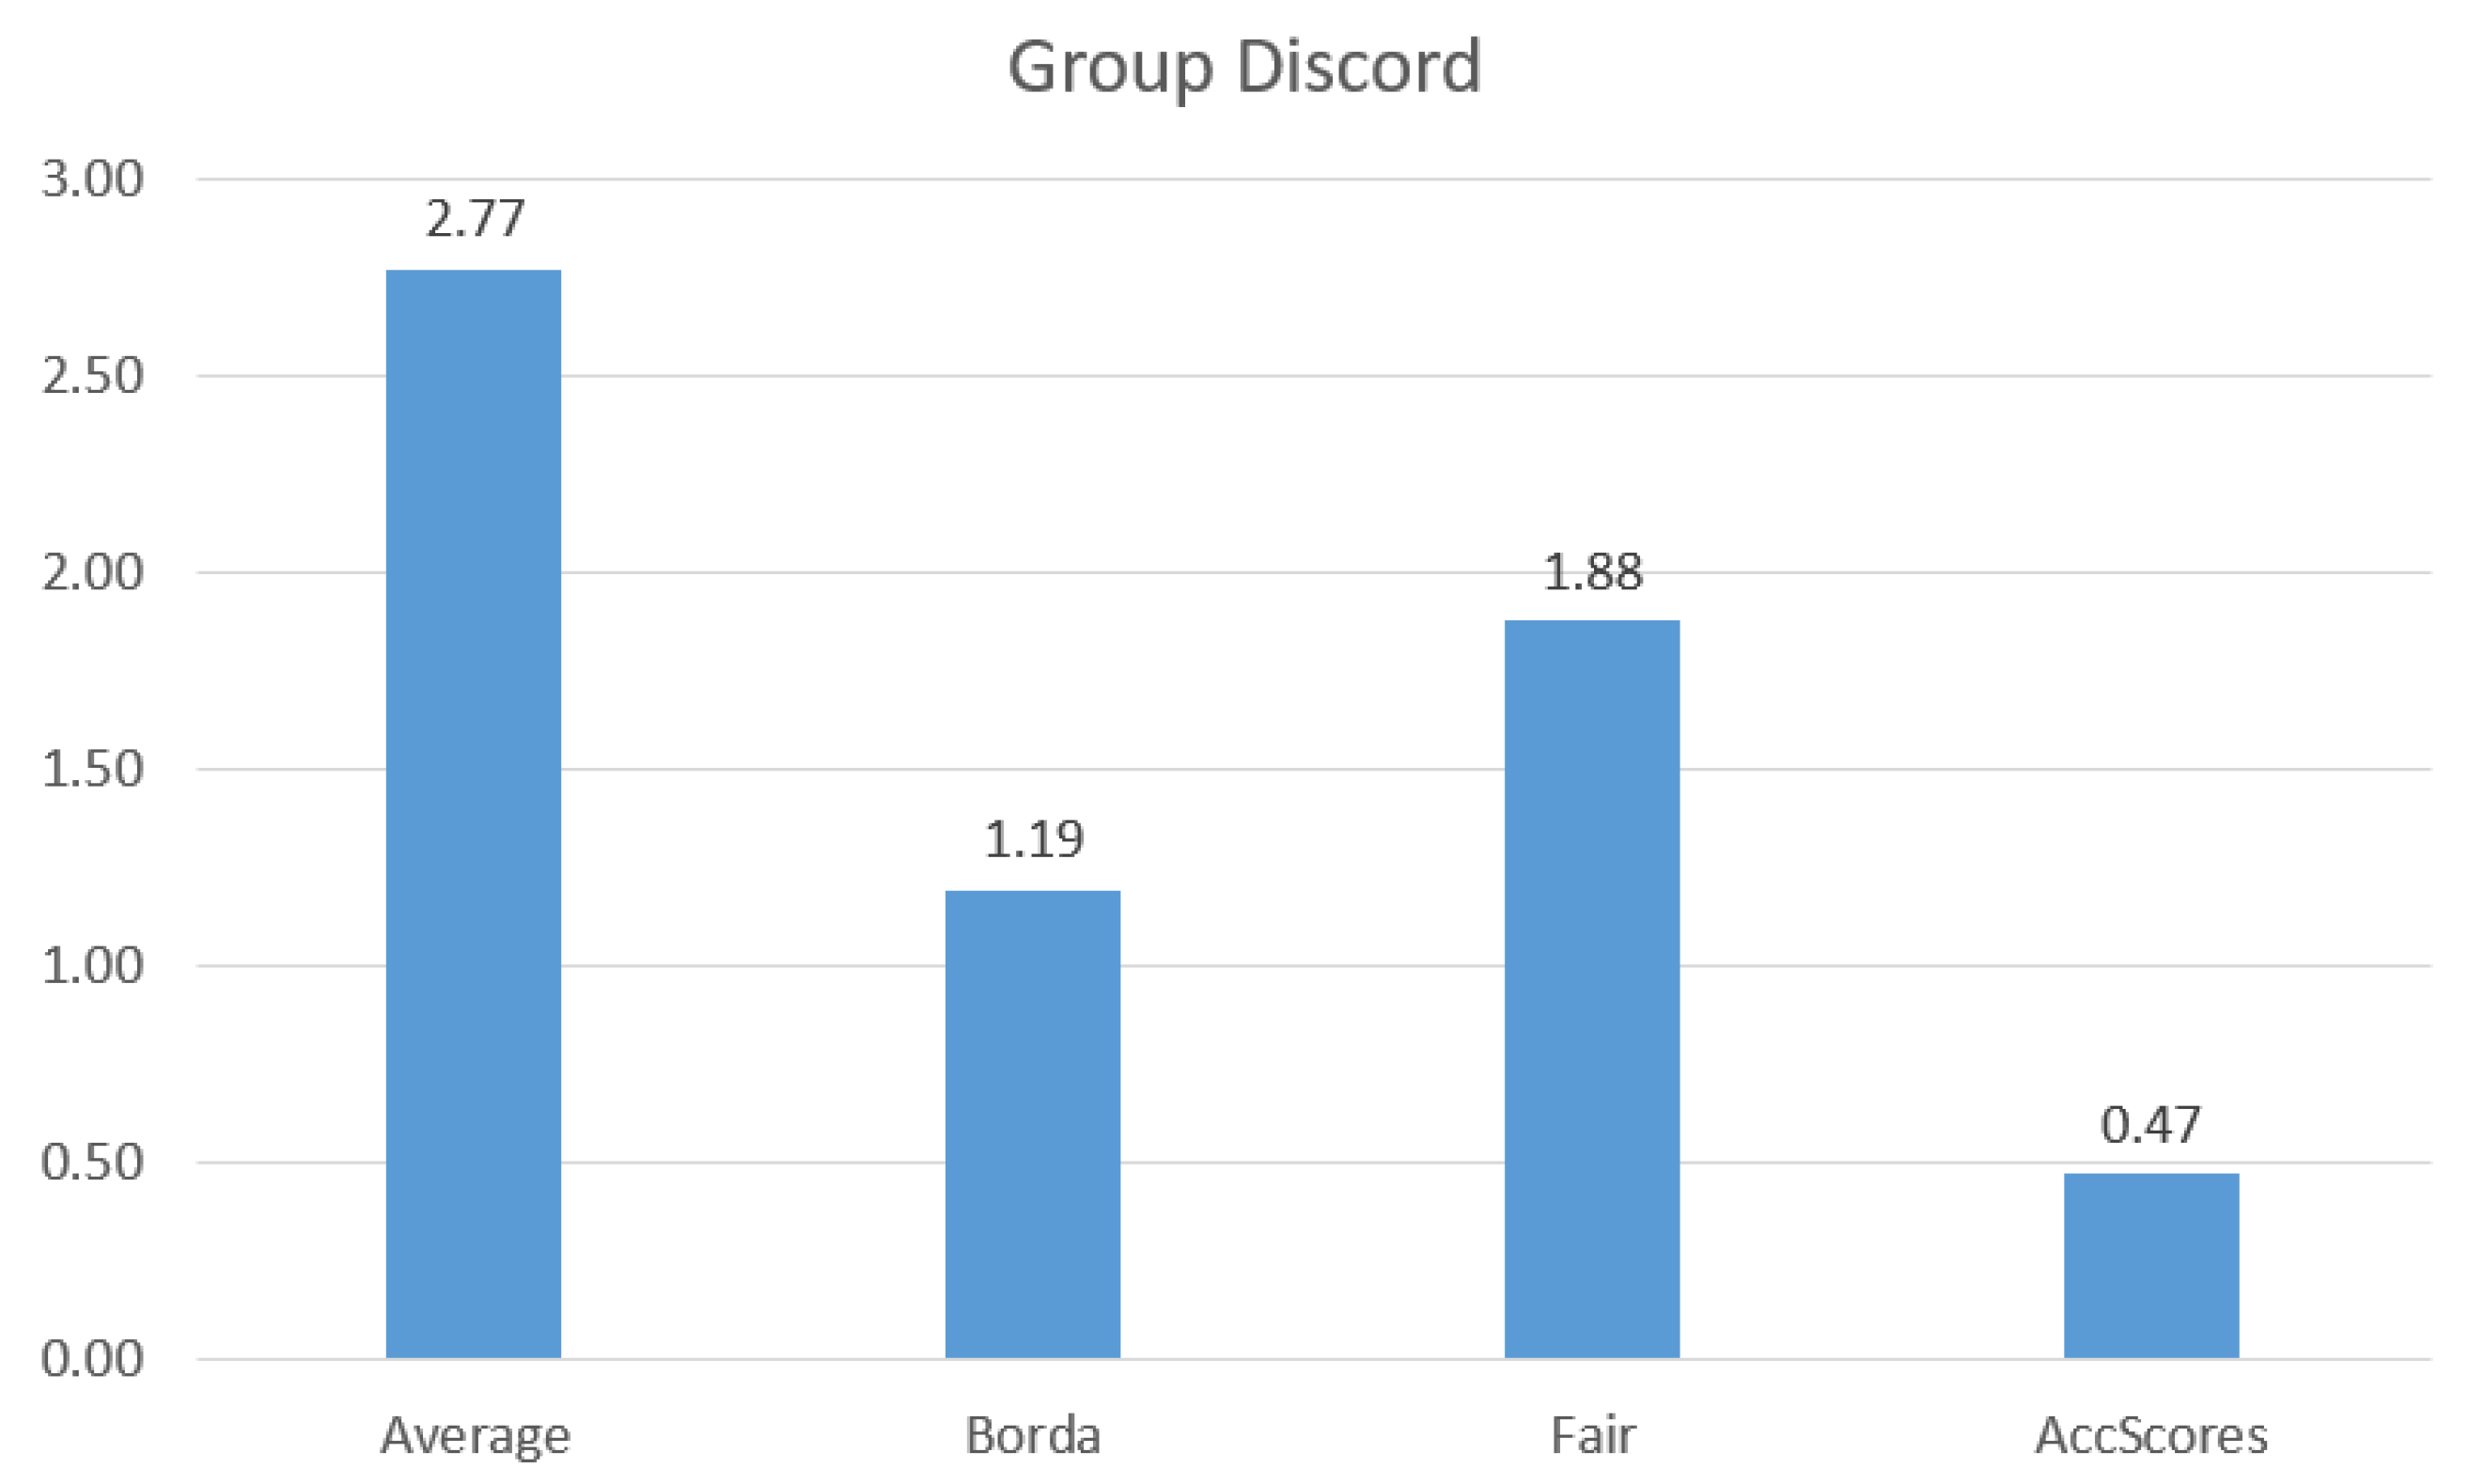
6.2.2. Evaluation of Aggregation Methods

To evaluate the effectiveness of each aggregation method, in regards to the construction of the final group recommendation list, we use the Kendall tau distance. In more detail, we calculate the distance between the t o p -k list of each group member, and the recommendation list for the group. Additionally, we have normalized all distance scores to the range of [0,1]. Intuitively, a low distance score between the two lists, meaning that the recommender system suggests close to optimal items for that user. In this way, we can estimate the difference between the lists, and consequentially how many of the most highly recommended documents for each user, have been included in the group recommendations. These experiments help us identify whether each aggregation method makes adequate use of the individual t o p -k list of the members of the group.
To produce these results, we selected randomly 40 different groups with approximately the same group similarity. Group similarity is defined as the summation of the similarity of all pairs of users in the group, averaged over the number of the pairs. As our working study case is for a care provider responsible for a group of patients, it makes sense for these patients to be similar. Furthermore, we propose that during the formation of the groups the most important factor is the health similarity followed by their education/health literacy similarity. Their anxiety levels (which are ephemeral) or their ratings (personal preferences) are not of equal importance when we want to group people that will be cared for by just one person. We assign the following weights to Equation (10): α = 0.25 , β = 0.4 , γ = 0.3 , δ = 0.05 .
After generating the group recommendation list, we compute for each group member the distance between the individual t o p -k list and the group recommendation list. The distance score for one group for each aggregation method is the average score of the sum of these distances over the size of the group. After following the same process for all 40 groups, the overall score for each aggregation method is the mean of the previously calculated scores, over the number of groups. We set k to be 20, meaning the group recommendation list consists of 20 items. Figure 3 gives the results for groups with similarity 0.6. This figure will give a general overview of the effectiveness of each aggregation design.
We can see that both the Borda and AccScores aggregation methods perform the best, followed by the Fair method. Average has the worst results. However, the differences between the aggregation methods are minuscule. Due to our case study, all the group members are similar to each other to a degree. When trying to aggregate their t o p -k recommendations, regardless of the aggregation design, the most relevant items to the group are suggested. Additionally, as we calculate the average distance score for each group, it is expected to have higher values of distance scores for each method. Although the methods identify many of the users relevant documents, the high distance scores mostly correspond to the difference in the positions of the items between the two lists. What we are more interested in is the individual satisfaction of each group member. Remember this group does not ask for recommendations before proceeding to make a decision. We give a list of recommended items to a carer who proceeds to distribute them to a group of patients that he/she is responsible for.
To better understand the individual impact of the recommendation list to each group member, we have calculated the group discord. Ideally, we want all the members to be treated equally, meaning that the group recommendation list should be fair to all group members. This is especially important in the health domain, where information about people’s health should be as accurate as possible. In that regard, the system should not return a list that is biased against one member. Therefore, the lower group discord values an aggregation method generates, the better it is for our purposes.
Figure 4 shows the group discord values for the same 40 groups we used in the previous experiment. Even though the previous experiment did not show any huge difference in the behavior of the aggregation methods, when we compare their fairness aspect, there is a distinct disparity between them. This higher variance in the group discord scores of the different aggregation methods compared to the ones from the distance measure is attributed to the different natures of the two measures. Kendall tau distance not only takes into account the existence of an item in the two lists, but also their position. On the other hand, our fairness method (Equation (13)) only considers if two items are present in both lists.
The AccScores method manages to identify a set of items that are almost equally fair to all members (group discord is lower than 0.5), whereas the Average method has the worst results with values above 2.5. Borda and Fair methods offer median results, with Borda being slightly better than Fair. This experiment makes more apparent the advantage of the AccScores method over all the rest. Even though in the previous experiment it had the same scores as the Borda method, AccScores manages to be fairer to the members of the group. For our case study, being fair to all members is a top priority for any system.

7. Conclusions

In this work, we focus on multidimensional group recommendations in the health domain, using collaborative filtering. For identifying similarity among patients, we go beyond ratings to also consider the medical problems, the education, the health literacy, and the psycho-emotional statues of the patients, all available in their personal profile. Based on those dimensions, we introduce a new aggregation method accumulating preference scores and we experimentally show that it manages to identify set of items that are almost equally fair to all members of the group.
The semantic similarity measure proposed assumes that the health information of a patient is captured using standard terminologies. Although this is a common practice nowadays, there is still a lot of textual information that are not always mapped to standard terminologies. Nevertheless, today there exist many tools that annotate effectively textual descriptions to terminological terms. For example, the Bioportal Annotator (https://bioportal.bioontology.org/annotator) exposes programmatically an API for annotating textual information with multiple terminologies. An extension of our work could use this API to annotate textual descriptions as well. The same assumption holds for the interesting documents recommended to the patients. Additionally, as future work, we intend to explore whether introducing additional patient characteristics (e.g., gender, stress, and medications) to our recommendation model can further improve the quality of the recommendations.

Author Contributions

Conceptualization, M.S., H.K., and K.S.; Data curation, M.S.; Formal analysis, M.S., H.K., and K.S.; Investigation, M.S., H.K., and K.S.; Methodology, M.S.; Software, M.S.; Supervision, H.K. and K.S.; Validation, M.S.; Writing—original draft, M.S.; Writing—review & editing, M.S., H.K., and K.S. All authors have read and agreed to the published version of the manuscript.

Funding

This research received no external funding.

Conflicts of Interest

The authors declare no conflict of interest.

References

  1. Berg, G.M.; Hervey, A.M.; Atterbury, D.; Cook, R.; Mosley, M.; Grundmeyer, R.; Acuna, D. Evaluating the quality of online information about concussions. J. Am. Acad. PAS 2014, 27, 1547–1896. [Google Scholar] [CrossRef] [PubMed]
  2. McMullan, M. Patients using the Internet to obtain health information: How this affects the patient-health professional relationship. Patient Educ. Couns. 2006, 63, 24–28. [Google Scholar] [CrossRef] [PubMed]
  3. Wiesner, M.; Pfeifer, D. Adapting recommender systems to the requirements of personal health record systems. In Proceedings of the ACM International Health Informatics Symposium, IHI 2010, Arlington, VA, USA, 11–12 November 2010; pp. 410–414. [Google Scholar]
  4. Brandon, I.; Daniel, K.; Patrice, C.; Nicholas, T. Testing the Efficacy of OurSpace, a Brief, Group Dynamics-Based Physical Activity Intervention: A Randomized Controlled Trial. J. Med. Internet Res. 2016, 18, e87. [Google Scholar]
  5. Cheung, D.Y.T.; Chan, H.C.H.; Lai, J.C.K.; Chan, V.W.F.; Wang, P.M.; Li, W.H.C.; Chan, C.S.S.; Lam, T.H. Using WhatsApp and Facebook Online Social Groups for Smoking Relapse Prevention for Recent Quitters: A Pilot Pragmatic Cluster Randomized Controlled Trial. J. Med. Internet Res. 2015, 17, e238. [Google Scholar] [CrossRef] [PubMed] [Green Version]
  6. Batenburg, A.; Das, E. Emotional Approach Coping and the Effects of Online Peer-Led Support Group Participation Among Patients With Breast Cancer: A Longitudinal Study. J. Med. Internet Res. 2014, 16, e256. [Google Scholar] [CrossRef] [Green Version]
  7. Serbos, D.; Qi, S.; Mamoulis, N.; Pitoura, E.; Tsaparas, P. Fairness in Package-to-Group Recommendations. In Proceedings of the 26th International Conference on World Wide Web (WWW), Perth, Australia, 3–7 April 2017. [Google Scholar]
  8. Machado, L.; Stefanidis, K. Fair Team Recommendations for Multidisciplinary Projects. In Proceedings of the IEEE/WIC/ACM International Conference on Web Intelligence (WI), Thessaloniki, Greece, 14–17 October 2019. [Google Scholar]
  9. Stratigi, M.; Kondylakis, H.; Stefanidis, K. Fairness in Group Recommendations in the Health Domain. In Proceedings of the 33rd IEEE International Conference on Data Engineering, ICDE 2017, San Diego, CA, USA, 19–22 April 2017; pp. 1481–1488. [Google Scholar]
  10. Stratigi, M.; Kondylakis, H.; Stefanidis, K. The FairGRecs Dataset: A Dataset for Producing Health-related Recommendations. In Proceedings of the First International Workshop on Semantic Web Technologies for Health Data Management, SWH@ISWC 2018, Monterey, CA, USA, 9 October 2018. [Google Scholar]
  11. Stratigi, M.; Kondylakis, H.; Stefanidis, K. FairGRecs: Fair Group Recommendations by Exploiting Personal Health Information. In Proceedings of the Database and Expert Systems Applications—29th International Conference, DEXA 2018, Regensburg, Germany, 3–6 September 2018; pp. 147–155. [Google Scholar]
  12. Kondylakis, H.; Bucur, A.; Crico, C.; Dong, F.; Graf, N.; Hoffman, S.; Koumakis, L.; Manenti, A.; Marias, K.; Mazzocco, K.; et al. Patient empowerment for cancer patients through a novel ICT infrastructure. J. Biomed. Inform. 2020, 101, 103342. [Google Scholar] [CrossRef]
  13. Kondylakis, H.; Koumakis, L.; Katehakis, D.G.; Kouroubali, A.; Marias, K.; Tsiknakis, M.; Simos, P.G.; Karademas, E. Developing a Data Infrastructure for Enabling Breast Cancer Women to BOUNCE Back. In Proceedings of the 32nd IEEE International Symposium on Computer-Based Medical Systems, CBMS 2019, Cordoba, Spain, 5–7 June 2019; pp. 652–657. [Google Scholar]
  14. Bobadilla, J.; Ortega, F.; Hernando, A.; Gutiérrez, A. Recommender systems survey. Knowl.-Based Syst. 2013, 46, 109–132. [Google Scholar] [CrossRef]
  15. Mooney, R.J.; Roy, L. Content-based book recommending using learning for text categorization. In Proceedings of the Fifth ACM Conference on Digital Libraries, San Antonio, TX, USA, 2–7 June 2000; pp. 195–204. [Google Scholar] [CrossRef]
  16. Konstan, J.A.; Miller, B.N.; Maltz, D.; Herlocker, J.L.; Gordon, L.R.; Riedl, J. GroupLens: Applying Collaborative Filtering to Usenet News. Commun. ACM 1997, 40, 77–87. [Google Scholar] [CrossRef]
  17. Lu, J.; Wu, D.; Mao, M.; Wang, W.; Zhang, G. Recommender system application developments: A survey. Decis. Support Syst. 2015, 74, 12–32. [Google Scholar] [CrossRef]
  18. Yin, Z.; Gupta, M.; Weninger, T.; Han, J. LINKREC: A unified framework for link recommendation with user attributes and graph structure. In Proceedings of the 19th International Conference on World Wide Web, WWW 2010, Raleigh, NC, USA, 26–30 April 2010. [Google Scholar]
  19. Eirinaki, M.; Abraham, S.; Polyzotis, N.; Shaikh, N. QueRIE: Collaborative Database Exploration. IEEE Trans. Knowl. Data Eng. 2014, 26, 1778–1790. [Google Scholar] [CrossRef]
  20. Koskela, M.; Simola, I.; Stefanidis, K. Open Source Software Recommendations Using Github. In Proceedings of the International Conference on Theory and Practice of Digital Libraries, Porto, Portugal, 10–13 September 2018. [Google Scholar]
  21. Ge, X.; Chrysanthis, P.K.; Pelechrinis, K. MPG: Not So Random Exploration of a City. In Proceedings of the 17th IEEE International Conference on Mobile Data Management (MDM), Porto, Portugal, 13–16 June 2016. [Google Scholar]
  22. Stratigi, M.; Nummenmaa, J.; Pitoura, E.; Stefanidis, K. Fair Sequential Group Recommendations. In Proceedings of the 35th ACM/SIGAPP Symposium on Applied Computing, SAC 2020, Brno, Czech Republic, 30 March–3 April 2020. [Google Scholar]
  23. Borges, R.; Stefanidis, K. Enhancing Long Term Fairness in Recommendations with Variational Autoencoders. In Proceedings of the 11th International Conference on Management of Digital EcoSystems, MEDES 2019, Limassol, Cyprus, 12–14 November 2019. [Google Scholar]
  24. Stefanidis, K.; Kondylakis, H.; Troullinou, G. On Recommending Evolution Measures: A Human-Aware Approach. In Proceedings of the 33rd IEEE International Conference on Data Engineering, ICDE 2017, San Diego, CA, USA, 19–22 April 2017; pp. 1579–1581. [Google Scholar]
  25. Troullinou, G.; Kondylakis, H.; Stefanidis, K.; Plexousakis, D. Exploring RDFS KBs Using Summaries. In Proceedings of the The Semantic Web—ISWC 2018—17th International Semantic Web Conference, Monterey, CA, USA, 8–12 October 2018; pp. 268–284. [Google Scholar]
  26. Gartrell, M.; Xing, X.; Lv, Q.; Beach, A.; Han, R.; Mishra, S.; Seada, K. Enhancing group recommendation by incorporating social relationship interactions. In Proceedings of the 2010 International ACM SIGGROUP Conference on Supporting Group Work, GROUP 2010, Sanibel Island, FL, USA, 6–10 November 2010; pp. 97–106. [Google Scholar]
  27. Castro, J.; Lu, J.; Zhang, G.; Dong, Y.; Martínez-López, L. Opinion Dynamics-Based Group Recommender Systems. IEEE Trans. Syst. Man Cybern. Syst. 2018, 48, 2394–2406. [Google Scholar] [CrossRef]
  28. Amer-Yahia, S.; Roy, S.B.; Chawla, A.; Das, G.; Yu, C. Group Recommendation: Semantics and Efficiency. PVLDB 2009, 2, 754–765. [Google Scholar] [CrossRef] [Green Version]
  29. Ntoutsi, E.; Stefanidis, K.; Nørvåg, K.; Kriegel, H. Fast Group Recommendations by Applying User Clustering. In Proceedings of the Conceptual Modeling—31st International Conference ER 2012, Florence, Italy, 15–18 October 2012; pp. 126–140. [Google Scholar]
  30. Qi, S.; Mamoulis, N.; Pitoura, E.; Tsaparas, P. Recommending Packages to Groups. In Proceedings of the IEEE 16th International Conference on Data Mining, ICDM 2016, Barcelona, Spain, 12–15 December 2016; pp. 449–458. [Google Scholar]
  31. Pfeifer, D. Health Recommender Systems: Concepts, Requirements, Technical Basics and Challenges. Int. J. Environ. Res. Public Health 2014, 11, 2580–2607. [Google Scholar]
  32. Schäfer, H.; Hors-Fraile, S.; Karumur, R.P.; Valdez, A.C.; Said, A.; Torkamaan, H.; Ulmer, T.; Trattner, C. Towards Health (Aware) Recommender Systems. In Proceedings of the 2017 International Conference on Digital Health, London, UK, 2–5 July 2017; pp. 157–161. [Google Scholar]
  33. Hors-Fraile, S.; Romero, O.R.; Schneider, F.; Fernández-Luque, L.; Luna-Perejón, F.; Balcells, A.C.; de Vries, H. Analyzing recommender systems for health promotion using a multidisciplinary taxonomy: A scoping review. Int. J. Med Inform. 2018, 114, 143–155. [Google Scholar] [CrossRef]
  34. Agapito, G.; Calabrese, B.; Guzzi, P.H.; Cannataro, M.; Simeoni, M.; Care, I.; Lamprinoudi, T.; Fuiano, G.; Pujia, A. DIETOS: A recommender system for adaptive diet monitoring and personalized food suggestion. In Proceedings of the 2th IEEE International Conference on Wireless and Mobile Computing, Networking and Communications, WiMob 2016, New York, NY, USA, 17–19 October 2016; pp. 1–8. [Google Scholar] [CrossRef]
  35. Espín, V.; Hurtado, M.V.; Noguera, M. Nutrition for Elder Care: A nutritional semantic recommender system for the elderly. Expert Syst. 2016, 33, 201–210. [Google Scholar] [CrossRef]
  36. Hors-Fraile, S.; Núñez-Benjumea, F.J.; Hernández, L.C.; Ruiz, F.O.; Fernández-Luque, L. Design of two combined health recommender systems for tailoring messages in a smoking cessation app. arXiv 2016, arXiv:1608.07192. [Google Scholar]
  37. Smileska, C.; Koceska, N.; Koceski, S.; Trajkovik, V. Development and Evaluation of Methodology for Personal Recommendations Applicable in Connected Health. In Enhanced Living Environments—Algorithms, Architectures, Platforms, and Systems; Lecture Notes in Computer Science; Ganchev, I., Garcia, N.M., Dobre, C., Mavromoustakis, C.X., Goleva, R., Eds.; Springer: New York, NY, USA, 2019; Volume 11369, pp. 80–95. [Google Scholar]
  38. Afolabi, A.O.; Toivanen, P.J. Integration of Recommendation Systems Into Connected Health for Effective Management of Chronic Diseases. IEEE Access 2019, 7, 49201–49211. [Google Scholar] [CrossRef]
  39. Hu, H.; Elkus, A.; Kerschberg, L. A Personal Health Recommender System incorporating personal health records, modular ontologies, and crowd-sourced data. In Proceedings of the 2016 IEEE/ACM International Conference on Advances in Social Networks Analysis and Mining, ASONAM 2016, San Francisco, CA, USA, 18–21 August 2016; pp. 1027–1033. [Google Scholar]
  40. Torrent-Fontbona, F.; López, B. Personalized Adaptive CBR Bolus Recommender System for Type 1 Diabetes. IEEE J. Biomed. Health Inform. 2019, 23, 387–394. [Google Scholar] [CrossRef]
  41. Kim, J.; Lee, D.; Chung, K. Item recommendation based on context-aware model for personalized u-healthcare service. Multimed. Tools Appl. 2014, 71, 855–872. [Google Scholar] [CrossRef]
  42. Wang, S.; Chen, Y.; Kuo, A.M.; Chen, H.; Shiu, Y. Design and evaluation of a cloud-based Mobile Health Information Recommendation system on wireless sensor networks. Comput. Electr. Eng. 2016, 49, 221–235. [Google Scholar] [CrossRef]
  43. Kondylakis, H.; Koumakis, L.; Kazantzaki, E.; Chatzimina, M.; Psaraki, M.; Marias, K.; Tsiknakis, M. Patient Empowerment through Personal Medical Recommendations. In Proceedings of the MEDINFO 2015: EHealth-enabled Health—Proceedings of the 15th World Congress on Health and Biomedical Informatics, São Paulo, Brazil, 19–23 August 2015; p. 1117. [Google Scholar]
  44. Kondylakis, H.; Koumakis, L.; Psaraki, M.; Troullinou, G.; Chatzimina, M.; Kazantzaki, E.; Marias, K.; Tsiknakis, M. Semantically-enabled Personal Medical Information Recommender. In Proceedings of the ISWC 2015 Posters & Demonstrations Track co-located with the 14th International Semantic Web Conference (ISWC-2015), Bethlehem, PA, USA, 11 October 2015. [Google Scholar]
  45. Nores, M.L.; Blanco-Fernández, Y.; Pazos-Arias, J.J.; Gil-Solla, A. Property-based collaborative filtering for health-aware recommender systems. Expert Syst. Appl. 2012, 39, 7451–7457. [Google Scholar] [CrossRef]
  46. Qin, L.; Xu, X.; Li, J. A Real-Time Professional Content Recommendation System for Healthcare Providers’ Knowledge Acquisition. In Proceedings of the Big Data—BigData 2018—7th International Congress, Held as Part of the Services Conference Federation, SCF 2018, Seattle, WA, USA, 25–30 June 2018; pp. 367–371. [Google Scholar]
  47. Bermingham, A.; Caprani, N.; Collins, R.; Gurrin, C.; Irving, K.; O’Rourke, J.; Smeaton, A.F.; Yang, Y. Recommending Video Content for Use in Group-Based Reminiscence Therapy. In Health Monitoring and Personalized Feedback Using Multimedia Data; Springer: New York, NY, USA, 2015; pp. 215–244. [Google Scholar]
  48. Kondylakis, H.; Kazantzaki, E.; Koumakis, L.; Genitsaridi, I.; Marias, K.; Gorini, A.; Mazzocco, K.; Pravettoni, G.; Burke, D.; McVie, G. et al. Development of interactive empowerment services in support of personalised medicine. eCancer 2014, 8, 400. [Google Scholar] [CrossRef] [PubMed] [Green Version]
  49. Berkman, N.D.; Davis, T.C.; McCormack, L. Health Literacy: What Is It? J. Health Commun. 2010, 15, 9–19. [Google Scholar] [CrossRef] [PubMed]
  50. Berkman, N.D.; DeWalt, D.A.; Pignone, M.; Sheridan, S.L.; Lohr, K.N.; Lux, L.; Sutton, S.F.; Swinson, T.; Arthur, J. Literacy and health outcomes. J. Gen. Intern. Med. 2004, 19, 1228–1239. [Google Scholar]
  51. Lillie, S.E.; Fu, S.S.; Fabbrini, A.E.; Rice, K.L.; Clothier, B.A.; Doro, E.; Melzer, A.C.; Partin, M.R. Does need for cognitive closure explain individual differences in lung cancer screening? A brief report. J. Health Psychol. 2018, 1359105317750253. [Google Scholar] [CrossRef] [PubMed]
  52. Roy, S.B.; Amer-Yahia, S.; Chawla, A.; Das, G.; Yu, C. Space efficiency in group recommendation. VLDB J. 2010, 19, 877–900. [Google Scholar] [CrossRef]
  53. Emerson, P. The original Borda count and partial voting. Soc. Choice Welf. 2013, 40, 353–358. [Google Scholar] [CrossRef]
  54. Kartoun, U. A Methodology to Generate Virtual Patient Repositories. arXiv 2016, arXiv:1608.00570. [Google Scholar]
  55. Järvelin, K.; Kekäläinen, J. IR Evaluation Methods for Retrieving Highly Relevant Documents. SIGIR Forum 2017, 51, 243–250. [Google Scholar] [CrossRef]
  56. Kendall, M. Rank Correlation Methods; Griffin: London, UK, 1948. [Google Scholar]
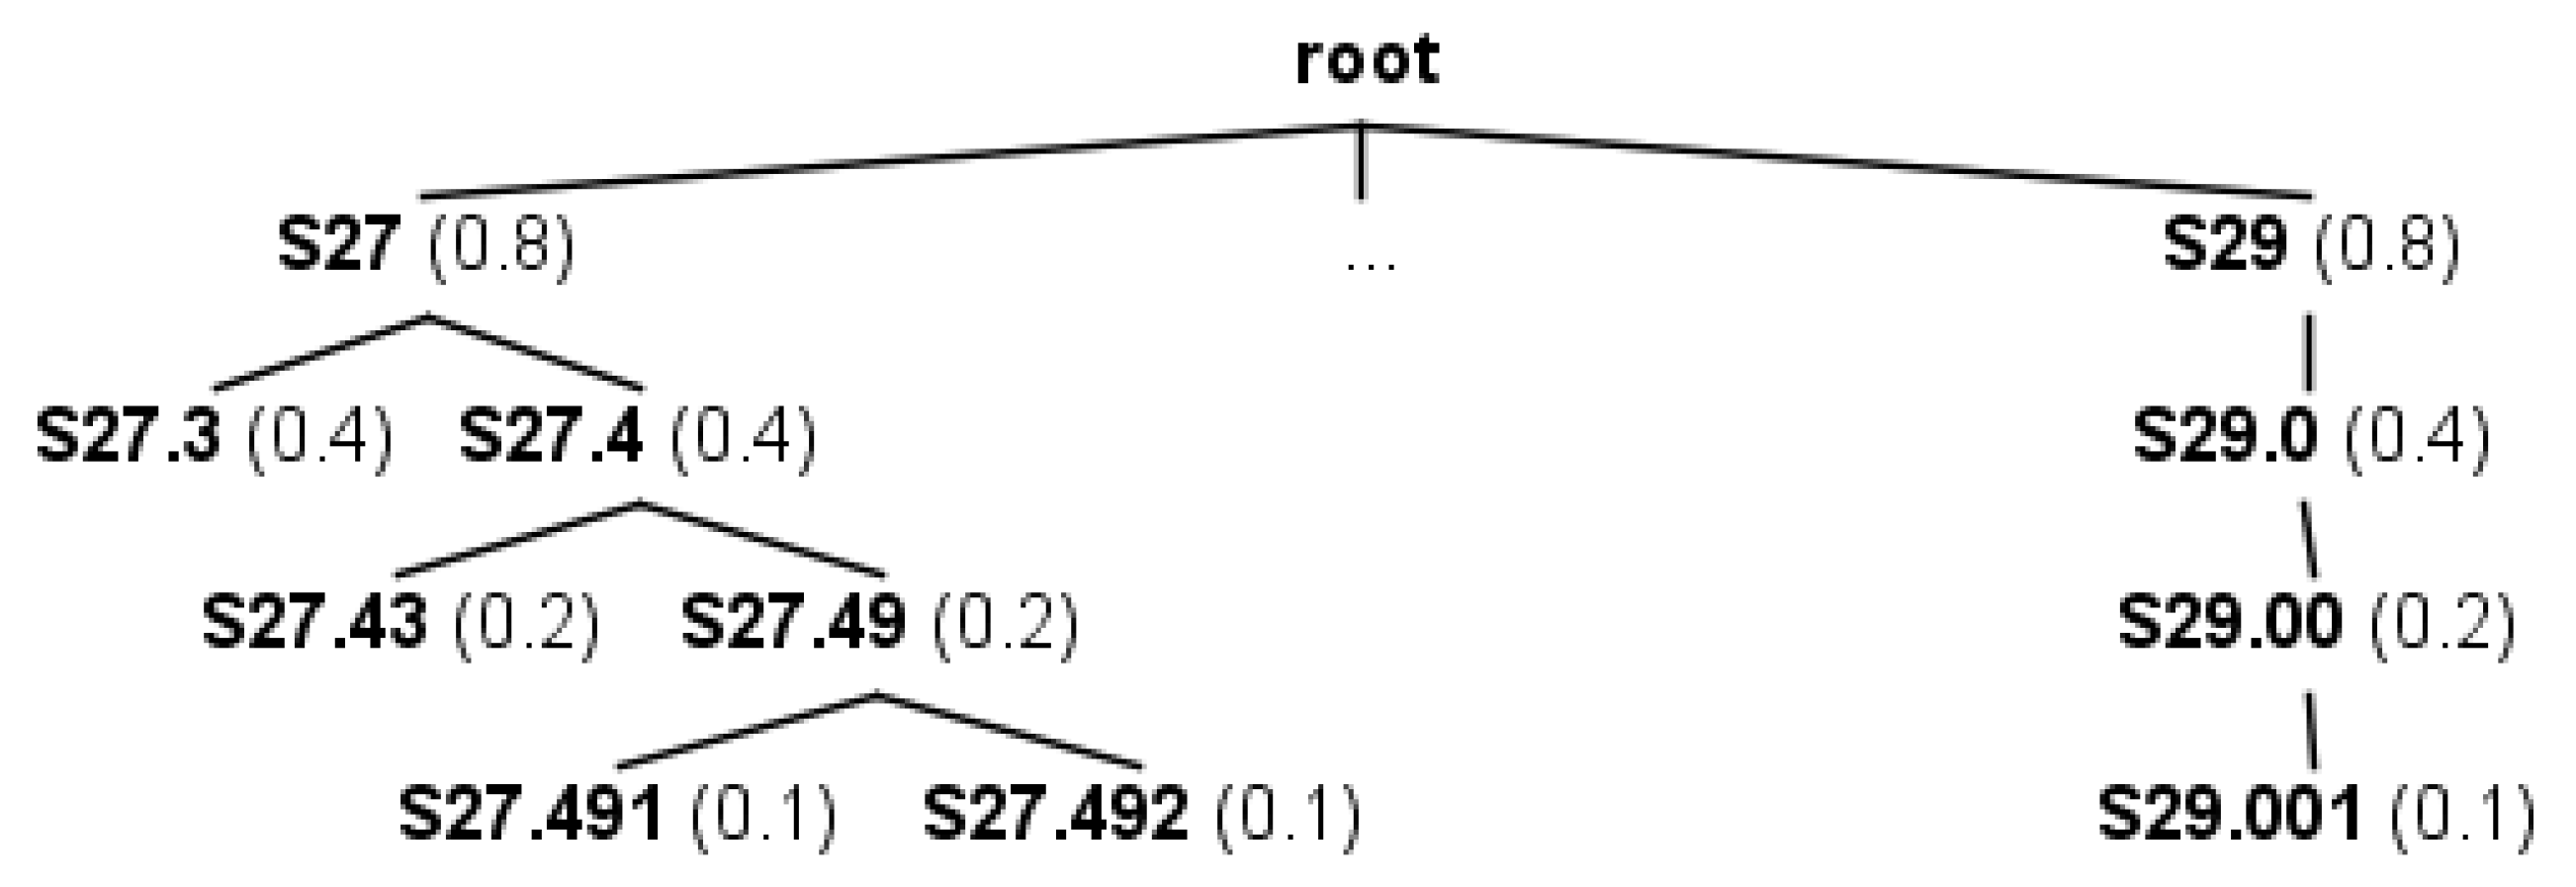
Figure 1. A snippet of the ontology tree along with the assigned weights in parenthesis.
Algorithms 13 00054 g001
Figure 2. nDCG values for different values of α , β , γ , and δ .
Algorithms 13 00054 g002
Figure 3. The Kendal tau Distances for groups with group similarity 0.6.
Algorithms 13 00054 g003
Figure 4. Group Discord for groups with group similarity 0.6.
Algorithms 13 00054 g004
Table 1. An instance of the ICD10 ontology.
Code IDDescriptionLevel
S27Injury of other and unspecified intrathoracic organs1
S29Other and unspecified injuries of thorax1
S27.3Other injury of bronchus, unilateral2
S27.4Injury of bronchus2
S27.43Laceration of bronchus3
S27.49Other injury of bronchus3
S27.491Other injury of bronchus, unilateral4
S27.492Other injury of bronchus, bilateral4
Table 2. Examples of similarities between nodes using Figure 1.
Node ANode BLCA(A,B)simN(A,B)
S27.43S27.49S27.4 1 ( 0.2 + 0.2 / 3 ) = 0.87
S27S29root 1 ( 0.8 + 0.8 / 3 ) = 0.47
S27.492S27.49S27.49 1 ( 0 + 0.1 / 3 ) = 0.97
S27.3S27.49S27 1 ( 0.4 + 0.6 / 3 ) = 0.67
S27.492S29.001root 1 ( 1.5 + 1.5 / 3 ) = 0
S27.491S27.492S27.49 1 ( 0.1 + 0.1 / 3 ) = 0.93
Table 3. Input parameters for generating the document corpus.
Parameter NameExplanationValue
numDocs# of documents generated for each category of health problems.200
numKeyWords# of keywords appended to documents.10
popularDocsThe # of the most popular documents in each category, for simulating a power law distribution.70
Table 4. Input parameters for generating the ratings dataset.
PartitionsParameter NameExplanationValue
Group PartitionGroup o c c a s i o n a l # of ratings given by patients in this group is 20 to 10050% of all patients
Group r e g u l a r # of ratings given by patients in this group is 100 to 25030% of all patients
Group d e d i c a t e d # of ratings given by patients in this group is 250 to 50020% of all patients
Education Levels E d u H L i t 1 Patients with Education Level 15% of all patients
E d u H L i t 2 Patients with Education Level 210% of all patients
E d u H L i t 3 Patients with Education Level 340% of all patients
E d u H L i t 4 Patients with Education Level 430% of all patients
E d u H L i t 5 Patients with Education Level 515% of all patients
Anxiety Scores A n x C o g n C l 1 Patients with Anxiety Score 130% of all patients
A n x C o g n C l 2 Patients with Anxiety Score 240% of all patients
A n x C o g n C l 3 Patients with Anxiety Score 315% of all patients
A n x C o g n C l 4 Patients with Anxiety Score 410% of all patients
A n x C o g n C l 5 Patients with Anxiety Score 55% of all patients
Scores PartitionOne# of ratings that have as score 120% of all ratings
Two# of ratings that have as score 210% of all ratings
Three# of ratings that have as score 330% of all ratings
Four# of ratings that have as score 420% of all ratings
Five# of ratings that have as score 520% of all ratings
Ratings PartitionhealthRelevant# of relevant to some health problems documents each user will rate40% of ratings from each user
nonRelevant# of non relevant to any health problems documents each user will rate.60% of ratings from each user

