Article

Using Zigzag Persistent Homology to Detect Hopf Bifurcations in Dynamical Systems

by
Sarah Tymochko
1,
Elizabeth Munch
1,2,* and
Firas A. Khasawneh
3
1
Department of Computational Mathematics, Science and Engineering, Michigan State University, East Lansing, MI 48824, USA
2
Department of Mathematics, Michigan State University, East Lansing, MI 48824, USA
3
Department of Mechanical Engineering, Michigan State University, East Lansing, MI 48824, USA
*
Author to whom correspondence should be addressed.
Algorithms 2020, 13(11), 278; https://doi.org/10.3390/a13110278
Submission received: 18 September 2020 / Revised: 23 October 2020 / Accepted: 29 October 2020 / Published: 31 October 2020
(This article belongs to the Special Issue Topological Data Analysis)

Abstract

:
Bifurcations in dynamical systems characterize qualitative changes in the system behavior. Therefore, their detection is important because they can signal the transition from normal system operation to imminent failure. In an experimental setting, this transition could lead to incorrect data or damage to the entire experiment. While standard persistent homology has been used in this setting, it usually requires analyzing a collection of persistence diagrams, which in turn drives up the computational cost considerably. Using zigzag persistence, we can capture topological changes in the state space of the dynamical system in only one persistence diagram. Here, we present Bifurcations using ZigZag (BuZZ), a one-step method to study and detect bifurcations using zigzag persistence. The BuZZ method is successfully able to detect this type of behavior in two synthetic examples as well as an example dynamical system.

1. Introduction

Topological data analysis (TDA) is a field consisting of tools aimed at extracting shape in data. Persistent homology, one of the most commonly used tools from TDA, has proven useful in the field of time-series analysis. Specifically, persistent homology has been shown to quantify features of a time series such as periodic and quasiperiodic behavior [1,2,3,4,5] or chaotic and periodic behavior [6,7]. Existing applications in time-series analysis include studying machining dynamics [7,8,9,10,11,12,13], gene expression [1,14], financial data [15], video data [16,17], and sleep–wake states [18,19]. These applications typically involve summarizing the underlying topological shape of each time series in a persistence diagram and then using additional methods to analyze the resulting collection of persistence diagrams. While these applications have been successful, the task of analyzing a collection of persistence diagrams can still be difficult. One way to approach this problem is to use machine learning on persistence diagrams; however, the space of persistence diagrams is not amenable to machine-learning tasks. Many methods have been created to convert persistence diagrams into a form amenable for machine learning [20,21,22,23]. However, since so many methods have been developed, it can be difficult to choose one appropriate for the task. Additionally, the task of computing numerous persistence diagrams is computationally expensive.
Our method aims to circumvent these issues using zigzag persistence, a generalization of persistent homology that is capable of summarizing information from a sequence of point clouds in a single persistence diagram. While less popular than standard persistent homology, zigzag persistence has been used in applications, including studying optical flow in computer generated videos [24,25], analyzing stacks of neuronal images [26], and comparing different subsamples of a dataset [27]. However, to the best of our knowledge, it has not been used in the context of dynamical systems or time-series analysis. In this paper, we present Bifurcations using ZigZag (BuZZ), a one-step method to analyze bifurcations in dynamical systems using zigzag persistence.

2. Materials and Methods

Here, we will present the tools needed to build our method, including time-delay embedding, and an overview of the necessary topological tools. Specifically, we briefly introduce homology, persistent homology, and zigzag persistent homology. However, we will not go into detail and instead direct the interested reader to [28,29,30] for more detail on homology, persistent homology, and zigzag persistent homology, respectively.

2.1. Homology and Persistent Homology

Homology is a tool from the field of algebraic topology that encodes information about shape in various dimensions. Zero-dimensional homology studies connected components, 1-dimensional homology studies loops, and 2-dimensional homology studies voids. Persistent homology is a method from TDA which studies the changing homology of a parameterized space.
For the purposes of this paper, we will focus on persistent homology applied to point cloud data. Here, we need only assume that a point cloud is a collection of points with a notion of distance; however, in practice, this distance often arises from a point cloud in Euclidean space inheriting the ambient metric. Given a collection of points, we will build connections between points based on their distance. Specifically, we will build simplicial complexes, which are spaces built from different dimensional simplices. A 0-simplex is a vertex, a 1-simplex is an edge, a 2-simplex is a triangle, and in general, a p-simplex is the convex hull of p + 1 affinely independent vertices. Abstractly, a p-simplex can be represented by the set of p + 1 vertices from which it is built. Therefore, a simplicial complex, K , is a family of sets that is closed under taking subsets. That is, given a p-simplex, σ , in K , any simplex consisting of a subset of the vertices of size 0 < k p , called a k-dimensional face of σ , is also in K .
To create a simplicial complex from a point cloud, we use the Vietoris–Rips complex (sometimes just called the Rips complex). Given a point cloud, X, and a distance value, r, the Vietoris–Rips complex, K r , consists of all simplices for which vertices have a maximum pairwise distance at most r. Taking a range of distance values, r 0 r 1 r 2 r n gives a set of simplicial complexes, { K r i } . Since the distance values strictly increase, we have a nested sequence of simplicial complexes
K r 0 K r 1 K r n
called a filtration. Computing p-dimensional homology, H p ( K ) , for each complex in the filtration gives a sequence of vector spaces and linear maps,
H p ( K r 0 ) H p ( K r 1 ) H p ( K r n ) .
Persistent homology tracks how homological features such as connected components and loops change through the filtration. Specifically, it records at what distance value a feature first appears and when a feature disappears or connects with another feature. These distance values are called the “birth” and “death” times, respectively. These birth and death times are represented as a persistence diagram, which is a multiset of the birth death pairs { ( b , d ) } .

2.2. Time-Delay Embedding

In order to analyze time-series data using persistent homology, we will use a tool from nonlinear time-series analysis called the time-delay embedding. Here, we will give an intuitive overview of the method; however, we refer the interested reader to [31] for more details.
Time-delay embedding is a method used to reconstruct an attractor of a dynamical system given only one observation function. This is done by taking the observation function, [ x 1 , , x n ] , and two parameters, an embedding dimension d and a delay (or lag) τ . The reconstruction is then the point cloud X = { x i : = ( x i , x i + τ , , x i + ( d 1 ) τ ) } R d . Due to theoretical results from Takens [32] and Whitney [33], given that the right choices of parameters and some underlying assumptions are satisfied, this reconstruction is in fact an embedding. Thus, the reconstruction has the same topological structure as the attractor of the dynamical system. In practice, not all parameter choices are optimal, and while there are no theoretical guarantees on how to pick the best parameters, many heuristics for making reasonable parameter choices have been developed [34,35,36,37,38,39].
Significant work has been done in using persistent homology on time-delay embeddings. Specifically, in [1], the authors provide a full theoretical analysis of persistent homology for time-series analysis. The authors show that maximum persistence of the persistence diagram computed from the time-delay embedding can be used to quantify periodicity. Additionally, they provide a description of how persistence diagrams change depending on the embedding dimension and the delay parameter. This work provides sound theoretical backing for the use of persistent homology on time-delay embeddings.
In existing methods combining TDA with time-series analysis, most works analyze a collection of time series by embedding each one into a point cloud using time-delay embedding. However, this can be computationally expensive and requires analysis of the collection of computed persistence diagrams. Instead, we will employ a generalized version of persistent homology to avoid these additional steps.

2.3. Zigzag Persistent Homology

Persistent homology requires a nested collection of simplicial complexes as in Equation (1). Zigzag persistence is a generalization of persistent homology that can study a collection of simplicial complexes where the inclusions go in different directions. In particular, it can be used to study a group of point clouds simultaneously; however, it requires a choice of parameters for each point cloud which induces a simplicial complex. Specifically, the input to zigzag persistence is a sequence of simplicial complexes with maps,
K 0 K 1 K n
where ↔ is either an inclusion to the left or to the right. While in general these inclusions can go in any direction in any order, for this paper, we will focus on a specific setup for the zigzag based on a collection of point clouds.
Given an ordered collection of point clouds, X 0 , X 1 , , X n , we can define a set of inclusions,
Algorithms 13 00278 i001
However, these are all still point clouds, which have uninteresting homology. Thus, we can compute the Vietoris–Rips complex of each point cloud for a fixed radius, r. This results in the diagram of inclusions of simplicial complexes
Algorithms 13 00278 i002
Computing the 1-dimensional homology of each complex in Equation (5) will result in a zigzag diagram of vector spaces and induced linear maps,
Algorithms 13 00278 i003
Zigzag persistence tracks how homologically equivalent features appear and disappear through this zigzag. This means it records the range of the zigzag filtration where the same feature appears, specifically the “birth” and “death” relating to the locations in the zigzag rather than to the choice of r. If a feature appears in R ( X i , r ) , it is assigned birth time i, and if it appears at R ( X i X i + 1 , r ) , it is assigned birth time i + 0.5 . Similarly, if a feature last appears in R ( X j , r ) , it is assigned a death time j + 0.5 , while if it last appears in R ( X j X j + 1 , r ) , it is assigned a death time of j + 1 . A small example is shown in Figure 1. In this example, there is a 1-dimensional feature that appears in R ( X 0 , r ) and disappears going into R ( X 0 X 1 , r ) ; thus, it appears in the zigzag persistence diagram as the point ( 0 , 0.5 ) . Additionally, there is one connected component that exists through the zigzag, corresponding to the 0-dimensional persistence point ( 0 , 2 ) . By default, we assume all features die at the end of the zigzag, rather than having persistence points of the form ( i , ) as in standard persistence. There is one additional connected component that first appears in R ( X 0 X 1 , r ) , corresponding to the 0-dimensional persistence point ( 0.5 , 2 ) .
Note that we can easily generalize this idea to use a different radius for each Rips complex, R ( X i , r i ) . For the unions, we choose the maximum radius between the two individual point clouds, R ( X i X i + 1 , max { r i , r i + 1 } ) , to ensure the inclusions hold.

2.4. Bifurcations Using Zigzag (Buzz)

We can now present our method, Bifurcations using ZigZag (BuZZ), for combining the above tools to detect changes in dynamical systems, specifically changes that appear as a change in circular structure in the solution. We will focus on Hopf bifurcations [40], which are seen when a fixed point loses stability and a limit cycle is introduced. These types of bifurcations are particularly topological in nature, as the solution to the dynamical system changes from a small cluster to a circular structure and sometimes reduces back to a cluster. While persistent homology has been used to study Hopf bifurcations [41,42,43,44], none of the existing methods use zigzag persistence.
The necessary data for our method is a collection of time series for a varying input parameter value, as shown in Figure 2a. This particular example is a collection of time series given by { a sin ( t ) } for a = 0.5 , 1.0 , 1.5 , 2.0 (going from top to bottom). Each time series is then embedded using time-delay embedding (shown in Figure 2b using d = 2 and τ = 3 ). While in general the delay could be varied for each time series, the embedding dimension needs to be fixed so each time series is embedded in the same space. For the sake of interpretability and visualization, we will use a dimension of d = 2 throughout this paper. Sorting the resulting point clouds based on the input parameter value, the zigzag filtration can be formed from the collection of point clouds, as shown in Figure 2c. Lastly, computing zigzag persistence gives a persistence diagram, as shown in Figure 2d, encoding information about the structural changes moving through the zigzag.
With the right choices of parameters, the 1-dimensional persistence point with the longest lifetime in the zigzag persistence diagram will have birth and death times corresponding to the indices in the zigzag where the Hopf bifurcation appears and disappears. Lastly, mapping the birth and death times back to the parameter values used to create the corresponding point clouds will give the range of parameter values where the Hopf bifurcation occurs.
Note that there are several parameter choices that need to be selected during the course of the BuZZ method: first, the dimension d and delay τ converting each time series into a point cloud. Fortunately, there is a vast literature from the time-series analysis literature for this, which leads to standard heuristics, some of which are published in [34,35,36,37,38,39]. The second and more difficult parameter to choose is the radius (or radii) for the Rips complexes. In this paper, the given examples are simple enough that the choice of radii in the BuZZ method can be tuned by the user. In the tuning process, the user should select a radius that allows points in the circular structure to be connected but not so large that it fills in the circle or makes the Rips complexes too large to be computationally feasible. However, in future work, we would like to create new methods and heuristics for choosing these radii.

2.5. Algorithms

While zigzag persistence has been in the literature for a decade, it has not often been used in application, and thus, the software that computes it is not well developed. A C++ package with python wrappers, Dionysus 2 (https://www.mrzv.org/software/dionysus2/), has implemented zigzag persistence; however, it requires significant preprocessing to create the inputs. We have developed a python package (https://github.com/sarahtymochko/BuZZ) that, provided the collection of point clouds and radii, will perform all the necessary preprocessing to set up the zigzag diagram as shown in Equation (5) to pass as inputs to Dionysus.
Dionysus requires two inputs, a list of simplices, simplex_list, and a list of lists, times_list, where times_list[i] consists of a list of indices in the zigzag where the simplex, simplex_list[i], is added and removed. A small example is shown in Figure 3. Looking at that example, the two vertices and one edge in R ( X 0 ) appear at time 0 and disappear at time 1. There are two edges and a triangle in R ( X 0 X 1 ) that appear at time 0.5 (recalling that R ( X i X i + 1 ) is time i + 0.5 ) and disappear at time 1. Lastly, the one vertex in R ( X 1 ) appears at time 0.5 and never disappears in the zigzag sequence; therefore, by default, we set death time to be 2, which is the next index beyond the end of the zigzag sequence. This is done to avoid persistence points of the form ( i , ) , as our zigzag sequences are always finite and these points have no additional meaning. Note that there are other special cases that can occur. If a simplex is added and removed multiple times, then the corresponding entry in times_list has more than two entries, where the zero and even entries in the list correspond to when it appears and the odd entries correspond to when it disappears. An example with this special case is shown in Figure 4 and will be described in more detail later.
If we are using a fixed radius across the whole zigzag, these inputs can be computed rather easily. In this setting, we only need to compute the Rips complex of the unions, R ( X i X i + 1 , r ) , which can be done using the Dionysus package, and the list of simplices can be created by combining lists of simplices for all i, removing duplicates. Next, we will outline how to construct the times list. Starting with the set of simplices in R ( X i X i + 1 , r ) , we can split them into three groups: (a) simplices for which all 0-dimensional faces are in X i , (b) simplices for which all 0-dimensional faces are in X i + 1 , or (c) simplices for which some 0-dimensional faces are in X i and some are in X i + 1 . Because of the construction of the zigzag, all simplices in group (a) appear at time i 0.5 , since R ( X i , r ) also includes backwards R ( X i 1 X i , r ) and disappears at time i + 1 , since the union R ( X i X i + 1 , r ) is the last time that simplices in X i are included. Similarly, all simplices in group (b) appear at time i + 0.5 , since this is the first time simplices X i + 1 are included and disappear at time i + 2 , since R ( X i + 1 , r ) also includes forward R ( X i + 1 X i + 2 , r ) . Lastly, all simplices in group (c) exist only at R ( X i X i + 1 , r ) , so they appear at time i + 0.5 and disappear at i + 1 . Note that the first case needs to be treated separately, since in R ( X 0 X 1 , r ) , all vertices in group (a) will appear at 0.
Using a varied radius, as described in Section 2.3, complicates the above procedure. Using the same radius, we are guaranteed that all simplices in group (a) are in both R ( X i , r ) and R ( X i X i + 1 , r ) and similarly for group (b); thus, we only need to compute R ( X i X i + 1 , r ) . However, with a changing radius, this is no longer true. In the example shown in Figure 4, the edge e 1 , 2 appears in both R ( X 0 X 1 , r 0 ) and R ( X 1 X 2 , r 2 ) since r 2 > r 1 and r 0 > r 1 , but it is not in R ( X 1 , r 1 ) . Thus, its corresponding list in times_list is [ 0.5 , 1 , 1.5 , 2 ] . Thus, the inputs to Dionysus can be computed using the same method as above except the Rips complex needs to be computed for each point cloud, not just the unions, and additional checks need to be done to make sure a simplex being added did not already appear and disappear once before. If it did, the entry in times_list needs to be extended to account for the newest appearance and disappearance.
Because of the additional Rips complex computations and the checks for the special case, the case of a changing radius is significantly more computationally expensive than the case of a fixed radius. In both cases, there is the computational cost of the zigzag persistence computation as well. The computational complexity of zigzag persistence is O ( n m 2 ) , where n is the number of simplices in the entire filtration and m is the number of simplices in the largest single complex [45]. Thus, the most computationally expensive step is computing the zigzag persistence computation itself. To alleviate this as much as possible, a radius for the Rips complexes should be selected so that it is as small as possible without breaking the circular structure and thus breaking the topology. Additionally, it needs to be chosen so that, in the union of point clouds, no small circles are created in the region between the ring-like structures, which would cause the larger circular structures to no longer be homologically equivalent. A unifying method for choosing such an r is outside of the scope of this paper and the subject of future work.

3. Results

We tested the BuZZ method on three different examples. The first example was not based on time-series data but was instead a simple proof-of-concept example to test our method’s ability to detect changing circular behavior. The second example was based on synthetic time-series data generated from noisy sine waves of varying amplitude. This let us fully utilize the BuZZ method, including time-delay embedding, as well as test resiliency to noise. The last example was detecting a Hopf bifurcation in the Sel’kov model of glycolysis [46].

3.1. Synthetic Point Cloud Example

To start, we considered a small, synthetic example generating point cloud circles of varying sizes, as shown in Figure 5. Note, because we are starting with point clouds, we skipped the time-delay embedding step for this example. While each point cloud is sampled from a circle, the first and last point clouds consisted of relatively small circles. Therefore, the strongest circular structure we can see visually started with X 1 and ended with X 3 . This is the range we would like to detect using zigzag persistence.
For this example, we used the generalized version of the zigzag filtration in (5) using a changing radii. Computing the zigzag persistence gave the persistence diagram shown in Figure 5. Recall that birth and death times were assigned based on the location in the zigzag that a feature appears and disappears. Thus, the one-dimensional point ( 1 , 3.5 ) in the persistence diagram corresponds to a feature that first appeared at R ( X 1 ) and last appeared in R ( X 3 ) Thus, using the persistence diagram, we detected the appearance and disappearance of the circular feature.
This is clearly an overly simplified situation as each point cloud was sampled from a perfect circle. Next, we looked at a more realistic example.

3.2. Synthetic Time-Series Example

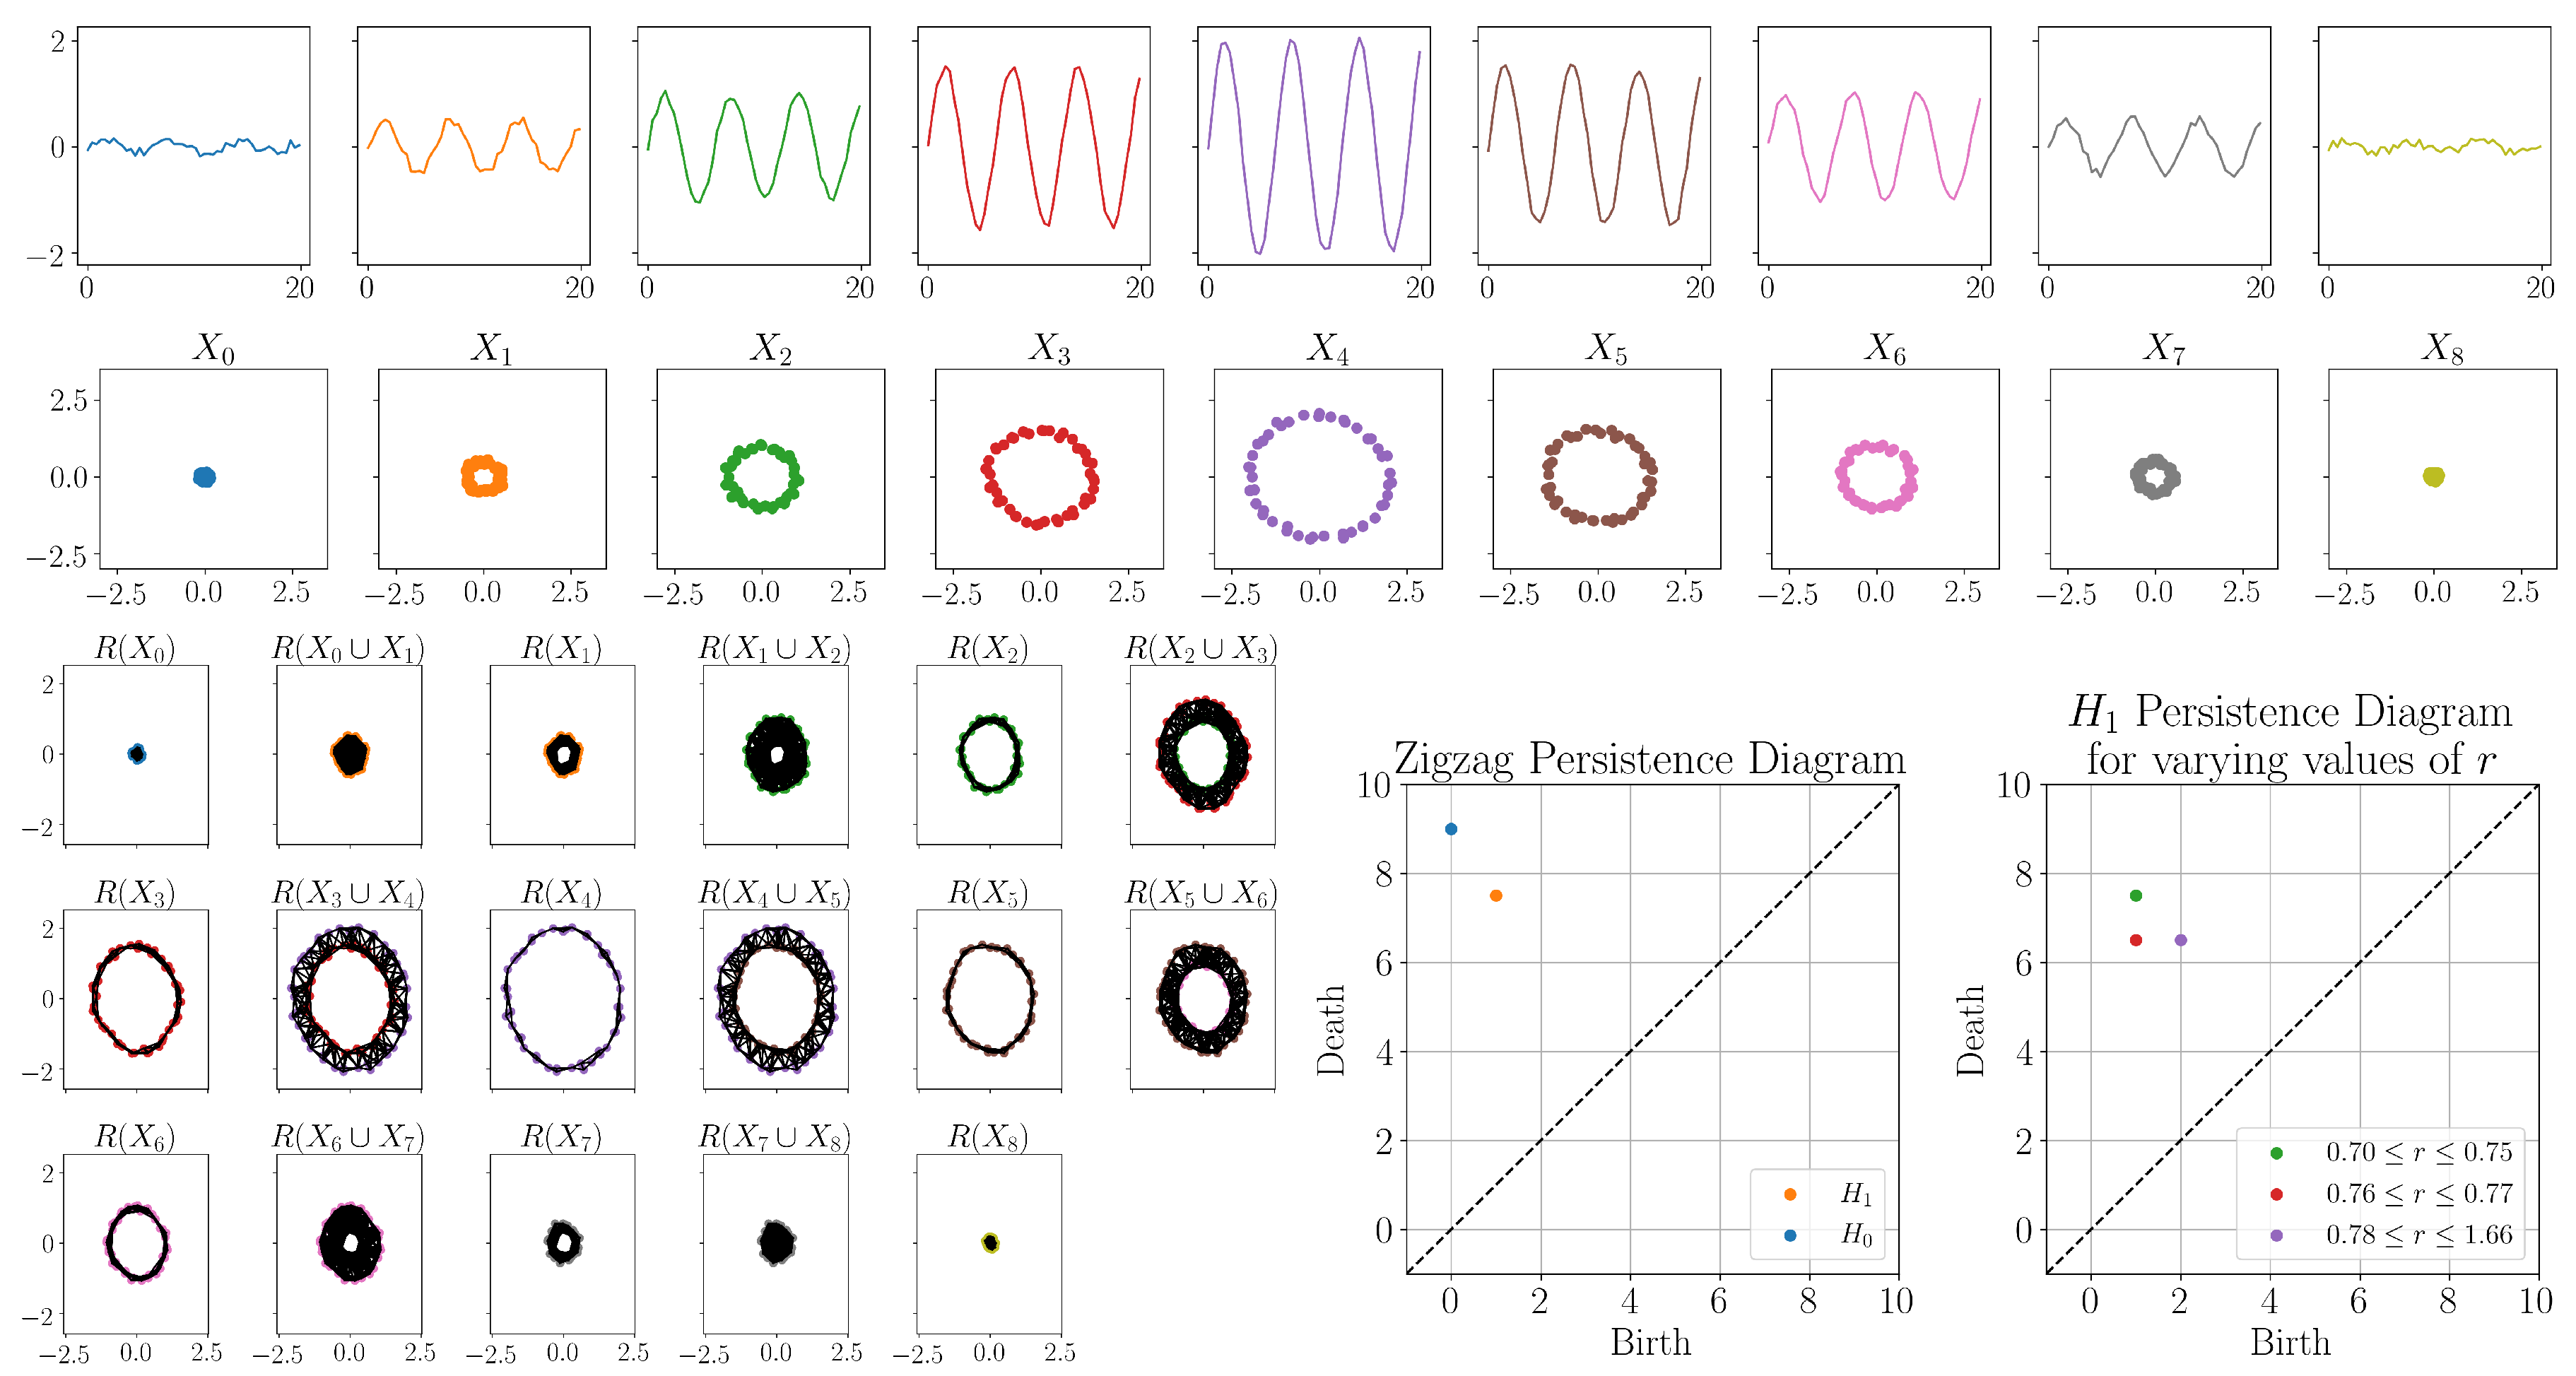
For the second example, we generated synthetic time-series data and applied the full method described in Section 2.4. We started by generating sine waves of varying amplitudes and added noise drawn uniformly from [ 0.1 , 0.1 ] . The time series were then each embedded using time-delay embedding with dimension d = 2 for the purpose of easy visualization and delay τ = 4 . The time series and corresponding time-delay embeddings are shown in Figure 6. Looking at the time series, in the first and last time series, any signal was mostly obscured by noise, resulting in a small clustered time-delay embedding. However, for the other time series, the time-delay embedding was still circular, picking up the periodic behavior even with the noise.
Next, we computed zigzag persistence, resulting in the zigzag of rips complexes and zigzag persistence diagram shown in Figure 6. The zigzag persistence diagram has a one-dimensional point with coordinates ( 1 , 7.5 ) , indicating that the circular feature appeared in R ( X 1 ) and disappeared going into R ( X 8 ) . This is the region we would expect to see a circular feature.
In this experiment, we also tested the variation in the zigzag persistence diagram based on the choice of radius parameter. For this particular example, choosing too small of a radius ( r < 0.70 ) introduces noisy circular features in between the circular structures in the union, causing the circles to no longer be homologically equivalent, and thus, we did not get the desired one-dimensional persistence point. Choosing a radius 0.70 r 0.75 resulted in the same zigzag persistence diagram shown in Figure 6. However, increasing the radius into the range 0.76 r 0.77 , the one-dimensional persistence point shifted to coordinates ( 1 , 6.5 ) ; thus, we did not detect the small circular structure in X 7 . Increasing the radius further into the range 0.78 r 1.66 , the one dimensional persistence point shifted to coordinates ( 2 , 6.5 ) ; thus, we did not detect the small circular structure in X 1 or X 7 . This is visualized in the bottom right plot in Figure 6. Continuing to increase the radius r > 1.66 will cause more of the circular structures to fill in, detecting a smaller and smaller range where the circular feature is detected. Thus, without careful selection of the radius parameter, smaller circular features may not be detected; however, detection of the larger circular features is much more robust to parameter choices.

3.3. Sel’kov Model

Our last experiment tried to detect a bifurcation in the Sel’kov model [46], a model for glycolysis which is a process of breaking down sugar for energy. This model is defined by the system of differential equations,
x ˙ = x + a y + x 2 y y ˙ = b a y x 2 y
where the overdot denotes a derivative with respect to time. In this system, x and y represent the concentration of ADP (adenosine diphosphate) and F6P (fructose-6-phosphate), respectively. This system has a Hopf bifurcation for select choices of parameters a and b. This limit cycle behavior corresponds to the oscillatory rise and fall of the chemical compounds through the glycolysis process.
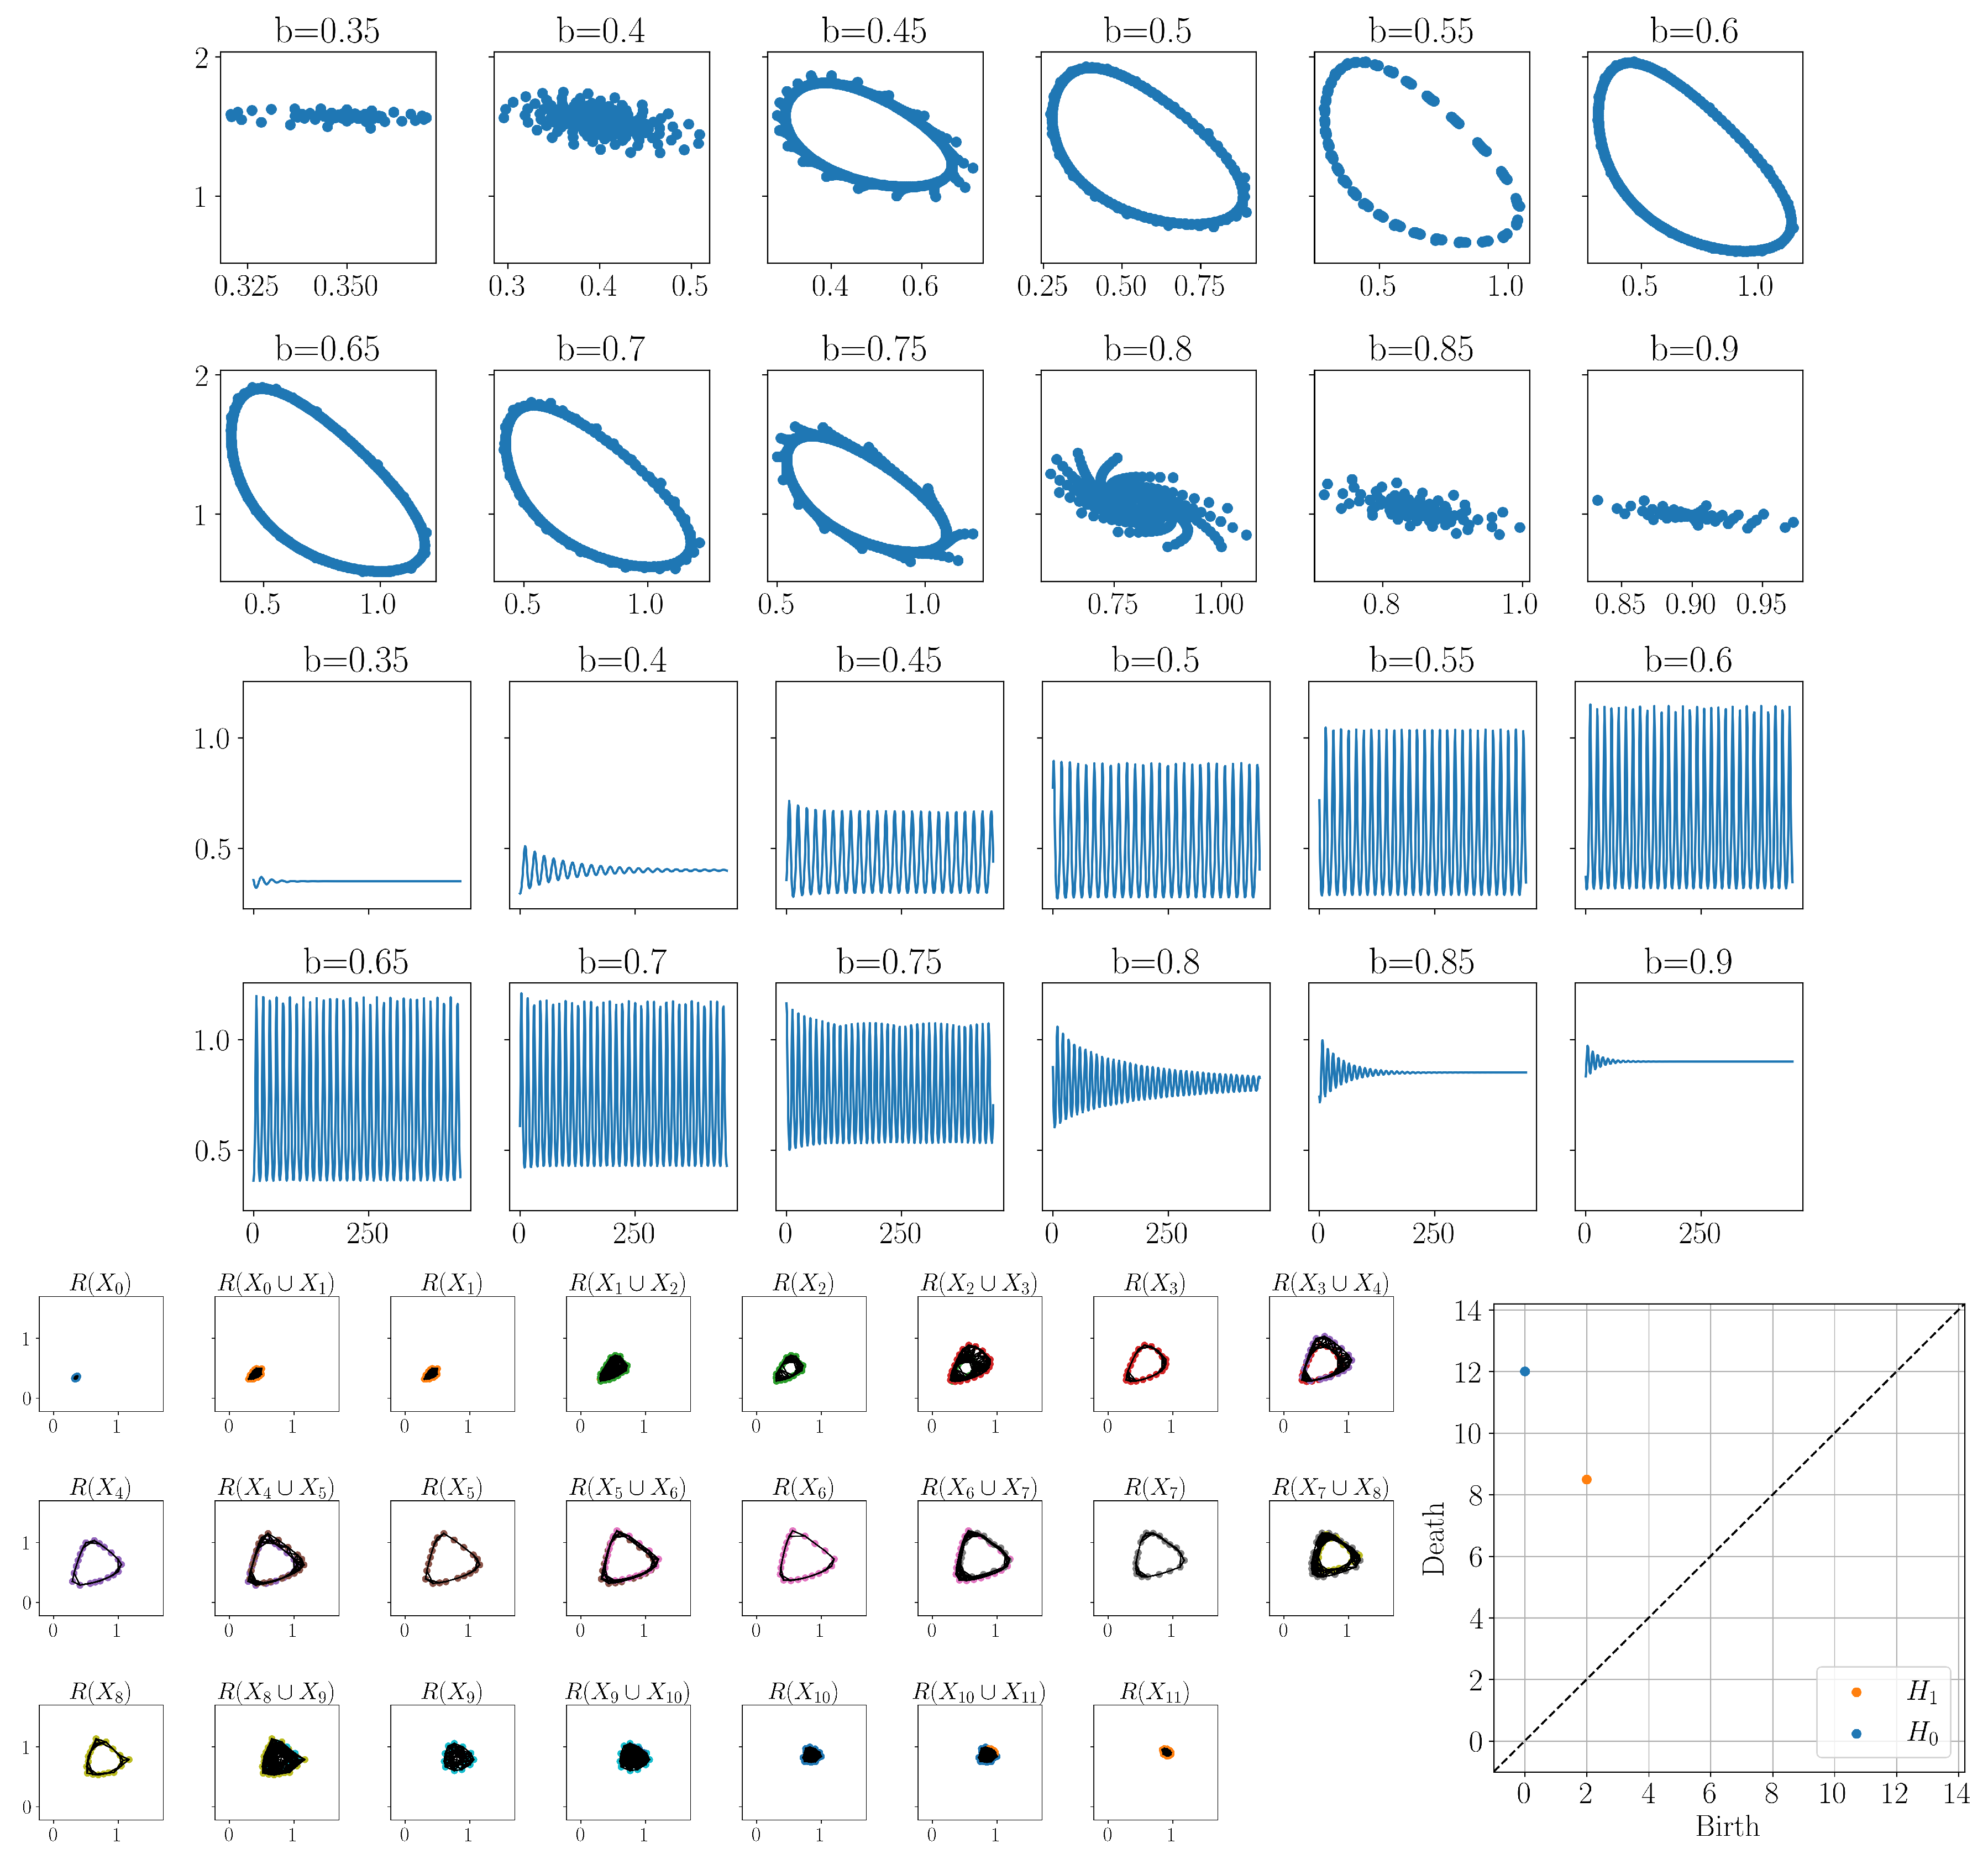
For our experiments, we fixed a = 0.1 and varied the parameter b. We generate 500 time points of the data ranging between 0 and 500 using odeint in python, with initial conditions ( 0 , 0 ) . We also removed the first 50 points to remove transients at the beginning of the model (this is sometimes referred to as a “burn-in period”). This data was constructed using full knowledge of the model; however, in practice, typically only one measurement function is obtained through an experiment, and then time-delay embedding is used to reconstruct the underlying system. To mimic this setup, we only used the time series corresponding to the x-coordinates from the model and used the delay embedding. These time series were then embedded using time-delay embedding with dimension d = 2 for the purpose of easy visualization and delay τ = 3 .
The next step was to compute zigzag persistence as described in Section 2.3; however, due to the large number of points in the time-delay embeddings, this became computationally expensive. In order to reduce the computation time, we subsampled these point clouds using the furthest point sampling method (also called a greedy permutation) [47]. We subsampled down to only 20 points in each point cloud, computed the Rips complex zigzag for a fixed radius value of 0.25 , and then computed the zigzag persistence. Figure 7 shows the zigzag filtration of Rips complexes along with the resulting zigzag persistence diagram. In the zigzag persistence diagram, the point with the longest lifetime has coordinates ( 2 , 8.5 ) . Again, since these coordinates corresponded to the index in the zigzag sequence, this point corresponded to a feature appearing at R ( X 2 ) and disappearing at R ( X 8 X 9 ) . Looking back at which values of b were used to generate these point clouds, we see that this corresponded to a feature appearing at b = 0.45 and disappearing at b = 0.8 . For the fixed parameter value of a = 0.1 , the Sel’kov model had a limit cycle approximately between the parameter values 0.4 b 0.8 [48]. Our method picked up approximately that same range.
These results use the x-coordinates of the model; however, the same results can be obtained using the y-coordinates and a slightly larger radius value.

4. Discussion

Here, we have introduced a method of detecting Hopf bifurcations in dynamical systems using zigzag persistent homology called BuZZ. This method was shown to work on two synthetic examples as well as a more realistic example using the Sel’kov model. Our method is able to detect the range of the zigzag filtration where circular features appear and disappear. Thus, this method could be applied to any application with an ordered set of point clouds and a changing topological structure.
While this method has shown success, it also has its limitations. The method is computationally expensive due to numerous Rips complex computations in addition to the zigzag persistence computation itself. This issue can be alleviated using subsampling, as shown with the Sel’kov model, but this may not be feasible depending on the application. Future extensions of this project could include improvements of the algorithms described in Section 2.5. Additionally, while the method works well in practice, it lacks theoretical guarantees. Given that the method requires parameter choices for the radii of the Vietoris–Rips complexes, we would like some heuristics to be used in practice to choose these radii more easily. Because our examples in this paper are small, selecting parameters by hand is reasonable. However, in the future, when applied to larger experimental data, these sorts of heuristics will be necessary.

Author Contributions

Conceptualization, E.M. and F.A.K.; methodology, S.T., E.M., and F.A.K.; software, S.T.; validation, S.T.; formal analysis, S.T.; investigation, S.T.; resources, S.T.; data curation, S.T.; writing—original draft preparation, S.T., E.M., and F.A.K.; writing—review and editing, S.T., E.M., and F.A.K.; visualization, S.T.; supervision, E.M. and F.A.K.; project administration, E.M. and F.A.K.; funding acquisition, E.M. and F.A.K. All authors have read and agreed to the published version of the manuscript.

Funding

The work of E.M. was supported in part by NSF grant Nos. NSF CCF-1907591 and DMS-1800446. FAK acknowledges the support of the National Science Foundation under grants CMMI-1759823 and DMS-1759824.

Acknowledgments

We thank the two anonymous reviewers whose comments helped improve the quality of this paper.

Conflicts of Interest

The authors declare no conflict of interest.

References

  1. Perea, J.A.; Harer, J. Sliding Windows and Persistence: An Application of Topological Methods to Signal Analysis. Found. Comput. Math. 2015, 15, 799–838. [Google Scholar] [CrossRef] [Green Version]
  2. Sanderson, N.; Shugerman, E.; Molnar, S.; Meiss, J.D.; Bradley, E. Computational Topology Techniques for Characterizing Time-Series Data. arXiv 2017, arXiv:1708.09359. [Google Scholar]
  3. Tempelman, J.R.; Khasawneh, F.A. A Look into Chaos Detection through Topological Data Analysis. arXiv 2019, arXiv:1902.05918. [Google Scholar] [CrossRef] [Green Version]
  4. Maletić, S.; Zhao, Y.; Rajković, M. Persistent topological features of dynamical systems. Chaos Interdiscip. J. Nonlinear Sci. 2016, 26, 053105. [Google Scholar] [CrossRef] [PubMed] [Green Version]
  5. Xu, B.; Tralie, C.J.; Antia, A.; Lin, M.; Perea, J.A. Twisty Takens: A Geometric Characterization of Good Observations on Dense Trajectories. arXiv 2018, arXiv:1809.07131. [Google Scholar] [CrossRef] [Green Version]
  6. Myers, A.; Munch, E.; Khasawneh, F.A. Persistent homology of complex networks for dynamic state detection. Phys. Rev. E 2019, 100, 022314. [Google Scholar] [CrossRef] [Green Version]
  7. Khasawneh, F.A.; Munch, E. Chatter detection in turning using persistent homology. Mech. Syst. Signal Process. 2016, 70-71, 527–541. [Google Scholar] [CrossRef]
  8. Khasawneh, F.A.; Munch, E. Utilizing Topological Data Analysis for Studying Signals of Time-Delay Systems. In Advances in Delays and Dynamics; Springer International Publishing: Basel, Switzerland, 2017; pp. 93–106. [Google Scholar] [CrossRef]
  9. Khasawneh, F.A.; Munch, E. Topological data analysis for true step detection in periodic piecewise constant signals. Proc. R. Soc. A Math. Phys. Eng. Sci. 2018, 474, 20180027. [Google Scholar] [CrossRef] [Green Version]
  10. Yesilli, M.C.; Khasawneh, F.A.; Otto, A. Topological Feature Vectors for Chatter Detection in Turning Processes. arXiv 2019, arXiv:1905.08671v2. [Google Scholar]
  11. Yesilli, M.C.; Tymochko, S.; Khasawneh, F.A.; Munch, E. Chatter Diagnosis in Milling Using Supervised Learning and Topological Features Vector. In Proceedings of the 2019 18th IEEE International Conference On Machine Learning And Applications (ICMLA), Boca Raton, FL, USA, 16–19 December 2019. [Google Scholar] [CrossRef] [Green Version]
  12. Khasawneh, F.A.; Munch, E.; Perea, J.A. Chatter Classification in Turning Using Machine Learning and Topological Data Analysis. In Proceedings of the 14th IFAC Workshop on Time Delay Systems TDS 2018, Budapest, Hungary, 28–30 June 2018; Insperger, T., Ed.; Elsevier: Amsterdam, The Netherlands, 2018; Volume 51, pp. 195–200. [Google Scholar] [CrossRef]
  13. Khasawneh, F.A.; Munch, E. Stability Determination in Turning Using Persistent Homology and Time Series Analysis. In Volume 4B: Dynamics, Vibration, and Control; American Society of Mechanical Engineers: New York, NY, USA, 2014. [Google Scholar] [CrossRef]
  14. Berwald, J.; Gidea, M. Critical transitions in a model of a genetic regulatory system. Math. Biosci. Eng. 2014, 11, 723–740. [Google Scholar] [CrossRef]
  15. Gidea, M. Topological Data Analysis of Critical Transitions in Financial Networks. In Proceedings of the 3rd International Winter School and Conference on Network Science NetSci-X 2017, Tel-Aviv, Israel, 15–18 January 2017; Shmueli, E., Barzel, B., Puzis, R., Eds.; Springer: Cham, Switzerland, 2017. [Google Scholar]
  16. Tralie, C.J.; Perea, J.A. (Quasi) Periodicity quantification in video data, using topology. SIAM J. Imaging Sci. 2018, 11, 1049–1077. [Google Scholar] [CrossRef] [Green Version]
  17. Tralie, C. High-dimensional geometry of sliding window embeddings of periodic videos. In Proceedings of the 32nd International Symposium on Computational Geometry (SoCG 2016), Boston, MA, USA, 14–18 June 2016; Schloss Dagstuhl-Leibniz-Zentrum fuer Informatik: Wadern, Germany, 2016. [Google Scholar]
  18. Chung, Y.M.; Hu, C.S.; Lo, Y.L.; Wu, H.T. A persistent homology approach to heart rate variability analysis with an application to sleep-wake classification. arXiv 2019, arXiv:1908.06856. [Google Scholar]
  19. Tymochko, S.; Singhal, K.; Heo, G. Classifying sleep states using persistent homology and Markov chain: A Pilot Study. arXiv 2020, arXiv:2002.07810. [Google Scholar]
  20. Bubenik, P. Statistical Topological Data Analysis using Persistence Landscapes. J. Mach. Learn. Res. 2015, 16, 77–102. [Google Scholar]
  21. Adams, H.; Emerson, T.; Kirby, M.; Neville, R.; Peterson, C.; Shipman, P.; Chepushtanova, S.; Hanson, E.; Motta, F.; Ziegelmeier, L. Persistence Images: A Stable Vector Representation of Persistent Homology. J. Mach. Learn. Res. 2017, 18, 218–252. [Google Scholar]
  22. Reininghaus, J.; Huber, S.; Bauer, U.; Kwitt, R. A stable multi-scale kernel for topological machine learning. In Proceedings of the 2015 IEEE Conference on Computer Vision and Pattern Recognition (CVPR), Boston, MA, USA, 7–12 June 2015. [Google Scholar] [CrossRef] [Green Version]
  23. Perea, J.A.; Munch, E.; Khasawneh, F.A. Approximating Continuous Functions on Persistence Diagrams Using Template Functions. arXiv 2019, arXiv:1902.07190. [Google Scholar]
  24. Adams, H.; Bush, J.; Carr, B.; Kassab, L.; Mirth, J. On the nonlinear statistics of optical flow. In Proceedings of the International Workshop on Computational Topology in Image Context, Málaga, Spain, 24–25 January 2019; Springer: Berlin, Germany, 2019; pp. 151–165. [Google Scholar]
  25. Adams, H.; Bush, J.; Carr, B.; Kassab, L.; Mirth, J. A torus model for optical flow. Pattern Recognit. Lett. 2020, 129, 304–310. [Google Scholar] [CrossRef]
  26. Mata, G.; Morales, M.; Romero, A.; Rubio, J. Zigzag persistent homology for processing neuronal images. Pattern Recognit. Lett. 2015, 62, 55–60. [Google Scholar] [CrossRef]
  27. Tausz, A.; Carlsson, G. Applications of zigzag persistence to topological data analysis. arXiv 2011, arXiv:1108.3545. [Google Scholar]
  28. Hatcher, A. Algebraic Topology; Cambridge University Press: Cambridge, UK, 2002. [Google Scholar]
  29. Edelsbrunner, H.; Harer, J. Computational Topology: An Introduction; American Mathematical Society: Providence, RI, USA, 2010. [Google Scholar]
  30. Carlsson, G.; de Silva, V. Zigzag Persistence. Found. Comput. Math. 2010, 10, 367–405. [Google Scholar] [CrossRef] [Green Version]
  31. Kantz, H.; Schreiber, T. Nonlinear time Series Analysis; Cambridge University Press: Cambridge, UK, 2004; Volume 7. [Google Scholar]
  32. Takens, F. Detecting strange attractors in turbulence. In Lecture Notes in Mathematics; Springer: Berlin/Heidelberg, Germany, 1981; pp. 366–381. [Google Scholar] [CrossRef]
  33. Whitney, H. Differentiable manifolds. Ann. Math. 1936, 37, 645–680. [Google Scholar] [CrossRef]
  34. Fraser, A.M.; Swinney, H.L. Independent coordinates for strange attractors from mutual information. Phys. Rev. A 1986, 33, 1134–1140. [Google Scholar] [CrossRef] [PubMed]
  35. Kennel, M.B.; Brown, R.; Abarbanel, H.D.I. Determining embedding dimension for phase-space reconstruction using a geometrical construction. Phys. Rev. A 1992, 45, 3403–3411. [Google Scholar] [CrossRef] [Green Version]
  36. Pecora, L.M.; Moniz, L.; Nichols, J.; Carroll, T.L. A unified approach to attractor reconstruction. Chaos Interdiscip. J. Nonlinear Sci. 2007, 17, 013110. [Google Scholar] [CrossRef] [Green Version]
  37. Chelidze, D. Reliable Estimation of Minimum Embedding Dimension Through Statistical Analysis of Nearest Neighbors. J. Comput. Nonlinear Dyn. 2017, 12, 051024. [Google Scholar] [CrossRef]
  38. Pan, S.; Duraisamy, K. On the structure of time-delay embedding in linear models of non-linear dynamical systems. Chaos Interdiscip. J. Nonlinear Sci. 2020, 30, 073135. [Google Scholar] [CrossRef]
  39. Kim, H.; Eykholt, R.; Salas, J. Nonlinear dynamics, delay times, and embedding windows. Phys. D Nonlinear Phenom. 1999, 127, 48–60. [Google Scholar] [CrossRef]
  40. Guckenheimer, J.; Holmes, P. Nonlinear Oscillations, Dynamical Systems, and Bifurcations of Vector Fields; Springer: New York, NY, USA, 1983. [Google Scholar] [CrossRef]
  41. Berwald, J.; Gidea, M.; Vejdemo-Johansson, M. Automatic recognition and tagging of topologically different regimes in dynamical systems. arXiv 2013, arXiv:1312.2482. [Google Scholar] [CrossRef] [Green Version]
  42. Gidea, M.; Katz, Y. Topological data analysis of financial time series: Landscapes of crashes. Phys. A Stat. Mech. Its Appl. 2018, 491, 820–834. [Google Scholar] [CrossRef] [Green Version]
  43. Gidea, M.; Goldsmith, D.; Katz, Y.; Roldan, P.; Shmalo, Y. Topological recognition of critical transitions in time series of cryptocurrencies. Phys. A Stat. Mech. Its Appl. 2020, 548, 123843. [Google Scholar] [CrossRef] [Green Version]
  44. Vejdemo-Johansson, M.; Pokorny, F.T.; Skraba, P.; Kragic, D. Cohomological learning of periodic motion. Appl. Algebra Eng. Commun. Comput. 2015, 26, 5–26. [Google Scholar] [CrossRef]
  45. Carlsson, G.; De Silva, V.; Morozov, D. Zigzag persistent homology and real-valued functions. In Proceedings of the Twenty-Fifth Annual Symposium on Computational Geometry, Aarhus, Denmark, 8–10 June 2009; pp. 247–256. [Google Scholar]
  46. Sel’Kov, E. Self-oscillations in glycolysis. Eur. J. Biochem. 1968, 4, 79–86. [Google Scholar] [CrossRef]
  47. Cavanna, N.J.; Jahanseir, M.; Sheehy, D.R. A geometric perspective on sparse filtrations. arXiv 2015, arXiv:1506.03797. [Google Scholar]
  48. Strogatz, S.H. Nonlinear Dynamics and Chaos; Taylor & Francis Inc.: Abingdon, UK, 2014. [Google Scholar]
Figure 1. A small example of zigzag filtration with a corresponding zigzag persistence diagram.
Algorithms 13 00278 g001
Figure 2. Outline of the Bifurcations using Zigzag (BuZZ) method. (a) the input time series; (b) the corresponding point clouds embedded via time-delay embedding; (c) the zigzag of Rips complexes constructed as described in Section 2.3; (d) the corresponding zigzag persistence diagram.
Algorithms 13 00278 g002
Figure 3. Example zigzag using fixed radius with computed inputs for Dionysus.
Algorithms 13 00278 g003
Figure 4. Example zigzag using a changing radius with computed inputs for Dionysus: in this example, r 0 > r 1 and r 2 > r 1 .
Algorithms 13 00278 g004
Figure 5. Top: Example zigzag of point clouds with unions considered in Section 3.2. Middle: Zigzag filtration applied to point clouds using the Rips complex with specified radii. Note that 2-simplices are not shown in the complexes. Bottom: The resulting zigzag persistence diagram.
Algorithms 13 00278 g005
Figure 6. First and second rows: generated time-series data and corresponding time-delay embeddings. Bottom left: The zigzag filtration using Rips complex with fixed radius of 0.72. Note that 2-simplices are not shown in the complexes. Bottom middle: The corresponding zigzag persistence diagram. Bottom right: Persistence diagram showing how the 1-dimensional off diagonal point varies depending on the Rips complex radius parameter choice.
Algorithms 13 00278 g006
Figure 7. Top: Examples of samplings of the state space of the Sel’kov model for varying parameter value b. Middle: Time series corresponding to only retaining the x-coordinates of the solutions shown in the top figure. Bottom left: zigzag filtration using the Rips complex of the reconstruction with fixed radius of 0.25. Note that 2-simplices are not shown in the complexes. Bottom right: resulting zigzag persistence diagram.
Algorithms 13 00278 g007
Publisher’s Note: MDPI stays neutral with regard to jurisdictional claims in published maps and institutional affiliations.