1. Introduction
Augmented Reality (AR) and Virtual Reality (VR) technologies are increasingly popular, as the hardware and software evolve and make them accessible for a wide range of applications. They have been applied to different areas because of their potential to enhance user experiences while learning, training, simulating, playing games or other tasks. They are the two most popular sub-areas of the wider concept of Extended Reality (ER), which has been proposed as an umbrella term, encompassing both AR and VR, as comprehensively reviewed by S. Chuah in Reference [
1].
In 1994, a taxonomy was proposed by Paul Milgram and Fumio Kishino [
2] for mixed reality. Milgram and Kishino hypothesize that no real boundaries exist between the virtual and real worlds. Rather, they argue that it is possible to move from one world to another across a continuum, called mixed reality. The continuum goes from the real world to Augmented Reality, passing by Augmented Virtuality and ending at a Virtual Environment. In the Virtual Environment, the user will be fully immersed in a digitally calculated world.
Augmented reality is also described by Azuma in 1997 as a technology in which “3D virtual objects are integrated into a 3D real environment in real time” [
3]. A. Johnson, in 2011, follows a similar approach, in a context where augmented reality is described as “the addition of a computer-assisted contextual layer of information over the real world,” while being recognised as one key technology to become popular for museums in the mid term. J. Peddie, in a book entitled “Augmented Reality—Where We All Will Live” [
4], makes a thorough review of the current AR technology, applications and trends. The author projects that AR will be a market of
$90 billion in 2020, becoming increasingly more important in human life in the coming years.
VR for education and training has been studied since the 1980s and 1990s [
5]. In this context, it provides a safe environment in which the learners and trainees can interact with virtual objects and scenarios, possibly making mistakes without being hurt or causing damage. Ong et al. reviewed applications of AR and VR in manufacturing [
6]. D. Guttentag reviewed applications of VR in the industry of tourism [
7]. For tourism, VR can provide experiences where the user is immersed in a virtual environment which mimics places and experiences, at a fraction of the cost and time required to visit the actual place. Several new applications have emerged in recent years. J. Scholz and A. Smith propose a framework for successfully deploying AR in marketing campaigns, capturing consumers’ attention and engagement [
8]. P. Rauschnabel et al. present an analysis of the impact of AR mobile applications developed for marketing purposes. The applications analysed are Ikea Planner—which allows the users to place virtual furniture in a physical room—and Tunnel—which projects song-related information to a user’s environment. Based on surveys, they conclude the use of the applications has a positive impact on users’ attitude towards the brands [
9]. H. Hofman describes the use of VR for therapy, where patients benefit from VR experiences for pain control and phobia control [
10].
Most of the technologies used for AR and VR rely on specific individual devices. Microsoft’s HoloLens (More information about Hololens available at
https://www.microsoft.com/en-us/hololens (last checked 2019-07-06).) is a device which places virtual objects and information in the user’s field of view, therefore creating an experience of augmented reality.Oculus Rift (More information about Oculus Rift available at
https://www.oculus.com/ (last checked 2019-07-06)) is a VR headset that occupies all the user’s field of view, so that the user will only see and interact with virtual objects shown in the headset. Other devices include simple enclosures for smartphones, where the smartphone provides the images for the user through a system of stereoscopic lenses. Those devices provide an impressive experience, in an immersive environment, where the user easily feels like they are living in the virtual or augmented world and detached from the real world. On the other hand, they have various ergonomic disadvantages such as limiting the user’s field of vision and eye accommodation problems resulting from incorrect focusing distances. The fact that the user feels totally detached from the real world may also pose some dangers, especially for prolonged usage [
11,
12,
13].
Projected Augmented Reality Models (PARM) work by diffusing the computer images directly onto a three-dimensional physical construction, which has the same shape as the projected model [
14]. That is a specific branch of augmented reality that counters most of the ergonomic and health problems of conventional devices. It is also called Projection Augmented Reality, as well as Spatially Augmented Reality [
15]. PARM also has disadvantages when compared to traditional Augmented Reality and Virtual Reality models. It requires a physical model which has a cost of production and requires time to produce and update. Notably, the experience of PARM is not as immersing as in VR or AR, but that is possibly why it does not cause sickness as the AR and VR experiences cause. Moreover, in PARM one simple setup can be experienced by many people at the same time. In AR and VR systems requiring headsets and special apparatus, the hardware is often for individual use, used by just one person at a time. The PARM experience, in the context of Milgram’s view of the mixed reality continuum, will lie closer to the Real Environment than the more popular AR and VR models.
The idea of PARM for city modelling appeared more than twenty years ago. Raskar et al. proposed a model where small prototype buildings are augmented with projected imagery, using a number of different projectors [
16]. In 2017, Xaviéra Calixte and Pierre Leclercq proposed a PARM model to be used in architectural design [
17]. The system works by projecting images over a flat surface where small white models of the buildings are manually placed. Users are able to observe the model and even, in some cases, interact with it.
The present paper describes an application of Artificial Intelligence (AI) algorithms, namely a Genetic Algorithm (GA) and a search algorithm (A*), in order to solve the Traveling Salesman Problem (TSP) in a PARM. The PARM experience is achieved using a video projector over a 3D model of a portion of the city of Coimbra, Portugal. Geographical information to create the physical model was retrieved from OpenStreetMap (OpenStreetMap is available at
https://www.openstreetmap.org (last checked 2019-04-26)) (OSM). OSM data was then imported in Blender (Blender Open 3D Creation Software is available at
https://www.blender.org/ (last checked 2019-04-26)), where further layers of information were added and the final 3D model was designed. The 3D model of the area was then built using wood pieces cut in a precision laser cutter, before being finished and painted white. It was also imported for Unity (Unity 3D development platform is available at
https://unity.com/ (last checked 2019-04-26)) game engine, where the AI algorithms were implemented, as well as the user interface for control using a smart phone, tablet or computer. The application was named Projected Augmented Reality Intelligent Model Control (PARIMC).
Section 2 describes the architecture of the system.
Section 3 describes the experiments performed to optimize the model and the results obtained.
Section 5 draws some conclusions and perspectives of future developments.
2. Model Proposed
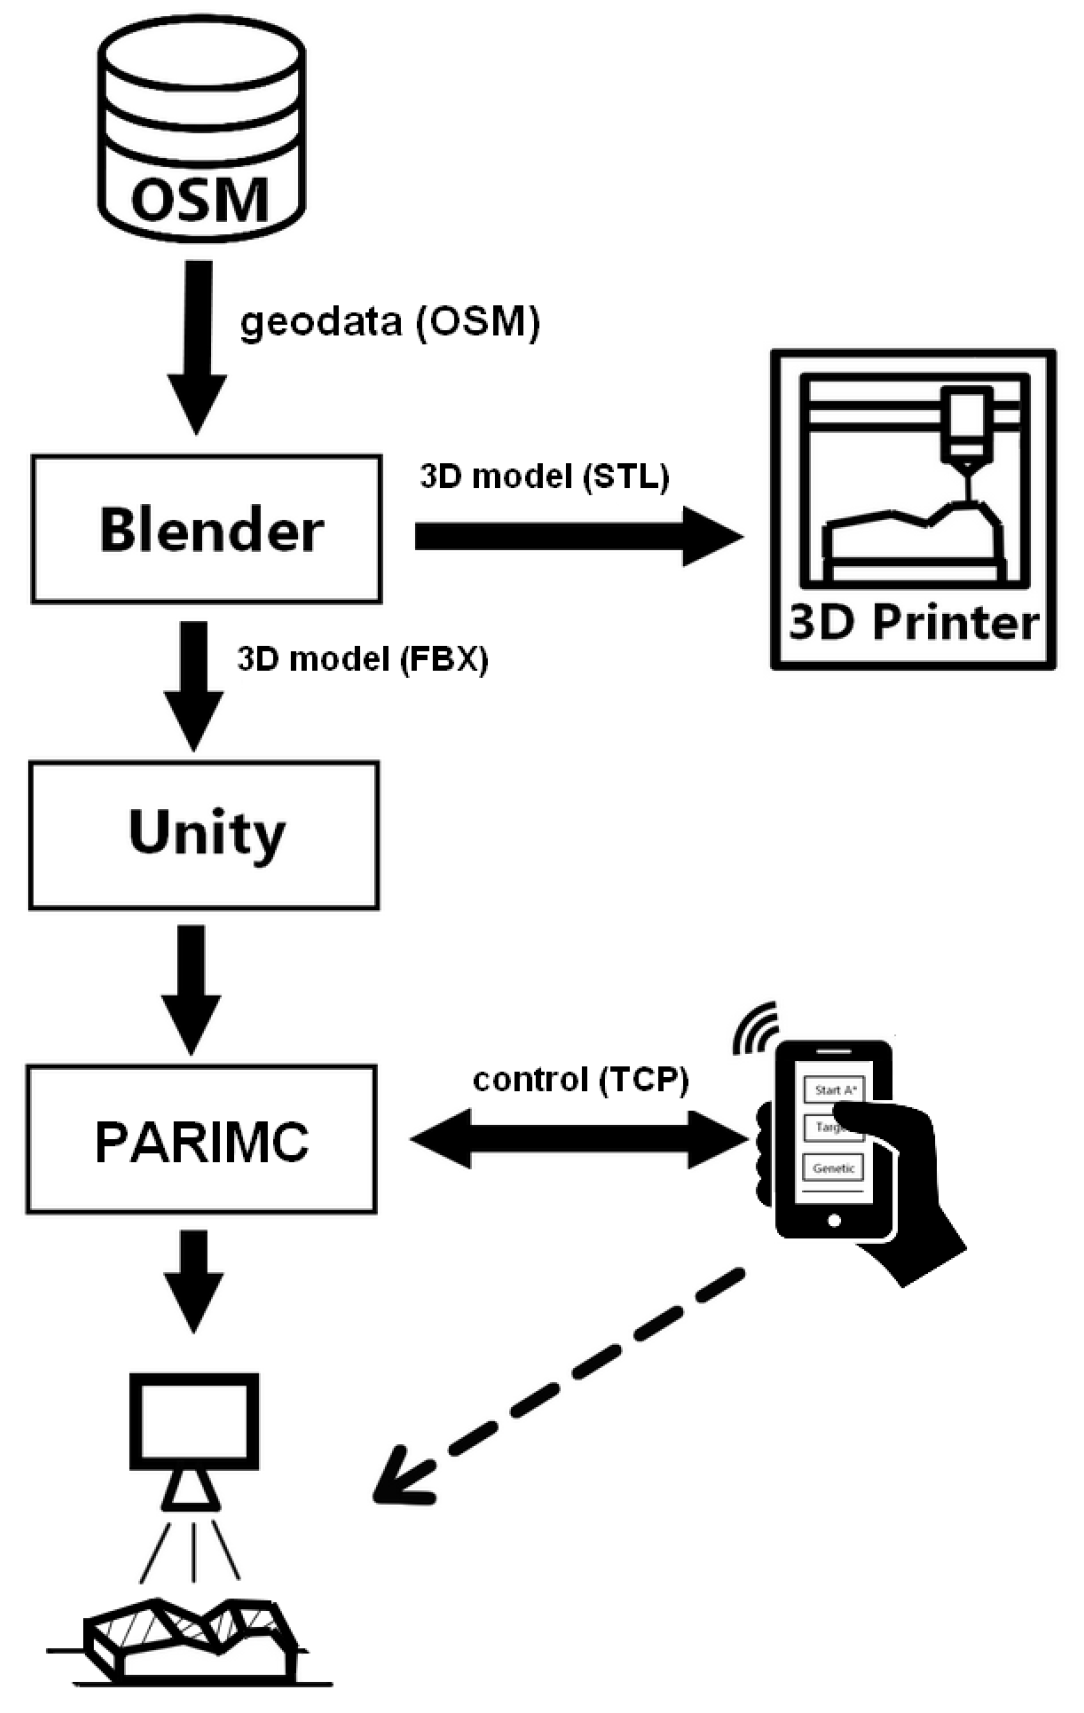
Figure 1 shows a diagram representing the main components of the whole system. It also shows the main data flows and communication protocols used. The process starts with selecting the relevant geodata and exporting them from OpenStreetMap. The data are then imported to Blender 3D modeling software for building the 3D model. The model created in Blender is then used to create the physical model, by printing in a 3D printer or using a similar method. In the present project, it was created using thin wood pieces, cut in a precision laser cutter. The same Blender model is also imported in Unity, where it is refined and the Artificial Intelligence algorithms are programmed. The final application programmed in Unity was named Projected Augmented Reality Intelligent Model Control (PARIMC). It also provides a user interface from a cell phone, tablet, computer or similar device. Users can then interact with the application, adjust different parameters and see the results projected on the 3D physical model.
2.1. Hardware—3D Map and Projector
The hardware used to create the PAR effect is a video projector, mounted on an iron structure, projecting over the 3D physical map.
The video projector used has WXGA resolution: dpi, aspect ratio 16:10 and zoom control. It was mounted on an iron structure designed for the purpose and assembled in the School of Engineering’s Laboratory of Mechanics. The iron bar extends, lifting the projector up to two meters high. The projector is mounted facing down, so that the projected image forms over the 3D map below. The system is calibrated in hardware and software. In hardware, calibration consists of adjusting the projector’s position. The projector can be moved up and down, and its angle relative to the map can also be adjusted using the mounting screws. The zoom is also used for fine adjustments of the projected image size. When the image is well formed and adjusted over the 3D map, fine adjustments may be performed in the software, if necessary.
2.2. Obtaining and Preparing Georeferenced Information
The georeferenced data to create the model was obtained from OpenStreetMap. A region of interest was defined, around the area of the School of Engineering of the Polytechnic Institute of Coimbra.
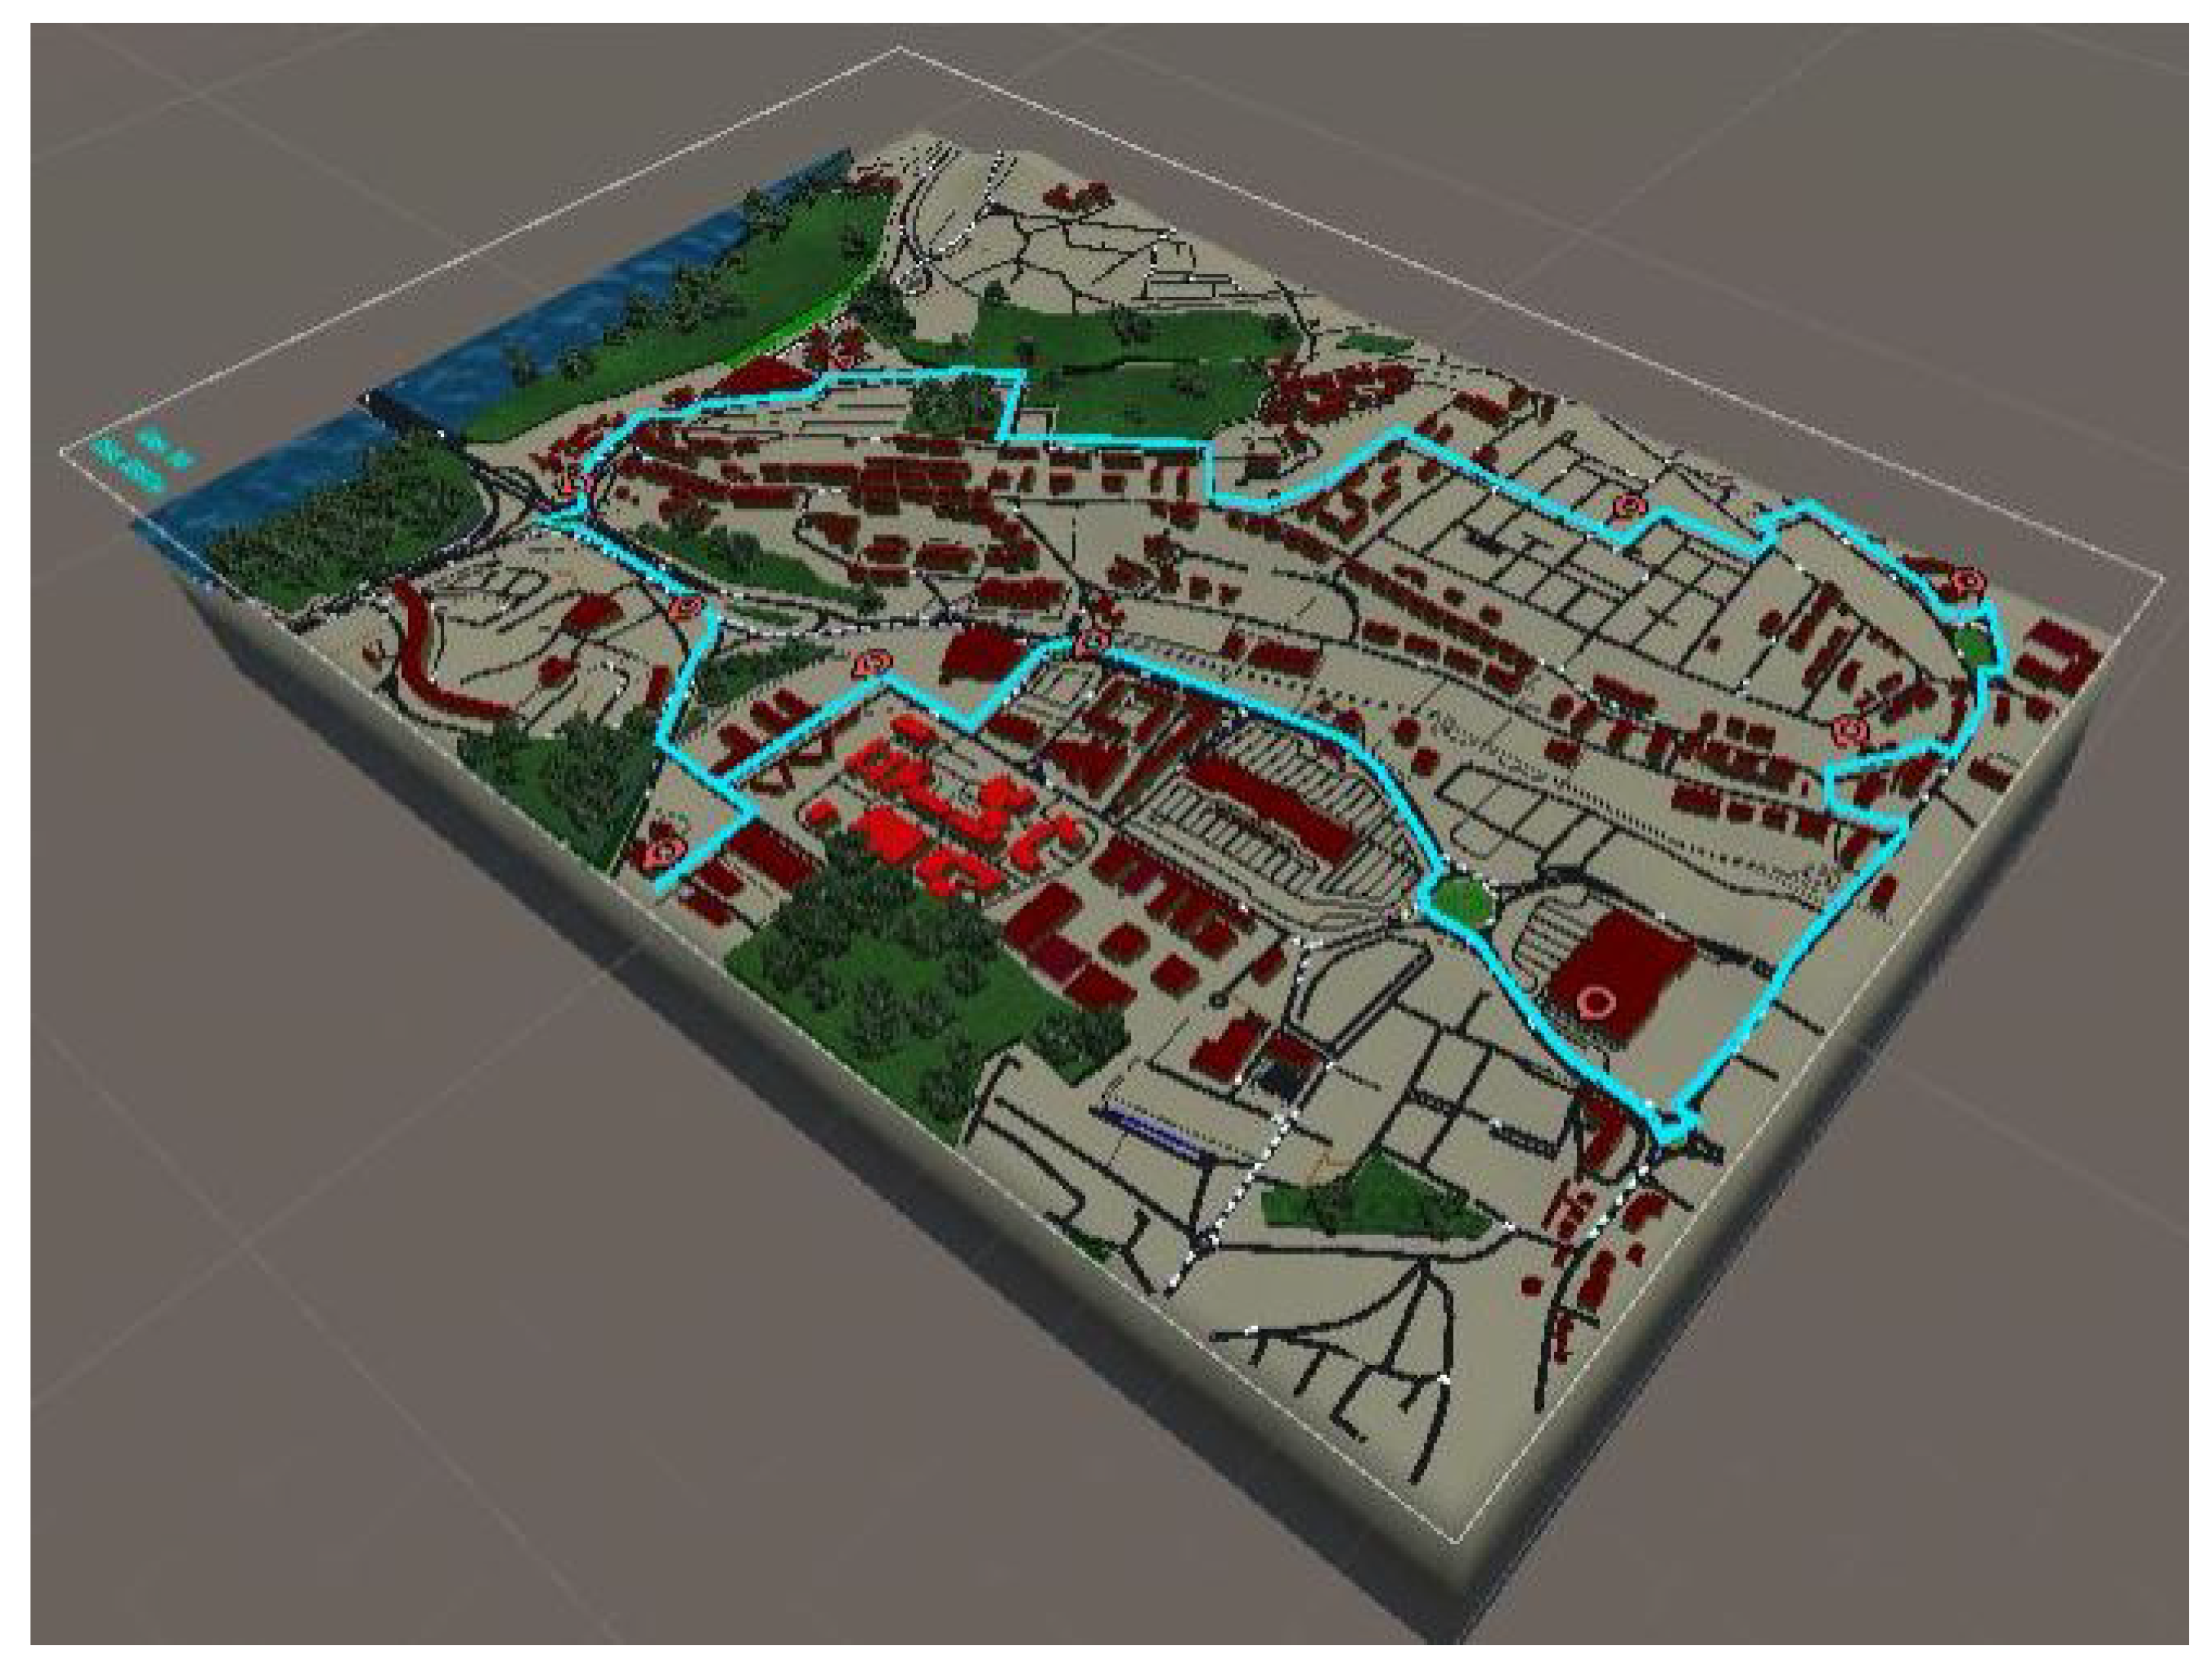
Figure 10 shows the area, after being processed and modeled in Unity. The area modeled contains the School of Engineering (red in the figure), a large residential and commercial area around the school, some green areas, as well as a small portion of the Mondego river and the bridge to the other margin. The urban area covered is approximately
km.
The dataset obtained from OSM contains information about the routes and also partial information on the buildings. It contains the location of most of the buildings and the height of some of them. The information was imported using Blender add-on blender-osm, in March 2019.
At the time of importing, OSM did not provide accurate information about all the buildings, namely their height was missing. So the height of the buildings for the physical model had to be estimated. Existing buildings can be grouped by height, in a number of categories, manually defined in blender-osm. Three categories were manually defined for the current model. Hence, the buildings in the physical map have three different heights. The buildings that occupy just a small area are given the lowest height. Buildings with no height information in OSM are included in this first category, so even a flat building will receive a small height in the model. This includes most of the buildings, since there is not much information in OSM for buildings of the area being modeled. Average buildings are given average height, and large buildings are given larger height.
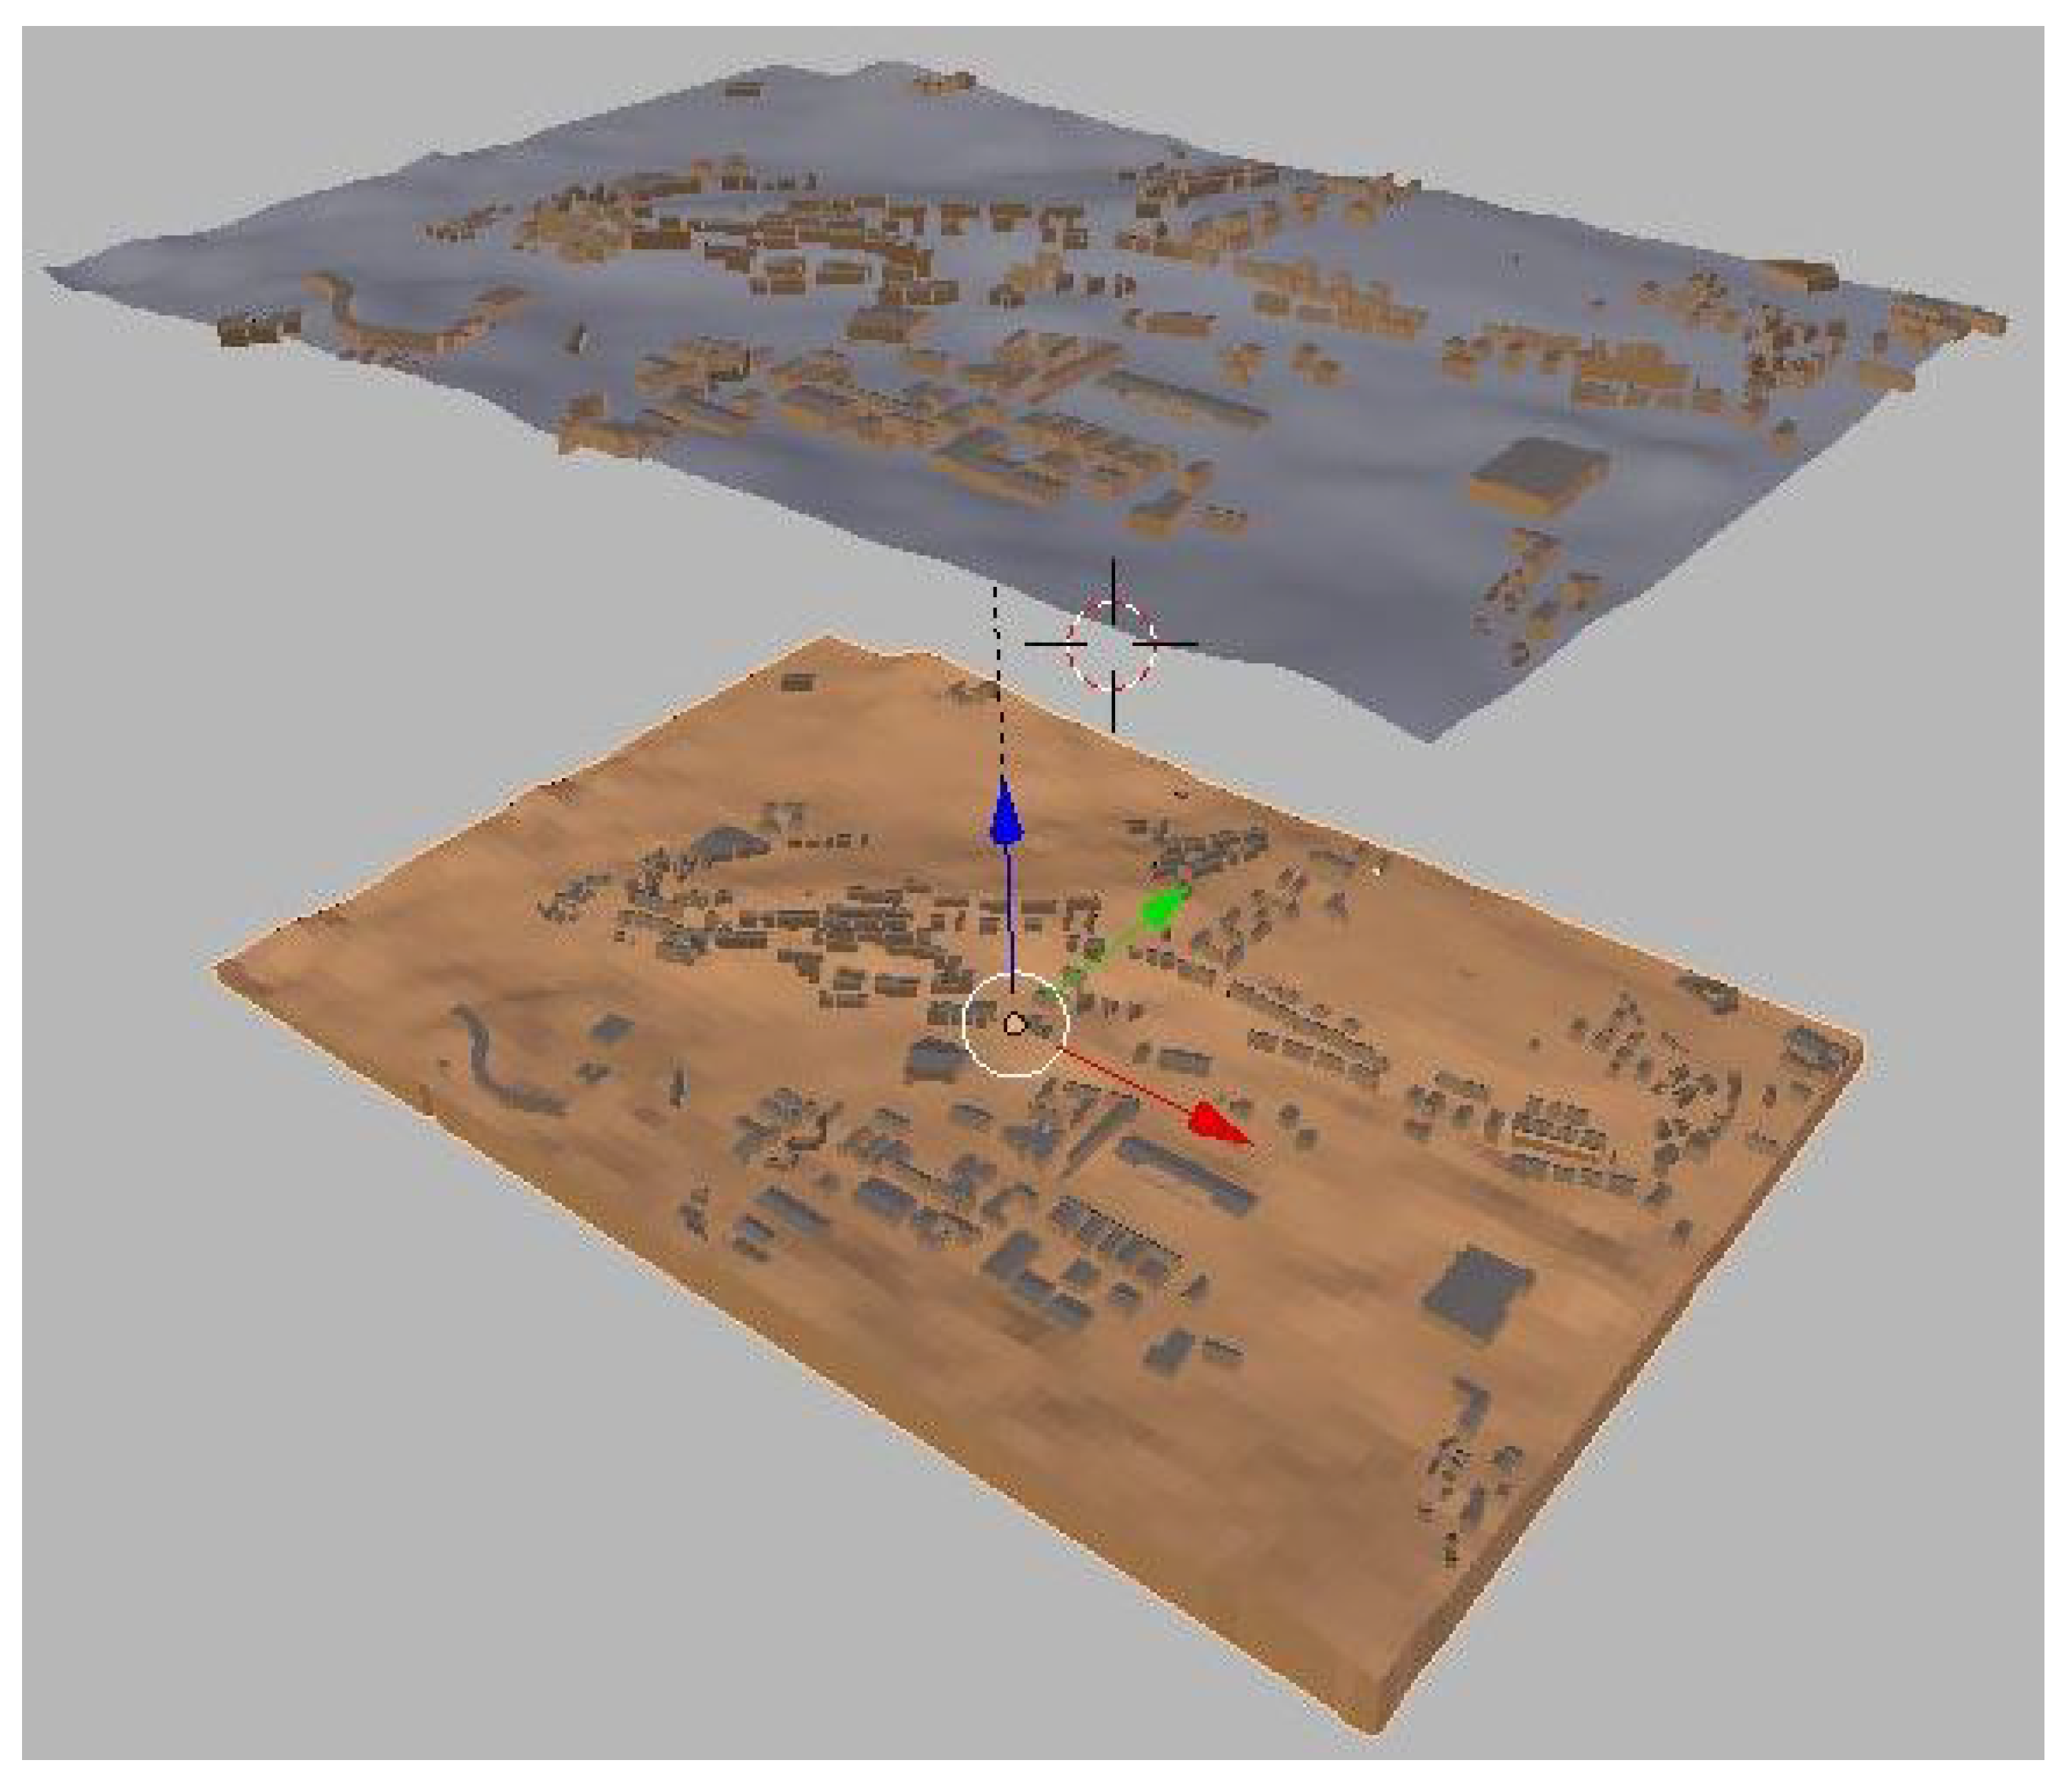
Figure 2 shows the terrain, imported from OSM, as a Blender object, with the buildings on top.
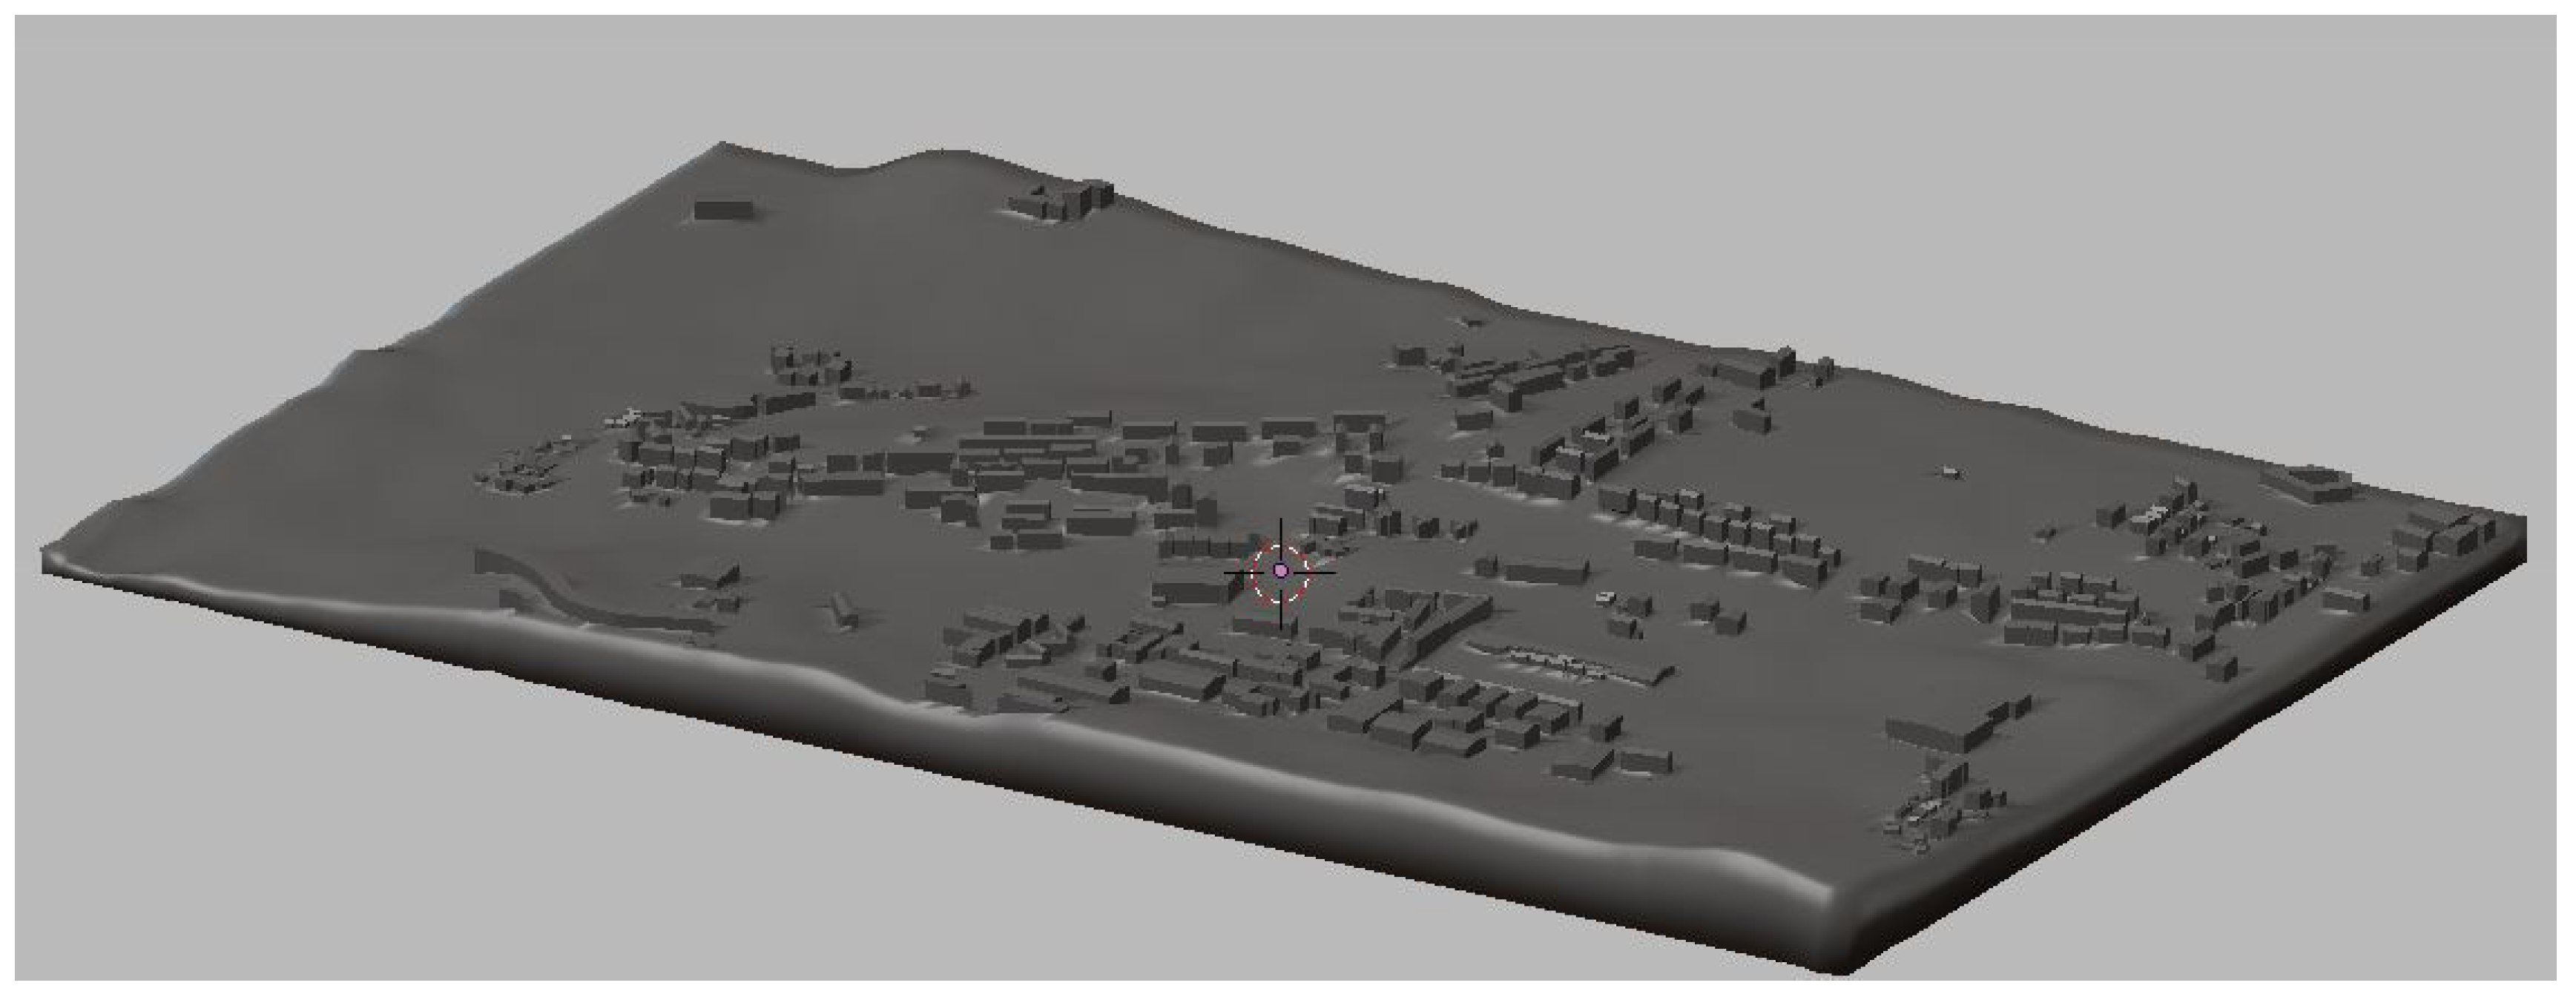
Figure 3 shows the solid ready to slice and export to create the physical model.
2.3. Creating the Physical Model
In order to create the physical model, the initial idea was to print the virtual model in a 3D printer, using PLA filament. The goal was to make a model with horizontal dimensions
cm and a minimum width of 3 mm. Because of its size, it could be printed in eight pieces of
cm each piece, for the most common 3D printers available can print a maximum of about 20 cm. However, in the 3D printers available for the project, each piece would take about seven hours to print, on average. During those seven hours problems may occur, damaging the whole work and forcing it to restart again. Therefore, to get faster results and also reduce costs, the choice was made to use a precision laser cutter and cut 250 wood pieces, to use as slices of the model. The final size is therefore
cm, with a maximum height of 3.74 cm.
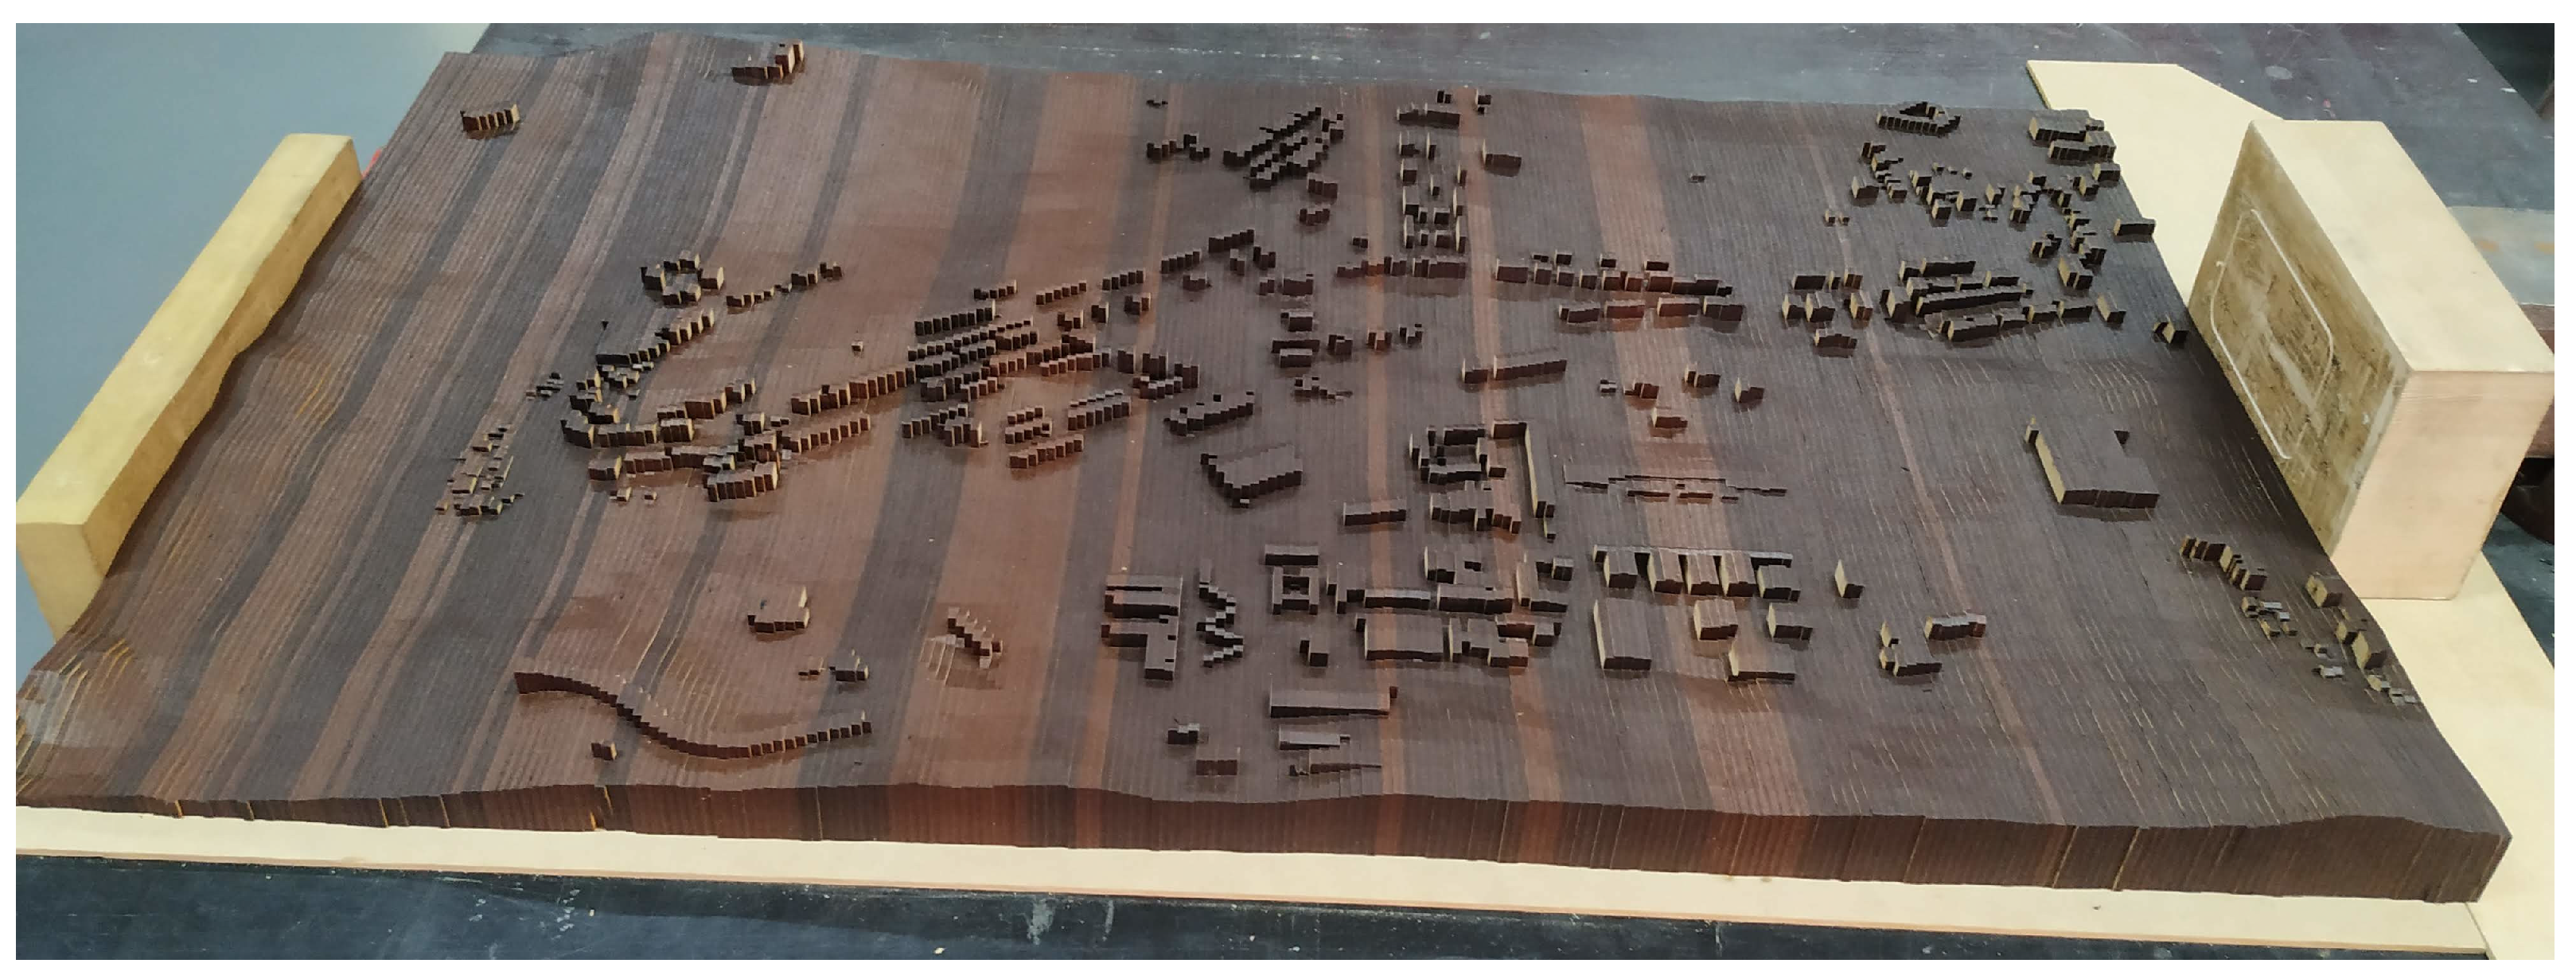
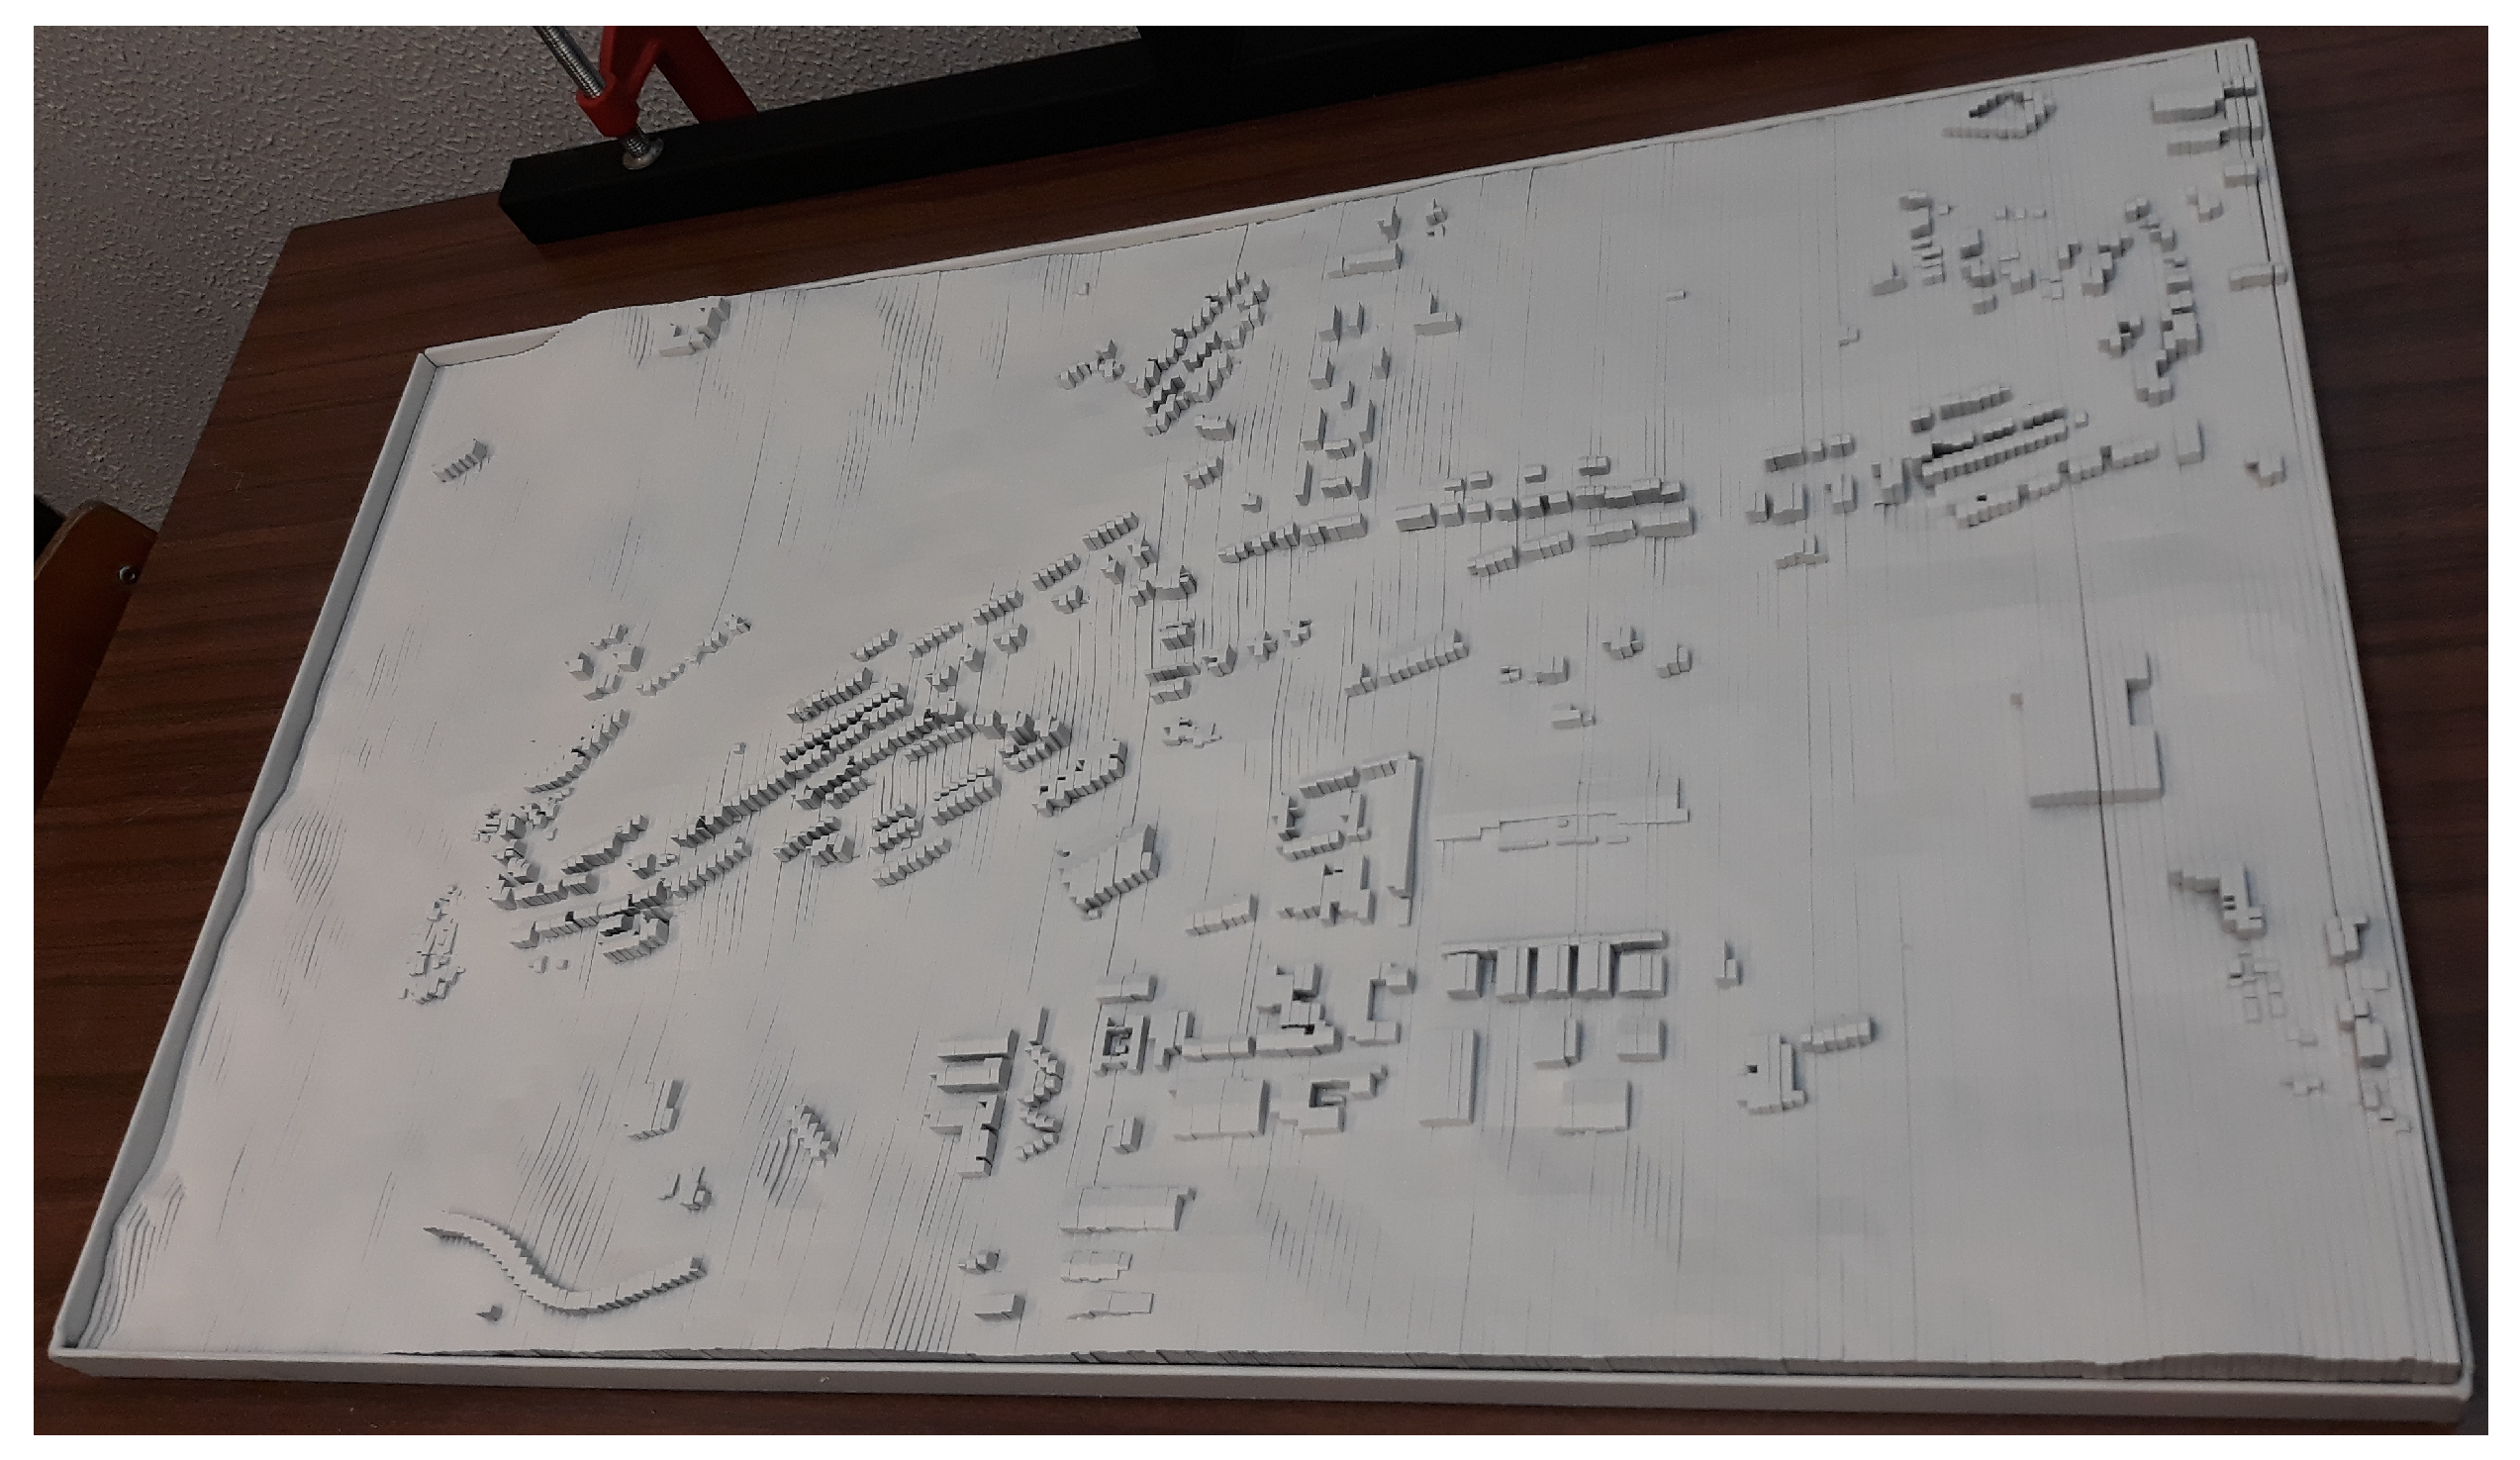
Figure 4 shows the physical model after the pieces of wood were cut and put together. The raw wood had different shades of brown, so it was not appropriate for color restitution in the projection environment. In order to make the pieces usable, they were framed in an iron structure and painted with white matte paint before being used.
Figure 5 shows the 3D map framed and painted white.
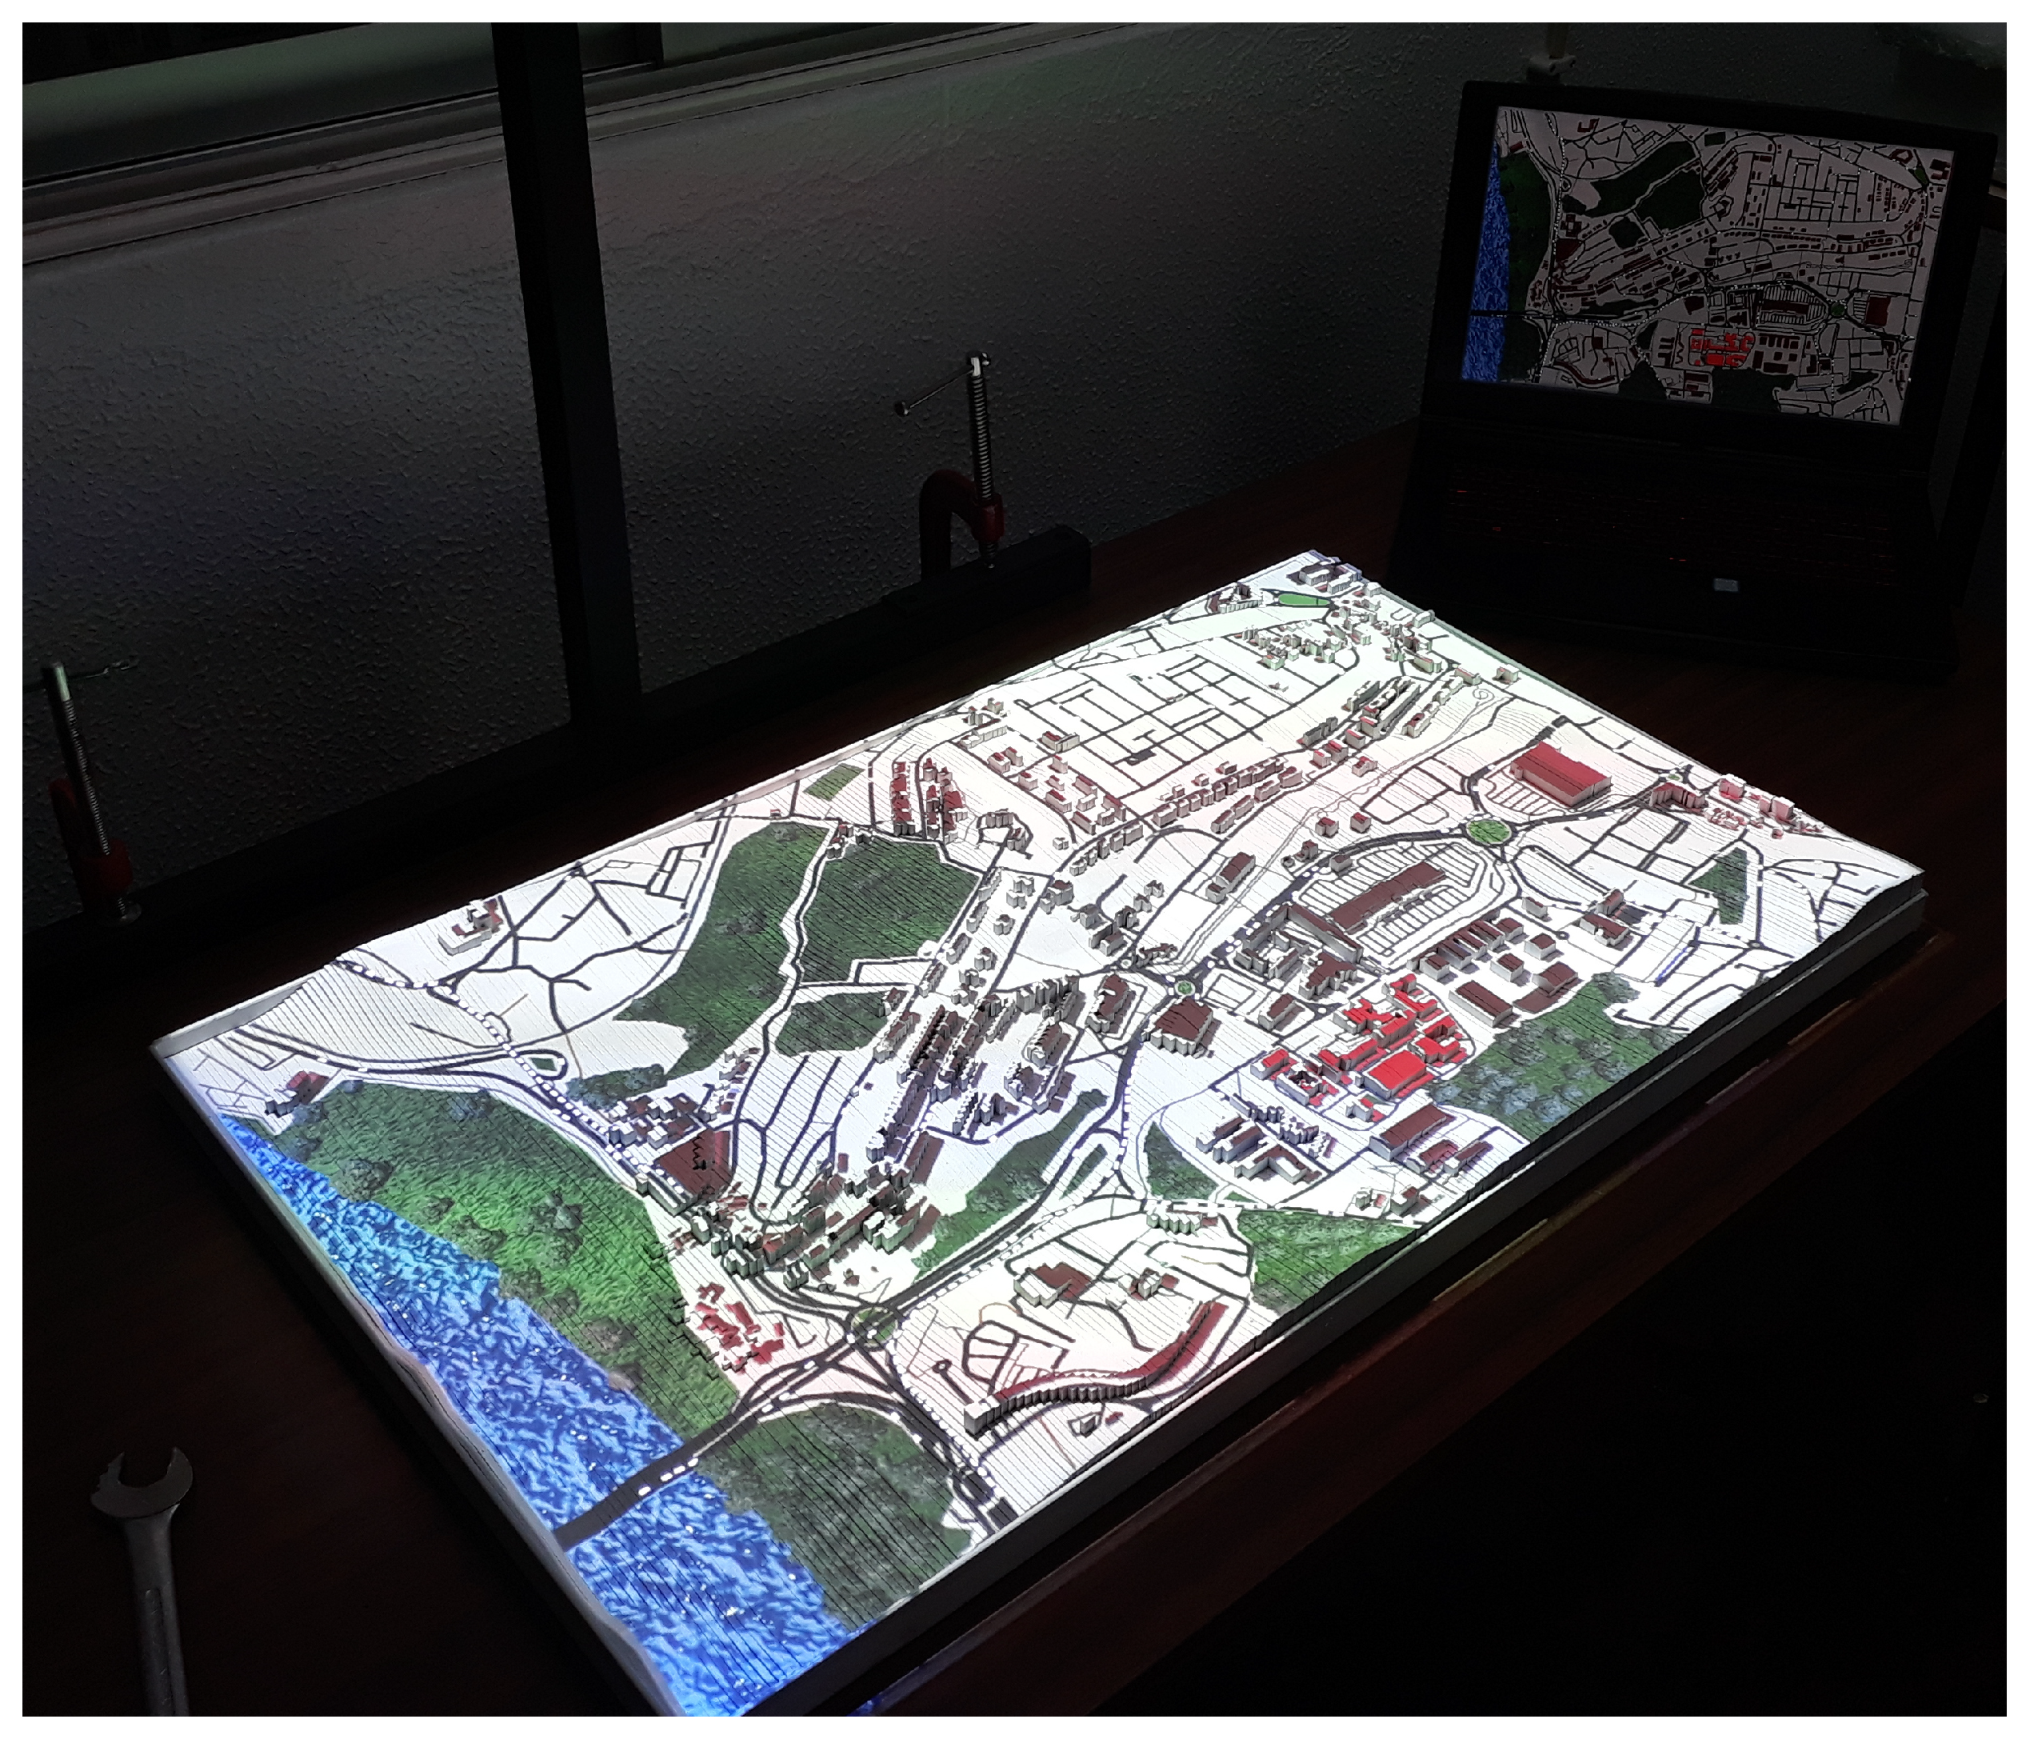
Figure 6 shows the final result, with the projection of the city objects over the wooden physical model. Behind the wooden structure there is the computer screen in the background, for comparison of the dimensions and other visual aspects.
2.4. AI Simulator and PAR Generator—PARIMC
The 3D model created in Blender was exported to Unity, for programming higher level functions using programming language C#. The application produced in Unity was named Projected Augmented Reality Intelligent Model Control (PARIMC), because it contained the 3D data model, the AI algorithms and the user interface. It can run the necessary simulations and generate the views ready for the PAR experience.
After the 3D model was imported to Unity, it was enhanced with additional objects. One object was a sound file, playing city noise to make the user experience more realistic. Another addition was moving objects, mimicking the movement of cars, buses and other vehicles, over the roads of the city. A number of vehicles was generated and placed in the roads at random. The vehicles then moved over the roads simulating normal city traffic in a busy day. The vehicle models implemented have collision avoidance algorithms, so that they stop at intersections when needed and also avoid colliding with other vehicles. They move over the roads retrieved from OSM, on all lanes available. It was not possible to obtain detailed information of the traffic signs, so traffic signs were not implemented.
2.5. Use of GA and A* for Solving the Travel Salesman Problem
The Traveling Salesman Problem (TSP) [
18] was first introduced by William Rowan Hamilton in the 19th Century, and it remains one of the classical problems in Artificial Intelligence.
The goal in the problem is to find an optimal solution for a supposed salesman who needs to visit a number of different points of interest, starting and ending at a given point. An optimal solution will be a path that contains all the points of interest, in an optimal order, minimizing the total distance traveled. It is a combinatorial optimization problem belonging to the class of NP-complete problems.
For a small number of points, the TSP problem can be resolved as a search problem, applying a search algorithm that tries all possible combinations and returns the path with the lowest cost (smallest distance to travel). As the number of places to visit grows, the search space becomes very large and the search tree grows exponentially. For the problem of visiting n points of interest, returning to the starting point, the search space has solutions. Another approach to solve the TSP problem, without using large search trees, is using adaptive algorithms such as Particle Swarm Optimization or Genetic Algorithms. The present research uses a GA.
2.5.1. Genetic Algorithms
GA are inspired by the theory of natural selection from Biology. The algorithm starts with a population, created at random. The population contains a number of individuals, defined by their individual genes organized in a chromosome. Solutions for the problem are encoded as chromosomes, so that each individual represents one possible solution. The fitness of each chromosome is calculated using a fitness function. In the present research the fitness function is the A*, as explained in
Section 2.5.2. The best chromosomes of each population are selected for crossover, therefore passing their genes to the next generation. The worst chromosomes are discarded, or in the best case they receive a very low probability of being selected for crossover. After crossover, some individual genes may be subject to mutation. Mutation consists in randomly changing some genes. The result of mutation is often bad, but sometimes it allows to escape local minima. Afterwards, the next generation is created with the new individuals. Sometimes a number of the best individuals of the previous generation are allowed to pass unchanged, in a process called elitism. Elitism guarantees that the best individuals are never lost.
2.5.2. Search with A*
For path finding, the popular Djikstra algorithm determines all possible nodes, taking into account their respective costs. Once the paths have been visited, the algorithm finds the various paths to the solution and determines the best by comparing their costs [
19]. It is the most popular algorithm due to its efficiency in pathfinding.
A* is one popular search algorithm, proposed in 1968 by Hart et al. [
20]. It is used to find the best path between two points, minimizing the cost of the path. Because of its good performance and low computational cost, it is popular for optimizing paths, for example in robotics [
21]. It differs from the Dijkstra algorithm in that it uses an heuristic to estimate the cost of the path that needs to be traversed to reach the destination. If the heuristic is good, A* has a good performance. If the heuristic is bad, the performance may be compromised.
A* is a complete algorithm, which means that if there is a solution it will always find that solution at some point of the search tree. It is also optimal, which means it always finds the best solution possible. It is an informed search method, which relies on an heuristic to make a decision. The heuristic is an estimate of the distance between the current node and the target point. In the present research, the heuristic is the straight line distance between the point of the map where the user is and the next target point to be visited.
The algorithm works trying to minimize the sum of the distances already traveled to node
n, which is usually called
, plus the distance still expected to travel to the goal, given by the heuristic
, as shown in Equation (
1). In the equation,
is the function that needs to be minimized.
For each candidate path, A* creates a search tree from the starting node to the goal node. Then for each node n of the path, it calculates f. The best path is the path with the lowest f.
2.5.3. Application of the GA and A* to the TSP
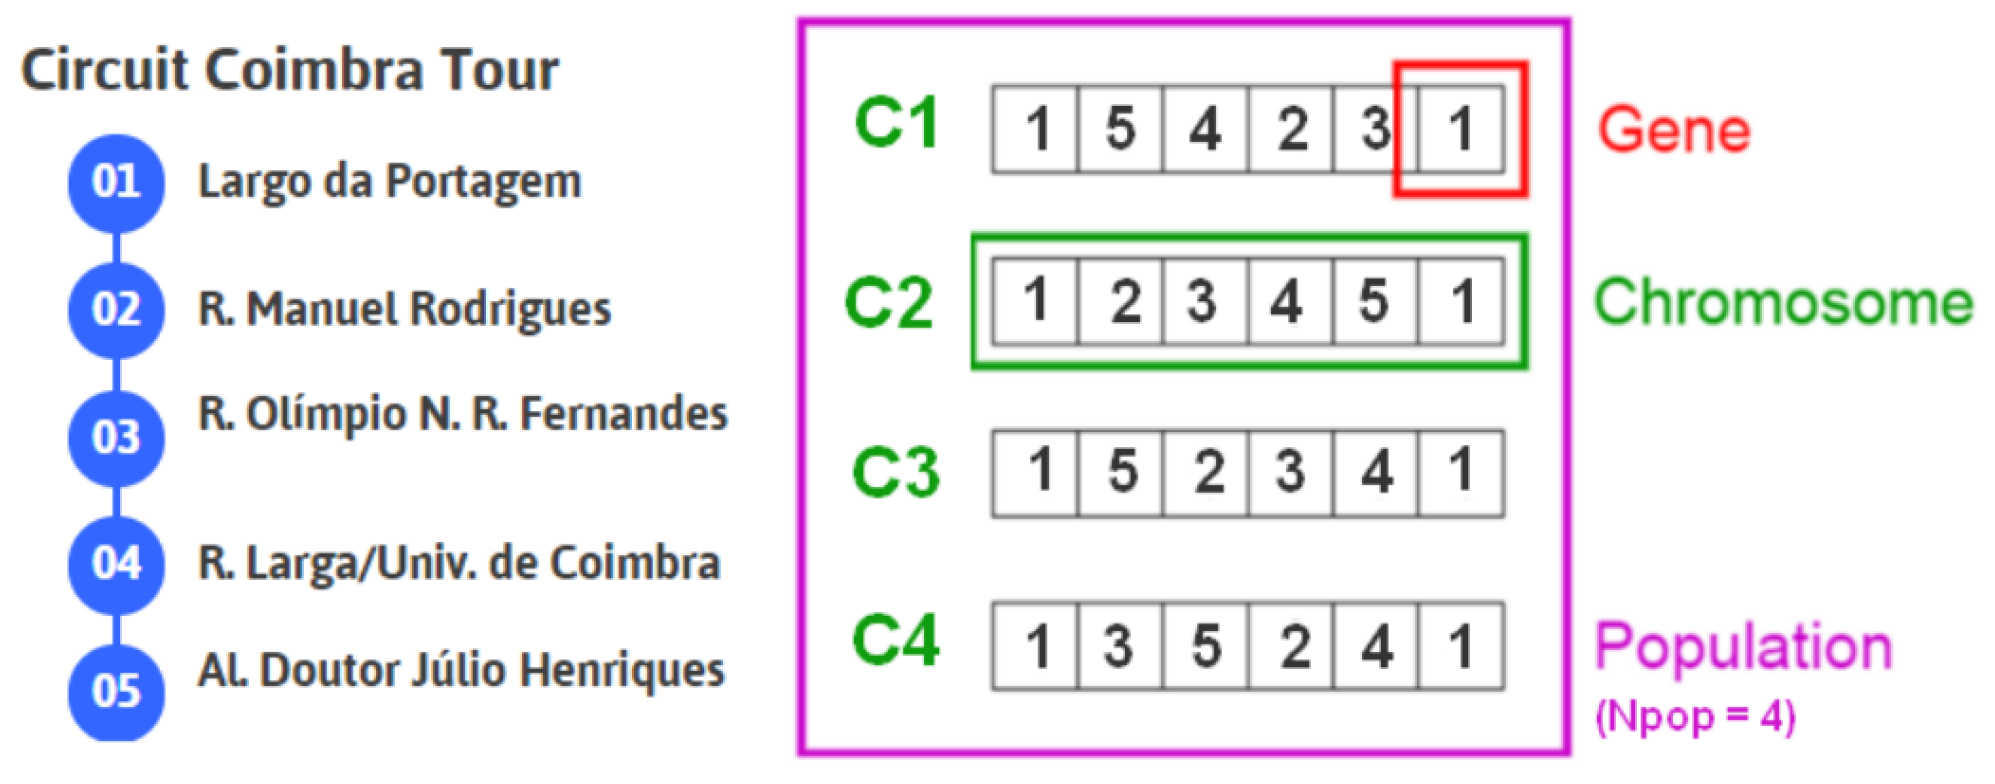
To apply the GA to solve the TSP problem, each solution is encoded as a chromosome. For example, if the user wants to visit locations {A, B, C, D}, each location is a gene and the different combinations of the letters are possible chromosomes.
Figure 7 depicts an example of a minimalist population, created for a TSP where the goal is to visit five different places. As the picture shows, the population contains four individuals. Each individual consists of five genes, one gene for each place to be visited. The order of the genes in the chromosome is the order by which the places are expected to be visited.
The fitness
f of each chromosome
j is calculated as the sum of the distances
d calculated by A* between each two consecutive points
i, including the distance between the last and the first point,
. For
n points, it is given by Equation (
2):
Solutions with a large distance to be traveled will receive a very low fitness and are eventually eliminated from the population of the genetic algorithm.
For the example population of
Figure 7, the fitness of chromosome C1 is the sum of the distances traveled to visit places 1–5–4–2–3–1, through the paths determined by A*. The fitness for C2 is the sum of the distances necessary to travel in a different order, starting with going from place 1 to place 2, then 3, then 4, then 5 and then getting back to 1.
2.6. Mobile Interface
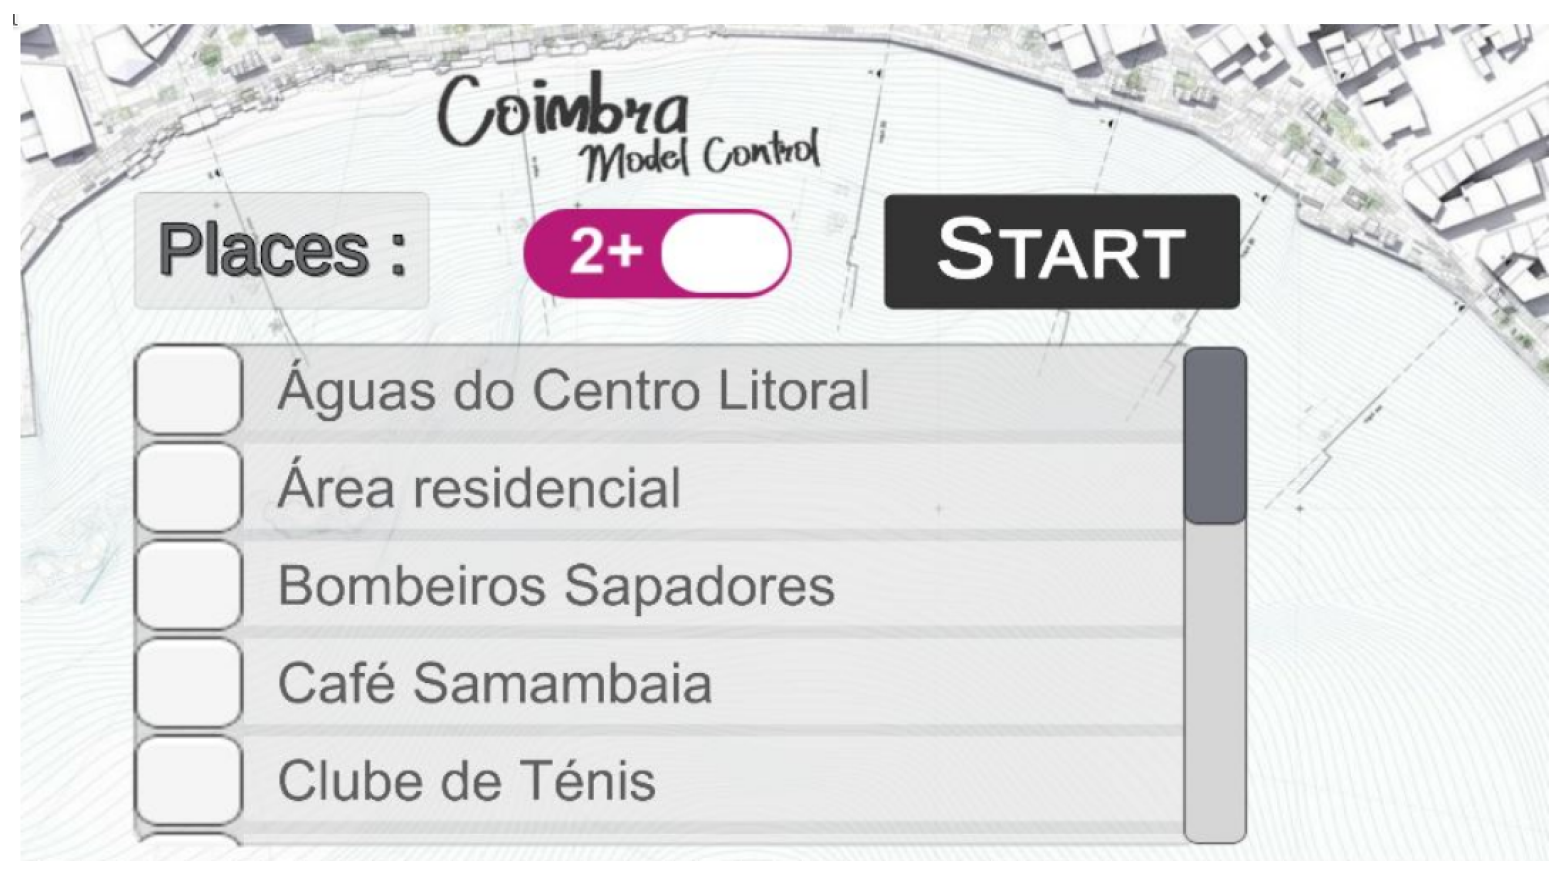
Figure 8 shows a picture of the cell phone user interface developed to control the system. As the figure shows, the interface is minimalist, optimized for small screens. After login, it shows a list of points of interest sorted by alphabetical order. The user can choose as many points of interest as desired and press “START” to send the information to PARIMC. Once the request is received by PARIMC, the GA is started. When the solution has been optimized, the path is shown in the PAR.
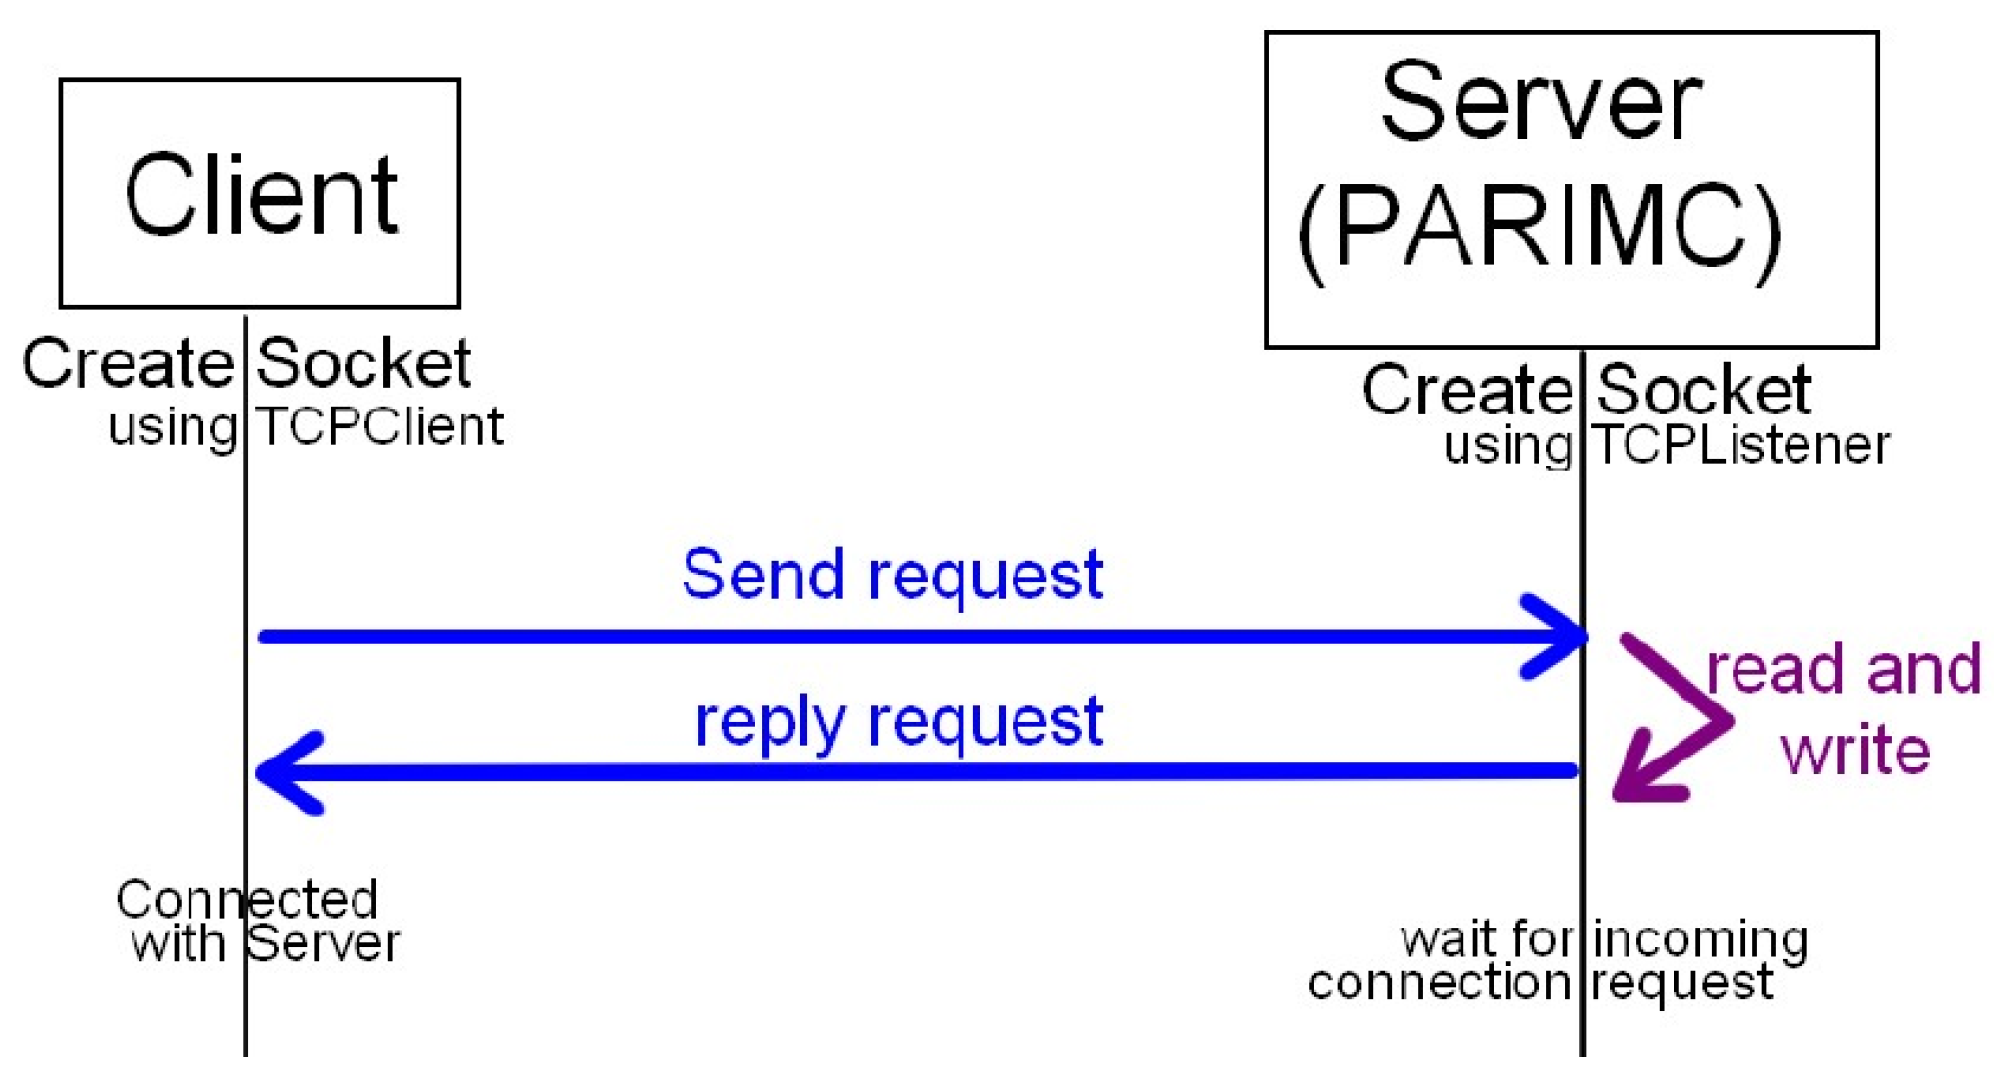
Figure 9 details the process of communication between the mobile interface and the control unit. The communication protocol implemented assumes PARIMC is the server and the mobile application will play the role of a client. The server is listening to the socket, awaiting for incoming connection requests from the clients. Communication is asynchronous, using the TCP protocol.
When a user chooses a number of places to visit in the interface and presses the START button, the application will generate a string with the request and send it to the server. The string starts with a prefix which is either A* or TSP, followed by the identification numbers of the places to visit. Prefix A* is used when the number of places is just two, for in that case it is not necessary to use the genetic algorithm to find the best path. When the number of places to visit is three or more, then the prefix will be TSP, meaning it will be necessary to optimize the path using the genetic algorithm.
3. Experiments and Results
Different experiments were performed to test the system and assess its performance.
Figure 10 shows an example of a path, for a problem where the user wanted to visit ten different points of interest. The search space comprises
points, and a total of
candidate paths. That is a total of 181,440 candidate paths. The chromosomes for the GA are the possible combinations of the ten locations.
Because of the randomness of the GA, the results may be different each time it is run. In order to have some confidence in the results, the results presented below are the average of thirty runs. That will ensure some stability and validity of the results presented.
In order to optimize the parameters of the algorithm, different experiments were performed to find the best of two crossover methods, a good population size, elitism size and mutation rate.
3.1. Results for Different Crossover Methods
There are many different crossover methods, for recombining the genes to generate the offspring. Two popular crossover methods were chosen in the present research: Ordered Crossover (OX) and Edge Recombination (ER).
In OX, the two individuals to be crossed are cut in two points. Each offspring receives a portion of the genes copied directly from one of the parents, and the remainder genes are filled by copying them from the other parent in the same order they were before. This method ensures all of the individuals contain all the points of interest to be visited, without repetitions.
In ER, crossover is performed giving priority to adjacent genes. That means the genes in the offspring will inherit adjacent genes from their parents.
Table 1 shows the results of different experiments, applying OX and ER, for different size populations. In those experiments Elitism was maintained
and mutation rate was maintained
M = 1%. The table shows the number of generations required to find a good solution and the time required to find that solution. Time is in milliseconds. As stated previously, the results are the average of thirty runs.
When there is no improvement after three generations, the GA is stopped and the best solution found is returned.
In the present paper, since the solution to the problem was known, the simulation was stopped when the algorithm found a path with 5791 m.
As the table shows, OX is much more efficient than ER, taking about half the number of generations and one third of the time for the best population size. Therefore, it will be used in the other experiments. The table also shows the best population size is 25–30 individuals, as highlighted in bold type. Using larger populations it is possible to reduce the number of generations in ER but each generation takes more time to simulate and the global time required does not decrease.
3.2. Population Size and Mutation Rate
Table 2 shows simulation results for different population sizes and mutation rates. For all the experiments, elitism was maintained in 5 and crossover was done using the OX method.
The results show the best is a population of 25 individuals, with a mutation rate of 1%. Lower mutation rates cause the algorithm to require more generations and require more time. Higher mutation rates, as expected, may impair convergence and delay the algorithm.
3.3. Elitism Size
Table 3 shows the influence of elitism on the performance of the GA. The results were also obtained with OX crossover and a population of 25 individuals. Mutation rate was varied between 0 and 1%. The best results are highlighted in bold type. As the table shows, the best result was obtained for an elitism of 6, with a mutation rate of 1%. Those parameters required the shortest processing time and the lowest number of generations.
4. Discussion
4.1. Advantages of the Proposed Model
Modern technology has made available different technologies which create virtual environments, or enhance user experiences by adding virtual features to the real world. Some of the technologies, however, cause side effects making the users feel sick. Projected Augmented Reality is one form of enhancing user experience which causes almost no side effects to humans. Combined with 3D printing technologies, it can create very powerful yet safe experiences.
The model proposed uses projected augmented reality technology to enhance user experience when seeing, studying or monitoring a portion of land. A virtual model of the land was created using geo-referenced data extracted from OpenStreetMap. The model was then enhanced with many features, including objects such as moving cars and AI algorithms for planning itineraries. A 3D physical model was also created using laser wood cutting technology, which is a simple and cost effective method, and both can be combined using a video projector over the 3D model. The final PAR model obtained gives a very realistic impression of the characteristics of the terrain, as well as the movement of objects such as vehicles on the streets.
4.2. Possible Applications
One natural application for the model is for showing special places in museums. PAR models, especially when using wood cutting technology, are a cost effective method to add value to any exhibition. For example, they can be used to exhibit interactive recreations of historical places or remote places, on Earth or other planets. The models can be created for cities and places of the past, as well as for scenarios predicted for the distant future.
In PARIMC, the physical model can be examined by the visitors, who can even walk around it, to see from different perspectives what the 3D structure of the place is like. Using the mobile application, users can also make changes to the model, simulating different scenarios or recreating different situations, as they travel around the model. Using the game engine, it is possible to add or remove features from the scene. So, in the future it could be possible to show or hide features like cars, people, trees, animals, water or boats, for example.
Another very important possible application of the technology is to model scenarios of catastrophes. In disaster situations, such as floods, fires, earthquakes or even battles, the commanding officers need a picture as clear as possible of the situation on the terrain. Using a model such as the one proposed, it is possible to recreate in near real time the advance of the flames of a fire, the advance (real or expected) of water in a situation of flood or other other situations. The fact that the model has precise geographical information is very important, for example to predict the advance of water in flooding situations. The 3D model offers more information than just 2D projections on the computer screen. In the proposed model, the results have also shown that it is possible to communicate and make simulations on the model with ease, using the mobile application.
4.3. Main Contributions and Limitations of PARIMC
PARIMC proposes a number of novel ideas for the state of the art. To the best of the authors’ knowledge, it is the first time geodata has been used to create a PAR physical model of an existing urban terrain. It is also the first time a PAR system has been controlled using a game engine with AI algorithms and a user interface accessible from a mobile device.
Raskar et al. [
16] propose a PAR system to augment prototype buildings. But Raskar’s approach requires a number of different projectors. Their focus is on the buildings themselves. In that regard, Raskar’s approach is similar to Xaviéra & Leclercq’s [
17], who developed a PAR system for architectural design, as described in
Section 1. PARIMC uses just one projector above the scene, so the setup and calibration of the system is very simple. Plus, there are fewer shadows using just one projector. In PARIMC, the 3D effect comes from a model of the terrain which must be printed using geodata data from OSM or an equivalent database. The scale is also larger than in previous models, such as Raskar or Leclercq’s models, which focus on small solids rather than large areas of terrain. In PARIMC, the changes expected in altitude are small and the surface of the terrain gradually changes over large areas, except for the height of the buildings, which represent sudden vertical changes.
PARIMC also relies on a game engine for real time simulations. In the present prototype, Unity 3D was used, but other game engines may be used for control. The use of a mobile application to interact with the model is also a simple and effective innovation, which facilitates the user interface. PARIMC is, to the best of the authors’ knowledge, the only model which is suitable for some specific applications. PARIMC’s architecture makes it suitable, for example, for simulating and showing, in 3D, scenarios such as the advance of water in a flooding situation. Not only that, but the use of AI algorithms also confers on the system the ability to show clear and safe paths. It is also the only PAR model suitable to use for virtual visits or war games over a realistic model of the terrain.
One limitation of the system is its vertical resolution. Using just one projector it is not possible to accurately show the facades of the buildings, for example. Given the scale of the model, it is not of paramount importance. Nonetheless, it is still one limitation which must be resolved for larger models with higher resolution.
5. Conclusions
The combination of 3D modeling and printing technologies, combined with the use of projected augmented reality, enhances user experience without causing the side effects associated with traditional augmented reality and virtual reality technologies. The present paper describes a process of extracting geodata from OpenStreetMap, to create a virtual model in Blender and then a 3D physical wooden model. The virtual model was then imported to Unity, where additional features and AI algorithms were applied. A user interface was also created for mobile applications. A GA, using A* to compute the fitness function, was also implemented and optimized to solve the TSP. The system described can have different applications, including training, trade shows, interactive displays in museums and tourist offices, monitoring of operations in real time for civil protection and military simulations, among others.
Future work includes creating holographic representations instead of physical representations of the terrain and other objects. Additionally, other entities should be added to the mode, namely people walking on the streets.


