1. Introduction
The design of advanced health-monitoring systems has always been a topic of active research. During the past decades, numerous portable devices have been introduced for the early detection and diagnosis of heart failure, since it is a common, costly, disabling, and deadly syndrome. Advanced heart-monitoring devices are capable of providing reliable, accurate heart monitoring and are able to detect sporadic events during periods of time when things would otherwise be unclear. Functioning as a black box, these devices have the potential to enhance the decision-making process, by notifying doctors when patients need readmission and in this way constituting an effective alternative capable of saving patients’ lives.
Various portable devices have been introduced by the industry (e.g., Wahoo Fitness (
https://www.wahoofitness.com), Polar H10 Heart Rate Sensor (
https://www.polar.com/en/products/accessories/H10_heart_rate_sensor), and Fitbit PurePulse (
https://www.fitbit.com/purepulse)) to monitor and record variations in the heart rate, rhythm, and other patterns of its operation, by detecting electrical impulses generated by the polarization and depolarization of cardiac tissue. Such devices rely on nearby smartphones that act as a gateway for transmitting the recorded sensor signals to cloud services, where appropriate signal processing, analysis, and classification algorithms are applied. The analyzed electrocardiogram (ECG) can be used in decision-support systems to assist physicians and cardiologists to evaluate irregular heart rhythm, potentially diagnose cardiac abnormalities, and predict critical clinical states [
1].
Existing portable heart monitoring devices are very inaccurate as a result of electromagnetic noise produced by the environment (e.g., mobile phones, electrical wires, appliances) or from the noise produced by the muscular movement of the human while wearing the device [
2,
3]. Moreover, depending on the accuracy of the ECG device, even a short recording may lead to a large volume of data, thus affecting the battery performance of the portable devices as well as that of the accompanying smartphone while storing and transmitting the recording wirelessly [
4,
5], thus limiting their diagnostic use to 24 h monitoring or even less [
6]. Finally, the concept of transmitting the sensor data to cloud services for processing and analysis creates a number of security issues that need to be addresses as they are directly related with the privacy of the users [
7,
8,
9]. Existing portable solutions are totally cloud-centric: all personal data collected are stored on the cloud and in most cases users no longer own the data they produce. This approach severely limits the ability of the user to maintain control of personal data. Now, more than ever, there is a need for privacy-preserving applications where users are always in control of their sensitive data [
8,
10].
The major challenge in the evolving landscape of wearable devices is to increase the accuracy of the biosignals collected [
2], broaden the capabilities for interpretation of data [
11], whilst at the same time improving the long-term operativity [
5] and guaranteeing the privacy of the users [
12]. With the advent of wearable-sensing technologies [
13] and smart textiles [
14,
15], the miniaturization of embedded systems and energy generators [
16], and the introduction of new communication protocols [
17] and access technologies [
18,
19,
20], the development of wearable devices that can provide accurate and precise measurements is becoming a realistic possibility.
The goal of this paper is to develop new, light-weight algorithms for the analysis and interpretation of ECG sensor data that can be executed in the embedded processor provided by a wearable device. The motivation here is to transfer data processing and analysis tasks to the edges of the network so that we can increase the longevity of the wearable devices by reducing energy requirements through reduced transmissions of large sensor data [
21,
22]. In this way, the wearable device becomes capable of analyzing and interpreting sensor-data traces to provide actionable alerts without any dependence on cloud services. Therefore, we evolve the current paradigm for developing wearable solutions from a totally cloud-centric one to a more distributed one. As a result, our approach also reinforces the privacy of confidential data by storing the user’s sensitive data within the private memory of the edge devices.
In this work, we present an end-to-end system that is suitable for execution within a resource-constrained wearable device. The system processes the ECG sensor data, automatically detects the heartbeats, and conducts an arrhythmia classification using a combination of supervised-learning approaches. The new algorithm presented uses a window-based feature definition to achieve high detection rates, which in some cases match the accuracy of the state-of-the-art algorithms.
We implement the system on a prototyping board that supports an asymmetric multicore embedded processor with one generic processing core and a dedicated core for hardware assisted pattern matching. The hardware assisted core enables the machine-learning algorithms to operate with much lower energy requirements. Examples of such asymmetric embedded processors are the Intel
® Curie
™ module [
23] and the NXP MPC8572E module [
24]. Given the real-world implementation, we evaluate the performance of the system of heartbeat classification in comparison with various existing approaches, in terms of achieved accuracy in the detection of abnormal events. We measure the correctness of the automatic classification according to
precision and
recall using as comparative measure the average between them, using a comprehensive ECG database following AAMI recommended practice [
25]. The results indicate that our approach is viable as regards both moving data processing and analysis into the wearable device, in terms of the accuracy achieved as well as regarding energy efficiency.
The rest of the paper is organized as follows. In
Section 2, we briefly present the physiological aspects of the operation of the heart and the arrhythmia classification problem, and we provide a limited number of related previous systems on automated heartbeat detection and arrhythmia classification. In
Section 3, we present the high-level architecture of the proposed system, along with the description of the main building blocks. We provide the details of the implementation of the heartbeat detection and arrhythmia classification using machine learning techniques in
Section 4. We show the results of the proposed system in comparison to previously published systems in
Section 5. Finally, we conclude in
Section 6, where we also list some future research directions.
2. Preliminaries and Previous Work
Electrocardiography monitoring is the dominant method of understanding variations in heart rate, heart rhythm, and other patterns of the heart’s electrical impulses. ECG records the electrical activity of the heart, by detecting electrical impulses generated by the polarization and depolarization of cardiac tissue. The impulses are then translated into a waveform, which eventually enables physicians or cardiologists to evaluate irregular heart rhythm, thus diagnosing cardiac abnormalities.
Arrhythmia literally means
without rhythm, but this word is used to denote any abnormal rhythm. In terms of heart activity, the term
arrhythmia refers to any change from the normal sequence of electrical impulses. In this sense, arrhythmias refer to a collection of conditions that are characterized by heart rhythms that do not follow a normal pattern. The electrical impulses may happen too fast (tachycardia), too slowly (bradycardia), too early (premature contraction), or irregularly (flutter or fibrillation), causing the heart to beat too fast, too slowly, too early, or irregularly [
26]. The ECG provides the most accurate means of identifying a cardiac arrhythmia. The arrhythmias can be classified into two major categories. The first category consists of arrhythmias formed by a single irregular heartbeat, herein called
morphological arrhythmia. The other category consists of arrhythmias formed by a set of irregular heartbeats, herein called
rhythmic arrhythmias [
1].
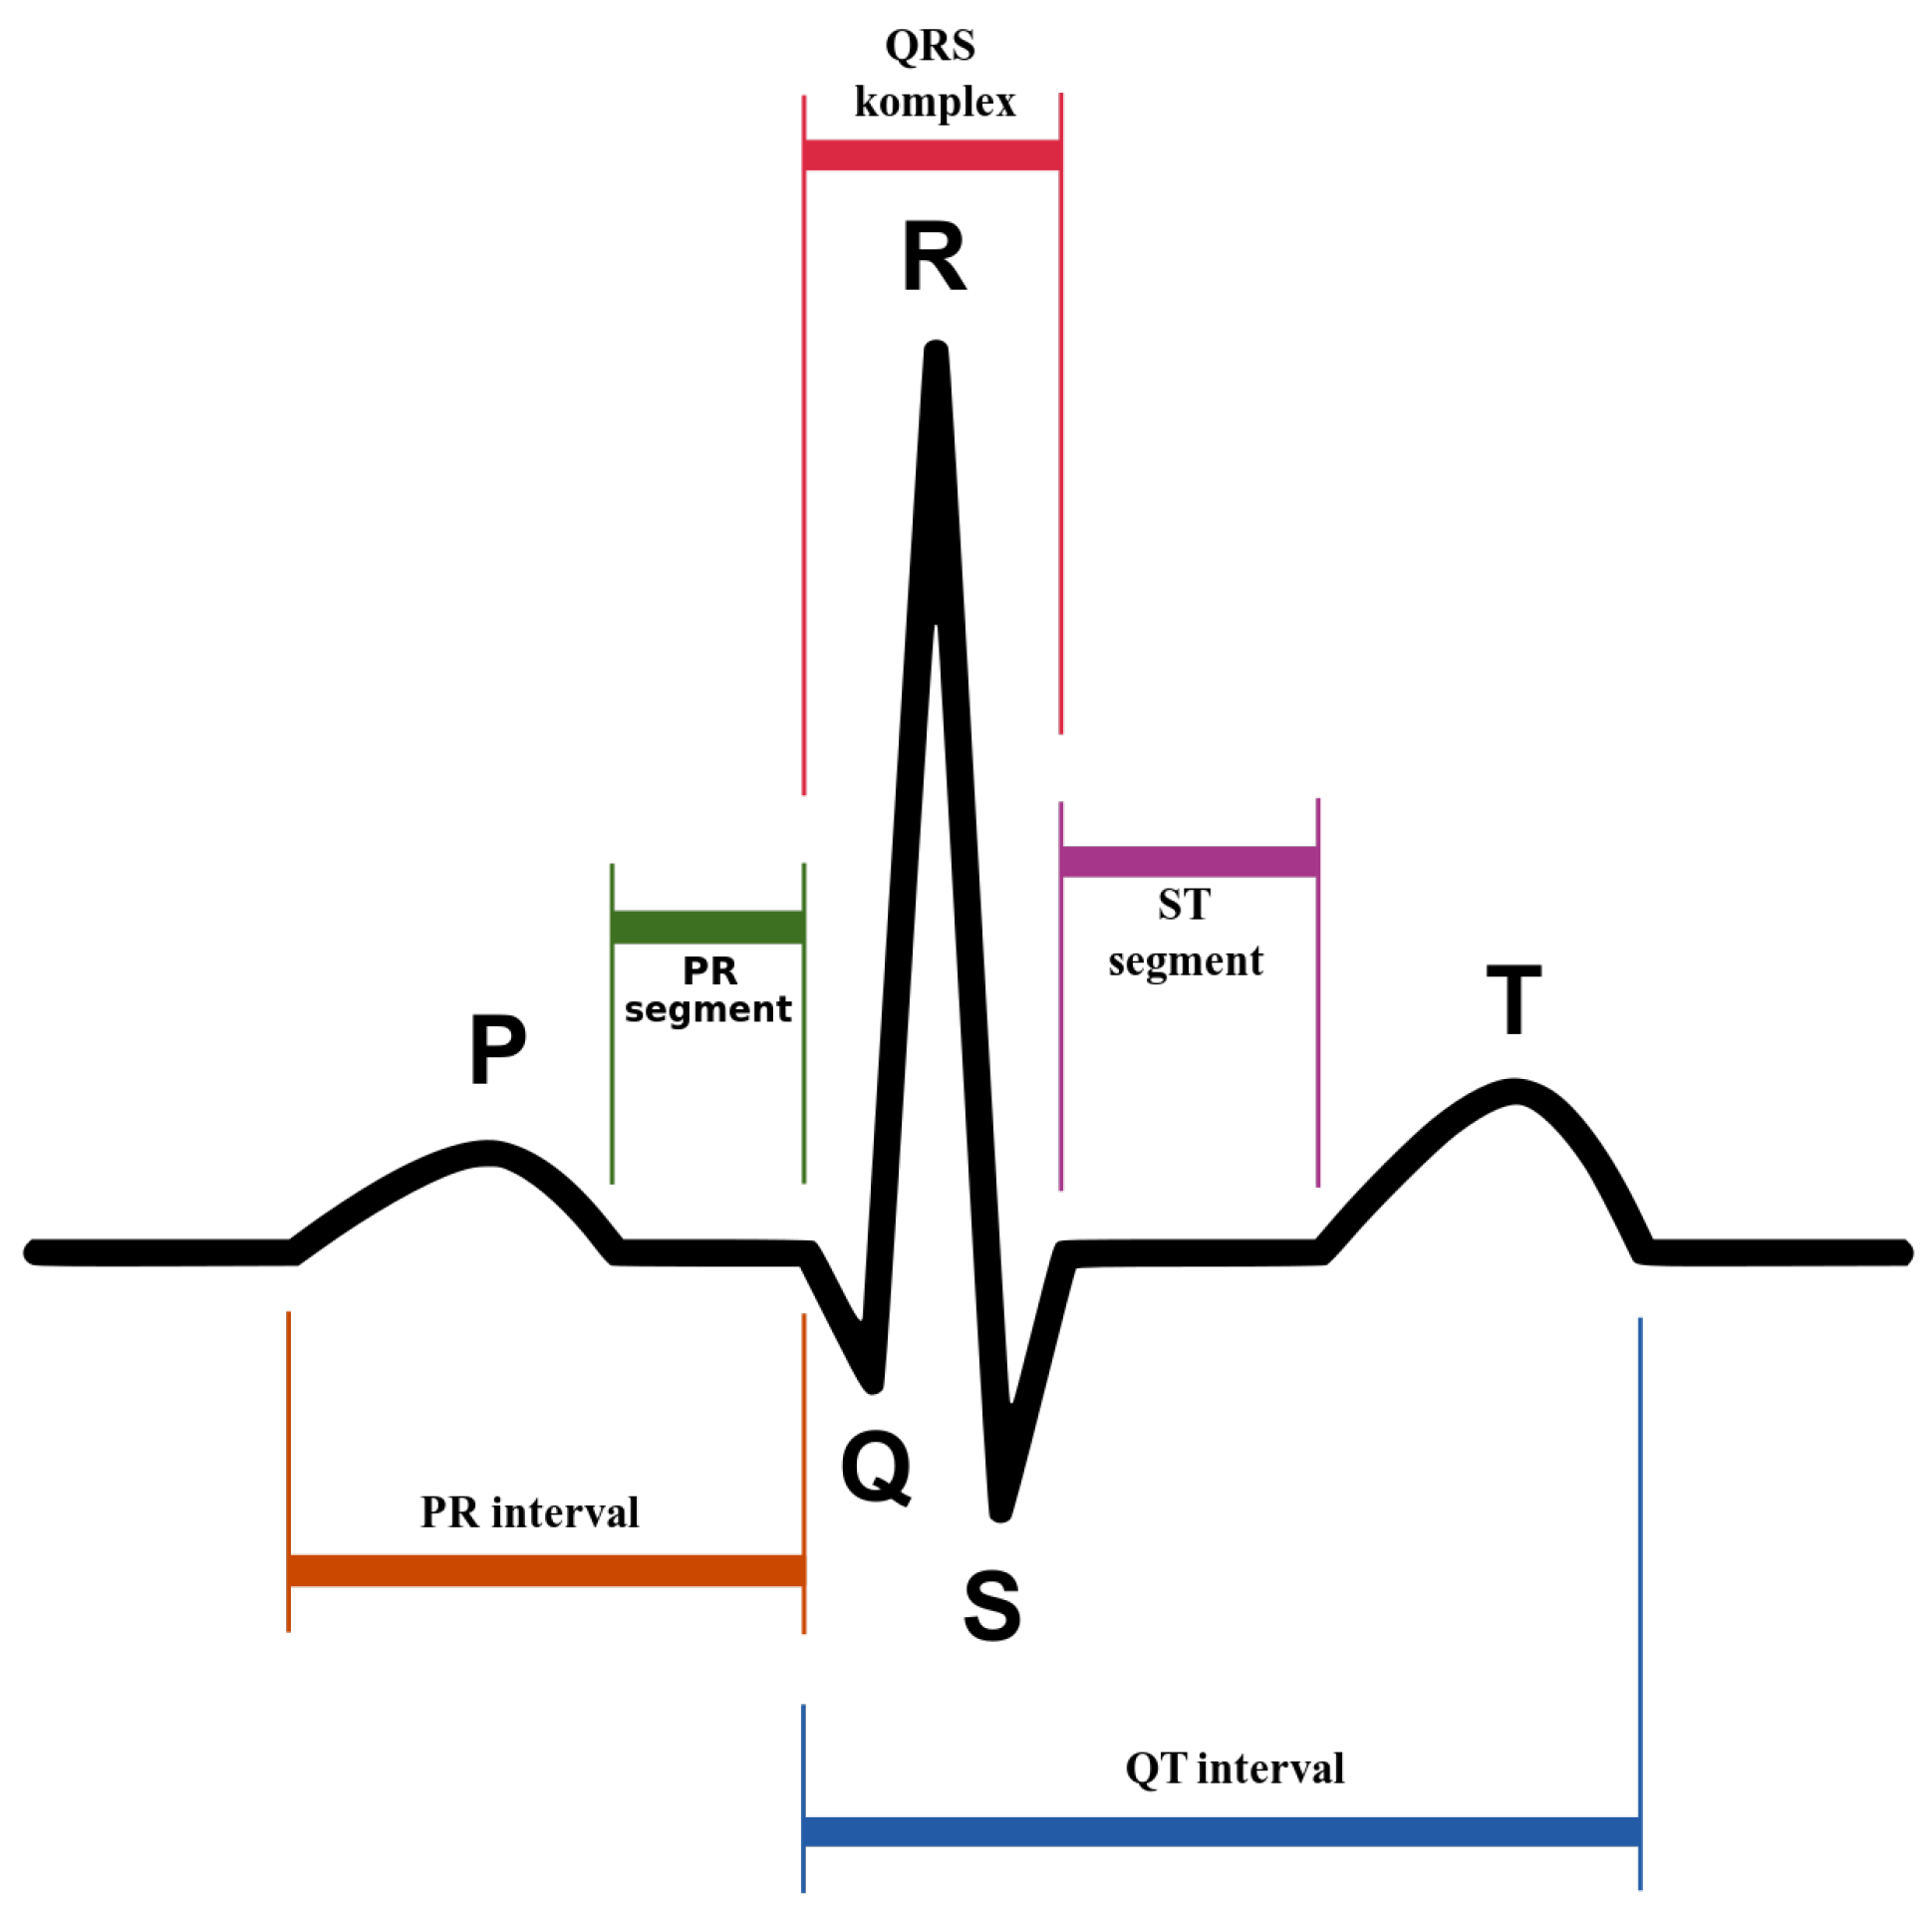
An ECG recording is analyzed based on the three
waves:
P,
, and
T, which occur in a sequential way.
Figure 1 provides a graphical representation of the
complex. The
P wave has small magnitude and represents the impulse of the two regions of the heart’s atria that transfers the blood from the veins. It is characterized by depolarization of the atrial muscles. The
complex that has high magnitude and spikes because of the rise in the conduction velocity, measures the depolarization of the ventricles. Lastly, the repolarization and revitalization of the ventricles takes place during the
T wave. The assessment of cardiac function is linked with the detection of significant fiducial points of a heartbeat: the
P wave, the
complex, and the
T wave. Moreover, the recognition of the onset and offset points of the
P wave, the onset and offsets point of
complex, and the onset and offset point of the
T wave of a
complex is diagnostically relevant. Furthermore, the wave recognition points serve also as references for all amplitude measurements, for example, the distances between fiducial points of a heartbeat such as the
P wave, the
interval, the
width, the
interval, the amplitude of
P, the amplitude of
,
level, and the amplitude of
T.
The design of algorithms for the analysis of heart arrhythmias based on ECG recordings has been studied for many years [
1]. All such algorithms rely on the analysis of the
complex. The most prominent in terms of amplitude is the
wave and is therefore the easiest to detect. Hence, the heartbeat detection problem is equivalent to the
detection. The
-detection problem, on its standard formulation, takes as input an ECG sample and computes whether it resides in a
wave. It is necessary at this point to clarify that the
detection is complicated mainly because of the different kinds of noise present in the ECG signal and not only because of the pysiological variability of the
complexes. The aforementioned noise sources include muscle noise, wave variations caused by slight translocation of electrodes, power-line interference, baseline wander, and
T waves with high-frequency characteristics similar to
complexes. Therefore,
detection methods typically apply appropriate digital signal processing algorithms to raw signals to reduce noise and amplify the signal. One of the earliest and most established algorithms introduced by Pan and Tompkins [
27] identifies the
complexes based upon digital analysis of the slope, the amplitude, and the width of the ECG data. The algorithm periodically adjusts the thresholds and the parameters used to detect changes in the
morphology and heart rate. For this reason, this approach is also known as the
adaptive-thresholds approach. Another method is the
dual-slope detection, which calculates the slopes on both sides of the complex. The algorithm presented by Wang et al. [
28] uses low computational complexity techniques to calculate the steepness, the shape, and the height of the signal to locate each
complex. Yet another approach relies on the use of the
wavelet transform [
29,
30]. The wavelet transform decomposes a time-variant signal into components appearing at
various scales (or resolutions). The components in each scale represent the signal temporal features, on the basis of their frequency contents. In contrast to the previous techniques, which require prior knowledge about the frequency spectrum, the
multistage multiscale mathematical morphology filtering used by Zhang et al. [
31] allows for the detection of the various components of the
complex by suppressing the impulsive noise and uses the multi-frame differential modulus accumulation to remove the baseline drift and to enhance the signal.
There exist many algorithms for computerized detection of abnormal heart activity which are based on the interpretation of ECG recordings. However, Shah et al. [
32] report that they are very inaccurate. This explains why it is necessary for the diagnosis to be performed by medical specialists and physicians. Very recently, Saini et al. [
33] investigated the use of machine-learning techniques to reduce the errors in the computerized electrocardiogram interpretation of the cardiac rhythm. An application of the
k-Nearest Neighbor (KNN) algorithm as a classifier for the detection of the
-complex in ECG produced very high detection rates. Pławiak [
34] developed an evolutionary neural system which makes the efficient classification of cardiac disorders possible. The best results were observed with the use of an evolutionary neural system, which was based on the SVM classifier and obtained a recognition sensitivity at a level of
. The same author also developed revolutionarily effective ensembles of classifiers for the automatic recognition of myocardium dysfunctions based on ECG signals [
35]. The best genetic ensemble of classifiers optimized by sets obtained a recognition sensitivity of 17 myocardium dysfunctions at a level of
, which is the best result achieved to date against the background of the current scientific literature. Yıldırım et al. [
36] proposed another deep-learning approach for the detection of cardiac arrhythmia, which is based on a one-dimensional convolutional neural-network model. The proposed method is simple, efficient, and fast (it allows for real-time classification), thus making it very practical. More recently, Rajpurkar et al. [
37] applied a 34-layer convolutional neural network, which maps a sequence of ECG samples to a sequence of rhythm classes. They make a comparison between the performance of the deep-learning network and that of certified cardiologists in detecting a wide range of heart arrhythmias from electrocardiograms recorded with a wearable monitor. Interestingly, their system outperforms the average cardiologist performance in both recall (sensitivity) and precision (positive predictive value).
The design of portable health-monitoring devices has closely followed the electronics miniaturization evolution over the years [
38]. Wearable monitoring devices that are able to provide accurate and precise measurements are gaining support from physicians and healthcare units. Existing solutions
lack computational power to locally process the ECG recordings and to detect abnormal behavior. With the use of such devices, the recorded signal is transmitted to a nearby gateway device, which in turn relays the recording over to the cloud, where advanced analysis algorithms are executed [
4,
39]. Given the nature of the heart activity, the large majority of the trace periods correspond to normal heart activity. Therefore, in most cases, large amounts of data transmitted over the network infrastructure and processed at the cloud level are simply dropped, leading to a significant waste, not only of the battery resources of the wearable device, but also of network and cloud resources [
40,
41]. It is evident that minimal possible latency, network bandwidth preservation, and efficient data-storage resource utilization are elements of paramount importance for any IoT-related application [
42,
43].
The design of efficient health-monitoring systems that are capable of locally processing the ECG recordings has been a topic of active research over the last few years. Most researchers have tried to merge wireless sensor networks with smart gateways [
44,
45], while others have proposed the use of smartphones as gateways for developing personal health monitoring systems [
4,
46]. More recently, researchers have developed specialized diagnosis techniques for specific types of health-monitoring applications [
47] and platforms that use dedicated IoT communication protocols [
48]. However, all the aforementioned solutions somehow fail to harness the full extent of capabilities that fog computing offers towards providing a holistic solution that will be applicable to a larger number of cases, involving multiple actors.
3. System Design
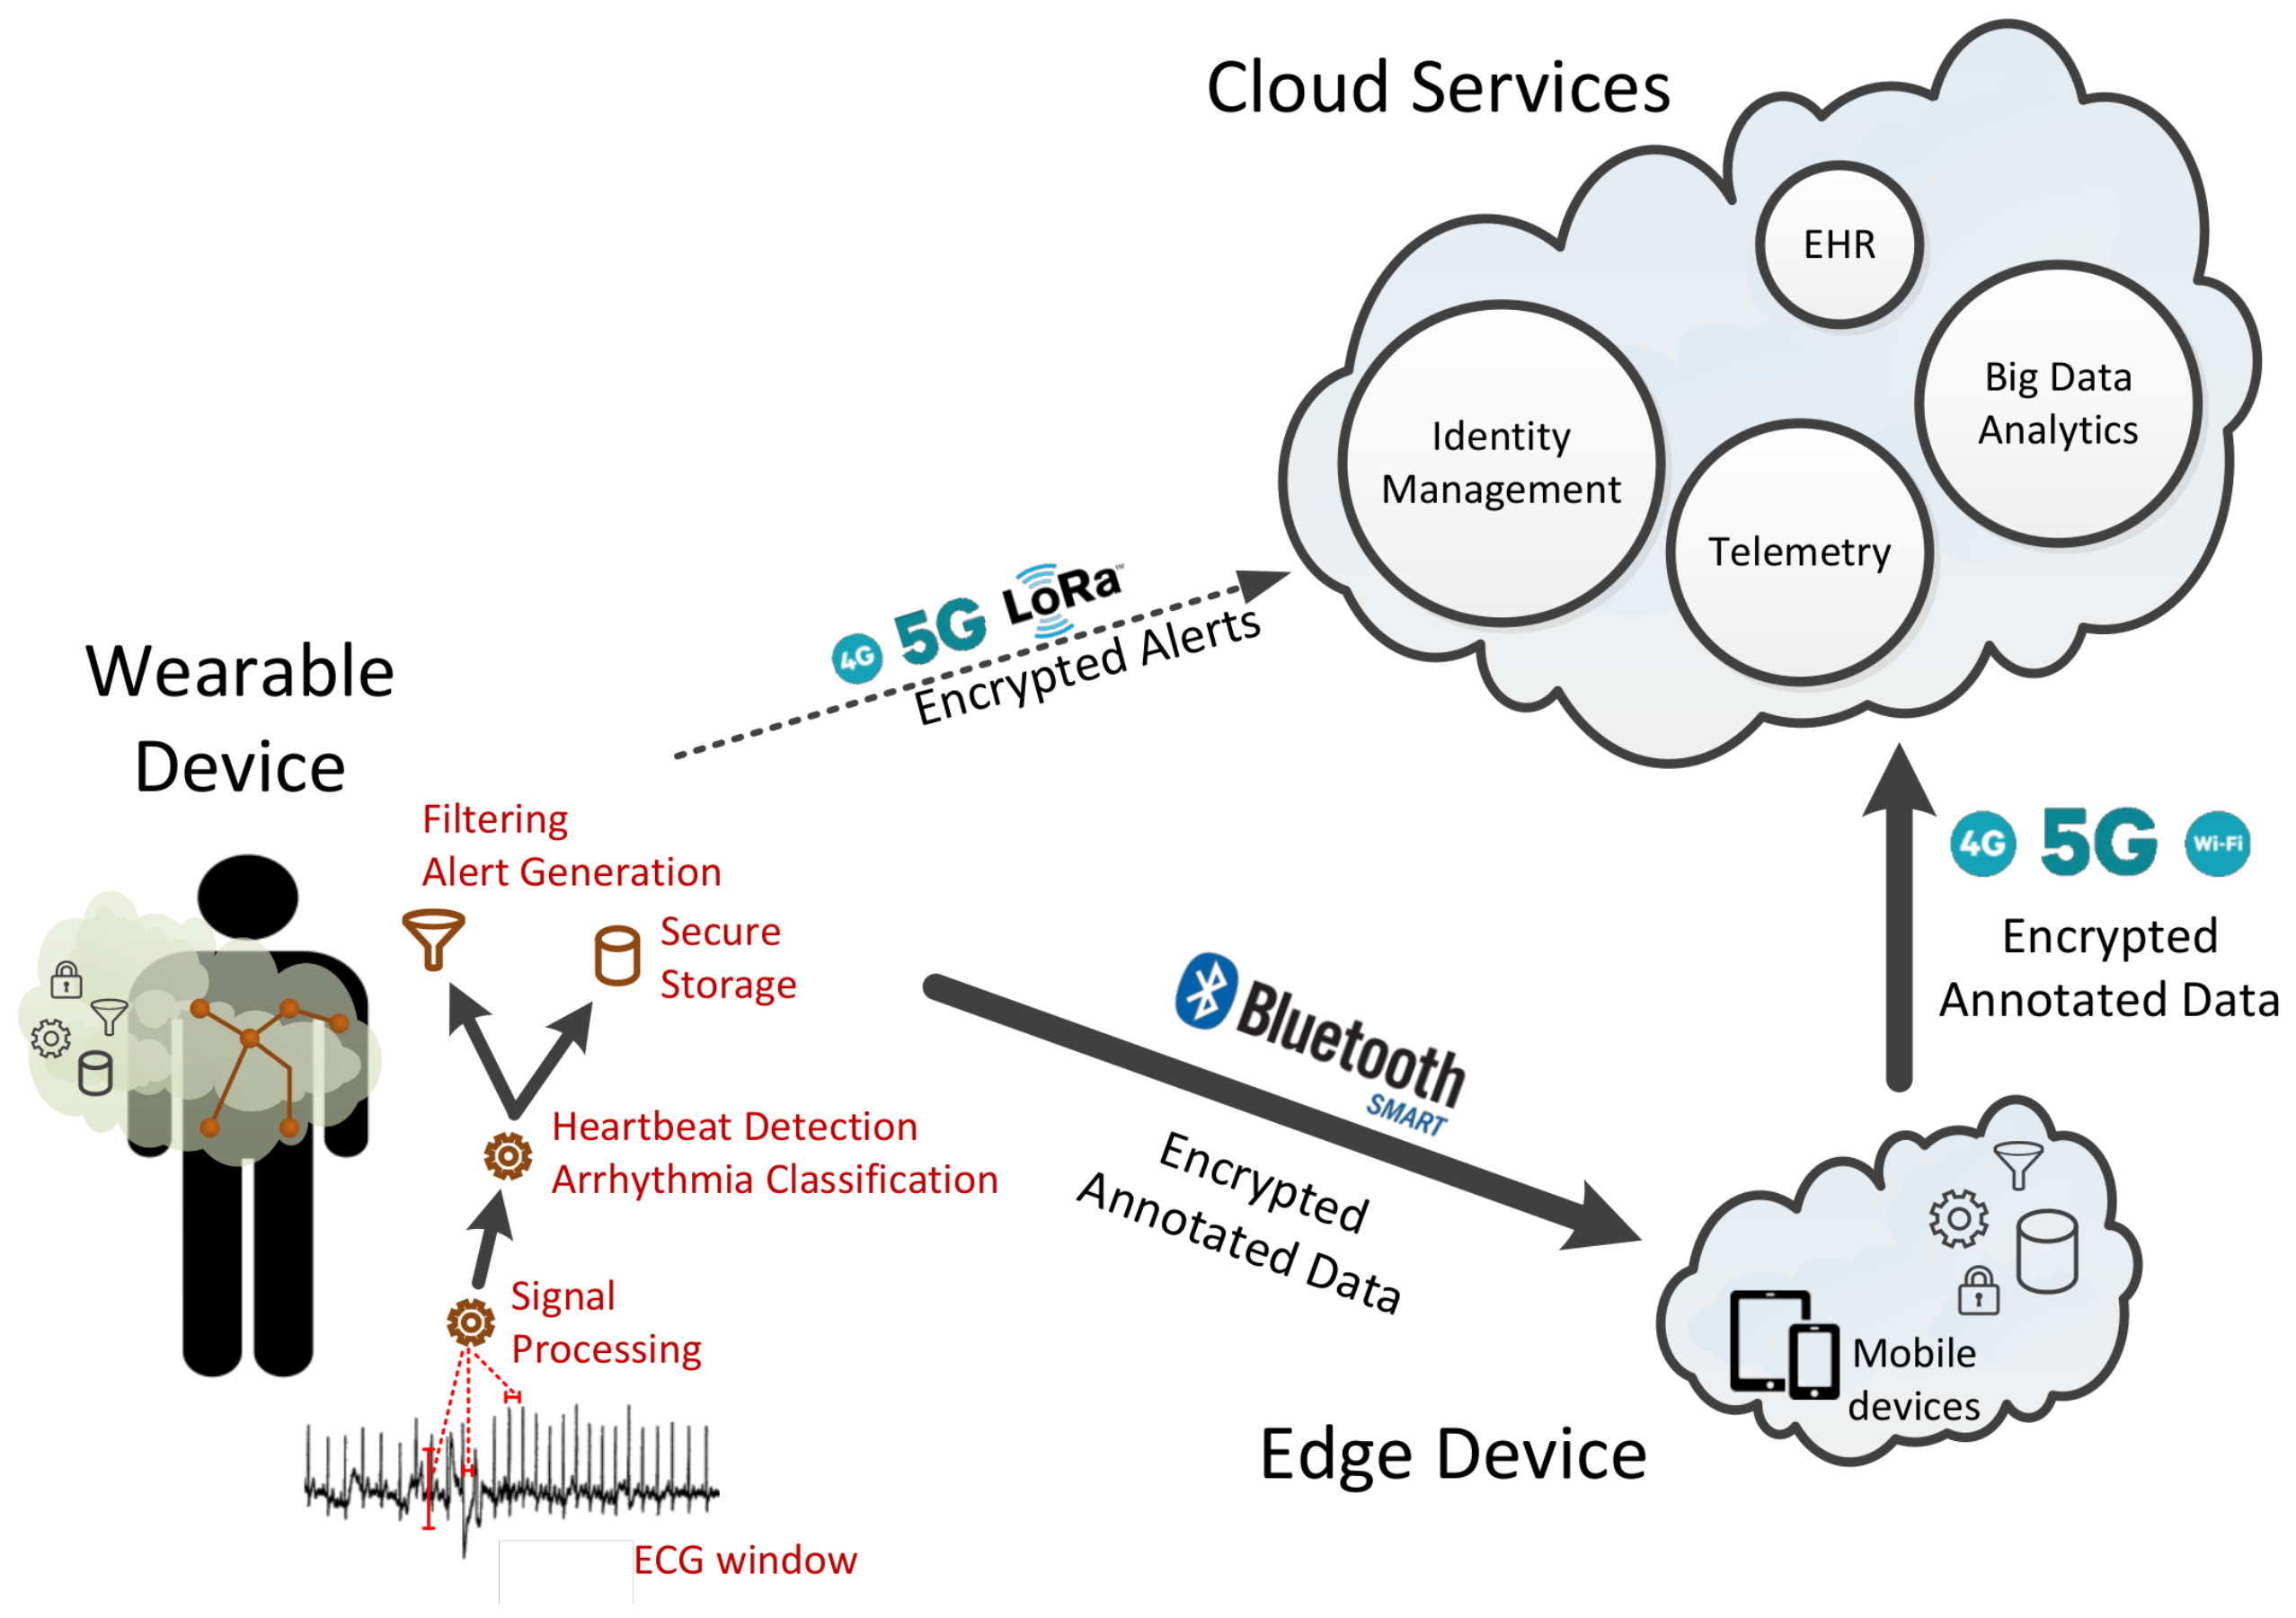
We organize the components of the end-to-end system based on the fog-computing approach in three layers given their functionality and their physical proximity to the user. In particular, we have (1) the wearable device that is always connected to the user, (2) the edge device that is located within the house premises of the user, and (3) the cloud services.
Figure 2 provides a graphical representation of the three layers and the corresponding components as well as their interaction using different communication technologies such as WIFI, bluetooth low-energy (BLE) wireless connection, and LORA.
The wearable device is comprised of several hardware components such as the ECG sensors, the asymmetric multicore processor, the memory unit, the network interface, the battery and possible power nano-generator. In this work, the software is responsible for (1) collecting the ECG data from the analog-to-digital converter (ADC) based on a given sampling rate, (2) processing of the signal received from the ADC to reduce the noise and amplify the signal, and (3) detecting the heartbeats and classification of arrhythmias using hardware-assisted machine learning techniques. Other aspects of the software firmware such as the encryption, storage, and retrieval of ECG recorded sessions and ECG metadata, as well as the communication with the edge devices and the cloud platform, are not within the scope of this paper.
The edge-device software is installed on the patient’s device (either a smartphone/tablet or a fixed device; for instance, a computer in the patient’s home) and is connected to both the wearable device and the cloud services. The edge device communicates with the wearable device over a well defined API via a secure bluetooth low-energy wireless connection. It has internal storage space for storing the data collected from the ECG sensor and is capable of processing them, allowing for additional (and, typically, more elaborate) computation to that performed in the wearable device. It can also generate alerts, sent to the user either in small packages or in batch mode. As with the wearable device, data stored within the edge device are cryptographically encrypted, and message exchanges across the different layers are always performed in a secure and encrypted manner.
Finally, the cloud services offer all the necessary features to facilitate authentication, authorization, access control, asynchronous notifications, data integration with electronic health records, and other services relying on privacy-preserving data integration.
In this work, we focus on the software executed on the wearable device, and specifically on the processing and analysis of the data collected from the ECG sensors that are conducted either within the wearable or with the edge device. The processing and analysis of the ECG data is based on three modules:
Signal-processing module —The first module is responsible for processing the signals collected from each ECG sensor lead to reduce the noise and amplify the signal (see
Section 2). The goal is to have a well extracted ECG morphology, with as little information loss as possible. The module produces
ECG records composed of a number
n of
channels, each channel corresponding to a recording received from a specific ECG sensor lead, therefore composing an
n-dimensional vector. The elements of the channels represent the amplitude of the signal at any given time, these are called
samples. This module is executed within the wearable device.
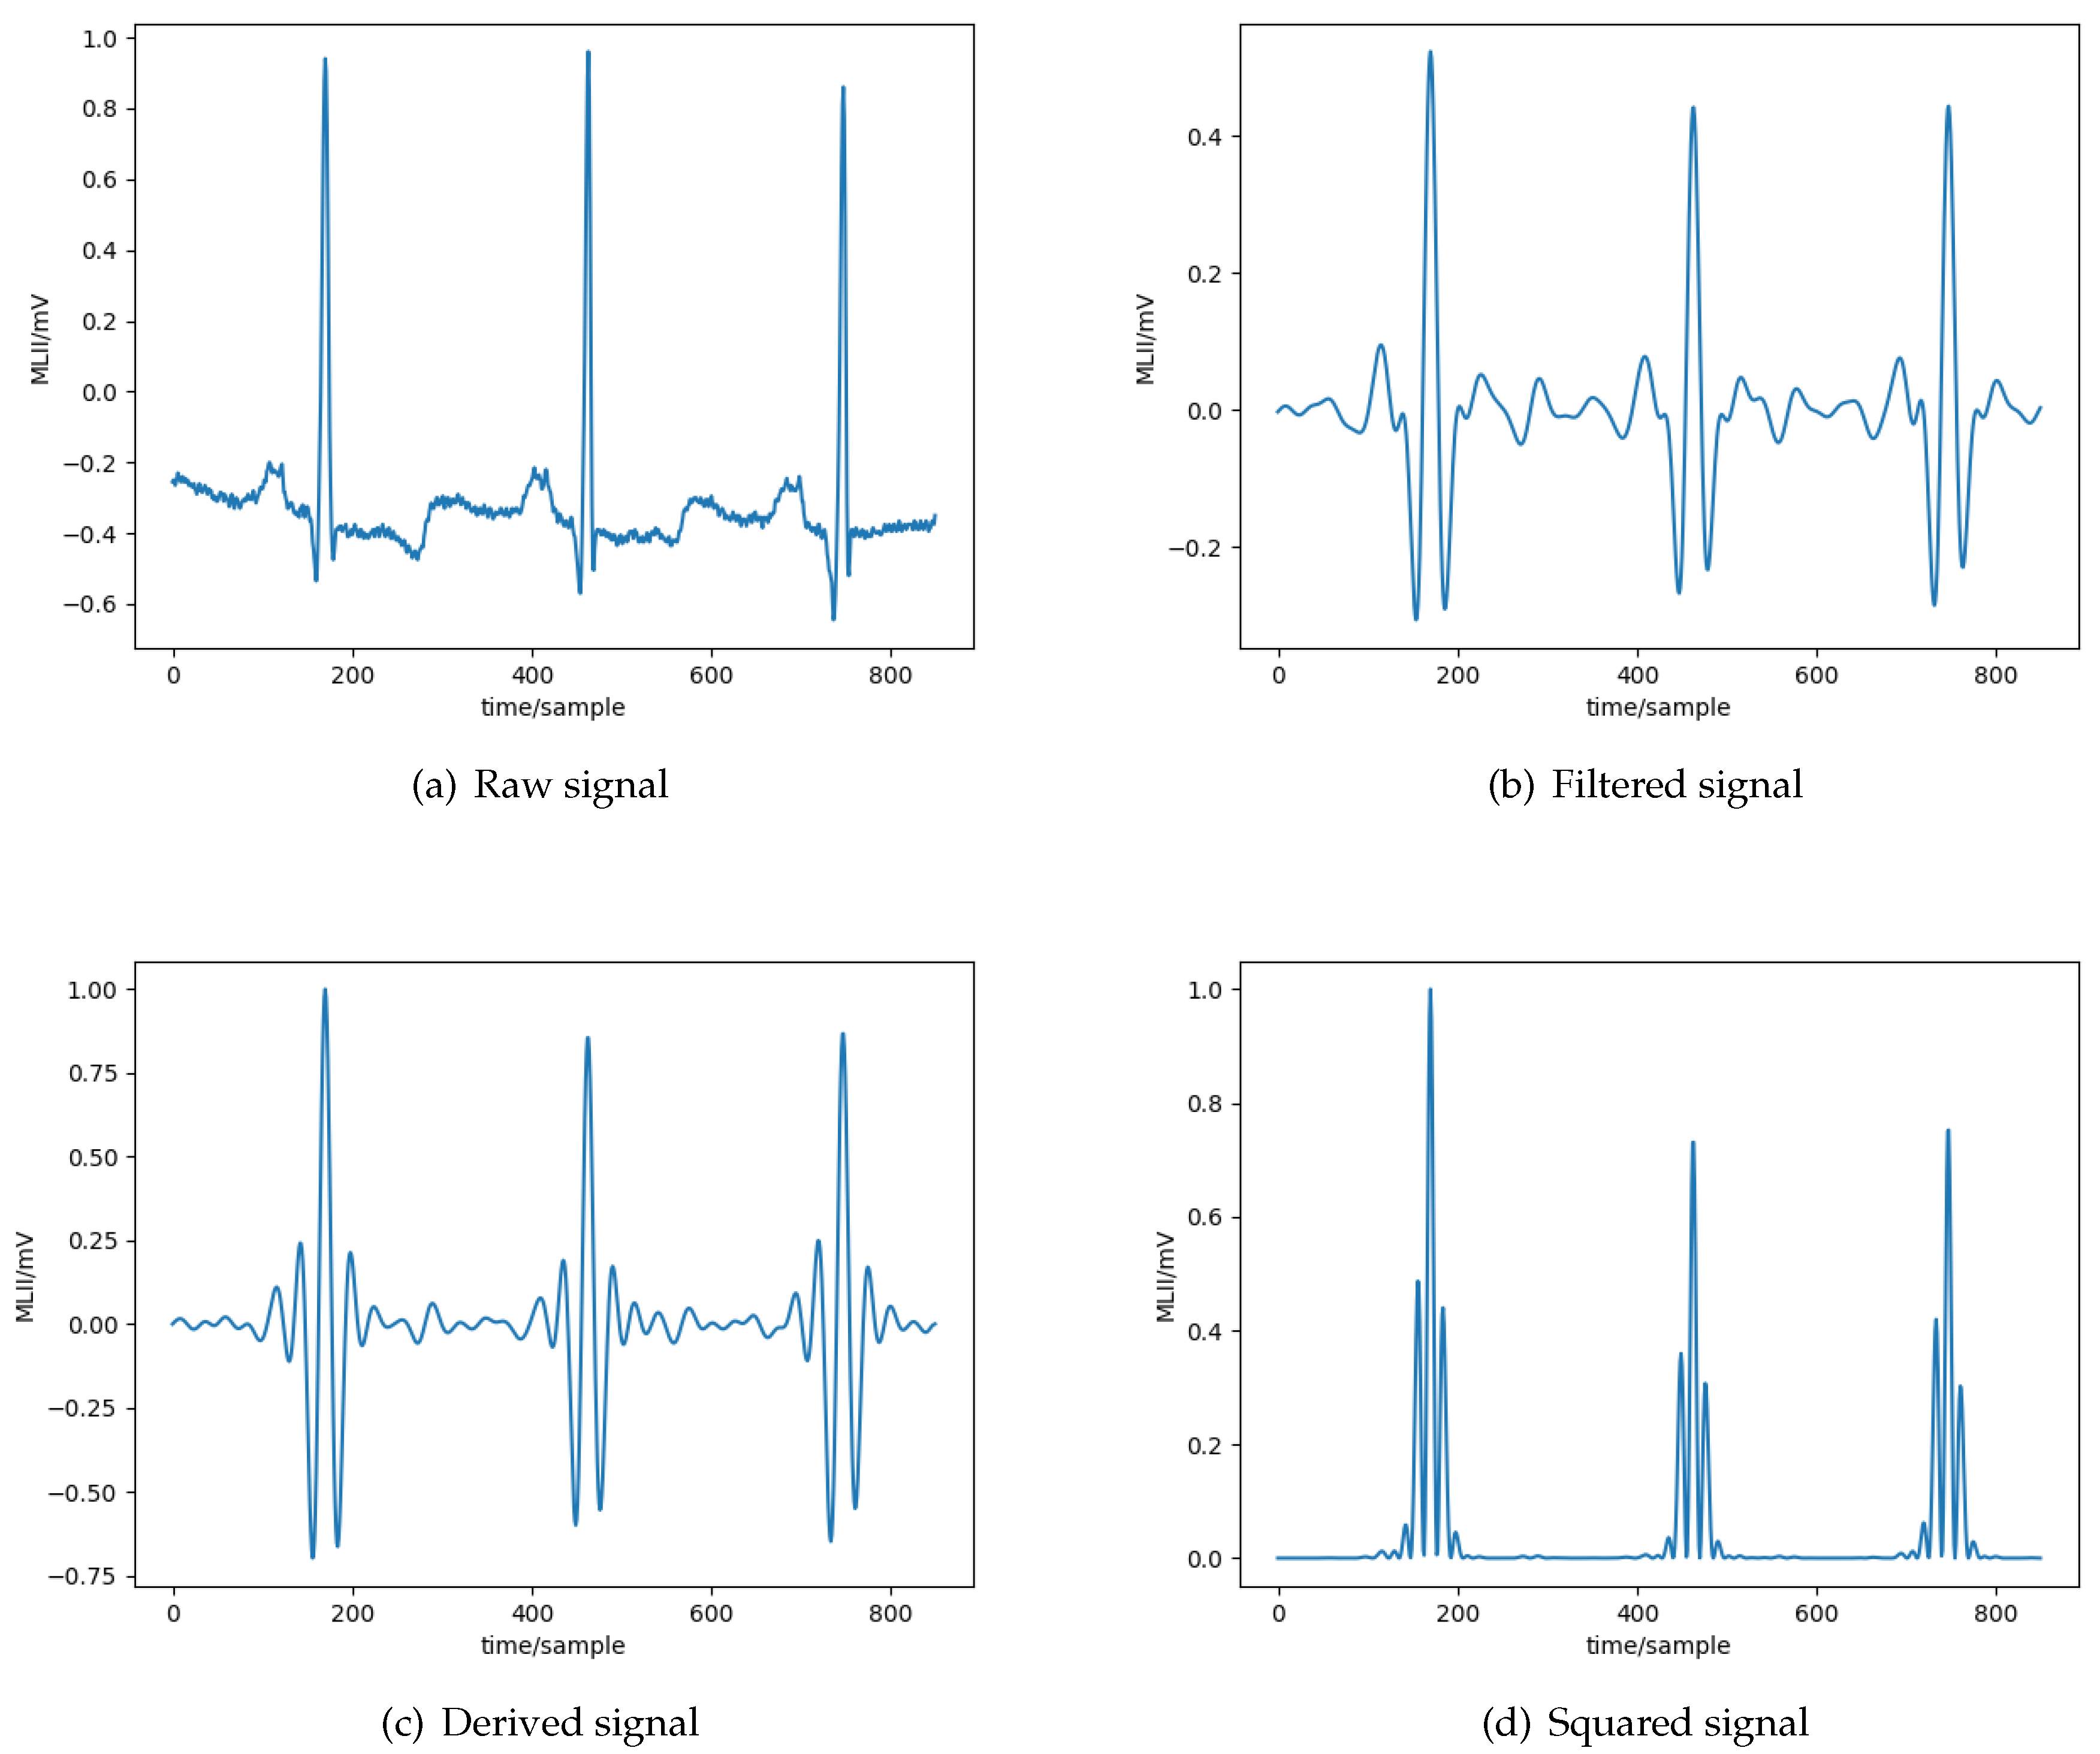
More specifically, all the signals initially pass through a
bandpass filter to reduce the influence of muscle noise, 60 Hz interference, baseline wander, and
T-wave interference. The desirable passband to maximize the
energy is approximately 5–15 Hz [
27]. It is implemented with a cascade of low-pass and high-pass filters to achieve a 3 dB passband from about 5–12 Hz, reasonably close to the desirable passband. Subsequently, a
derivative filter processes the output to provide the
complex slope information. After differentiation, the signal is squared point by point, based on the formula:
. This transformation makes all data points non-negative and performs a nonlinear amplification of the output of the derivative, emphasizing the higher frequencies, in our case the ECG frequencies and the QRS complex in particular. The result of the preprocessing stage for each step are depicted in
Figure 3.
Heartbeat-detection module—The second stage of the arrhythmia-detection system consists in extracting the heartbeats from the ECG samples produced by the previous module. The ECG samples retrieved are segmented in contiguous regions of fixed duration (see
Section 4 for more details on the length of the regions). Given this transformation, each segment is examined to identify if it contains a
complex. Given a
complex, the
R peak location is then detected from such regions using the formula:
. In words, the location of the
R peak is the one corresponding to the maximum absolute value in the region detected as a
complex. This is because, given that a time segment has been detected as a
wave, it is very likely that, in such a small portion of the signal, the
R peak is located at the point of maximum amplitude. The output of the module is a sequence of locations of
R peaks.
The identification of the
complexes is implemented based on the KNN algorithm, as it can be executed at hardware level in one of the recently introduced asymmetric multicore embedded processors that provide a dedicated core for hardware assisted pattern matching (e.g., the NXP MPC8572E module [
24] and the Intel
® Curie
™ module [
23]). The KNN implementation supported by the hardware is based on a simple majority voting to identify the label that will be associated to a given value. Note that the use of the KNN algorithm in this module is different from the one used by Saini et al. [
33], as the latter does not use a window but examines each ECG sample individually. It is also different from the one used by Akrivopoulos et al. [
49], in which the KNN algorithm is used to characterize whether the
complex is normal or abnormal. The design aspects and the technical details of the heartbeat detection module are presented in more details in
Section 4.
Arrhythmia classification module—The third module conducts the final stage of arrhythmia classification. The module examines the R peaks detected by the previous module, identifies the signal around an R peak location, and extracts the corresponding region from the raw signal. In this way, the sequence of R peaks is transformed into a tridimensional stream of the form: where b is the total number of detected beats, d is the number of previous beats to consider so as to make a prediction, and s is the raw signal that makes up the specific beat. Essentially, we generate a sliding window over the sequence of beats, of length equal to t beats.
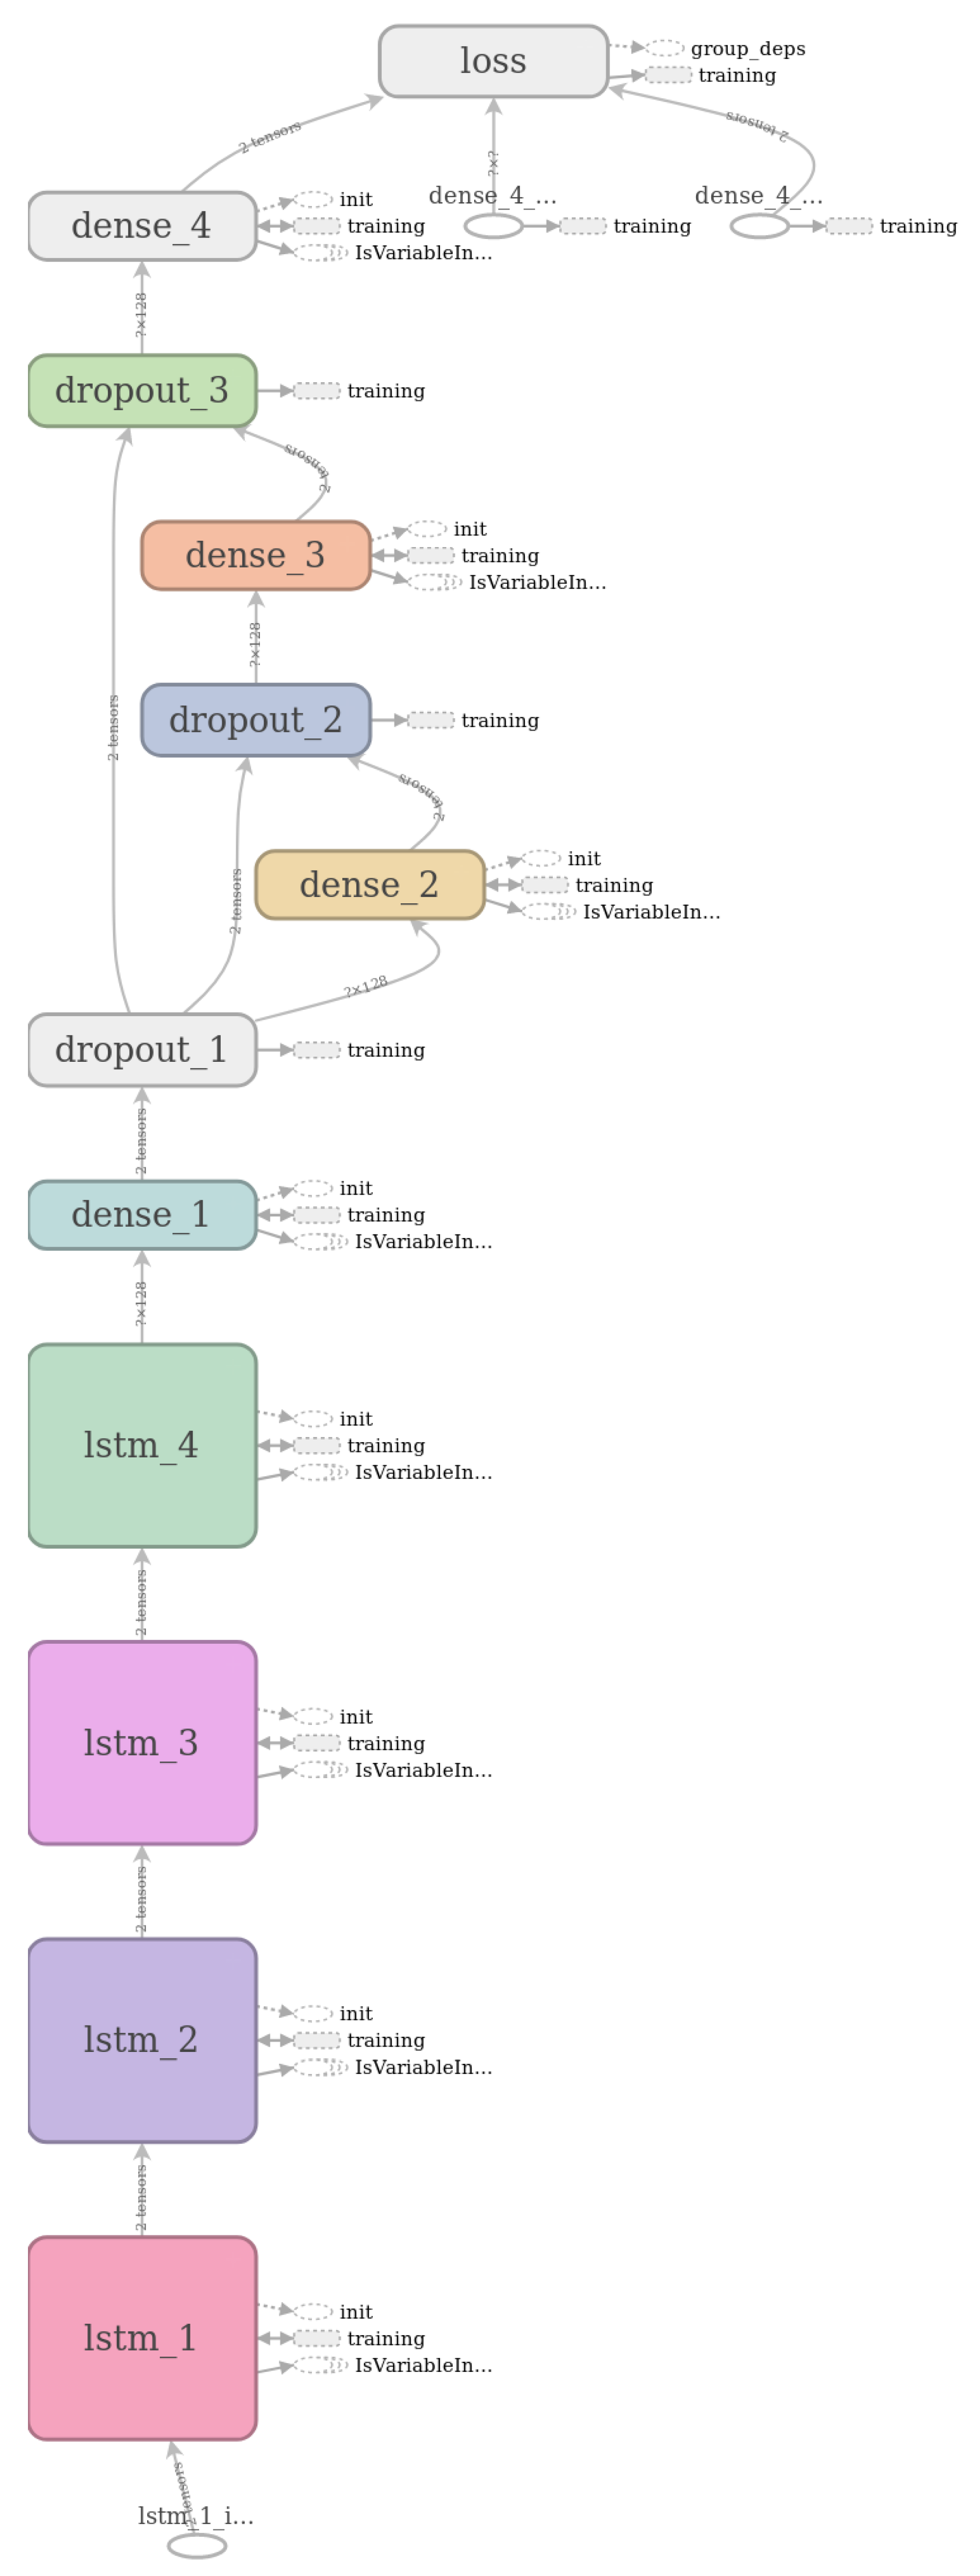
Given that the ECG data are sequential and that determining whether a heartbeat is arrhythmic or not depends not only on its morphology but also on those of the previous beats, we designed a particular kind of recurrent neural network (RNN) for the arrhythmia classification purpose, based on long–short term memory (LSTM) units [
50]. LSTM-based architectures are very powerful for applications on time-series data, we therefore use them for our problem. The transformed sequence is passed to the neural-network classifier, which has been designed and trained in order to identify normal and arrhythmic beats. The detected arrhythmic beats are then classified in more fine-grained classes, defined by a well-known standard for cardiac algorithm evaluation [
25]. The methodology for training and validating the RNN is presented in more details in
Section 4.
4. Implementation Details
In this section, we present in detail the machine-learning techniques used for the
heartbeat-detection and the
arrhythmia-classification modules. The preliminary analysis of the dataset for the fine tuning of the modules and the training of the classifiers was conducted on a workstation using an Intel i5 processor with 8 GB of RAM, under a generic linux kernel v4.4.0-130. The initial models were developed using Python version 3.5.2 in combination with scikit-learn (
https://scikit-learn.org/stable/) library v0.18.1 and keras
https://keras.io/) library v1.2.2. For the evaluation of the performance using a hardware-assisted core, an Arduino/Genuino 101 development board
https://store.arduino.cc/genuino-101) was used using the Intel
® Curie
™ ODK Z tree firmware (
https://github.com/01org/CODK-Z).
4.1. ECG Data
The database considered in this study is a collection of annotated ECG recordings obtained by the Arrhythmia Laboratory of Boston’s Beth Israel Hospital, known as the
MIT-BIH Arrhythmia Database [
51]. We now provide some details on how this dataset was created as reported in Reference [
51]. First, the creators of the dataset selected 48 half-hour excerpts of two channels (24 h of signal in total) of ECG recordings from 47 subjects: out of which 22 are women aged 23–89 years and the remaining 25 are men aged 32–89 years. The electrodes were placed on the chest as is standard practice for ambulatory ECG recording. The recordings were digitized at 360 samples per second per channel with 11-bit resolution over a 10 mV range. The samples include two leads—the modified limb lead-II and one of the modified leads
,
,
, or
with a resolution of 5 l V/bit. On the basis of these recordings, a total of 25 traces were selected such that they include arrhythmic cardiac activity. Out of these, four also include paced beats, meaning that they were produced by a pacemaker. Finally, following a random selection process, an additional 23 samples were chosen. Each of these samples corresponds to a 2D vector of 650 K entries. The vector is composed of two channels, therefore it is two dimensional.
After the creation of the recordings, a simple slope-sensitive
detector was used to automatically annotate the recordings. Then, two cardiologists were consulted independently to correct the resulting annotations, as well as provide corrections and additions regarding the classification of the cardia rhythm and the signal quality. The two new sets of annotations were compared to identify discrepancies between the opinions of the two physiologists and generate a unifying version. In Reference [
51], it is reported that from 48 recordings, within six of them, for a total of 33 heartbeats, the two physiologists could reach an agreement on the classification. Moreover, it is reported that a total of seven episodes of loss of signal or noise that was so severe in both channels simultaneously, that
complexes could not be detected; these episodes were all quite short and have a total duration of about 10 s. In all of the remaining data, every
complex was annotated, numbering about
in total.
According to the Association for the Advancement of Medical Instrumentation (AAMI) standard [
25] for testing and reporting performance results of cardiac rhythm and segment measurement algorithms, the evaluation of an arrhythmia detector algorithm should be made on the classification performance on five major categories of heartbeats:
N includes beats originating in the sinus node (normal and bundle branch block beat types);
S includes supraventricular ectopic beats (SVEBs);
V includes ventricular ectopic beats (VEBs);
F includes beats that result from fusing normal and VEBs;
Q includes any heartbeat not in the N, S, V, or F categories, essentially the undefined heartbeats as well as beats resulting from the use of a pacemaker.
Note that the last category includes beats that are a result of a pacemaker operating under the skin of the patient. These beats are regulated and it is not meaningful to use them for arrhythmia classification. As stated above, the MIT-BIH database includes four patients who are using a pacemaker. For this reason, these four patients were excluded from our study. In this way, the resulting Q category includes only 33 beats. Because of the lack of data, we excluded all these beats from our study. Please also note that this is a common practice in other state-of-the-art studies; see, for example, the work of Park et al. [
52]. Therefore, we are left with four beat categories.
Each of these four categories contains more fine-grained types of arrhythmic beats.
Table 1 lists the complete definitions for each of the four categories.
Please note that the ECG records for patients 102, 104, 107, 217 have been excluded from this study because these recordings do not contain any arrhythmic beats.
4.2. Heartbeat-Detection Module
The KNN classifier used by the
heartbeat-detection module is based on a
feature matrix, comprised of
m segments of ECG signals retrieved from
n sensor leads (i.e., channels). Each segment
s used to train the classifier is labeled based on the annotations provided by the physicians:
Because of to the unique characteristics of each individual person, the ECG signals produced by each heart are unique. For this reason, the training step is performed with an intra-patient perspective: a separated classification instance is used for each patient. Each KNN classifier is trained using an ECG segment of t seconds and a five-fold cross-validation is employed to avoid overfitting on the training set. In the five-fold cross-validation, the original training set is randomly partitioned into five equally sized subsamples. Of the five subsamples, a single subsample is retained as the validation data for testing the model, and the remaining four subsamples are used as training data. The cross-validation process is then repeated five times, with each of the five subsamples being used exactly once as the validation data. The five results are then averaged to produce a single estimation.
To fine-tune the performance of the module, we evaluated the performance using standard statistical indices to determine the precision and recall derived from three parameters: correctly detected peaks (
), total detected peaks (
), and actual number of peaks (
).
Note that the annotations of the
R peak locations in the database were not placed precisely on the maximum of the
complex by the annotators. More precisely, in some cases, the
R peak is not properly annotated, although it is guaranteed to be inside the
complex. For this reason, we consider a peak detection correct if it resides inside a range of
s around the actual peak annotation. We chose such an amount of sample such as to be comparable to the average
width (for details, refer to the book of Walraven [
53], Chapter 2, Section 41).
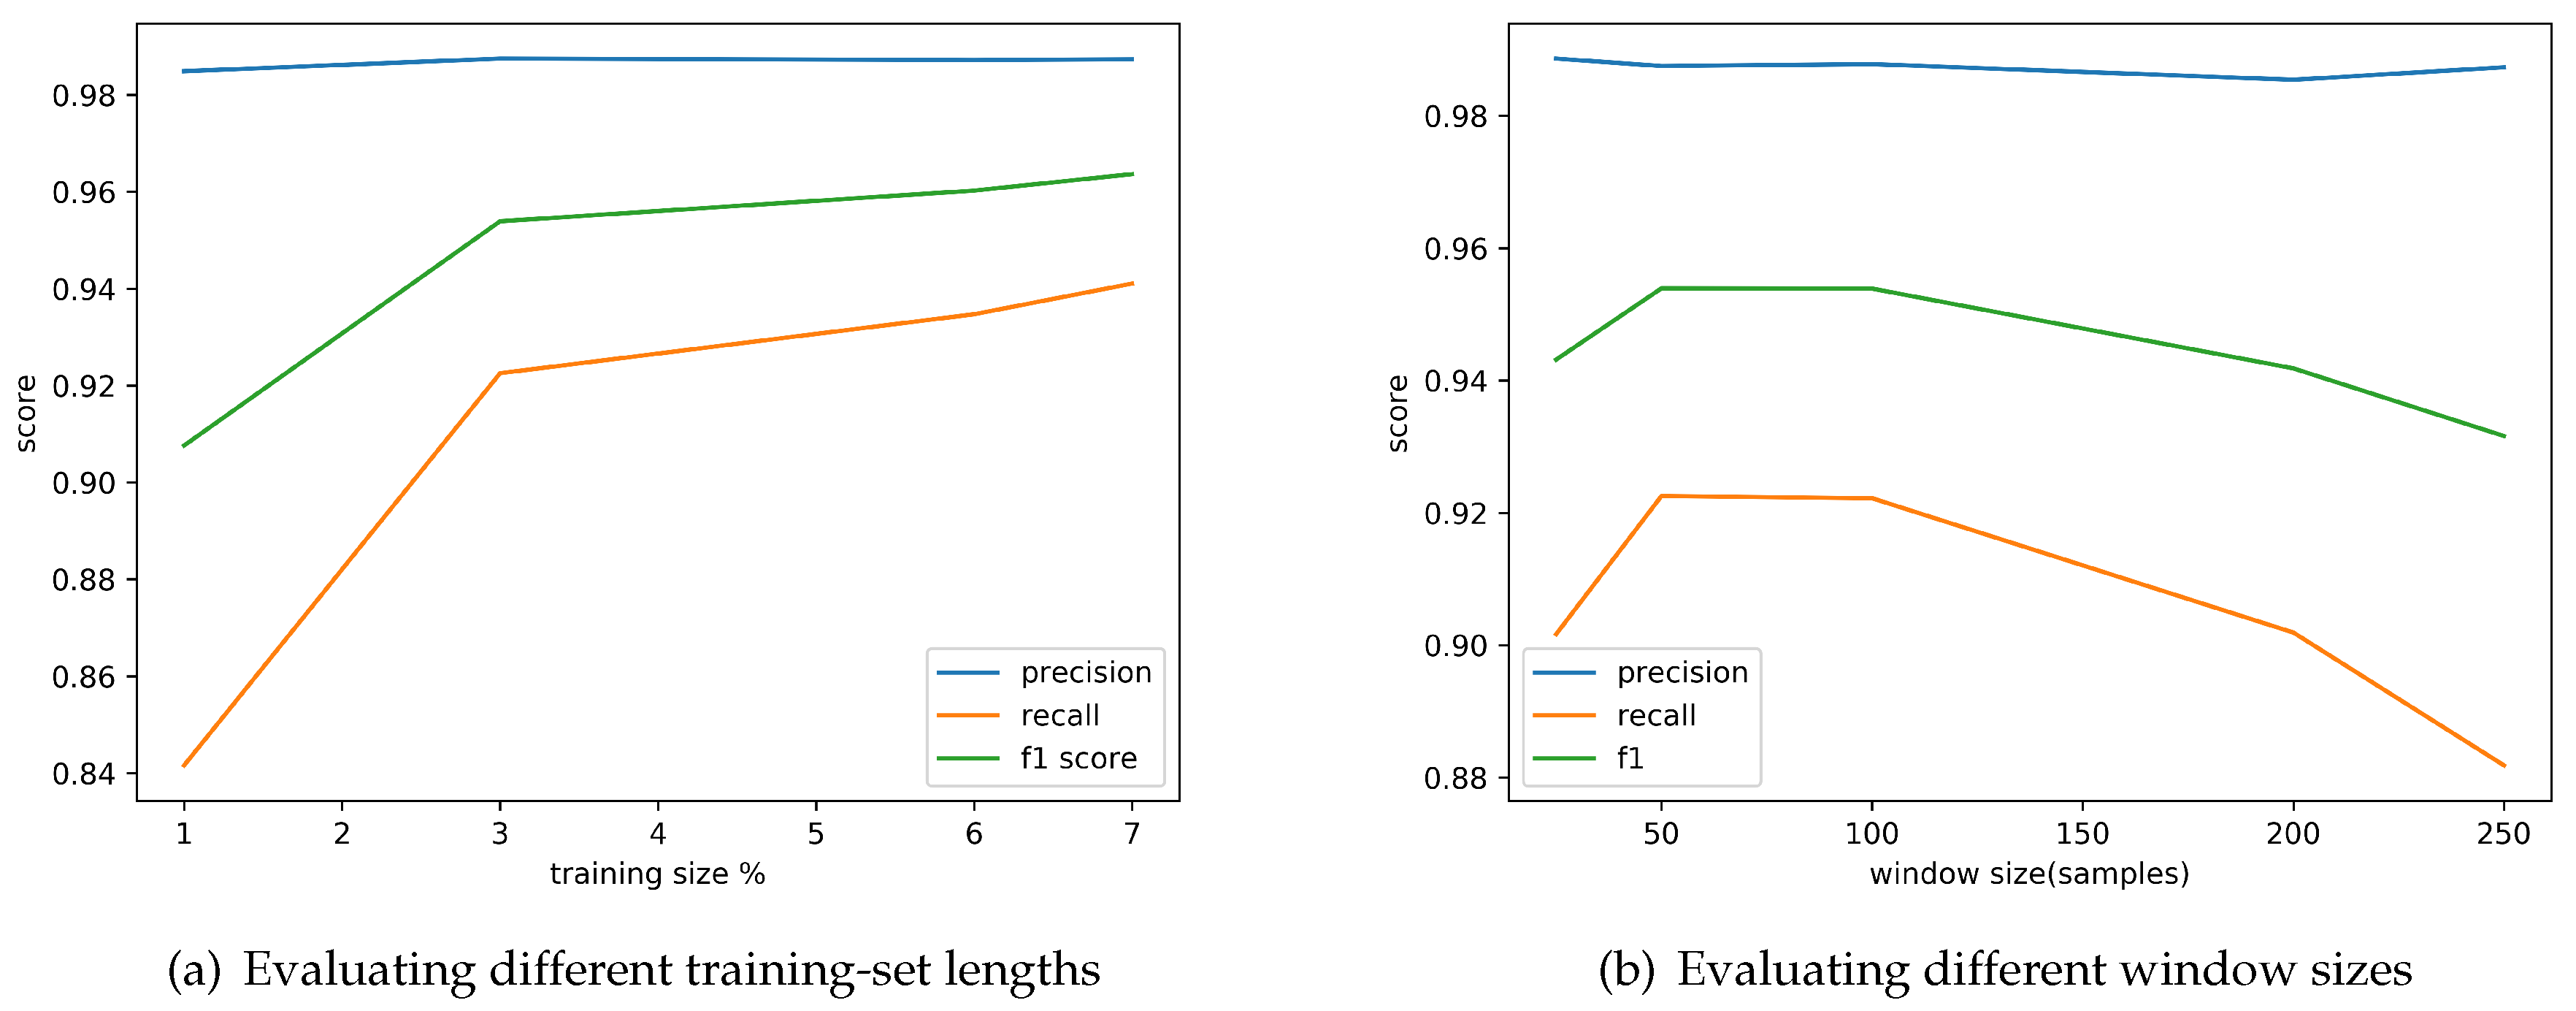
Clearly, the duration
t of the training set is an important parameter for the overall performance of the module. Keeping
t at minimum levels is essential, as a small training set is preferable for faster computation. For this reason, we conducted a series of experiments to identify the minimum amount of signal necessary for the training step without compromising the accuracy of the results.
Figure 4a depicts the precision, the recall, and the F1 score achieved for different training-set lengths. Given the outcome of the experiment, a training set of
s (corresponding to 3% of the ECG signal) suffices to produce very high accuracy—higher than 90%. On average, this corresponds to about 56 beats.
Given that the ECG signal is split into contiguous and fixed size regions, another important parameter, whose value we need to choose appropriately, is the window size. Thus, we conducted a second set of experiments to identify the precision and recall obtained for different window sizes.
Figure 4b depicts the results of this experiment. Given the outcome of the fine-tuning, a window size of 50 samples maximizes the F1 Score.
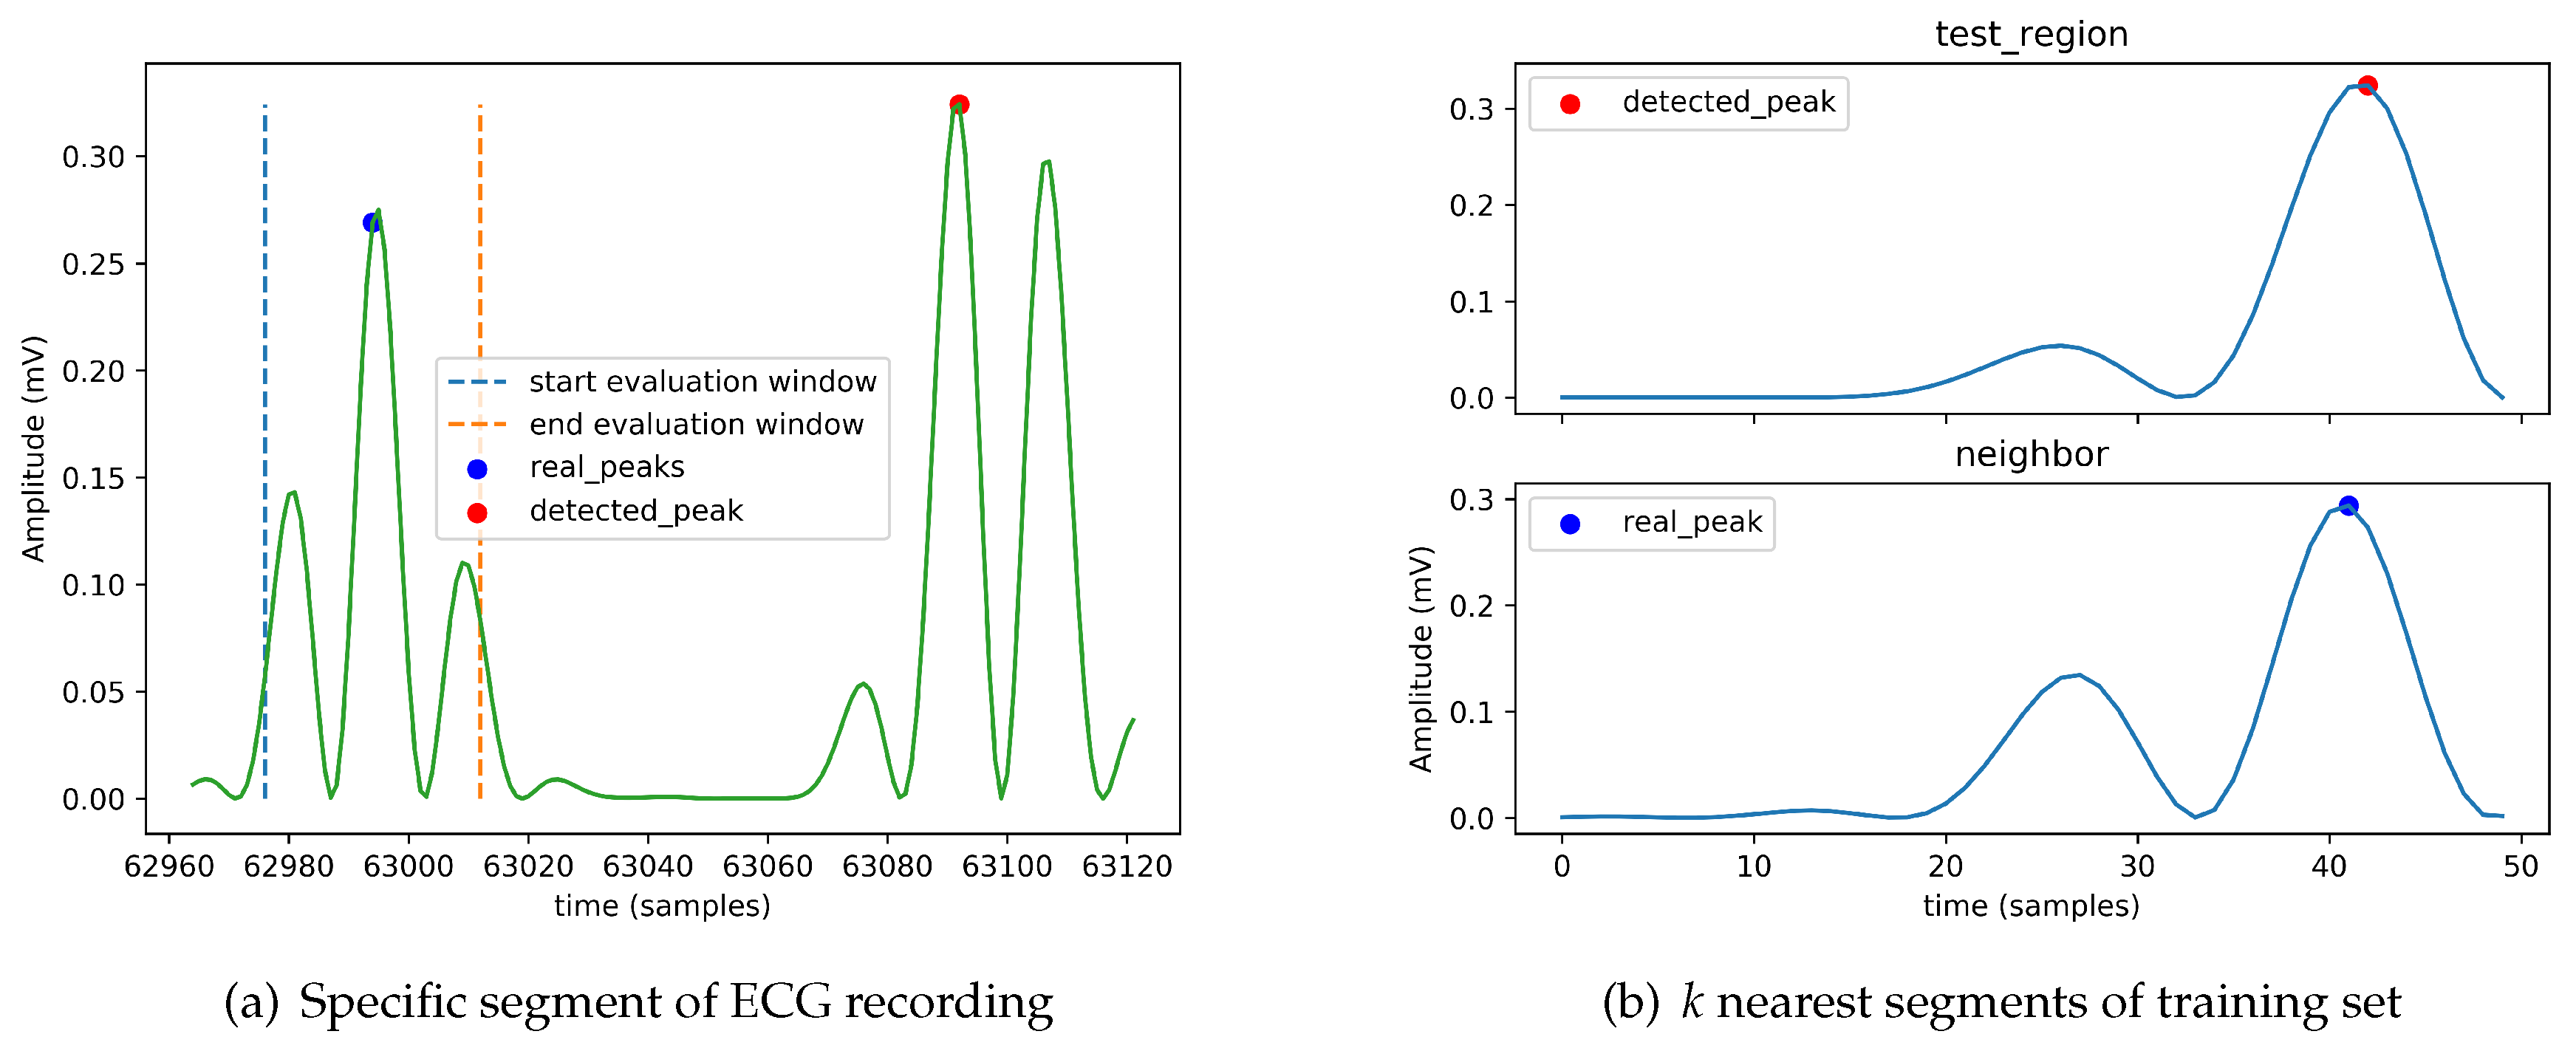
To better understand the cases where the heartbeat-detection module fails to properly detect an
R peak, we identified a set of examples from the dataset for which the module fails. As an example, we present here the situation for the ECG recording with label “101.”
Figure 5a shows the detected peak from a specific segment of its ECG recording and
Figure 5b indicates the
k nearest regions (here
) to the segment in which the detected peak resides (here we use the standard Euclidean distance). To understand why the module fails in this case, it is important to look at the labels assigned to the neighbors in the training set. Recall that the KNN implementation is based on a simple majority voting. In this case, the neighbor region contains a peak, so the module decides that the region contains a peak. The detected peak is set to the maximum of the absolute value of the detected region.
4.3. Arrhythmia-Classification Module
For the arrhythmia-classification module, we designed a set of classifiers using a LSTM neural-network architecture. We trained the classifiers following an intra-patient approach, resulting in a unique classifier model suitable for all patients. For this purpose, we partitioned the MIT-BIT dataset vertically such as to include a fraction of heartbeats from each patient; in particular, we used the first 50% of each ECG record for training the classifier. We tuned the model hyperparameters using the subsequent 10% of the dataset. The remaining part of the dataset was used for evaluating the overall performance. In this module we did not employ a cross-validation process.
The relative proportions of the classes of the available training examples influences the performance of an LSTM classifier. If a few classes dominate the training-data examples, then the classifier training process is heavily influenced by these classes [
54]. The operation of the heart is characterized by large periods of normal activity and short periods of arrhythmic activity. Therefore, the ECG data collected will contain a large volume of normal activity and a small volume (if any at all) of abnormal activity. Many techniques are known to overcome this issue; for example by adopting a penalization model, or by undersampling/oversampling data. We decided to balance the MIT-BIH dataset by augmenting the number of samples in the least populated classes. We increased the number of samples in the under-represented class
c as follows:
r = random vector s.t. and
where is the set of beats for training, is the generic element of the random vector r, and the operator + stands for vector addition. The main idea used is that the shape of a heartbeat is the most relevant feature to discriminate between arrhythmic beats. Adding the same value to each sample in the beat would in fact preserve the shape, providing more training data to the network, as if they were new data.
Note that an approach that simply replicates the instances of the minority classes without any further processing would not suffice as it would lead the network to overfit on such data, memorizing the specific amplitudes without being capable of generalizing the unseen data. For this reason, the approach presented above uses randomization. Although this approach does not eliminate the problem of overfitting completely (additional real data would be required for that), it reduces the effect. Moreover, to reduce the number of instances belonging to the over-represented class (i.e., the normal class (N)), we use a random-sampling technique, which consists of randomly selecting a subset of heartbeats in the normal class. We reduce the cardinality of the normal class by a reduction factor, more precisely: , where denotes the cardinality of the set of instances initially belonging to the normal class, is the cardinality of the reduced set, and r is the reduction factor.
We measure the performance of the classifiers using the following measures: per-class precision, per-class recall, per-class F1 Score, average precision, average recall, and average F1 Score, which are defined as follows:
where
c is the class index, and
,
,
, and
stand for true positive, false positive, true negative, and false negative outcomes, respectively, for class
c. In accordance with the AAMI recommendations, we calculated two sets of performance measurements. It is worth noting that the AAMI-recommended calculations do not reward or penalize a classifier for the classification of ventricular fusion (F) or unknown beats (Q), such as VEBs.
The validation stage is devoted to the search of the best combination of hyperparameters, that is, the one that results in a model with the best performance on the validation set. We define as the best combination the one with the best average F1 score, as it is the measure that takes into account both the precision and the recall of the result for each class. The hyperparameters that have been fine-tuned are the window size, the number of channels, the timesteps, the number of LSTM layers, the number of fully connected layers, the number of neurons for each layer, the batch Size, the dropout probability, and the hidden-units activation function. We trained the model using the Adam optimization algorithm, an extension to stochastic gradient descent, using the categorical cross entropy as the loss function, defined as: , where M is the number of classes, is a binary indicator (0 or 1) if class label c is the correct classification for observation o, and is the predicted probability observation that o is of class c.
The value of the number of epochs parameter varied on the various executions. We employed an early stopping criterion: the model stops training when the value of the loss function does not decrease for ten epochs in the validation step. When this happens, we restore the weights of the network corresponding to the lowest loss value.
Because of the elevated number of candidate combinations, it was not feasible to perform an exhaustive grid search. For this reason, we tuned each parameter in isolation, maintaining the other ones fixed. When we chose the value for a given parameter, we kept it for all the subsequent runs.
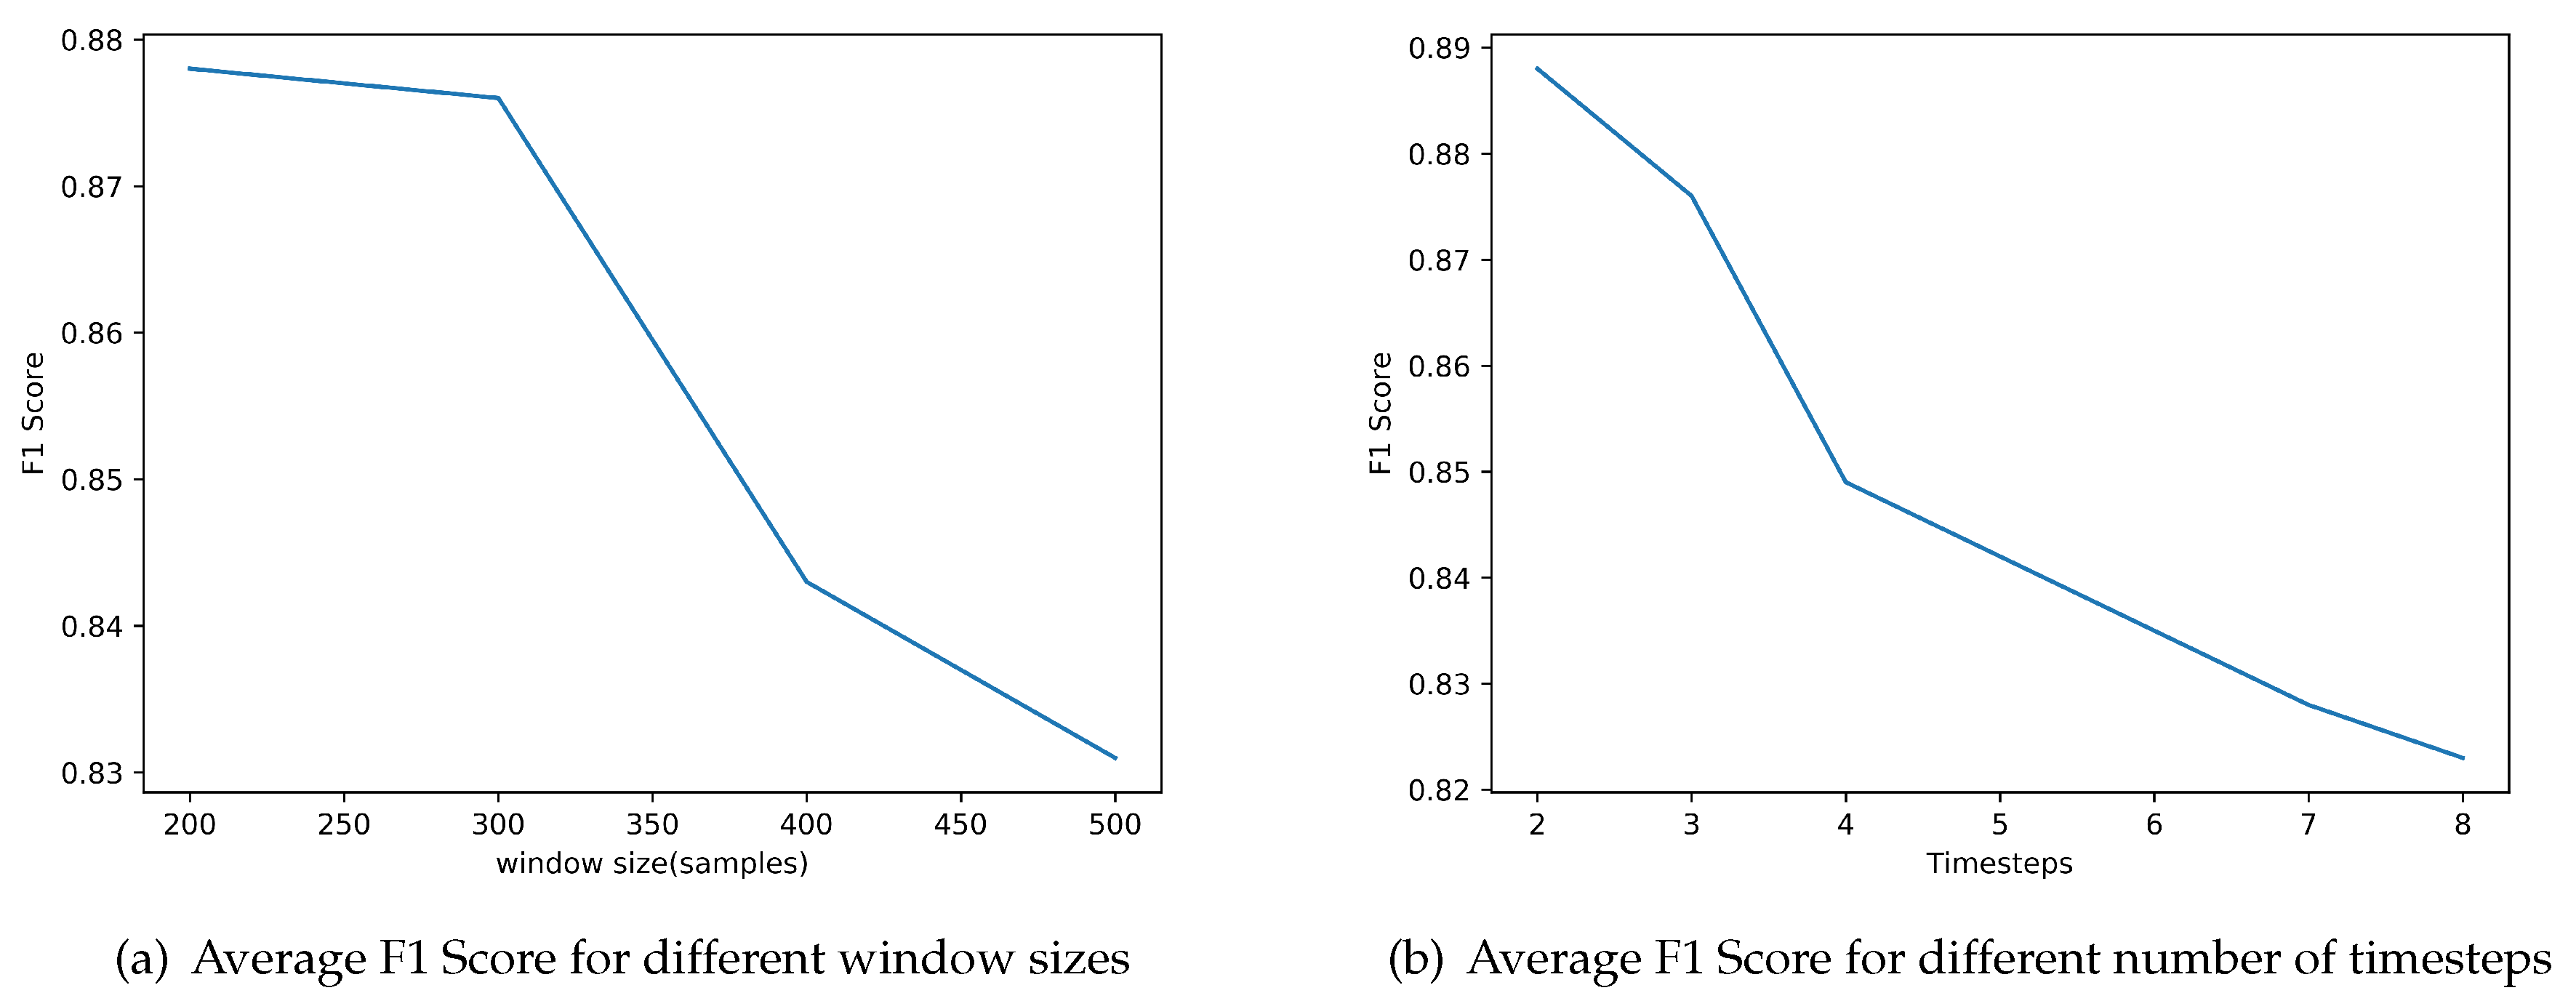
First, we examined the effect of the window size. We define a heartbeat as a fixed number of samples around an
R peak location. There is not an appropriate value for the number of samples agreed on in the literature, so we examine different values.
Figure 6a depicts the achieved performance for different window sizes. The best value in terms of average F1 Score on the validation dataset is 200 samples.
The second parameter that we examined was the number of timesteps considered in the feature vector, that is, the number of previous beats included for making the prediction for the current beat.
Figure 6b depicts the evaluation of the performance of the classifier for different number of timesteps included. The results indicate that the best value is 2.
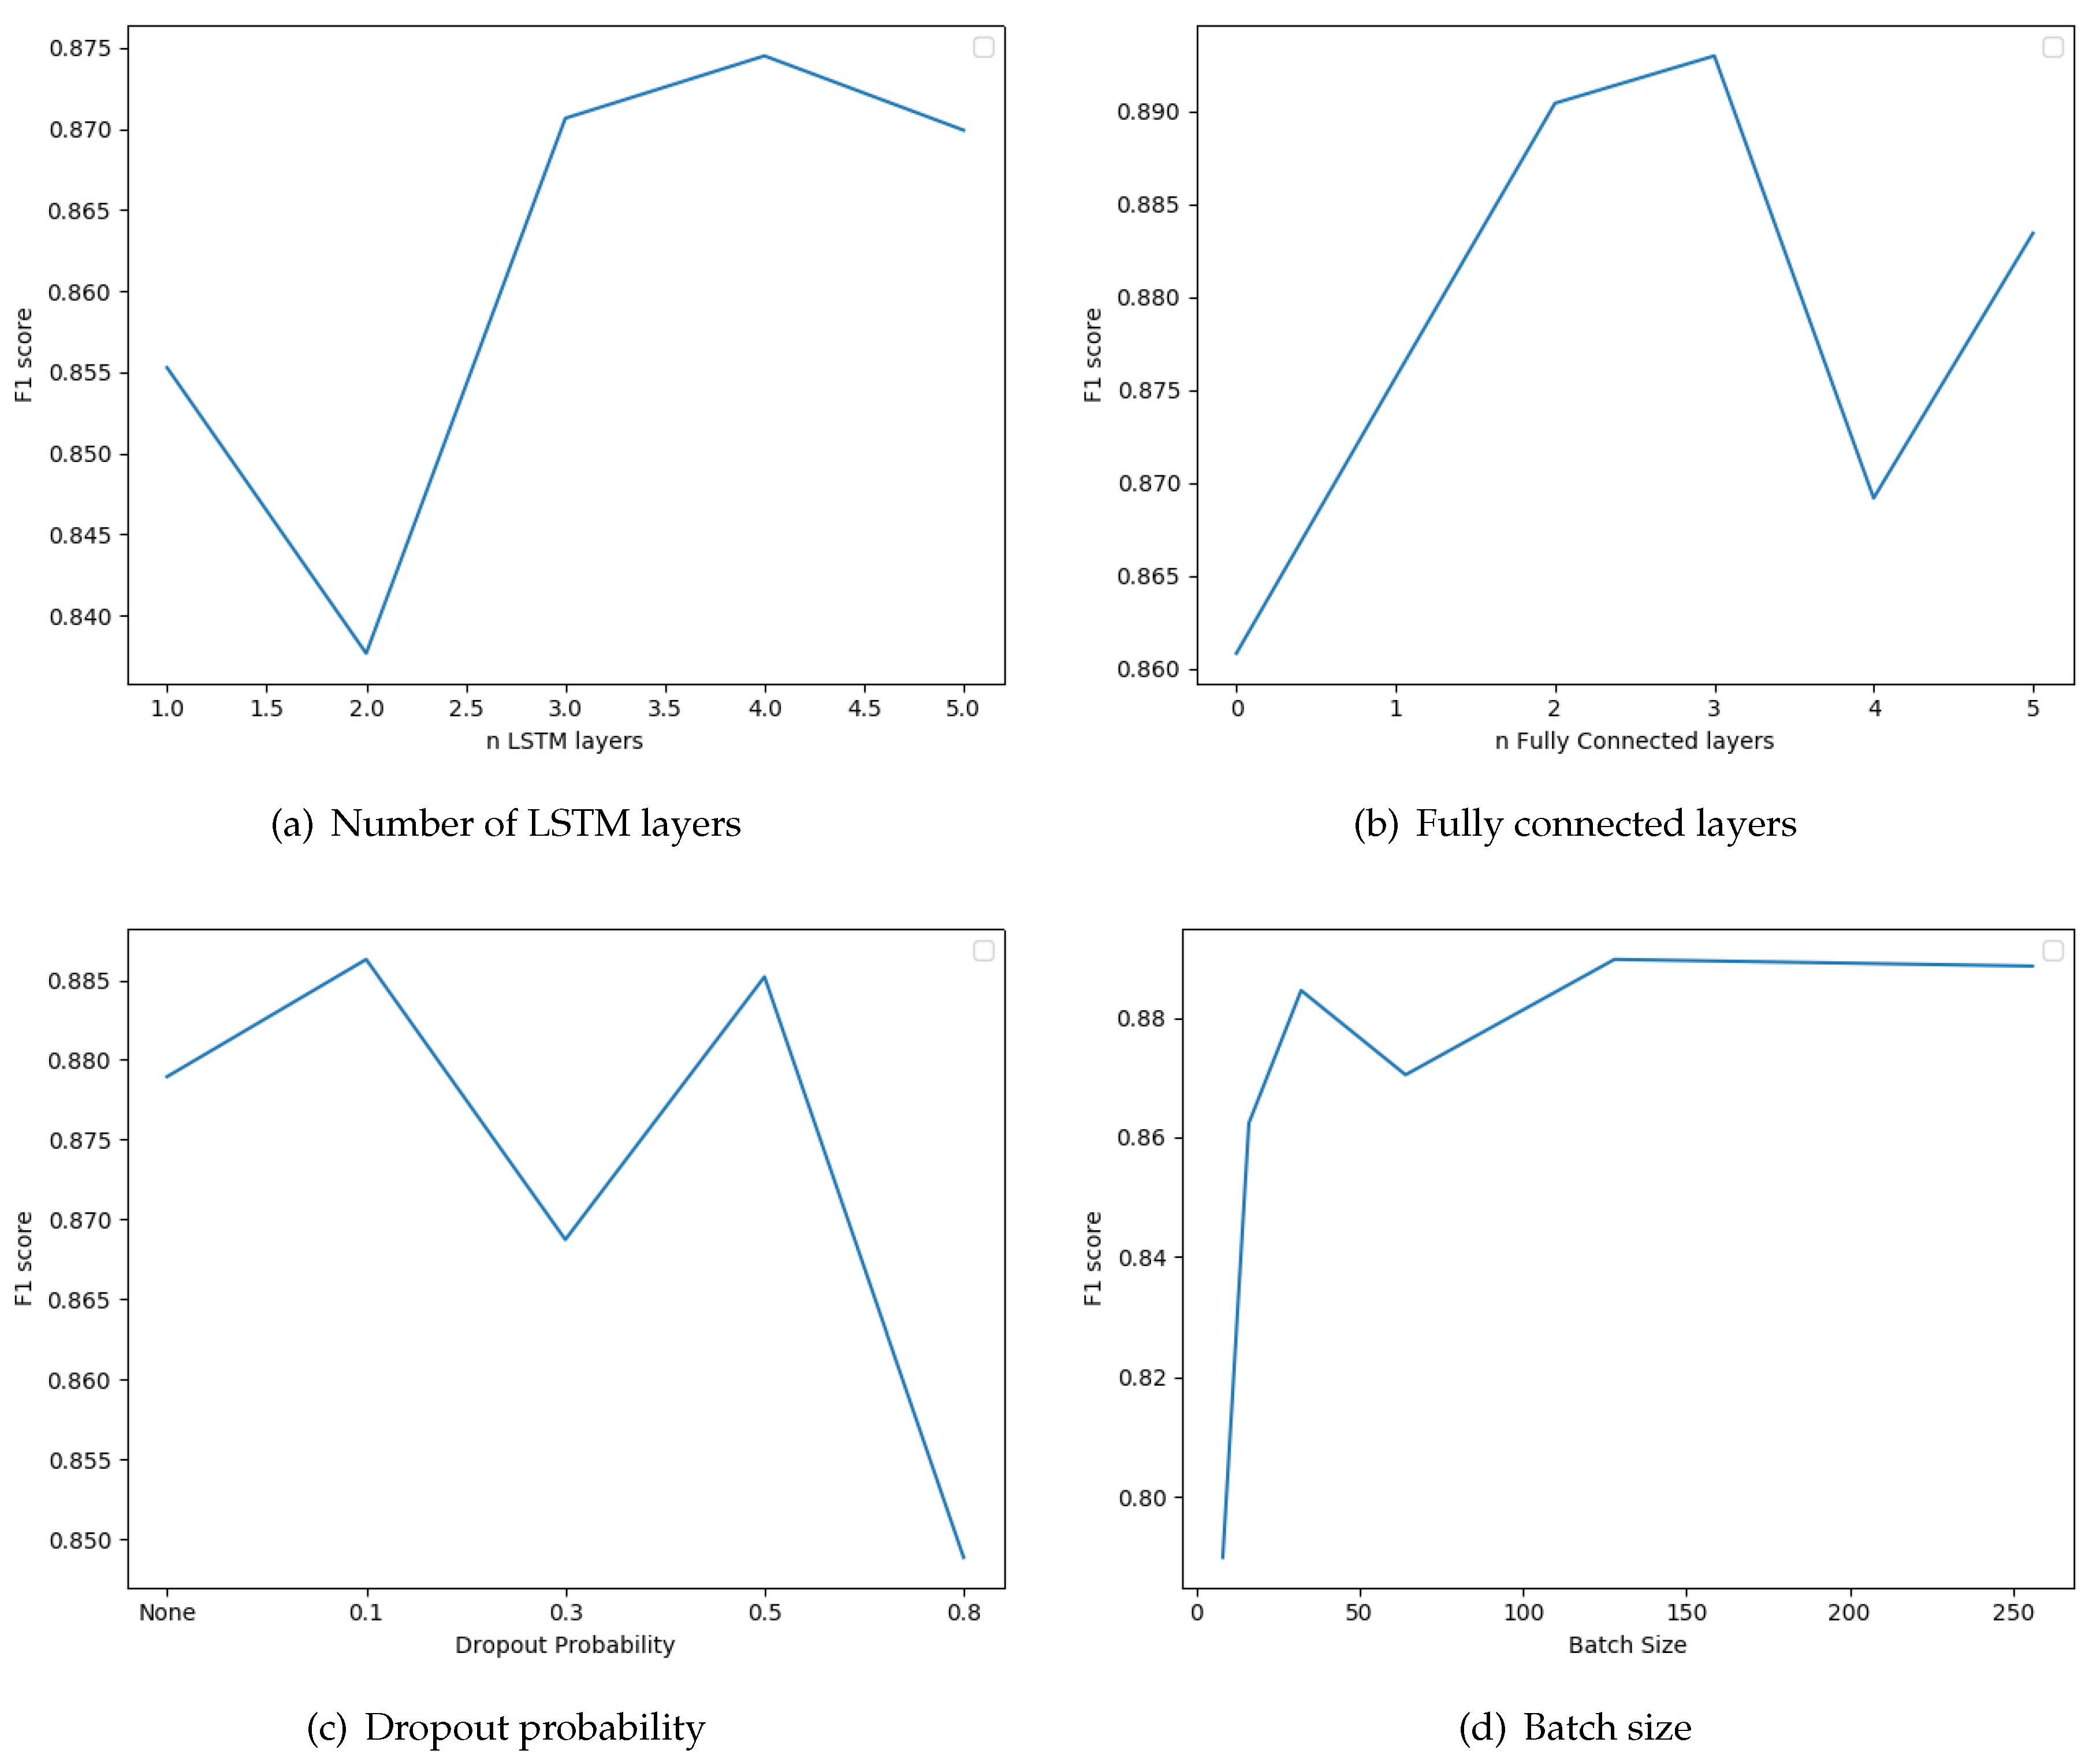
The next parameter we examined was the number of LSTM layers that we connect in a sequential manner in the classifier model. We also tested whether the inclusion of standard fully connected layers after the LSTMs improves the results. We also examined the use of dropout regularization layers between the fully connected layers. The dropout probabilities considered are zero (no dropout layers), 0.1, 0.3, 0.5, and 0.8. Note that the batch-size parameter influences the correctness of the results; it is the number of instances after which the update of parameters is performed. The results of these evaluations are depicted in
Figure 7. The optimal number of LSTMs and fully connected layers are 4 and 3, respectively. Furthermore, the best F1 score is obtained if we include dropout layers with dropout probability 0.1. Finally, optimal batch Size is 128. The recurrent neural network optimization lasted 2347 s for a total of 15 epochs.
6. Conclusions and Future Work
We presented a system for automatic heartbeat detection and arrhythmia classification based on wearable devices. The solution takes advantage of recent technological developments in microcontrollers and in particular asymmetric embedded processors that support hardware-assisted execution of machine-learning methods. In this way, the computational resources available at the edges of the network are used to locally process the collected signal and perform signal analysis, heartbeat detection, and arrhythmia classification. The performance evaluation indicates that the achieved accuracy is high and is, in fact, enough to conduct a first level analysis of the signal in order to identify normal signals that do not need to be stored or transmitted to the cloud services. Because only the final result is transmitted, the solution conserves bandwidth, limits the need for storage, and decreases latency. These findings are a positive indication that the fog-computing approach can indeed help address the problems resulting from an excess volume of data that are transferred from IoT devices to cloud services.
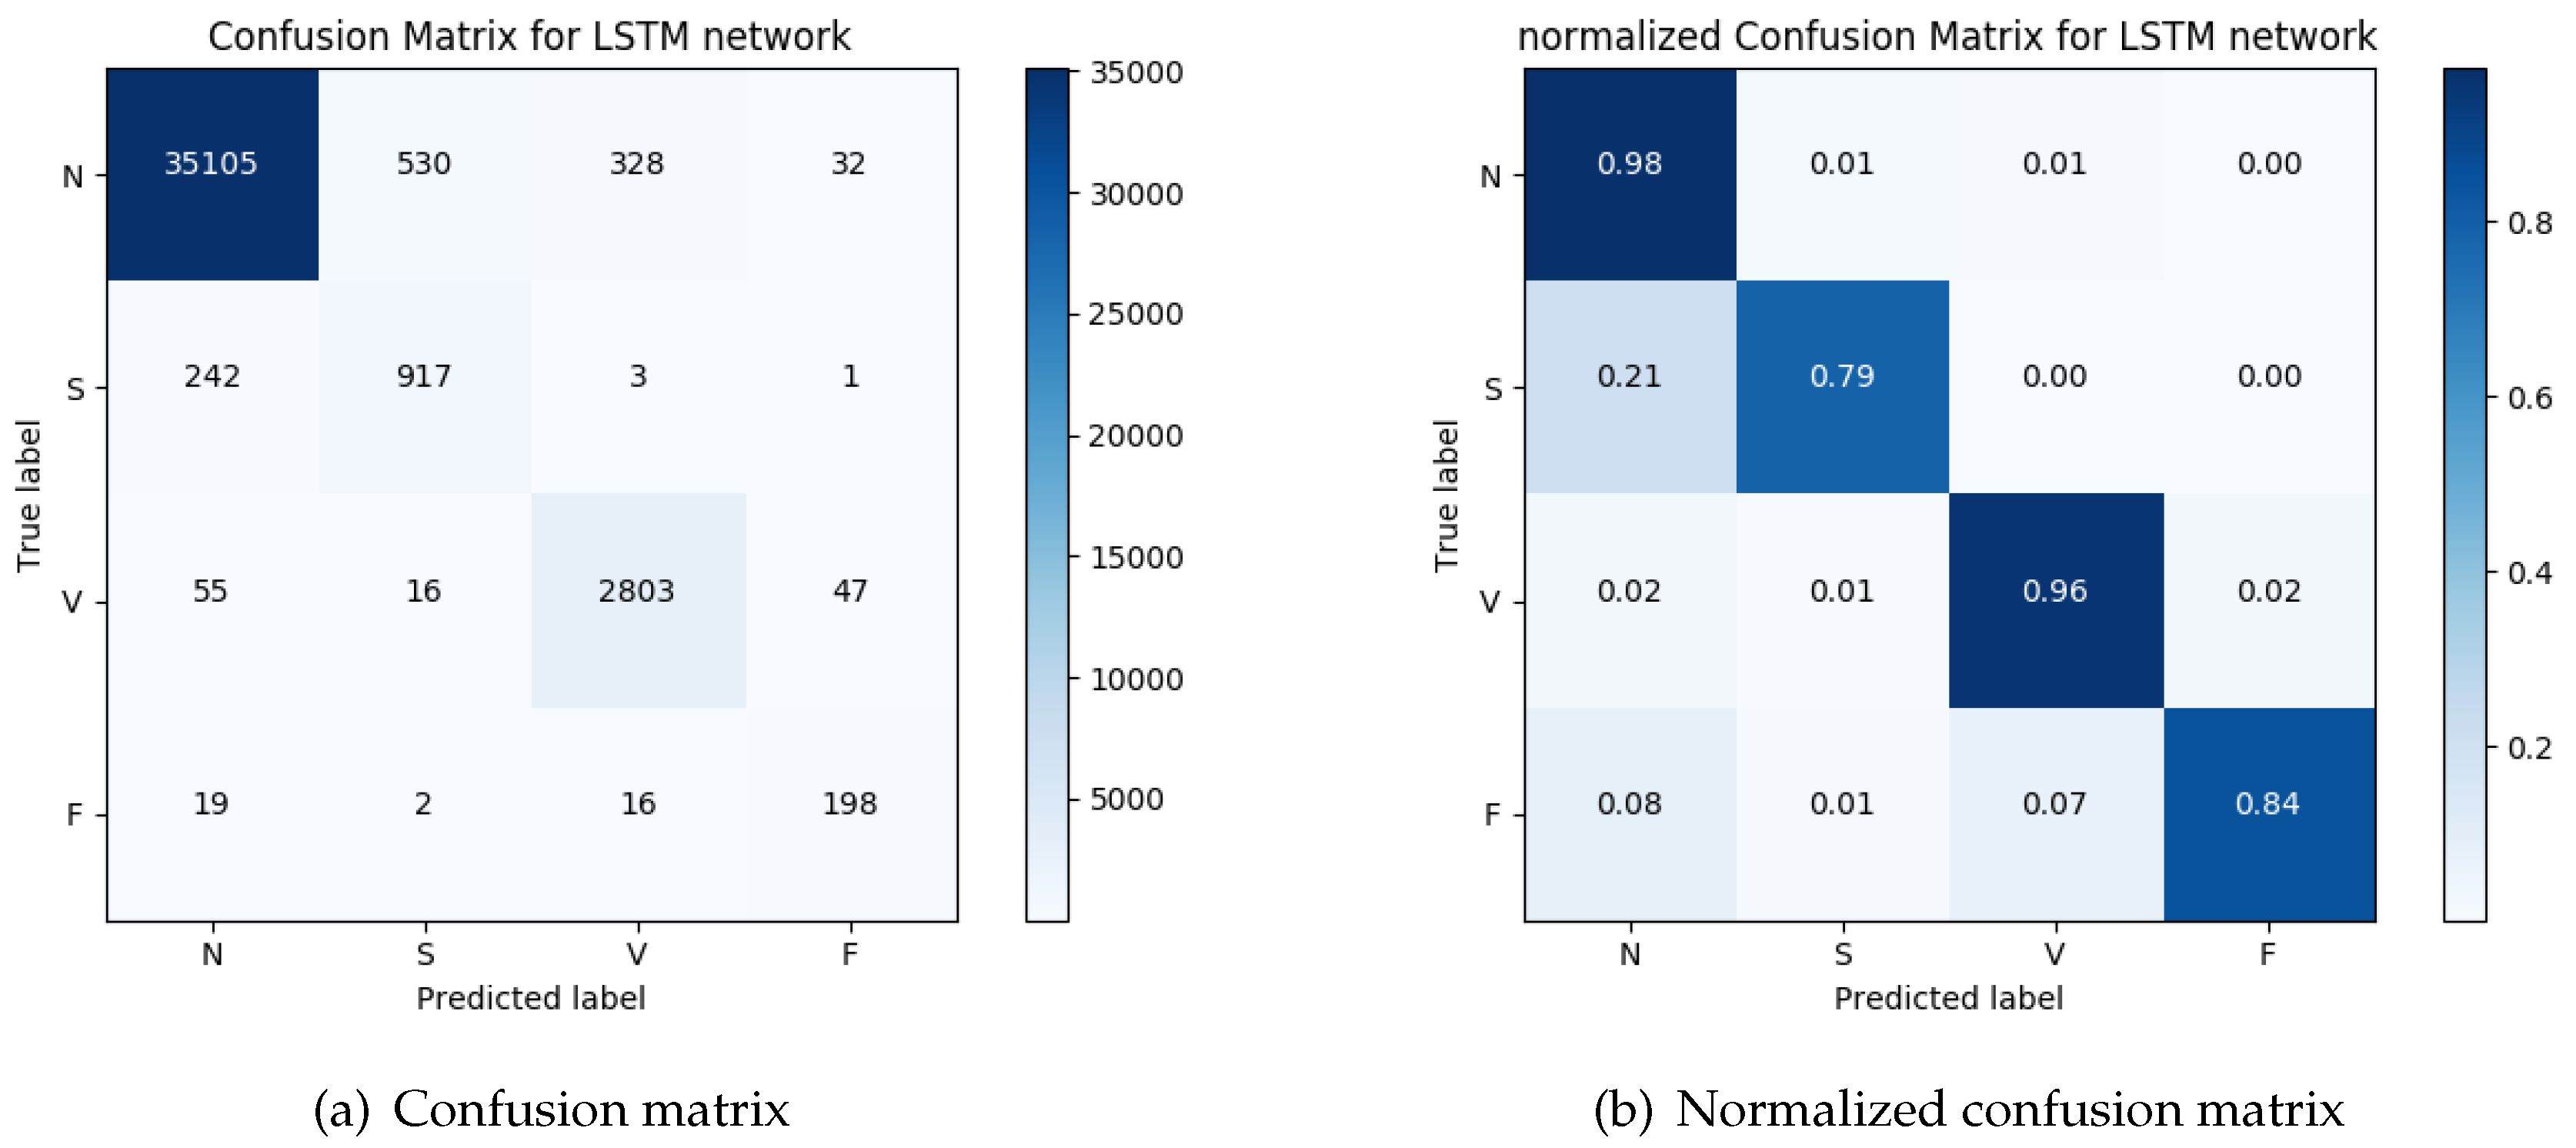
We evaluated the capability of the end-to-end method to identify the heartbeats and their classification into four groups: normal beats, VEBs, SVEBs, and fusion of normal and VEBs, on the MIT-BIH arrhythmia database. The resulting system achieves a precision of
and recall of
on the detection of heartbeats, and a precision of
and recall of
on the arrythmia classification. These results are an indication that the computational power available at the edges of the network can be used to achieve results comparable to state-of-the-art techniques while at the same time significantly improving the overall network utilization. Moreover, it is important to keep in mind that the solutions proposed here take advantage of the hardware-assisted execution of machine-learning methods in order to minimize the power consumption. Given the dependence of the wearable device on a battery, clearly energy efficiency is also an important requirement. Although there exist other methods that achieve much better results, such as in References [
34,
35], such solutions do not utilize the special-purpose hardware core. Instead, they are executed within the generic core of the embedded processor leading to higher power consumption. In this sense, our findings indicate that there is a compromise between energy consumption and accuracy in the domain of embedded processors.
Future investigations in this area will involve the improvement of the precision and accuracy of the detection and classification phases of the system. To this end, the use of evolutionary computation may help optimize the parameters of the classifiers. It is also important to look into the intra-patient training methodology and attempt to minimize the size of the training set. Another avenue for future work is the implementation of other types of classifiers within an asymmetric multicore embedded processor in order to further improve the accuracy of the entire system while at the same time keeping the energy consumption low. Additionally, despite the current bibliography mainly focusing on detection (and hence, heart-rate calculation), there are also other approaches that can be used within a constrained resources device. Finally, it is also important to evaluate the performance of this technique using different data sets.


