Abstract
Length of stay of hospitalized patients is generally considered to be a significant and critical factor for healthcare policy planning which consequently affects the hospital management plan and resources. Its reliable prediction in the preadmission stage could further assist in identifying abnormality or potential medical risks to trigger additional attention for individual cases. Recently, data mining and machine learning constitute significant tools in the healthcare domain. In this work, we introduce a new decision support software for the accurate prediction of hospitalized patients’ length of stay which incorporates a novel two-level classification algorithm. Our numerical experiments indicate that the proposed algorithm exhibits better classification performance than any examined single learning algorithm. The proposed software was developed to provide assistance to the hospital management and strengthen the service system by offering customized assistance according to patients’ predicted hospitalization time.
1. Introduction
Nowadays, every healthcare system faces constant pressures to lower operating costs by improving the use of resources while maintaining and even enhancing the quality of service. Successful healthcare resource management is especially indispensable for addressing these seemingly contradictory pressures. The main objective of hospital managers is the administration of facilities, equipment, and labor resources for the establishment of an appropriate planning and organizational structure while at the same time they anticipate expenditure reduction. To this end, several methodologies and techniques have been presented and developed. The major component in these techniques is the accurate prediction of patients’ hospitalization time and the identification of the factors which influence it.
Length of Stay (LoS) is usually defined as the duration of a patient hospitalization and is calculated as the difference between the timestamp of a patient discharge and the timestamp of its admission. It is generally acknowledged as an indicative marker of inpatient hospitalization costs and resource use [1]. Since bed supply in a hospital is limited, their use is considered economically crucial for most hospitals and any administration policy, related to bed use, has profound impacts on the perception of quality in the provided healthcare and satisfaction of patients and physicians. Moreover, with the growing number of hospitalized patients, the prediction of the average LoS has become increasingly significant for effective admission scheduling and resource planning. Currently, clinicians and hospital managers rely on only aggregated data and generally assume that the prediction of patients’ discharge date and LoS is heavily depended on experience. It is worth noticing that many hospitals have no ability to predict and measure future admission requests [2].
During the last decades, hospitals have managed to accumulate a large volume of data which enable researchers to measure and compare clinical performance and use these results to support or critique policy decisions. Machine learning techniques can be considered a helpful tool, offering a first step in extracting useful and valuable information from healthcare data and gaining insights into the prediction of patient’s LoS and on the major factors and elements which affect it. To this end, research focused on the application of machine learning on patients’ data for the development of accurate and intelligent Decision Support Systems (DSS) [3,4,5,6,7,8,9]. Specifically, an academic DSS is a knowledge-based information system which captures, handles, and analyzes information which affects or is intended to affect decision making performed by people in the scope of a professional task appointed by a user [10]. Through the use of a predictive DSS, it is possible to forecast patients’ LoS in a hospital and assist healthcare management plan, policy, and resources. Moreover, LoS prediction is critical for diseases or injuries which necessitate long treatments or involve scarce patient care resource. Therefore, the development of an efficient DSS is considered essential and valuable not only for hospital administrators but also for the patients.
More comprehensively, “knowledge discovery” can assist hospital administrators in their decision-making process for promoting health services, rehabilitation planning, resource allocation and healthcare unit administration (e.g., patient admission/treatment/discharge, bed management, staff scheduling). Any bottlenecks in bed and resource availability could be foreseen in time to avoid thereby unnecessary patients’ transfer between wards during their admission. Thus, healthcare policies could be properly prioritized and the appropriate allocation of healthcare resources could be comprised according to differences in patients’ LoS, health status and social-demographic features. Meanwhile, the identification of factors which determine and effect LoS could promote the development of efficient clinical pathways and optimize resource use and management. As a result, with the accurate estimation of LoS and with the improvement of healthcare policy planning, patients will be provided with better medical services in a hospital. Nevertheless, the development of such prediction model is a very attractive and challenging task [1,11]
In this work, we present a new decision support software for the accurate prediction of the hospitalized patients’ LoS which incorporates a two-level classification scheme. The proposed software classifies the hospitalized patients based on their expected LoS, considering demographic, clinical, and geographical factors which can be assessed at the time of admission. Furthermore, significant advantages of the presented tool are the employment of a simple and user-friendly interface, its scalability due to its modular nature of design and implementation and its operating system neutrality. Our objective and expectation is that this work could be used as a reference for decision making in the admission process and strengthen the service system in hospitals by offering customized assistance according to patients’ predicted hospitalization time.
The remainder of this paper is organized as follows: Section 2 presents a survey of recent studies concerning the application of data mining in the prediction of LoS. Section 3 presents a detailed description of the data collection and data preparation used in our study and a brief discussion of the proposed two-level classification algorithm. Section 4 presents experimental results while Section 3 presents our proposed decision support software for forecasting patients’ LoS. Finally, Section 6 sketches concluding remarks and future work directions.
2. Related Work
Hospitals are daily faced with a significant uncertainty which is mainly based on the LoS of hospitalized patients. As future admission requests appear to be a more complicated problem within an effective and long-term healthcare system planning, accurate prediction of in-hospital stay duration would allow, in short-term, for efficient human resources allocation and facilities occupancy. LoS prediction is a substantial problem which attracted research community’s attention since the 1960s [12,13] by employing statistical methods. Since then, several scientific fields have risen, providing mathematical and computing classification and prediction techniques. Following the evolution of machine learning and data mining, research efforts focused on employing relevant algorithms in the field of LoS prediction. Awad et al. [14] presented an excellent survey, describing in detail a range of length of stay and mortality prediction applications in acute medicine and the critical care unit. Furthermore, they focused on the methods of analyzing length of stay and mortality prediction and provided a classification and evaluation of these methods with a grouping of relevant research papers published in the last 20 years.
Hachesu et al., [2] used several data mining techniques to extract useful knowledge and developed an accurate model to predict the LoS of cardiac patients. The dataset used in their study consisted of 4948 instances from patients with coronary artery disease. Their extended analysis revealed that a LoS greater than 10 days was associated with comorbidity and diastolic blood pressure features. Based on their numerical experiments, the authors concluded that their proposed ensemble algorithm exhibited the best performance than any individual algorithm, presenting 98.2% of successful classification. Moreover, they stated that there was a significant tendency for LoS to be longer in patients with lung or respiratory disorders and high blood pressure which implies that comorbidities such as lung disorders and hemorrhage have a significant impact on long LoS.
Morton et al. [13] compared and discussed the performance of various machine learning algorithms for the prediction of short-term vs. long-term LoS of hospitalized diabetic patients, where short-term is defined as less than 3 days. In their framework, they used 10,000 patients’ records from the HCUP Nationwide Inpatient Sample database where each record contains several features including demographics, hospital information, admission type, number of diagnoses, health insurance status, total hospital charges and risk/severity measures. Their experimental analysis indicated that support vector machine constitutes the most promising method for predicting short-term LoS in hospitalized diabetic patients.
In more recent works, Tsai et al. [15] performed a two stage LoS prediction: the predischarge and the preadmission. The predischarge stage uses all the available data of in-hospital patients, while the preadmission one uses only the data available before a patient’s admission in the hospital. The prediction results for predischarge patients were used to evaluate the LoS prediction performance at the preadmission stage. They collected data from 2377 patients of cardiovascular disease with one of the three primary diagnoses: Coronary Atherosclerosis (CAS), Heart Failure (HF) and Acute Myocardial Infarction (AMI). Their proposed classification model was able to predict correctly for 88.07% to 89.95% CAS patients at the predischarge stage and for 88.31% to 91.53% at the preadmission stage. For HF/AMI patients, the accuracy ranged from 64.12% to 66.78% at the predischarge stage and 63.69% to 67.47% at the preadmission stage when a tolerance of two days was allowed.
Muhlestein et al. [16] developed an ensemble method to systematically rank, select, and combine machine learning algorithms to build a model for the prediction of patients’ LoS following craniotomy for brain tumor. They used a training dataset which contained information of 41,222 patients who underwent craniotomy for brain tumor, obtained from the National Inpatient Sample and a validation dataset of 4592 patients from the National Surgical Quality Improvement Program. Based on their numerical experiments, they concluded that their proposed ensemble model predicts LoS with good performance on internal and external validation and yields clinical insights that may potentially improve patient outcomes.
Yakovlev [17] proposed an approach for the early prediction of in-hospital mortality and LoS of patients with acute coronary syndrome. They used data from 5000 electronic medical records of patients hospitalized from 2010 to 2016. Their experimental results showed that laboratory tests can be efficiently used together with machine learning methods on patients’ data for accurate prediction of in-hospital mortality. In contrast, the prediction of a hospitalized patient LoS cannot be achieved with high accuracy.
Chuang et al. [11] used several classification algorithms for determining whether patient LoS is within the standard LoS after surgery. They analyzed the complete historical medical records and lab data of 896 patients at St. Martin De Porres hospital from January 2006 to December 2012, involving surgeries performed by general surgery physicians. Their dataset was divided into Urgent Operation (UO) and non-UO groups to develop a prolonged LoS prediction model. The best presented accuracy was 85.7% and 89.4% for UO and non-UO patients, respectively. Furthermore, their experiments indicated that comorbidity, body temperature, blood sugar, and creatinine were the most influential variables for prolonged LoS in the UO group, whereas blood transfusion, blood pressure, comorbidity, and the number of admissions were the most influential variables in the non-UO group.
Livieris et al. [1] evaluated the classification performance of semi-supervised methods in predicting the LoS of hospitalized patients. Their reported experimental results illustrated that a good predictive accuracy can be achieved by exploiting the explicit classification information of labeled data with the information hidden in the unlabeled data.
3. Research Methodology
The primary goal of the present research is the accurate identification of patient’s LoS. To this end, we have adopted a two-stages methodology, where the first stage concerns data collection and data preparation, while the second one deploys the proposed two-level classification algorithm.
3.1. Dataset
The data set consisted of patients hospitalized in the General Hospital of Kalamata, Greece during the period between 2008 and 2012. We identified 2702 patients, of both genders and different kind of diagnoses, limited to age over 65 years. It must be mentioned that despite our efforts, we have not been able to gain access to any other age groups. Data cleansing and preprocessing operations involved the deletion of duplicated records, irregularities, and irrelevancies and manipulation of records with missing and outlier data. Moreover, it is worth noticing that records with the same admission and discharge date (i.e., resulting in 0 LoS) were excluded from our research.
Table 1 presents the set of the thirteen (13) attributes used in our study concerning demographic, clinical, geographical and administrative factors. The first three (3) attributes are related with patient’s personal information such as gender, age, and insurance type. Notice that each patient in Greece belongs to a specific insurance fund based on his occupation such as IKA, OGA, NAT, TAYT, or he/she has a private health insurance. The following four (4) geographical and demographic attributes concern the patient’s residence altitude, urbanity, and distance from the hospital as well as the medical cover of the residence. The last five (5) attributes are related with patients’ pathological and clinical characteristics. These attributes concern the day and month of the patient’s admission in the hospital and the number of patients which have been admitted that day. Additionally, the hospital ward in which the patient was admitted and the ICD-10 diagnosis code according to the World Health Organization [18] are usually the main reasons of patient’s LoS [19].

Table 1.
Attributes description.
Finally, the patients were classified according to the number of days in the hospital: “1”, “2”, “3”, “4”, “5” and “5+” days. Figure 1 presents the class distribution which depicts the number of patients who hospitalized for “1 day” (758 instances), “2 days” (598 instances), “3 days” (321 instances), “4 days” (205 instances), “5 days” (156 instances) and “5+ days” (664 instances). Clearly, from the number of instances of each class, we can observe the imbalance of the dataset’s class distribution.
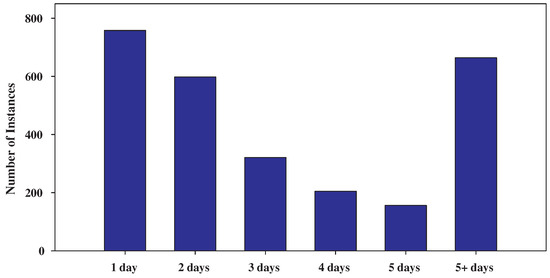
Figure 1.
Class distribution showing the imbalance of the dataset.
3.2. Two-Level Classifier
In the sequel, we introduce our proposed two-level classification scheme for the prediction of hospitalized patients’ LoS. It is worth mentioning, that two-level classification schemes are heuristic pattern recognition tools that are anticipated to yield better classification accuracy than single-level ones at the expense of a certain complication of the classification structure [20,21,22,23]. To the best of our knowledge, in the literature there has not been proposed any similar approach for the prediction of LoS while all proposed prediction models are single-level classifiers based on several classification algorithms (see [13,14,15,16,17]).
On the first level of our classification scheme, we use a classifier to distinguish the patients which are likely to stay in hospital between “1–2” days “3–5” days or “5+” days. In the rest of this work, we refer to this classifier as A-level classifier. In case the verdict (or prediction) of the A-level classifier is “1–2” days or “3–5” days, we use a second-level classifier to conduct a more specialized decision. More specifically, in case the prediction is “1–2” days, we use a classifier to distinguish between “1” and “2” days. This classifier is referred as B-level classifier. Similarly, in case the prediction is “3–5” days, we use a classifier to distinguish between “3”, “4” and “5” days, which is referred as B-level classifier. An overview of our two-level classification scheme is depicted in Figure 2.
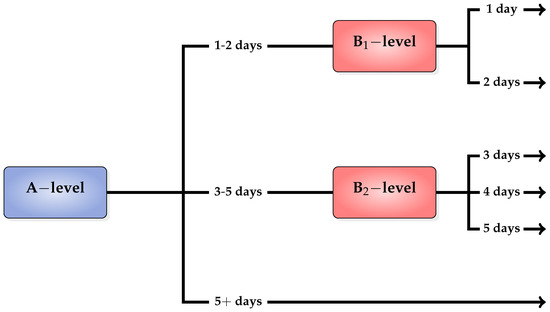
Figure 2.
Two-level classification scheme.
It should be noted that the rationale behind the selection of the LoS classes to model the stages of a patient’s hospitalization lies in clinical and management criteria (see [19,24]). More specifically, the first category (1–2 days) includes acute care patients that only stay in hospital for a short period of time; the second category (3–5 days) includes patients who undergo a short period of rehabilitation or recovering from routine surgery; while the third category (5+ days) refers to the patients who are hospitalized for a long period of time due to more complicated health problems.
4. Experimental Results
In this section, we report a series of experiments to evaluate the performance of the proposed two-level classification algorithm against some of the most popular and commonly used classification algorithms.
In this regard, performance evaluation was conducted using different classification algorithms at each level and explore their classification accuracy. Our aim is to find which classifiers are best suited as A-level, B-level and B-level classifiers for producing the highest performance. To this end, we have selected
- Naive Bayes (NB) algorithm was the representative of the Bayesian networks [25].
- Multilayer Perceptron (MLP) was representative of the artificial neural networks [26].
- Sequential Minimal Optimization (SMO) [27] from the support vector machines.
- kNN [28] from instance-based learners with Euclidean distance as distance metric.
- Random Forest (RF) [29] from decision trees.
This selection was based on studies which have shown that the above classifiers constitute some of the most effective and widely used data mining algorithms [30] for classification problems.
We evaluated the performance of our proposed two-level classification scheme in terms of accuracy, as one of the most frequently used measures for assessing the overall effectiveness of a classification algorithm [31] and is defined as the percentage of correctly classified instances. All classifiers have been implemented in WEKA Machine Learning Toolkit [32] and the classification accuracy was evaluated using the stratified 10-fold cross-validation [33] i.e., this approach involves randomly dividing the set of instances into ten groups (folds), of approximately equal size, so that each fold had the same distribution of classes as the entire data set. Each fold is treated as a testing set, and the classification algorithm is fit on the remaining nine folds. The results of the cross-validation process are summarized with the mean of the prediction model skill scores. Table 2 reports the configuration parameters of all classification algorithms.
Table 2.
Parameter specification for all the classification algorithms used in the experimentation.
Table 3, Table 4, Table 5, Table 6 and Table 7 present the performance evaluation of B-level and B-level classifiers using NB, MLP, kNN, RF and SMO as A-level classifiers, respectively. In each case, the accuracy measure of the best performance is highlighted in bold. Firstly, it is worth mentioning the sensitivity of the two-level scheme on the selection of A-level and B-level classifiers. More specifically, the classification accuracy of the proposed classifier varies between 42.3–53.89%, 42.53–54.67%, 57.44–74.17%, 62.7–78.53% and 53–70.21% using NB, MLP, kNN, RF and SMO as A-level classifier, respectively. Clearly, RF exhibits the best performance, presenting the highest accuracy while in contrast NB and MLP report significantly pool performance used as A-level classifiers. Moreover, the interpretation of Table 3, Table 4, Table 5, Table 6 and Table 7 illustrates that the proposed algorithm exhibits the best classification performance using kNN and RF as B-level and B-level classifiers, respectively. Summarizing, we conclude that the two-level classification scheme presents the highest classification accuracy using RF as A-level classifier and kNN and RF as B-level and B-level classifiers, respectively.
Table 3.
Two-level classifier classification using NB as A-level classifier.
Table 4.
Two-level classifier classification using MLP as A-level classifier.
Table 5.
Two-level classifier classification using kNN as A-level classifier.
Table 6.
Two-level classifier classification using RF as A-level classifier.
Table 7.
Two-level classifier classification using SMO as A-level classifier.
Finally, to illustrate the efficacy of the two-level classification algorithm, we compared it against the performance of single learning algorithms. Notice that two-level stands for the proposed two-level classification scheme using RF as A-level and kNN and RF as B-level and B-level classifiers, respectively.
Table 8 summarizes the accuracy of each individual classifier which reveals the efficacy of our two-level classifier. Clearly, the proposed scheme significantly outperforms all single classifiers, exhibiting higher classification performance.
Table 8.
Performance of each individual classifier.
Moreover, we demonstrate the classification accuracy of the proposed algorithm with a more traditional approach, comparing the confusion matrix of two-level classification scheme with that of best single classifier (RF). Notice that confusion matrix gives an additional information about classes which are commonly mislabeled one as another. Table 9 and Table 10 present the confusion matrices of the two-level classification scheme and RF, respectively.
Table 9.
Confusion matrix of two-level classifier.
Table 10.
Confusion matrix of the best single classifier (RF).
The interpretation of these tables illustrates that the proposed algorithm exhibits significantly better classification accuracy for patients which stayed in the hospital for one or two days. More specifically, the proposed algorithm correctly classified 84.7% and 79.6% of the patients which stayed in the hospital for one and two days, respectively; while RF classified only 74% and 72%, respectively. Moreover, for patients who hospitalized for more than two days, the presented two-level classification scheme presented considerably better performance, correctly classifying 71.1%, 67.3%, 66.7% and 79.2% of patients which were hospitalized for three, four, five and more than five day; while RF classified 68.5%, 64.4%, 64.7%, 76.1% in the same situations.
Based on the above discussion, we can conclude that the proposed two-level scheme performs significantly better than any presented single classifier for this specific imbalanced dataset for patients which stayed in the hospital for one and two days; while it exhibits considerably better classification performance for patients who hospitalized for more than two days.
5. Decision Support System for Forecasting Patients’ LoS
For this study, we developed a user-friendly decision support software (The tool is available at http://www.math.upatras.gr/~livieris/LoS.zip Notice that Java Virtual Machine (JVM) 1.2 or newer is needed for the execution of the program.) which adopts the presented two-level classifier, for forecasting hospitalized patients’ length of stay, trained with the data presented in our study. Notice that the proposed classification scheme is implemented using RF as A-level classifier and kNN and RF as B-level and B-level classifiers, respectively. The software is based on the WEKA 3.9 Machine Learning Toolkit [34] and has been developed in Java, making it platform independent and easily executed even by non-experienced users. Figure 3 illustrates a screenshot of our proposed decision support software illustrating its main features.
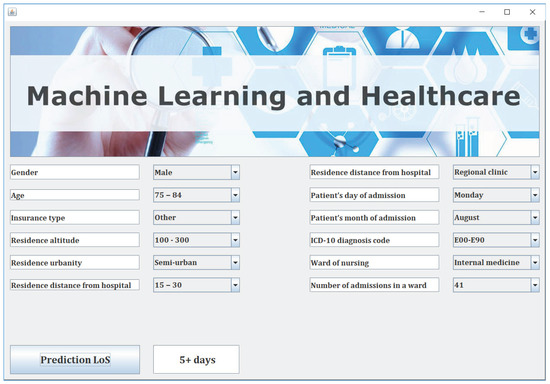
Figure 3.
Decision support system for forecasting patients’ length of stay.
Next, the user imports the information about each patient by using the combo boxes and the DSS predicts the patient’s LoS by a simple user click on the button “Prediction LoS” as it is illustrated in Figure 3.
6. Conclusions
In this work, we presented a user-friendly decision support system for the prediction of hospitalized patients LoS which incorporates a two-level machine learning classifier. Our numerical experiments revealed that the proposed classification technique exhibits better classification accuracy compared to some of the most popular and commonly used individual classification algorithms. Significant advantages of the presented software are the employment of a simple and user-friendly interface, its scalability due to its modular nature of design and implementation and its operating system neutrality. It is worth recalling that our expectation is that this work could be used as a reference for decision making in the admission process and strengthen the service system in hospitals by offering customized assistance according to patients’ predicted hospitalization time.
It is worth mentioning that the patients’ attributes used in this work do not constitute a conclusive list. Currently, an updated version of the software is under design, providing the user with an even friendlier interface with new features and allowing him to introduce new attributes and other criteria. Therefore, the user would be able to import his/her own training data or even select specific classifiers used at each level. This extension could possibly introduce new attributes and other criteria such as vital signs or lab readings at the time of admission, which were not in the current database, but are collectable by medical staff and may potentially influence the performance and the quality of the prediction.
Since our experimental results are quite encouraging, a next step could be to enlarge our database with data from more hospitals and more years and apply machine learning methods to predict LoS and extract the factors affecting it among various types of patients. Additionally, to address the problem of imbalanced dataset and further increase the accuracy of the proposed two-level classifier, we commit to incorporate techniques dedicated for imbalanced data such as feature selection, sampling, cost-sensitive learning, and instance weighting [35,36,37,38,39,40]. Furthermore, an interesting aspect of future research is to update the presented software to provide on demand explanation of what are the underlying explanatory factors for reaching a certain prediction/decision [41]. The development of a contextual explanatory model could further assist medical staff in the decision-making process.
Author Contributions
I.E.L., T.K., I.D. and P.P. conceived of the idea, designed and performed the experiments, analyzed the results, drafted the initial manuscript and revised the final manuscript.
Funding
This research received no external funding.
Conflicts of Interest
The authors declare no conflict of interest.
References
- Livieris, I.; Dimopoulos, I.; Kotsilieris, T.; Pintelas, P. Predicting length of stay in hospitalized patients using SSL algorithms. In Proceedings of the ACM 8th International Conference on Software Development and Technologies for Enhancing Accessibility and Fighting Infoexclusion, Thessaloniki, Greece, 20–22 June 2018; pp. 1–8. [Google Scholar]
- Hachesu, P.R.; Ahmadi, M.; Alizadeh, S.; Sadoughi, F. Use of data mining techniques to determine and predict length of stay of cardiac patients. Healthc. Inform. Res. 2013, 19, 121–129. [Google Scholar] [CrossRef] [PubMed]
- Bakheet, S. An SVM framework for malignant melanoma detection based on optimized hog features. Computation 2017, 5, 4. [Google Scholar] [CrossRef]
- Bright, T.; Wong, A.; Dhurjati, R.; Bristow, E.; Bastian, L.; Coeytaux, R.; Samsa, G.; Hasselblad, V.; Williams, J.; Musty, M. Effect of clinical decision-support systems: A systematic review. Ann. Intern. Med. 2012, 157, 29–43. [Google Scholar] [CrossRef] [PubMed]
- Danilov, A.; Pryamonosov, R.; Yurova, A. Image segmentation for cardiovascular biomedical applications at different scales. Computation 2016, 4, 35. [Google Scholar] [CrossRef]
- Hassan, M.; Hamada, M. Performance comparison of feed-forward neural networks trained with different learning algorithms for recommender systems. Computation 2017, 5, 40. [Google Scholar] [CrossRef]
- Moja, L.; Kwag, K.; Lytras, T.; Bertizzolo, L.; Brandt, L.; Pecoraro, V.; Rigon, G.; Vaona, A.; Ruggiero, F.; Mangia, M. Effectiveness of computerized decision support systems linked to electronic health records: A systematic review and meta-analysis. Am. J. Public Health 2014, 104, 12–22. [Google Scholar] [CrossRef] [PubMed]
- Awad, M.; Motai, Y.; Näppi, J.; Yoshida, H. A clinical decision support framework for incremental polyps classification in virtual colonoscopy. Algorithms 2010, 3, 1–20. [Google Scholar] [CrossRef]
- Sintchenko, V.; Iredell, J.; Gilbert, G.; Coiera, E. Handheld computer-based decision support reduces patient length of stay and antibiotic prescribing in critical care. J. Am. Med. Inform. Assoc. 2005, 12, 398–402. [Google Scholar] [CrossRef]
- Marakas, G. Decision Support Systems in the 21st Century; Prentice Hall: Upper Saddle River, NJ, USA, 2003; Volume 134. [Google Scholar]
- Chuang, M.; Hu, Y.; Lo, C. Predicting the prolonged length of stay of general surgery patients: A supervised learning approach. Int. Trans. Oper. Res. 2018, 25, 75–90. [Google Scholar] [CrossRef]
- Gustafson, D. Length of Stay: Prediction and Explanation. Health Serv. Res. 1968, 3, 12–34. [Google Scholar]
- Morton, A.; Marzban, E.; Giannoulis, G.; Patel, A.; Aparasu, R.; Kakadiaris, I. A comparison of supervised machine learning techniques for predicting short-term in-hospital length of stay among diabetic patients. In Proceedings of the 13th International Conference on Machine Learning and Applications, Detroit, MI, USA, 3–6 December 2014; pp. 428–431. [Google Scholar]
- Awad, A.; Bader-El-Den, M.; McNicholas, J. Patient length of stay and mortality prediction: A survey. Health Serv. Manag. Res. 2017, 30, 105–120. [Google Scholar] [CrossRef] [PubMed]
- Tsai, P.; Chen, P.; Chen, Y.; Song, H.; Lin, H.; Lin, F.; Huang, Q. Length of Hospital Stay Prediction at the Admission Stage for Cardiology Patients Using Artificial Neural Network. J. Healthc. Eng. 2016. [Google Scholar] [CrossRef] [PubMed]
- Muhlestein, W.; Akagi, D.; Davies, J.; Chambless, L. Predicting Inpatient Length of Stay After Brain Tumor Surgery: Developing Machine Learning Ensembles to Improve Predictive Performance. Neurosurgery 2018. [Google Scholar] [CrossRef] [PubMed]
- Yakovlev, A.; Metsker, O.; Kovalchuk, S.; Bologova, E. Prediction of in-hospital mortality and length of stay in acute cornary syndrome patients using machine learning methods. J. Am. Coll. Cardiol. 2018, 71, A242. [Google Scholar] [CrossRef]
- World Health Organization. International Statistical Classification of Diseases and Related Health Problems; World Health Organization: Geneva, Switzerland, 2004; Volume 1. [Google Scholar]
- Lagoe, R.; Westert, G.; Kendrick, K.; Morreale, G.; Mnich, S. Managing hospital length of stay reduction: A multihospital approach. Health Care Manag. Rev. 2005, 30, 82–92. [Google Scholar] [CrossRef]
- Kuncheva, L. “Change-glasses” approach in pattern recognition. Pattern Recognit. Lett. 1993, 14, 619–623. [Google Scholar] [CrossRef]
- Livieris, I.; Drakopoulou, K.; Kotsilieris, T.; Tampakas, V.; Pintelas, P. DSS-PSP–A Decision Support Software for Evaluating Students’ Performance. In Engineering Applications of Neural Networks; Springer: Berlin, Germany, 2017; pp. 63–74. [Google Scholar]
- Tampakas, V.; Livieris, I.; Pintelas, E.; Karacapilidis, N.; Pintelas, P. Prediction of students’ graduation time using a two-level classification algorithm. In Proceedings of the 1st International Conference on Technology and Innovation in Learning, Teaching and Education, Thessaloniki, Greece, 20–22 June 2018; pp. 1–7. [Google Scholar]
- Xu, L.; Suen, A.K.C. Methods of combining multiple classifiers and their applications to handwriting recognition. IEEE Trans. Syst. Man Cybern. 1992, 22, 418–435. [Google Scholar] [CrossRef]
- Rotter, T.; Kinsman, L.; James, E.; Machotta, A.; Gothe, H.; Willis, J.; Snow, P.; Kugler, J. Clinical pathways: Effects on professional practice, patient outcomes, length of stay and hospital costs. Cochrane Database Syst. Rev. 2010, 3, CD006632. [Google Scholar] [CrossRef]
- Domingos, P.; Pazzani, M. On the optimality of the simple Bayesian classifier under zero-one loss. Mach. Learn. 1997, 29, 103–130. [Google Scholar] [CrossRef]
- Rumelhart, D.; Hinton, G.; Williams, R. Learning internal representations by error propagation. In Parallel Distributed Processing: Explorations in the Microstructure of Cognition; Rumelhart, D., McClelland, J., Eds.; MIT Press: Cambridge, MA, USA, 1986; pp. 318–362. [Google Scholar]
- Platt, J. Using analytic QP and sparseness to speed training of support vector machines. In Advances in Neural Information Processing Systems; Kearns, M., Solla, S., Cohn, D., Eds.; MIT Press: Cambridge, MA, USA, 1999; pp. 557–563. [Google Scholar]
- Aha, D. Lazy Learning; Kluwer Academic Publishers: Dordrecht, The Netherlands, 1997. [Google Scholar]
- Ho, T. Random decision forests. In Proceedings of the 3rd International Conference on Document Analysis and Recognition 1995, Montreal, QC, Canada, 14–16 August 1995; Volume 1, pp. 278–282. [Google Scholar]
- Wu, X.; Kumar, V.; Quinlan, J.; Ghosh, J.; Yang, Q.; Motoda, H.; McLachlan, G.; Ng, A.; Liu, B.; Yu, P.; et al. Top 10 algorithms in data mining. Knowl. Inf. Syst. 2008, 14, 1–37. [Google Scholar] [CrossRef]
- Sokolova, M.; Japkowicz, N.; Szpakowicz, S. Beyond accuracy, F-score and ROC: A family of discriminant measures for performance evaluation. In Australian Conference on Artificial Intelligence; Springer: Berlin/Heidelberg, Germany, 2006; Volume 4304, pp. 1015–1021. [Google Scholar]
- Witten, I.; Frank, E. Data Mining: Practical Machine Learning Tools and Techniques with Java Implementations; Morgan Kaufmann Series in Data Management Systems; Elsevier: Amsterdam, The Netherlands, 2005. [Google Scholar]
- Russell, S.; Norvig, P. Artificial Intelligence: A Modern Approach, 3rd ed.; Pearson: London, UK, 2016. [Google Scholar]
- Hall, M.; Frank, E.; Holmes, G.; Pfahringer, B.; Reutemann, P.; Witten, I. The WEKA data mining software: An update. SIGKDD Explor. Newsl. 2009, 11, 10–18. [Google Scholar] [CrossRef]
- Krawczyk, B.; Galar, M.; Jeleń, Ł.; Herrera, F. Evolutionary undersampling boosting for imbalanced classification of breast cancer malignancy. Appl. Soft Comput. 2016, 38, 714–726. [Google Scholar] [CrossRef]
- Krawczyk, B. Learning from imbalanced data: Open challenges and future directions. Prog. Artif. Intell. 2016, 5, 221–232. [Google Scholar] [CrossRef]
- Krawczyk, B.; Woźniak, M.; Schaefer, G. Cost-sensitive decision tree ensembles for effective imbalanced classification. Appl. Soft Comput. 2014, 14, 554–562. [Google Scholar] [CrossRef]
- Krawczyk, B.; Schaefer, G.; Woźniak, M. A hybrid cost-sensitive ensemble for imbalanced breast thermogram classification. Artif. Intell. Med. 2015, 65, 219–227. [Google Scholar] [CrossRef]
- Nguyen, T.T.; Hwang, D.; Jung, J.J. Handling imbalanced classification problem: A case study on social media datasets. J. Intell. Fuzzy Syst. 2017, 32, 1437–1448. [Google Scholar] [CrossRef]
- Sáez, J.A.; Krawczyk, B.; Woźniak, M. Analyzing the oversampling of different classes and types of examples in multi-class imbalanced datasets. Pattern Recognit. 2016, 57, 164–178. [Google Scholar] [CrossRef]
- Holzinger, A.; Kieseberg, P.; Weippl, E.; Tjoa, A. Current Advances, Trends and Challenges of Machine Learning and Knowledge Extraction: From Machine Learning to Explainable AI. In International Cross-Domain Conference for Machine Learning and Knowledge Extraction; Springer: Berlin, Germany, 2018; pp. 1–8. [Google Scholar]
© 2018 by the authors. Licensee MDPI, Basel, Switzerland. This article is an open access article distributed under the terms and conditions of the Creative Commons Attribution (CC BY) license (http://creativecommons.org/licenses/by/4.0/).