Article

The Chromatin Structure at the MECP2 Gene and In Silico Prediction of Potential Coding and Non-Coding MECP2 Splice Variants

Department of Biochemistry and Medical Genetics, Max Rady College of Medicine, Rady Faculty of Health Sciences, University of Manitoba, Winnipeg, MB R3E 0J9, Canada
*
Author to whom correspondence should be addressed.
Int. J. Mol. Sci. 2022, 23(24), 15643; https://doi.org/10.3390/ijms232415643
Submission received: 1 November 2022 / Revised: 30 November 2022 / Accepted: 5 December 2022 / Published: 9 December 2022

Abstract

:
Methyl CpG binding protein 2 (MeCP2) is an epigenetic reader that binds to methylated CpG dinucleotides and regulates gene transcription. Mecp2/MECP2 gene has 4 exons, encoding for protein isoforms MeCP2E1 and MeCP2E2. MeCP2 plays key roles in neurodevelopment, therefore, its gain- and loss-of-function mutations lead to neurodevelopmental disorders including Rett Syndrome. Here, we describe the structure, functional domains, and evidence support for potential additional alternatively spliced MECP2 transcripts and protein isoforms. We conclude that NCBI MeCP2 isoforms 3 and 4 contain certain MeCP2 functional domains. Our in silico analysis led to identification of histone modification and accessibility profiles at the MECP2 gene and its cis-regulatory elements. We conclude that the human MECP2 gene associated histone post-translational modifications exhibit high similarity between males and females. Between brain regions, histone modifications were found to be less conserved and enriched within larger genomic segments named as “S1–S11”. We also identified highly conserved DNA accessibility regions in different tissues and brain regions, named as “A1–A9” and “B1–B9”. DNA methylation profile was similar between mid-frontal gyrus of donors 35 days–25 years of age. Based on ATAC-seq data, the identified hypomethylated regions “H1–H8” intersected with most regions of the accessible chromatin (A regions).

Graphical Abstract

1. Introduction

Gene regulation is a complex process, controlled at multiple different layers including: the pre-, post-, and/or intra-transcriptional levels, followed by several translational and pos-translational regulation steps. These processes would help individual eukaryotic cells to control and determine their number of transcripts and protein levels [1,2,3].
Gene transcription is mainly controlled by corresponding cis-regulatory elements (cis-REs) and trans-acting transcription factors [3]. In general, cis-regulatory elements are considered as DNA binding sites for trans-acting factors. When associated, these can initiate, regulate, and terminate gene transcription. Cis-regulatory elements include promoters (core, proximal, and distal), enhancers, silencers, and insulators. The core promoters encompass the TATA box, B recognition element (BRE), downstream promoter element (DPE) and Initiator element (Inr). These sequences are located relative to the transcription start site (TSS). Core promoter elements consist of essential binding sites for RNA transcription machinery, and act in an orientation-dependent manner [4,5]. Enhancers stimulate gene expression and can be located close or far from the gene, and act in an orientation- independent manner, while silencers act as suppressors of gene expression. Insulator elements prevent improper interactions between enhancers or silencers and other non-target genes [6]. Proximal promoter is located upstream of the core promoter and may function as the tethering sequence that assists in the interaction between enhancers and core promoter elements [4,7], while distal promoters’ location can be more than 1 kilobase (kb) upstream of the TSS.
Epigenetic control refers to gene regulatory mechanisms that do not directly involve DNA nucleotide sequences within a gene, and may include conformational change in the chromatin structure [8]. Epigenetic modifications include different forms of DNA methylations (such as 5-methyl cytosine [5-mC] and 5-hydroxy-methyl cytosine [5-hmC]) as well as methylation, acetylation, ubiquitination, SUMOylation, and phosphorylation of histones [9]. The high abundance of 5-mC in the promoters is generally associated with transcriptional inhibition through: (a) preventing the transcription activator binding, (b) recruitment of co-repressive complexes, and the (c) crosstalk with post-transcriptional modifications. Unlike 5-mC, 5-hmC abundance is mainly associated with active chromatin conformational state. In addition to gene regulation, DNA methylation is also important for X-chromosome inactivation, genome organization, imprinting, and RNA splicing [9].
Epigenetic factors include epigenetic “writers”, “erasers”, and “readers” [3,10]. Epigenetic writers are enzymes that can add certain functional groups to DNA nucleotides or histone proteins, while erasers are enzymes that remove or alter these modifications. Epigenetic readers recognize these DNA or histone modifications and may employ additional factors to regulate gene transcription [11,12].
Methyl CpG binding protein 2 (MeCP2) is a nuclear epigenetic reader that can bind to methyl-CpG dinucleotides and employ other proteins to alter the activity of gene transcription [3]. In humans, MeCP2 protein is encoded by the MECP2 gene located on the X-q28 (National Center for Biotechnology Information [NCBI], Gene 4204), while in mice (Mus musculus) it is produced from the Mecp2 gene located on the X A7.3 (NCBI, Gene 17257). The MECP2/Mecp2 gene has 4 exons, currently known to encode for two main protein isoforms, MeCP2E1 (E1) and MeCP2E2 (E2), produced by alternative splicing. MeCP2E1 (also known as MeCP2α or M2CP2B) is translated from a transcript variant, which includes exons 1, 3, and 4, with a translation start site within the exon 1. MeCP2E2 (also known as MeCP2β or MeCP2A) is translated from a transcript variant, that includes exons 1–4 (and mature transcript with exons 2, 3, 4) and a translation start site located in exon 2 [13]. In addition to these two alternative splicing isoforms, several different 3′UTR isoforms result from alternative polyadenylation both in mice and humans [14].
MeCP2 was first discovered in rats by Dr. Adrian Bird and his team as a protein that can sufficiently bind to a single methyl-CpG site [15], whereas previously discovered MeCP1 required over 10 methylated CpG nucleotide pairs to efficiently bind to DNA [16]. It was later identified that MeCP2 has an equally high affinity for both 5-mC and 5-hmC [17]. MeCP2 can also bind to unmethylated DNA [18], and condensed chromatin by interacting with the linker DNA between nucleosomes [19]. When bound to DNA, MeCP2 recruits other factors including mSin3a co-repressor, histone deacetylases HDAC1 and HDAC2 [20], and histone methyltransferases [21], to condense the chromatin. Other MeCP2 co-repressors include SMRT [22], N-CoR [23], and ATRX [24]. MeCP2 may also interact with TFIIB to negatively regulate gene transcription [25], while impacting global transcription [26], and protein translation [26,27], with additional links to fundamental cell signaling pathways [27,28]. In addition to acting as a negative regulator of gene transcription, MeCP2 also acts as a transcriptional gene activator reported in mice hypothalamus [29]. This suggests that loss-of-function mutations in the MECP2/Mecp2 gene may result in both up-regulation of some genes and downregulation of others, and consequently cellular dysfunction, where MeCP2 is most abundant.
MeCP2 relative abundance is highest in the brain (especially in mature neurons), lungs, and spleen [30], with MeCP2 levels being controlled by tissue- and cell type-specific regulatory mechanisms [30,31,32,33,34,35]. Brain region- and cell type-specific expression of MeCP2 isoforms correlate with DNA methylation of CpG sites within cis-regulatory elements in the mouse Mecp2 promoter and the first intron [31,32,35,36]. It has been suggested that MeCP2 homeostasis regulation in the brain is region-dependent and might be based on the MECP2-BDNF-miR132 feedback regulatory loop [37], although correlational studies in humans do not support such a feedback regulatory loop [38]. In mouse and human brains, the timing of MeCP2 expression correlates with the development of the central neural system with preliminary expression in the brainstem and spinal cord, and later expression in the cerebral cortex and hippocampus [30]. MeCP2 expression in the cerebral cortex has also been shown to associate with the maturation of neurons [30]. Isoform-specific expression analysis of primary murine brain cells showed that in male neurons, Mecp2e1 is the major isoform with about 3-fold higher levels than Mecp2e2 [34]. MeCP2 expression throughout development is different between mice and humans. In humans, the increase in percentage of MeCP2 positive neurons is observed up to 10 years of age with the highest increase during gestation. While in mice, such increase was confined to the embryogenesis stage with the maximum number of MeCP2 expression in neurons by E18.5 (embryonic stage). The reason for this might be a longer period of developmental plasticity in humans, suggesting that MeCP2 might alter the expression of the genes important for neuronal development [30,39]. MECP2 is regulated both transcriptionally and post-transcriptionally [27,37,40].
As MeCP2 is highly involved in neurodevelopment, either dysfunction or increased dose of MeCP2 protein levels caused by genetic mutations may lead to a variety of neural pathological abnormalities. Rett Syndrome (RTT) is caused by missense, nonsense, and/or frameshift loss-of-function mutations in the MECP2 gene [37,41,42]. RTT is a neurodevelopmental disease occurring almost exclusively in females, although rare cases of male patients are also reported even until adulthood [37,43,44]. Rett Syndrome is characterized by initial normal development followed by stagnation and deterioration of brain functions between 6 to 18 months of development. By the age of 1.5 years, RTT patients experience autism, dementia, truncal ataxia, acquired microencephaly and loss of purposeful use of hands and verbal communication ability [45]. MECP2 duplications cause MECP2 Duplication Syndrome in males. The symptoms include hypotonia, mental disability, mild dysmorphic features such as depressed nasal bridge, upturned nares, large ears, ataxia, and autistic features [46]. This suggests that MeCP2 must be appropriately balanced throughout development.
As indicated, the two known MeCP2 isoforms (E1 and E2) are produced by alternative splicing. Additional potential isoforms of MeCP2 have not been fully explored, even though large data depositories such as NCBI, Ensembl, and UniProt list more than two potential protein-coding MECP2 transcript variants.
The National Centre of Biotechnology (NCBI) is part of the National Library of Medicine. It is a large data depository composed of interconnected sub-databases dedicated to genes, gene products, homology, and taxonomy, among others. NCBI offers a wide variety of automated algorithms and pipelines to make data annotation autonomous which makes it possible to update the database daily. NCBI Reference Sequence (RefSeq) database is a project curated by NCBI staff aiming to provide a frequently updated, non-redundant, and thoroughly annotated set of reference standards which are obtained from the International Nucleotide Sequence Database Collaboration (INSDC). The main difference between INSDC and NCBI RefSeq is that while INSDC is an archival repository containing many versions of the same sequences, NCBI RefSeq consists of the most recently updated chromosomal, genomic, and protein sequences [47]. In RefSeq, all sequences can be divided into the model- and known sequences. Model sequences are generated from the eukaryotic genome annotation pipeline and have the following accession number styles: XM_, XR_, XP_ (underscore in the accession number defines sequence as a part of RefSeq). Known sequences are derived from GenBank EST and cDNA data and then are reviewed by NCBI members; such sequences use the following accession number styles: NM_, NR_, and NP_ [47]. All RefSeq records contain universal data evidence code and link to original RNA-seq data that was used to derive a given sequence.
Ensembl is another project targeted at the automatization of genome annotation. The main goal of Ensembl has been the integration of annotation with other available data and making it accessible to the public. Regarding the annotation workflow, Ensembl is very similar to NCBI RefSeq. The sequencing data are automatically processed from large data archive repositories such as INSDC, dbSNP, GTEx, and Roadmap Epigenomics and then it is reviewed by their staff [48].
The Universal Protein Resource (UniProt) is a database composed of UniProt Reference Clusters (UniRef), UniProt Archive (UniParc), and UniProt Knowledgebase (UniProtKB). UniProt is based on the collaboration between the European Bioinformatics Institute (EMBL-EBI), Protein Information Institute (PIR), and the Swiss Institute of Bioinformatics (SIB). UniProtKB is further subdivided into Swiss-Prot and TrEMBL. TrEMBL (Translated EMBL Nucleotide Sequence Data Library) is composed of automatically annotated unreviewed sequences from EMBL, GenBank, DDBJ, Ensembl, etc., while SwissProt contains reviewed sequences from TrEMBL that have passed expert manual annotation [49].
In addition to in vitro or in vivo research, bioinformatic approaches can be used to filter, organize, and visualize publicly available whole-genome or epigenome sequencing data when such techniques are not available. Database portals such as ENCODE (www.encodeproject.org) and NCBI (www.ncbi.nlm.nih.gov) contain sub-databases dedicated to raw data from numerous types of publicly available sequencing experiments. Raw sequencing data files are provided in the format that specifies some value to a region or nucleotide position on a certain version of the organism genome. One of the easiest ways to visualize such data is to use pc- or online-based genome browsers such as UCSC Genome Viewing Browser [50] or IGV [51]. Genome viewing browsers read the raw format files and automatically overlay the values from the file onto the genome based on the nucleotide positions in each chromosome. Additionally, genome viewing browsers allow visualizing multiple different data files for a given chromosomal region, thus making it possible for a researcher to correlate the values and make predictions that might be relevant to their wet laboratory research. Genome viewing browsers do not require any advanced knowledge in bioinformatics or any programming language, as they provide a user-friendly and intuitive interface.
Despite the importance of MeCP2 in health and disease, our knowledge about MECP2 coding and non-coding transcripts and protein isoforms is currently inconclusive. The objectives of this study were to analyze the potential MeCP2 protein isoforms using collection and integration of data from multiple databases. We also aimed to investigate MECP2 cis-regulatory elements by using whole genome sequencing data to assess the availability of chromatin structure around and within the MECP2 gene.

2. Results

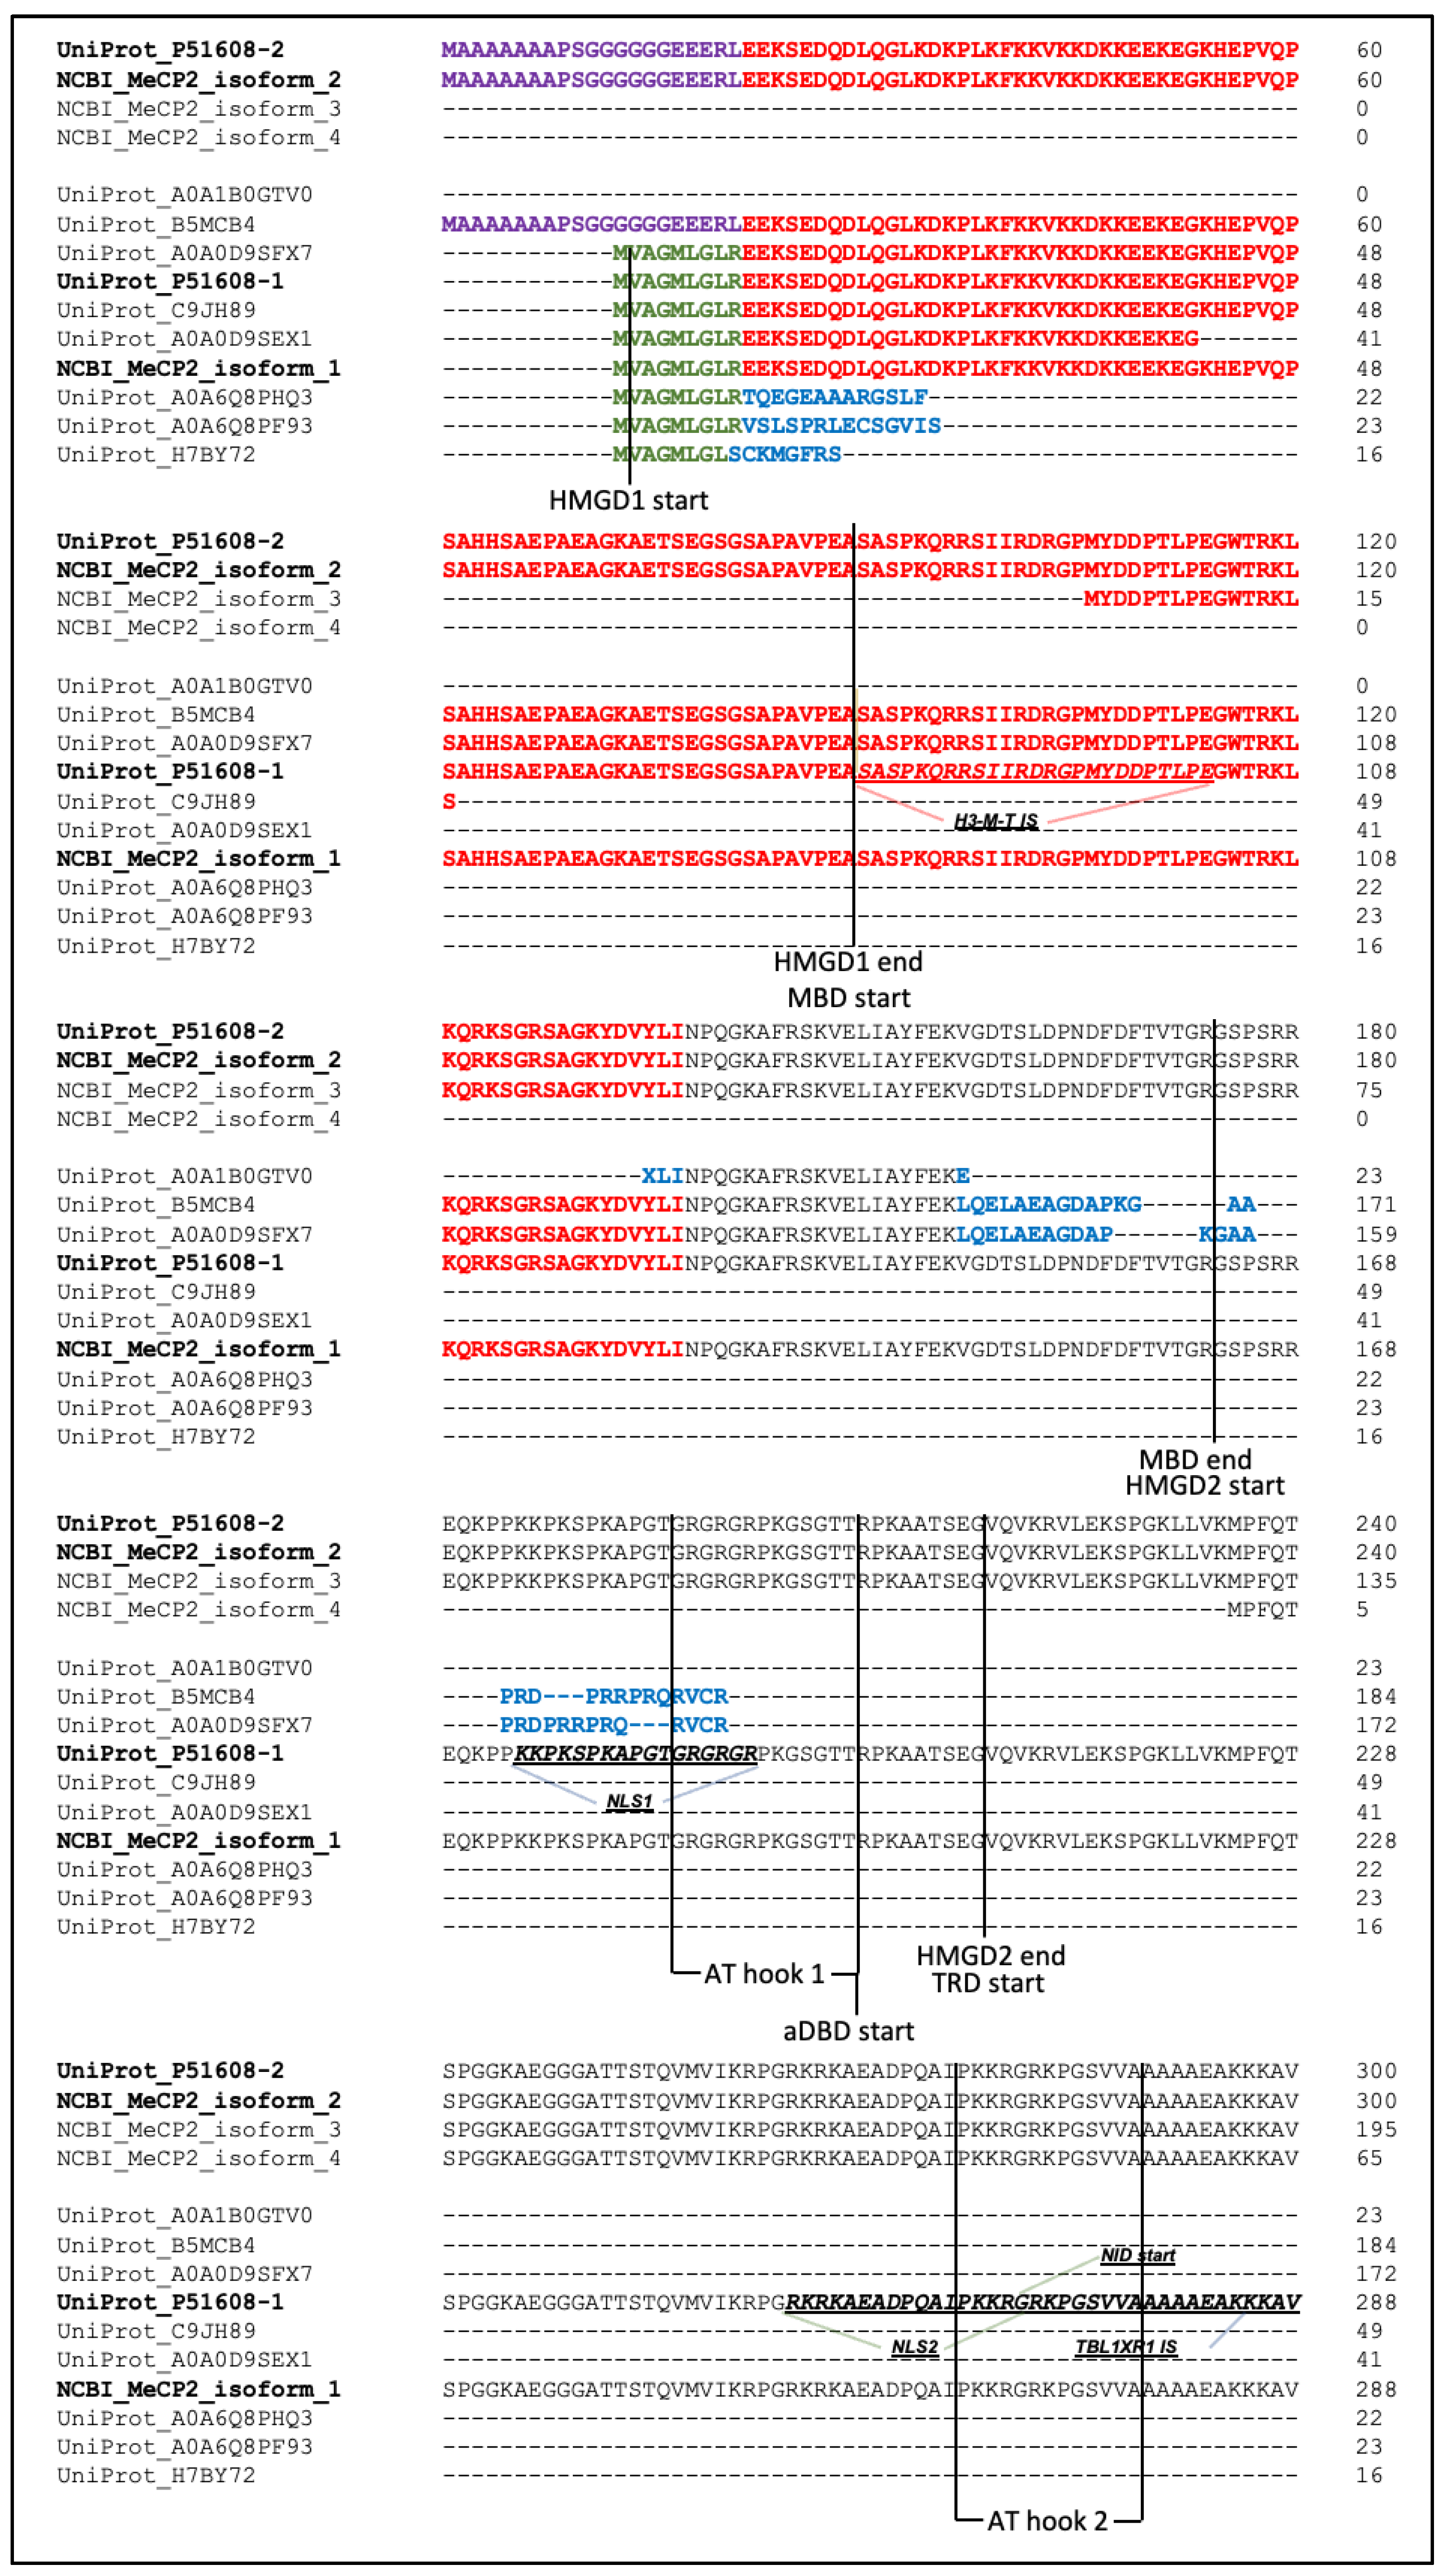
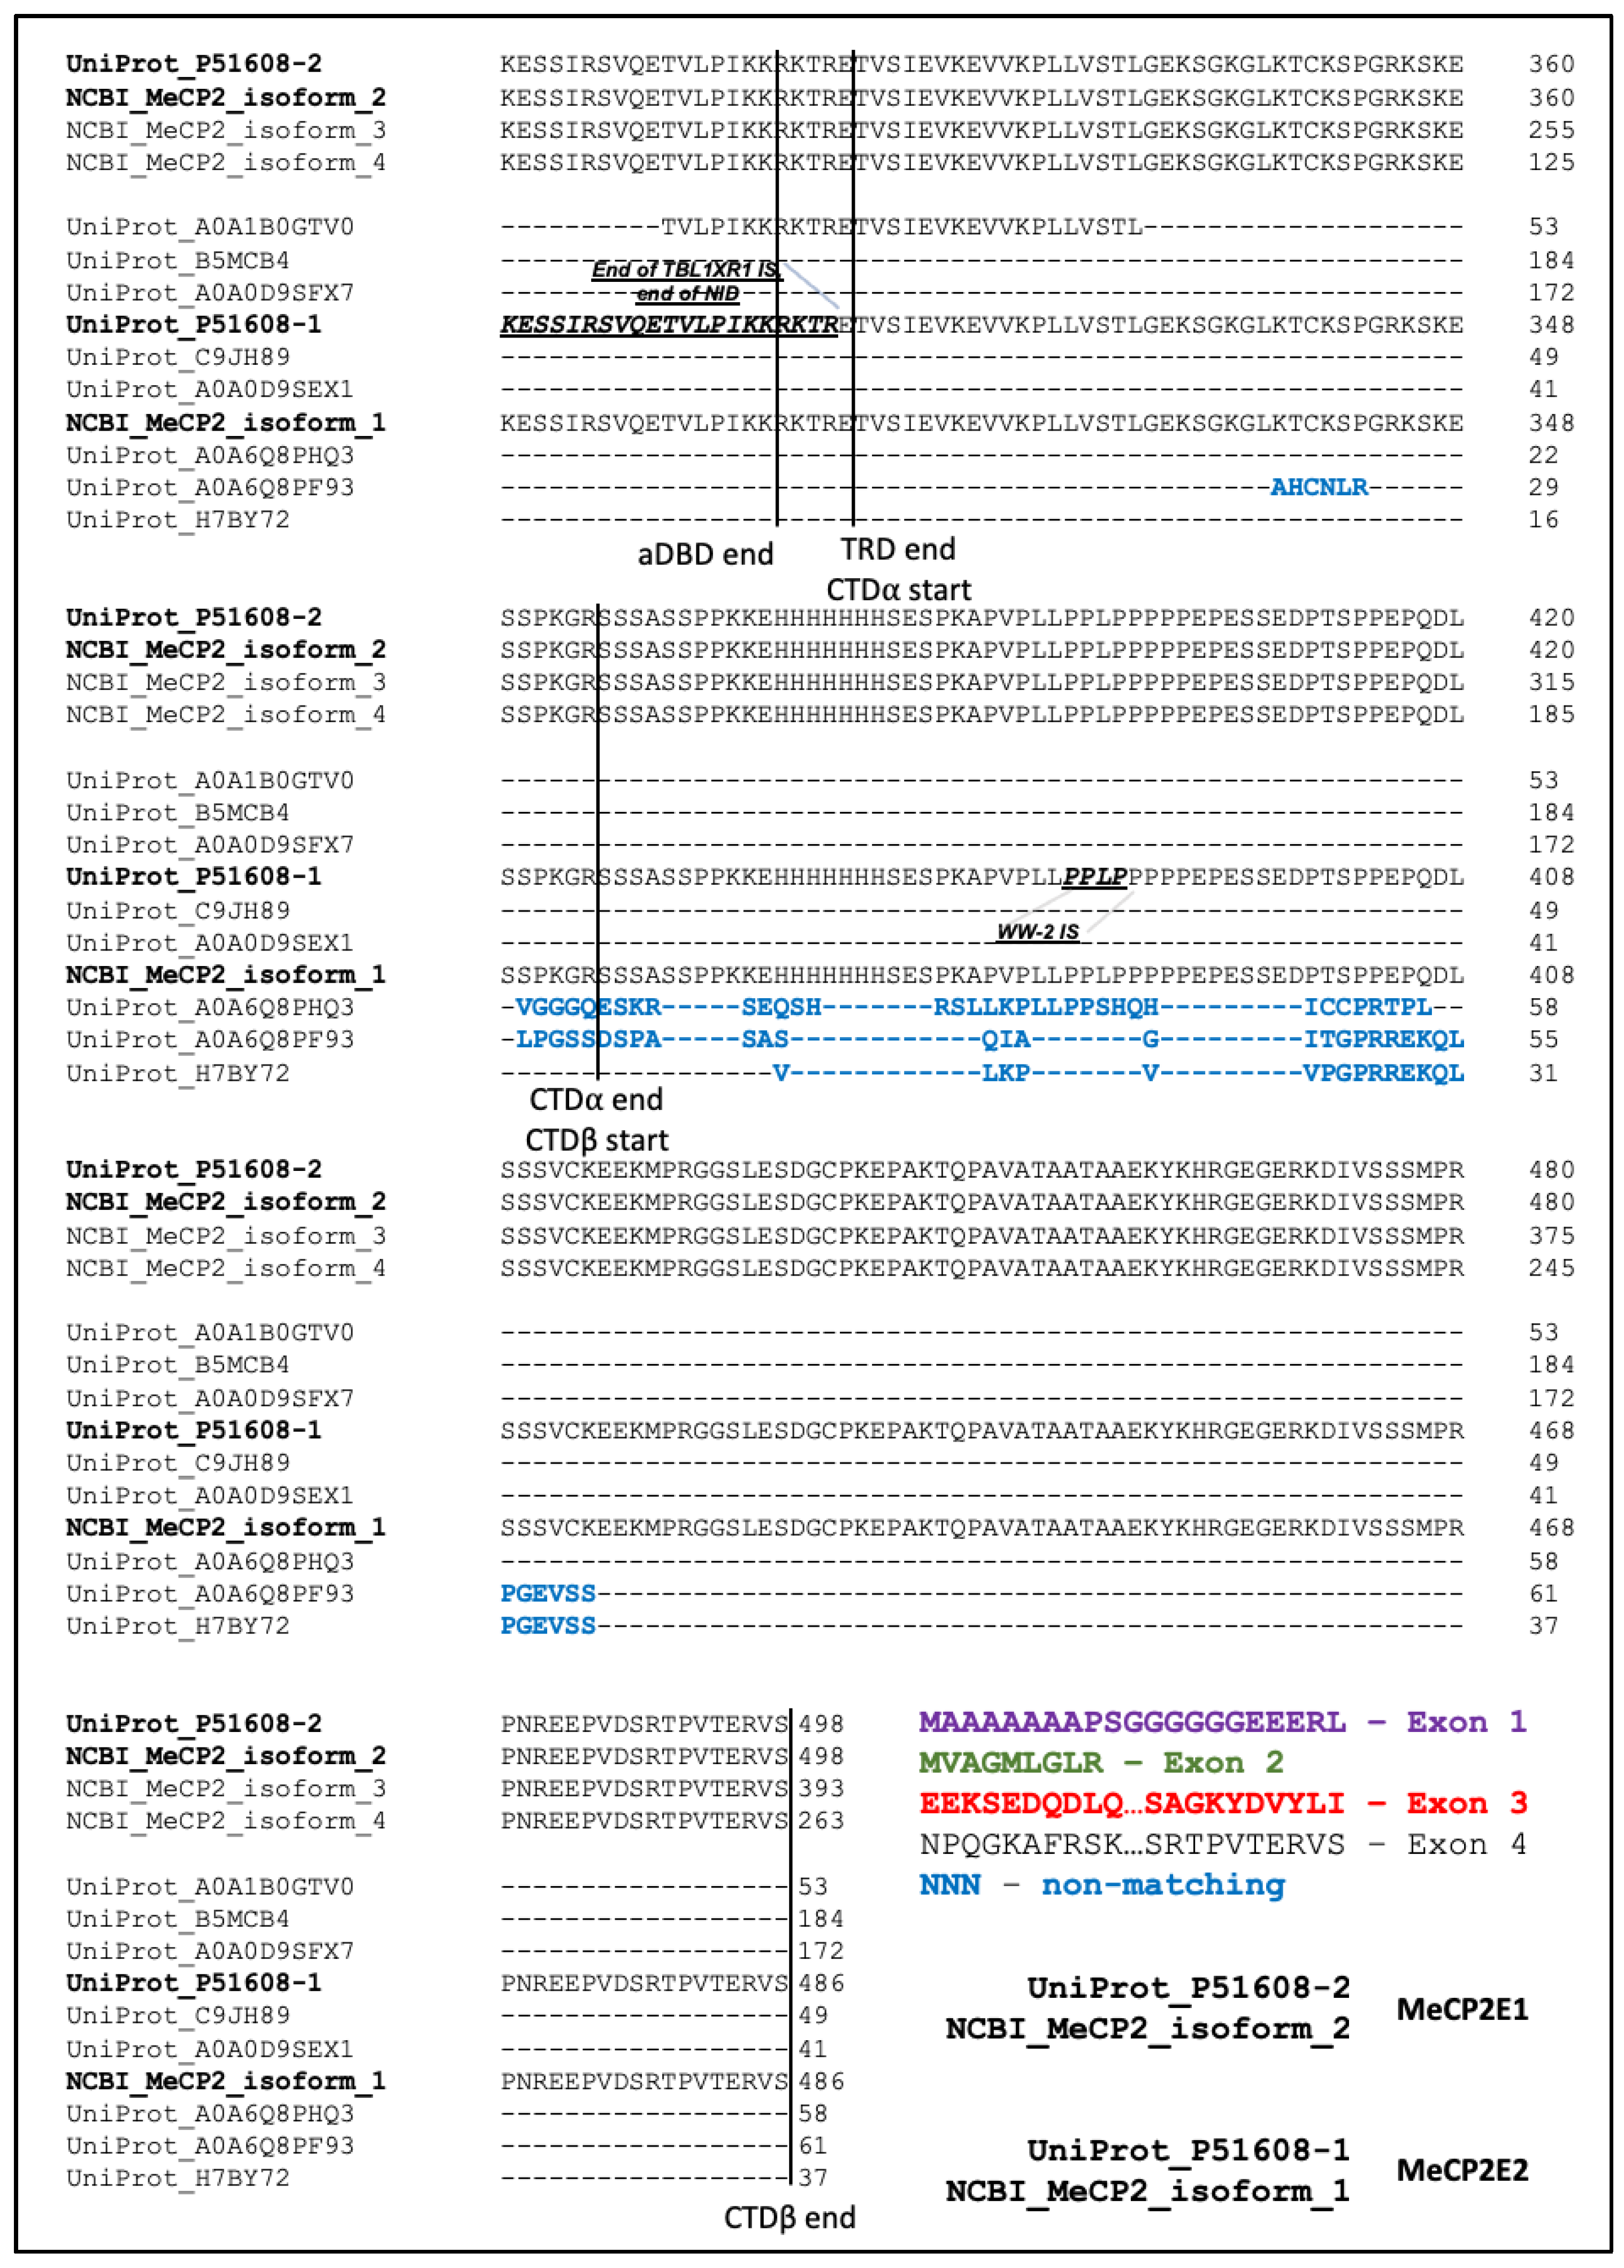
2.1. MECP2 Transcripts and Encoded Protein Isoforms

To study potential MECP2 transcript variants, we first examined data from NCBI records via a summary of the extracted information presented in Table 1. NCBI records for the human MECP2 gene (Gene ID: 4204) listed reviewed variants from RefSeq database (NM_). All NM_ variants listed in NCBI were declared to be protein-coding sequences and have respective protein isoforms.
The transcript variant 1 contains all 4 exons and translates to protein isoform 1 (MeCP2A or MeCP2E2). Protein translation from this transcript starts in exon 2 at a “dominant” downstream to exon 1 start codon which results in exon 1 exclusion from the protein. The transcript variant 2 results from an alternative splicing event of pre-mRNA, which excludes exon 2. Protein translation starts at the upstream start codon in exon 1 resulting in protein isoform 2 (MeCP2B or MeCP2E1). According to sequence alignment (Figure 1), these two isoforms differ in their N-termini. Isoform 2 (MeCP2E1) has 21 amino acids whereas isoform 1 (MeCP2E2) has 9 distinctive amino acids. Other than that, the two protein isoforms 1 and 2 are identical. These two isoforms are well described in the literature due to their relevance to neurodevelopmental disorders [13,33,36,38,52,53,54].
NCBI also lists eight more transcript variants potentially translating to two more protein isoforms. Transcript variants 3–7 include all 4 exons. In which, these variants are predicted to produce isoform 3 with a shorter N-terminus compared to isoform 1. Transcript variants 8–10, all produced at the translation start site within exon 4, all translate to protein isoform 4.
Another set of records were analyzed from UniProt, which lists 10 potential MeCP2 isoforms based on P51608 (MECP2_HUMAN) [49]. Of these, only the 2 transcripts P51608-1 and P51608-2 are reviewed. P51608-1 and P51608-2 are identical to isoforms 1 (MeCP2E2) and 2 (MeCP2E1), respectively, from NCBI as evident from the alignment (Figure 1). The rest of the isoforms presented in UniProt are computationally predicted. B5MCB4 is translated from the same start codon as MeCP2E1 and hence contains amino acids coded from exon 1 (Figure 1), meaning that exon 2 is spliced out of pre-mRNA. It also contains amino acids translated from exon 3 and part of exon 4 (N-terminus), while the C-terminus is replaced by an alternative fragment that is not matching with any portion of the reviewed MeCP2E1 and E2 sequences. As evident from transcript mapping to the human genome (Supplementary Figure S1), this fragment comes from the translation of exon 4 at a different site. Interestingly, A0A0D9SFX7 has the same C-terminus end fragment as B5MCB4, but it is analogical to MeCP2E2 as it has an amino acid sequence encoded from exon 2. C9JH89 and A0A0D9SEX1 are both missing their reference C-termini starting from the amino acids encoded in exon 3. Their transcripts also have different alternative mRNA 5′ UTR coming from intron 1 of the MECP2 gene (Supplementary Figure S1). A0A1B0GTV0 is composed of protein fragments matching to N-terminus and an inner fragment of the exon 4 translation product. A0A6Q8PHQ3 and A0A6Q8PF93 have amino acid products from exon 2 only and different alternative C-termini not matching with other protein sequences. Based on the genomic mapping, these fragments are translated from intron 2 of the MECP2 gene. H7BY72 is missing an arginine from the sequence encoded from exon 2 while having an alternative C-terminus fragment with the same 14 amino acids as A0A6Q8PF93. The UniProt human MeCP2 isoforms and respective Ensembl transcripts are summarized in Table 2.
Among the eight computationally mapped MeCP2 isoforms from UniProt, all but H7BY72, 0A6Q8PHQ3, and A0A6Q8PF93 provide a clear statement of experimental evidence at the protein level (partial/complete Edman sequencing, mass spectroscopy, NMR structure, or X-ray). UniProt labels C9JH89 and A0A0D9SEX1 as coding sequence (CDS) 3′ incomplete, and A0A1B0GTV0 as both CDS 5′ and 3′ incomplete.
This is also consistent with the alignment, as these proteins are missing portions or complete amino acid sequences corresponding to some of the exons. Based on UniProt records, H7BY72, A0A6Q8PHQ3 and A0A6Q8PF93 are the products of nonsense-mediated decay of isoforms 1 and 2.
Respective Ensembl transcripts for B5MCB4, C9JH89, A0A1B0GTV0, and A0A0D9SEX1 have TSL of 5 (TSL:5). According to Ensembl Transcript Flags Code, TSL:5 means that there is no single transcript that would support their exon combination model structure. A0A0D9SFX7 and H7BY72 transcripts have support for their exon splicing model from 1 expressed sequence tag (EST) (TSL:3). MeCP2E1 and E2 (P51608-2 and -1) have the strongest TSL of 1, suggesting that all splice junctions of the transcript are supported by at least one non-suspect mRNA.
The functional domains and interaction sites with other proteins of the isoforms were also analyzed and summarized in Table 3 and Table 4. MeCP2 isoform 3 have all but the HMGD1 domain. Isoform 4 on the other hand was found to be missing or having incomplete most of the functional domains (HMGD1 and 2, MBP, aDBD, TRD, NLS1, AT-hook 1, histone H3 methyltransferase interaction sequence (H3-M-T IS). UniProt isoforms were found to be less functionally potential as they are missing most of the essential functional domains and interaction sites required for MeCP2 function. B5MCB4 and A0A0D9SFX7 both have H3-M-T interaction sequence, while missing or having incomplete the rest of the functional features. The rest of the isoforms from UniProt were found to be missing all the functional domains and features.

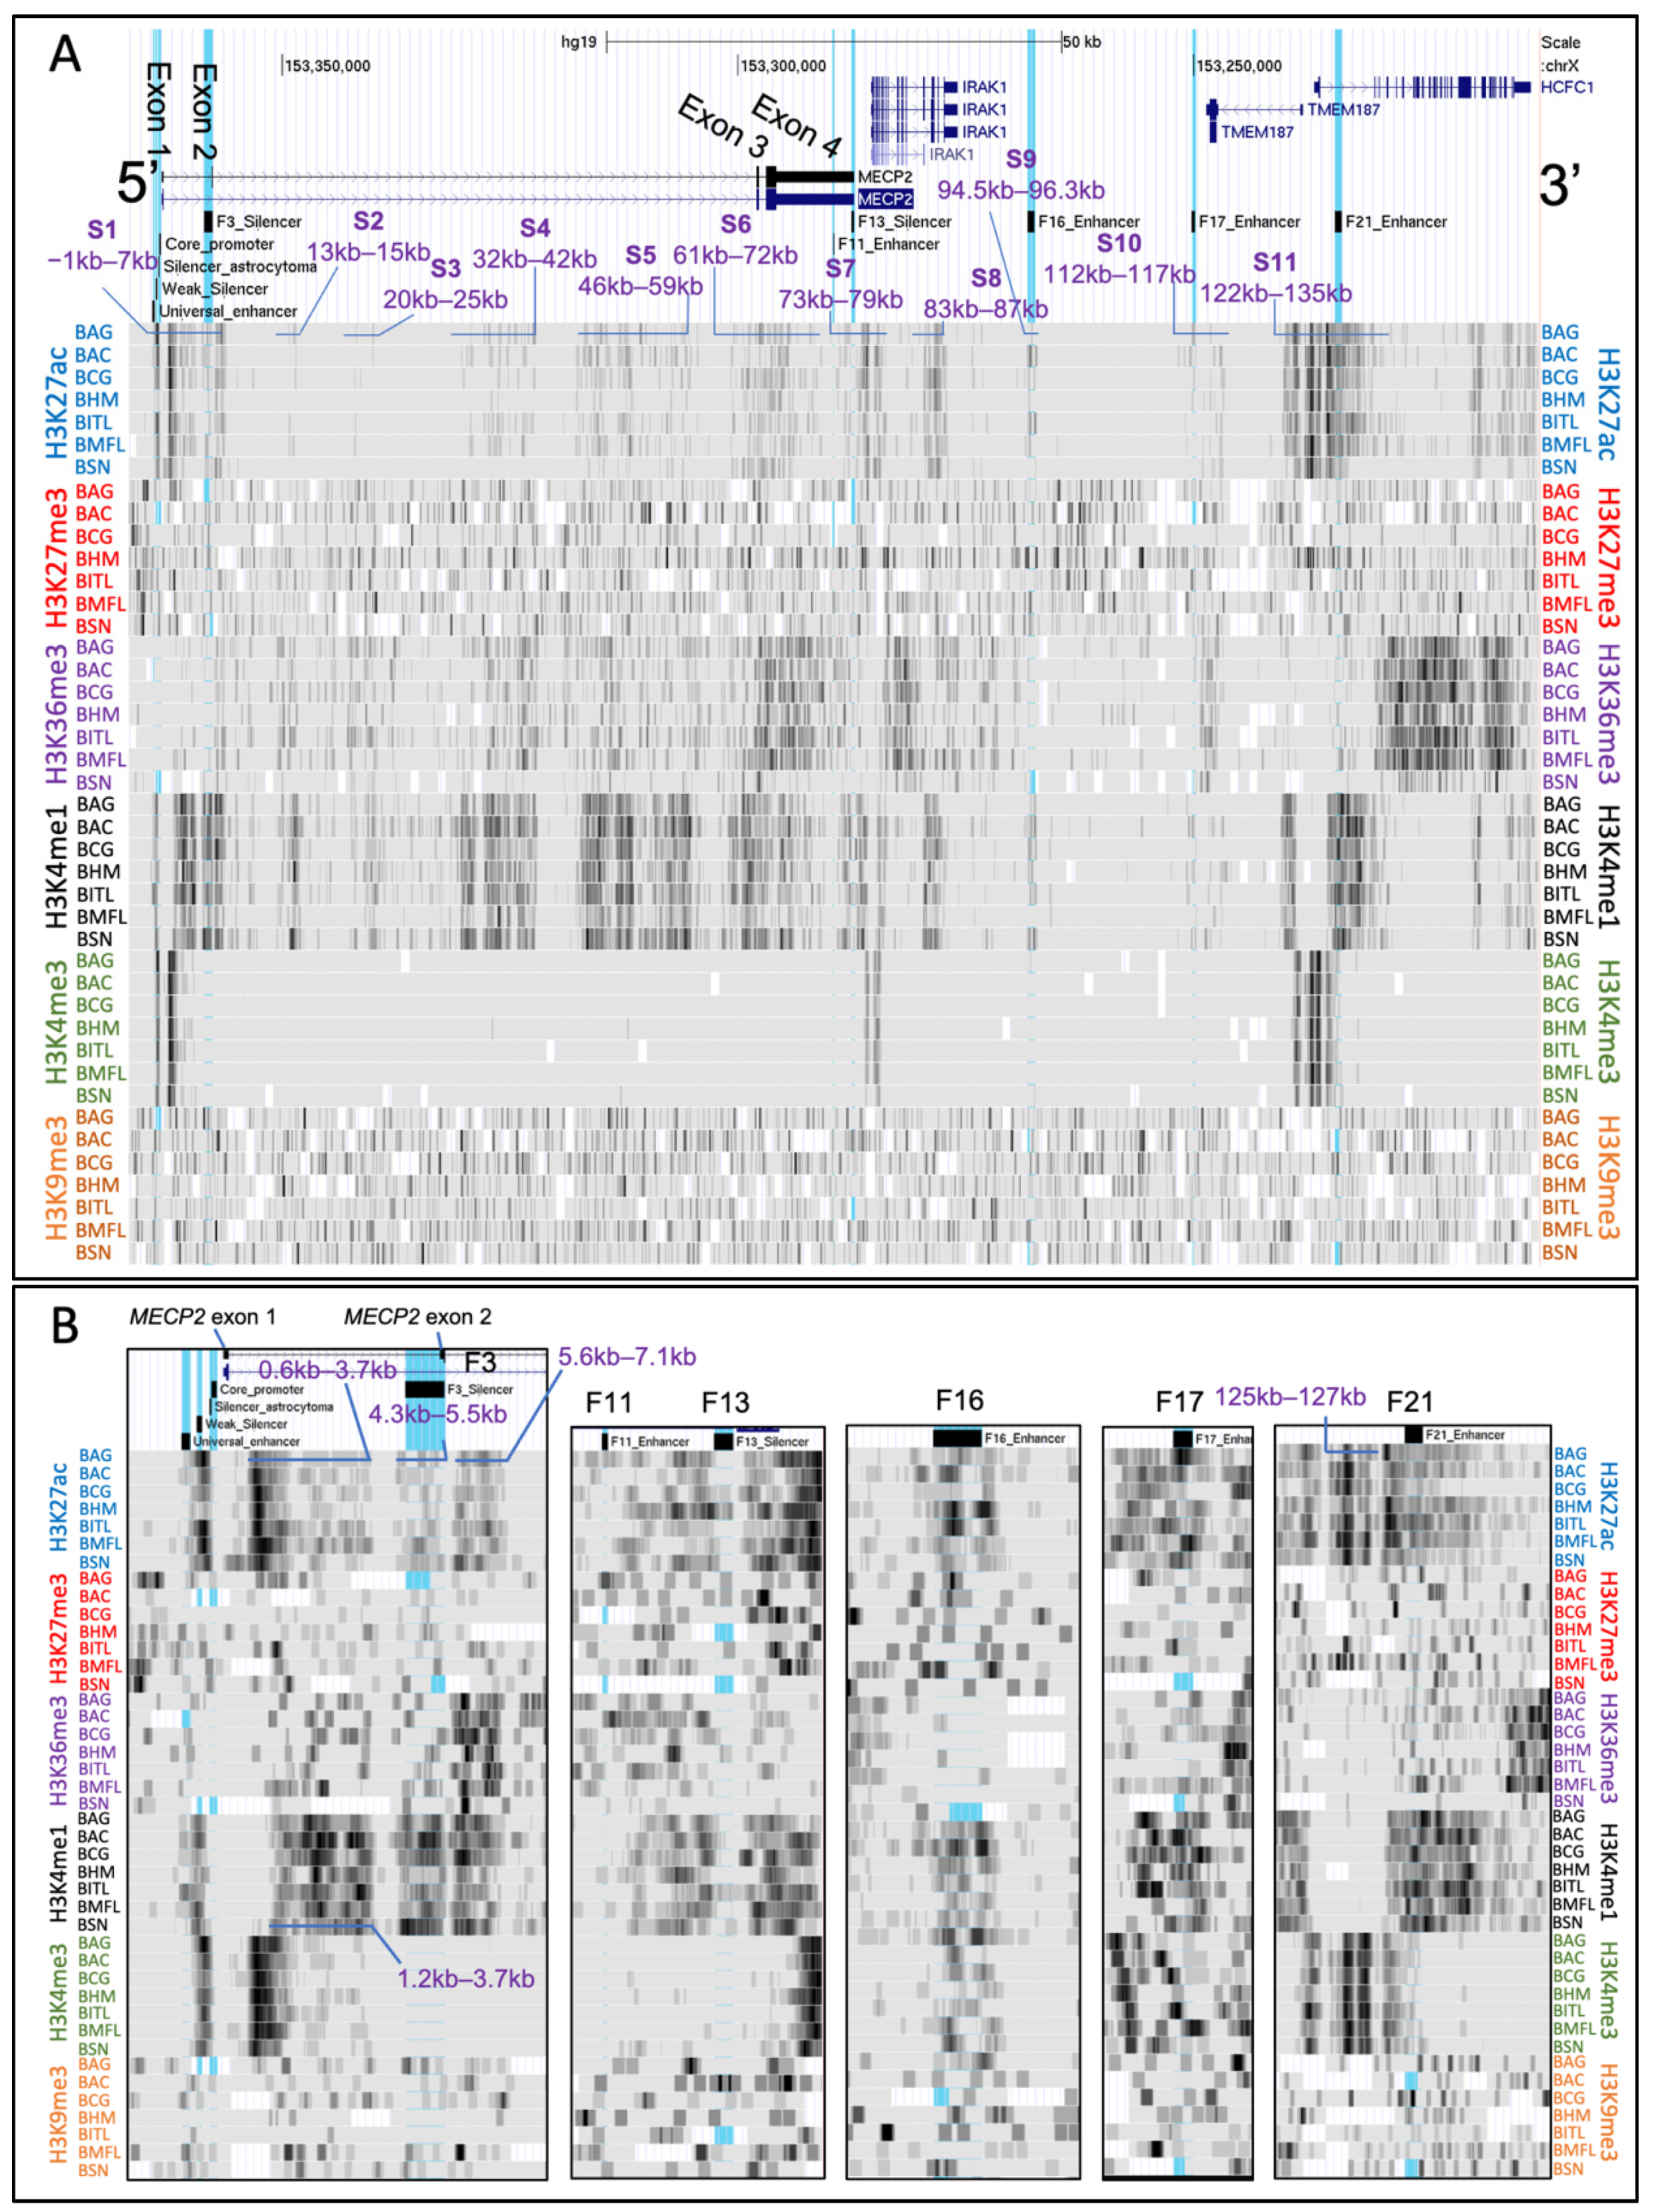
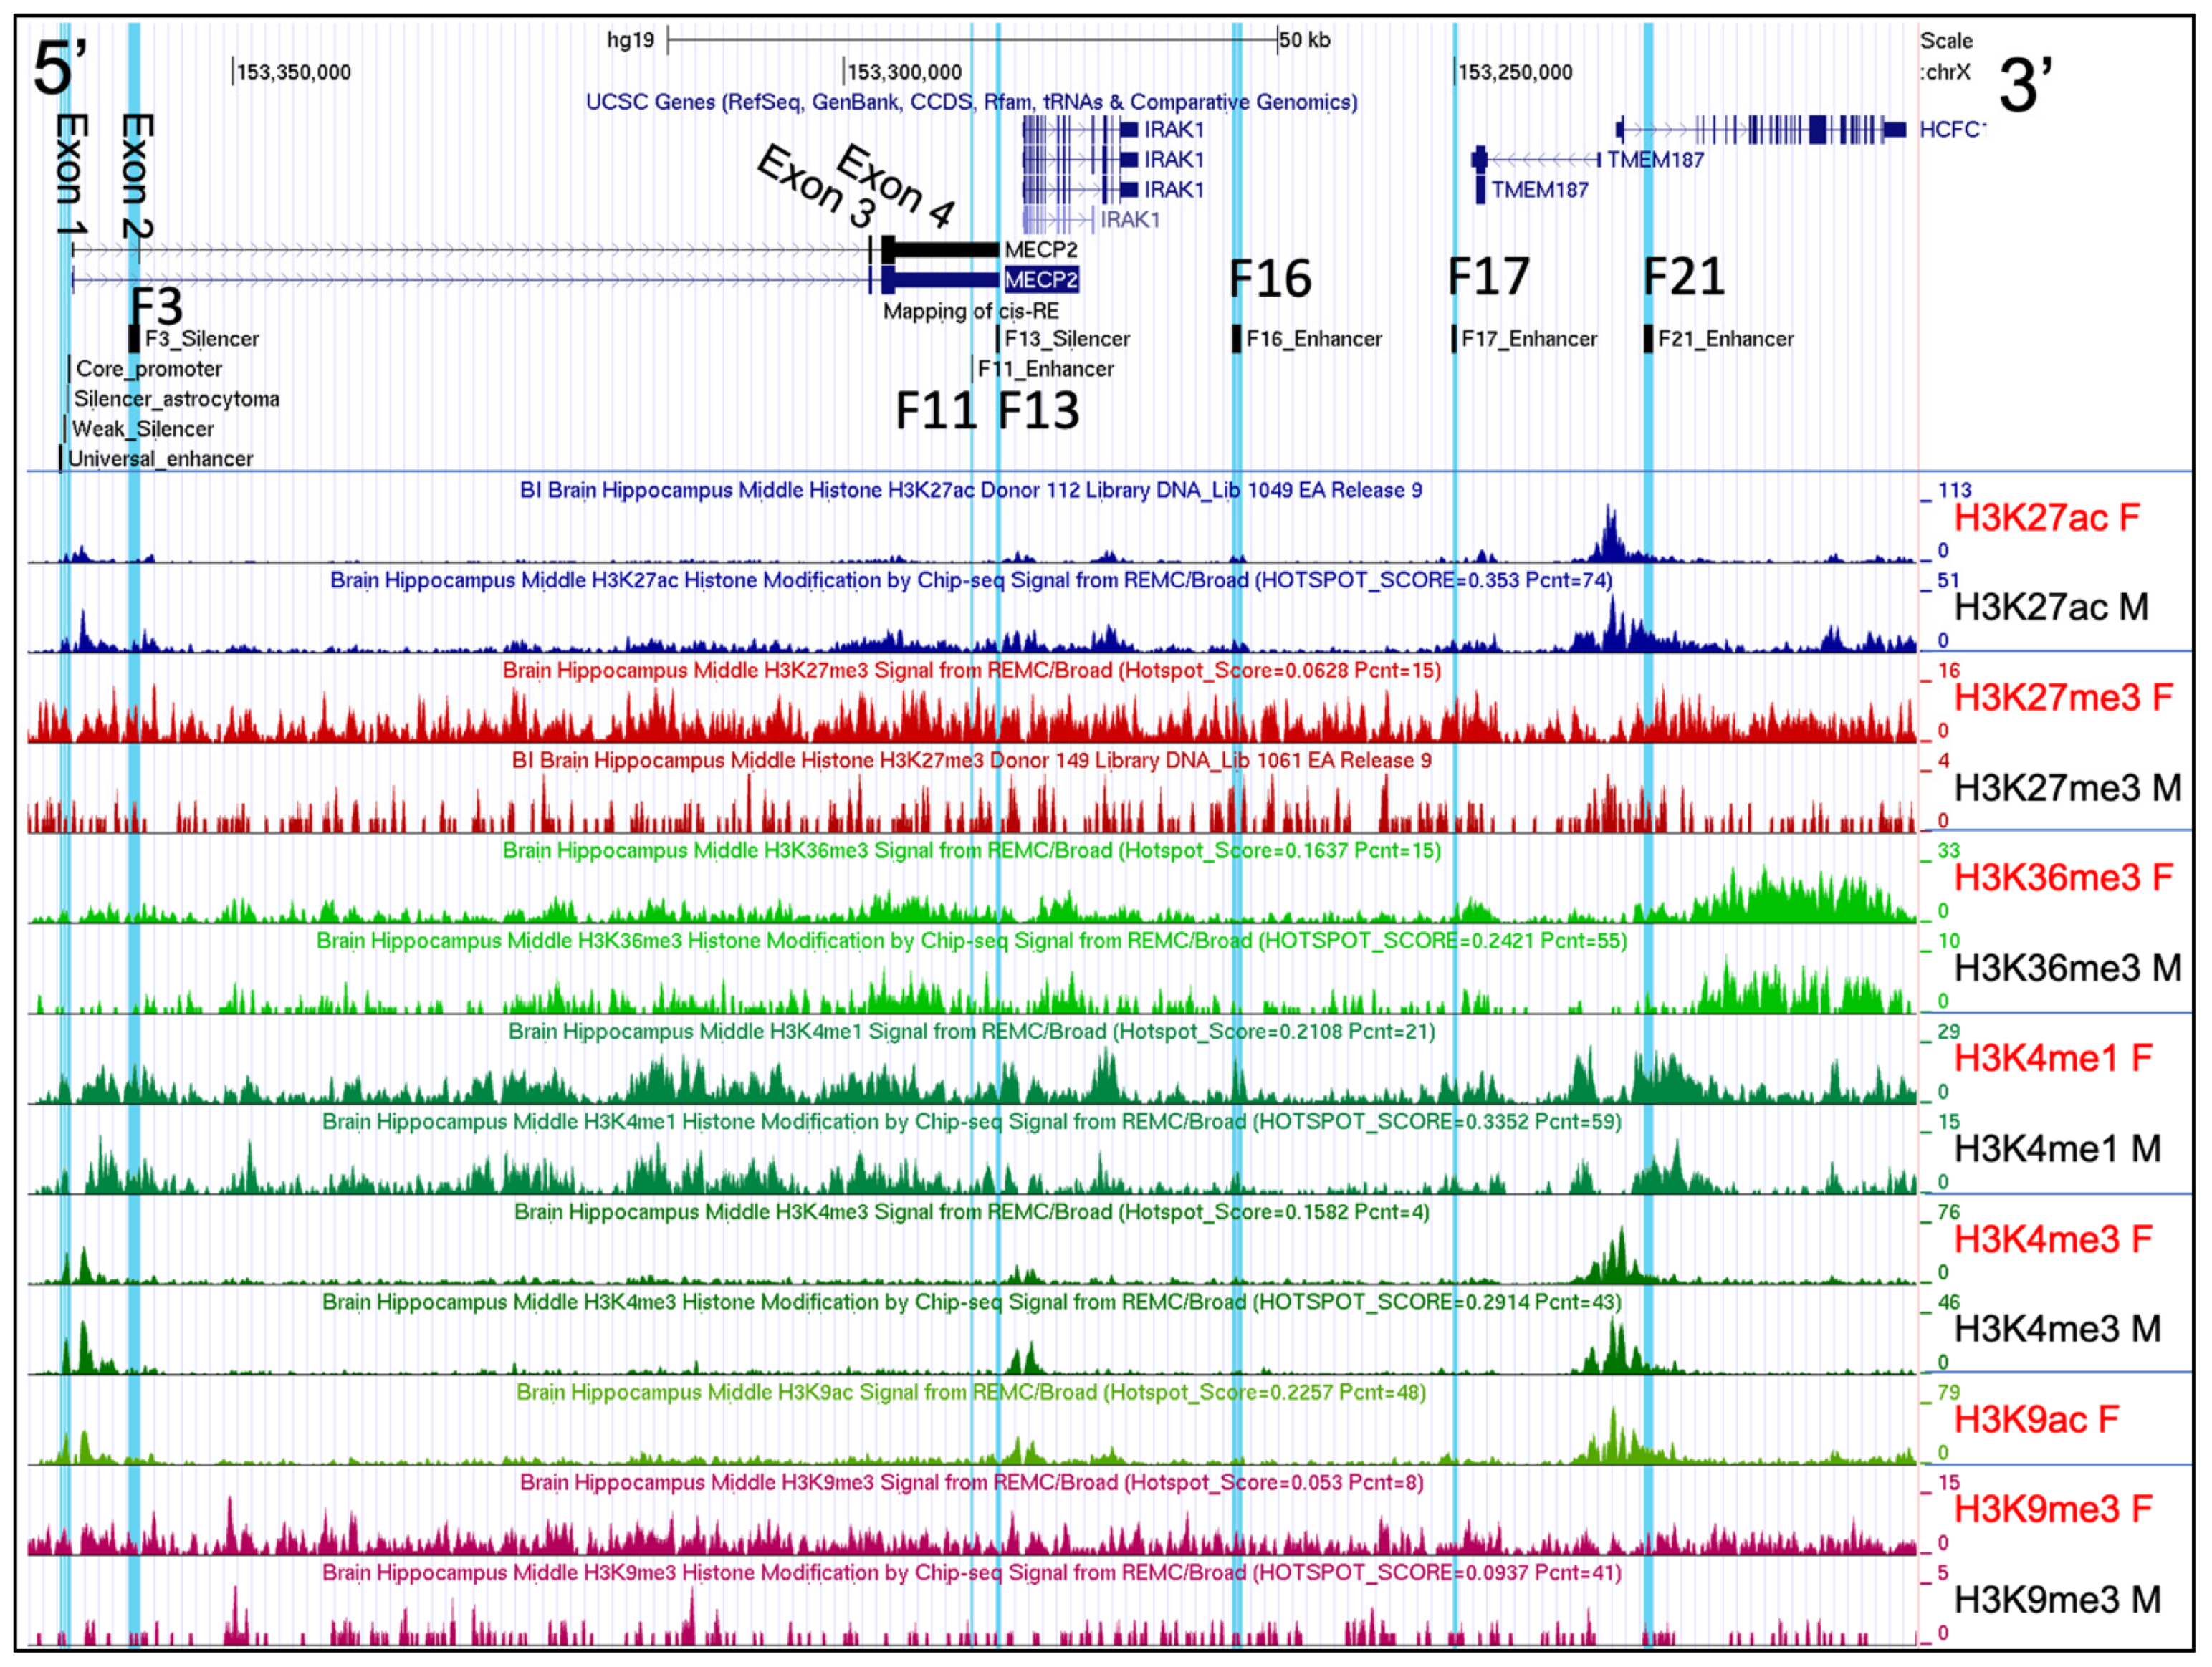
2.2. Histone Post-Translational Modification Profiles at the MECP2 Gene Loci and the Corresponding Cis-Regulatory Elements

Comparative analysis of histone post-translational modifications (PTMs) (H3K27ac, H3K36me3, H3K4me1, and H3K4me3) profiles of the MECP2 gene and corresponding cis-regulatory elements were analyzed from 7 human brain regions: the angular gyrus, anterior caudate, cingulate gyrus, middle hippocampus, inferior temporal lobe, mid frontal lobe, and substantia nigra. These data indicated a high degree of similarity in histone PTMs associated with the MECP2 gene loci in human male and female tissues (Figure 2 and Figures S2). Limitation of this analysis was exclusion of H3K27ac (substantia nigra), H3K27me3 (cingulate gyrus, mid frontal lobe, angular gyrus), and H3K9ac (all brain regions) in male-female comparisons due to the unavailability of the corresponding datasets. H3K9me3 and H3K27me3 appear to be scattered evenly across the analyzed chromosomal regions and share no distinguishable enrichment peak patterns, when compared between female and male brain tissues. The comparison of multiple histone PTMs between donors of different sexes in 7 different brain regions (Figure 3 and Figure S2) revealed a high degree of similarity between human males and females. We then used data from male tissues to assess the differences in histone PTMs between the 7 brain regions.
We visually assessed the density graphs on hg19 chrX:153,212,176–153,366,832 including the whole MECP2 gene and all its previously identified cis-regulatory elements. We report 7 MECP2 intragenic segments and 4 segments upstream of the MECP2 gene, which are highly abundant in H3K27ac and H3K4me1 PTMs (Figure 3). Their estimated positions relative to the MECP2 transcription start site are (-1)–7 kb (S1), 13–15 kb (S2), 20–25 kb (S3), 32–42 kb (S4), 46–59 kb (S5), 61–72 kb (S6), 73–79 kb (S7), 83–87 kb (S8), 94.5–96.3 kb (S9), 112–117 kb (S10), and 122–135 kb (S11). Out of these: S1-S7 are MECP2 intragenic; S1 includes MECP2 proximal and distal promoters, and the F3 silencer. S7 includes MECP2 F11 enhancer, MECP2 F13 silencer, IRAK1 promoter and a 5′ fragment of this gene. S9 includes MECP2 F16 enhancer; while S10 includes MECP2 F17 enhancer, and 3′ of TMEM187 gene. S11 includes promoters and 5′ regions of the HCFC1 and TMEM187 genes and complete MECP2 F21 enhancer.
On the scale of 50 kb, the trends in H3K27ac and H3K4me1 abundance appear to have a high degree of similarity, with the exception of 125–127 kb region upstream of the MECP2 TSS, which is enriched in H3K27ac, H3K4me3 and low in H3K4me1 (Figure 3A,B). Interestingly, H3K36me3 was highly abundant at the S1–S6, and S10 genomic segments, but low at the S7, S8, S9 and S11. Instead, H3K36me3 was highly abundant between S6 and S7; S7 and S8; S8 and S9; and from the 3′ end of S11 in the HCFC1 gene. H3K4Me3 abundance was high at the S1, S7, and S11 regions, which included promoters of the MECP2, IRAK1 and TMEM187/HCFC1 genes, respectively. H3K27me3 and H3K9me3 modification density peaks were evenly scattered throughout the MECP2 gene and its cis-regulatory elements. There was a consistent increase in H3K27me3 histone PTMs upstream of the MECP2 universal enhancer in 7 brain regions, but peaks did not converge on a certain genomic fragment and were rather scattered. To closely examine the MECP2 cis-regulatory elements, we zoomed in to distinguish smaller features (Figure 3B).
The S1 region can be divided into 4 subsegments: proximal and core promoter, 0.6–3.7 kb, 4.3–5.5 kb, including MECP2 F3 silencer, and 5.6–7.1 kb based on high enrichment with H3K27ac, H3K36me3, and H3K4me1 in 7 brain regions. H3K4me3 abundance is high only at 0.6–3.7 kb subsegment, while the increase in abundance of H3K4me1 starts at 1.2 kb of 0.6–3.7 kb subsegment. H3K9me3 modification density appears to be similar to H3K36me3 with less obvious patterns due to low read mapping coverage. MECP2 universal enhancer was found to be rich in H3K4me1 in all brain regions analyzed. MECP2 weak silencer has a high abundance of H3K27ac, H3K4me1, and H3K4me3 in 7 brain regions. MECP2 universal enhancer and weak silencer are also enriched with H3K9me3, though there is no consistency in modification sites between 7 genomic regions. Silencer of astrocytoma was found to be modified with H3K27ac and H3K4me3 while having a comparatively low abundance of H3K4me1 in 7 brain regions analyzed. The abundance of all histone modifications analyzed was found to be the lowest in MECP2 core promoter and exon 1 when compared to the nearby genomic regions in all brain regions of interest.
As discussed previously, MECP2 F3 silencer was included in one of the S1 subsegments 4.3–5.5 kb upstream of the MECP2 TSS and was found to be highly enriched with H3K27ac, H3K4me1, and less so with H3K36me3 and H3K9me3 in 7 brain regions analyzed (Figure 3B). F11 enhancer and F13 silencer of MECP2 show reduction of H3K27ac, H3K36me3, and H3K4me1 even though the nearby genomic regions are highly enriched with these histone PTMs in 7 brain regions. F16 enhancer and F17 silencer of MECP2 are found to be enriched with H3K27ac, H3K4me1 and H3K4me3, while no distinguishable patterns of increased abundance can be observed for H3K27me3 or H3K9me3 in 7 brain regions. MECP2 F21 enhancer has increased abundance of H3K27ac, H3K36me3, and H3K4me1. Interestingly, the 125–127 kb subsegment of S11 shows distinctive mutual exclusion of H3K4me1 and H3K4me1, while also being enriched with H3K27ac.
There has also been observed a clear difference in the conservation of histone modification sites between brain regions except for the downstream and upstream proximal to promoter regions of the MECP2 and other genes.

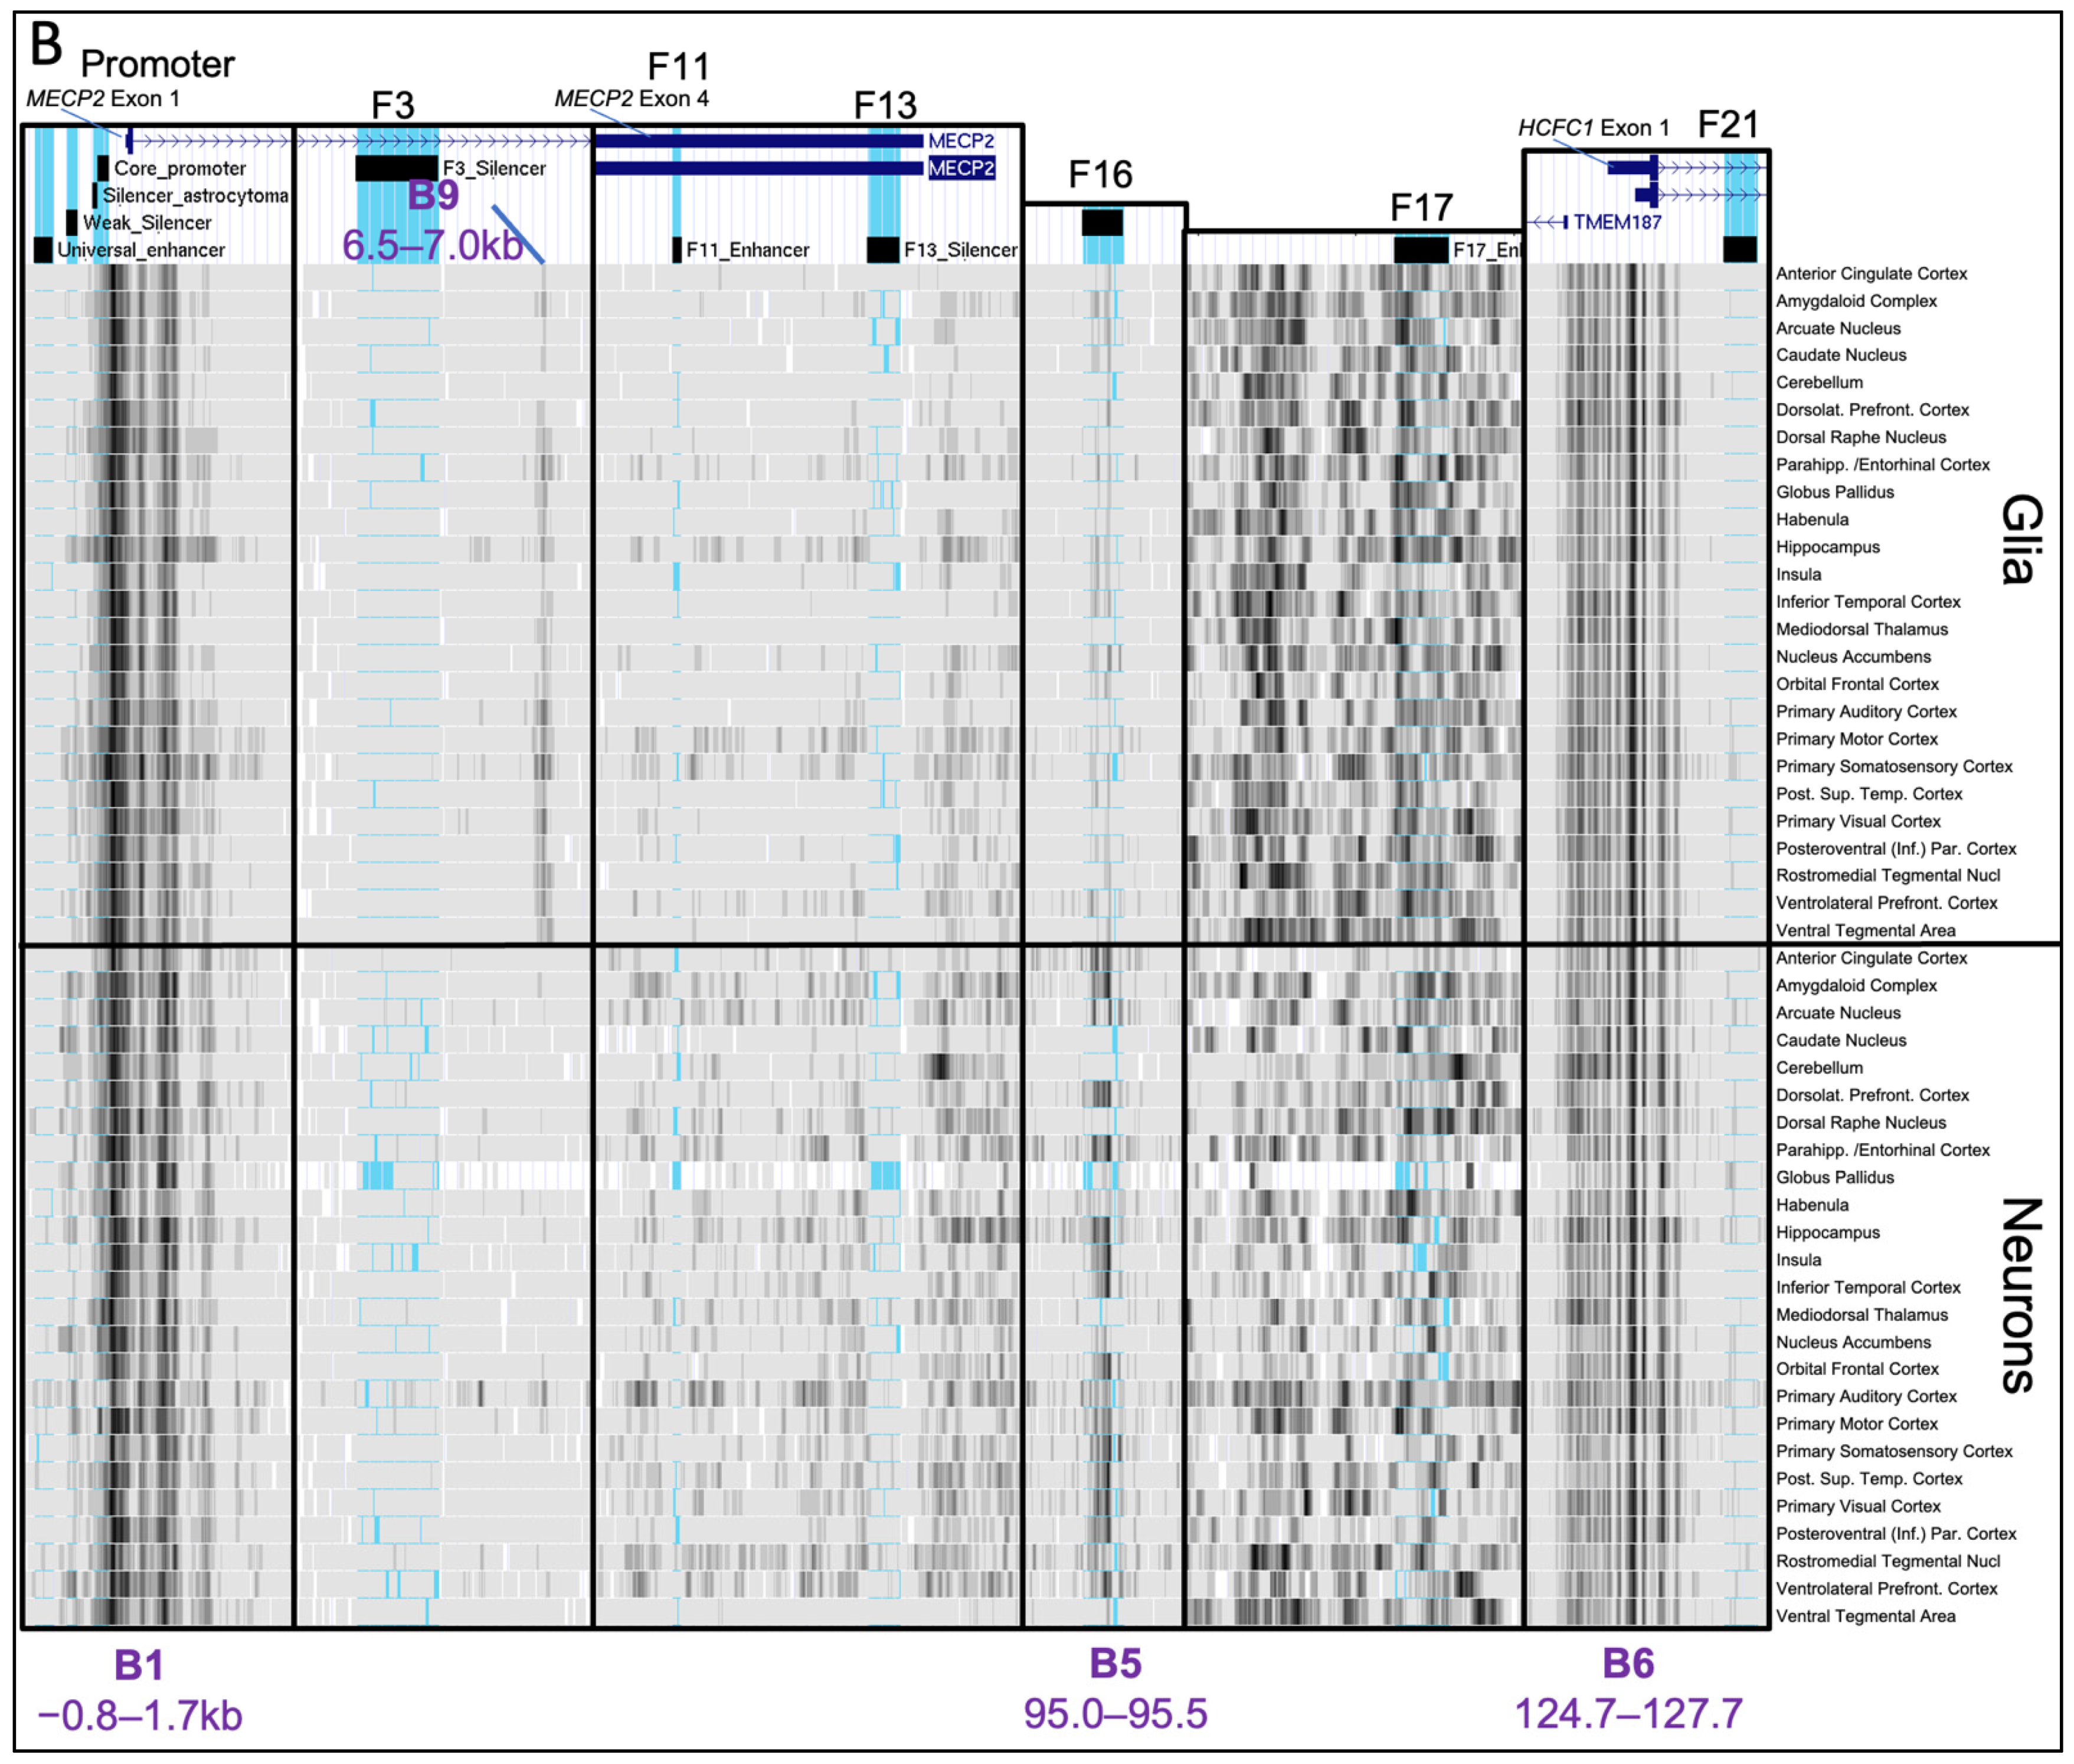
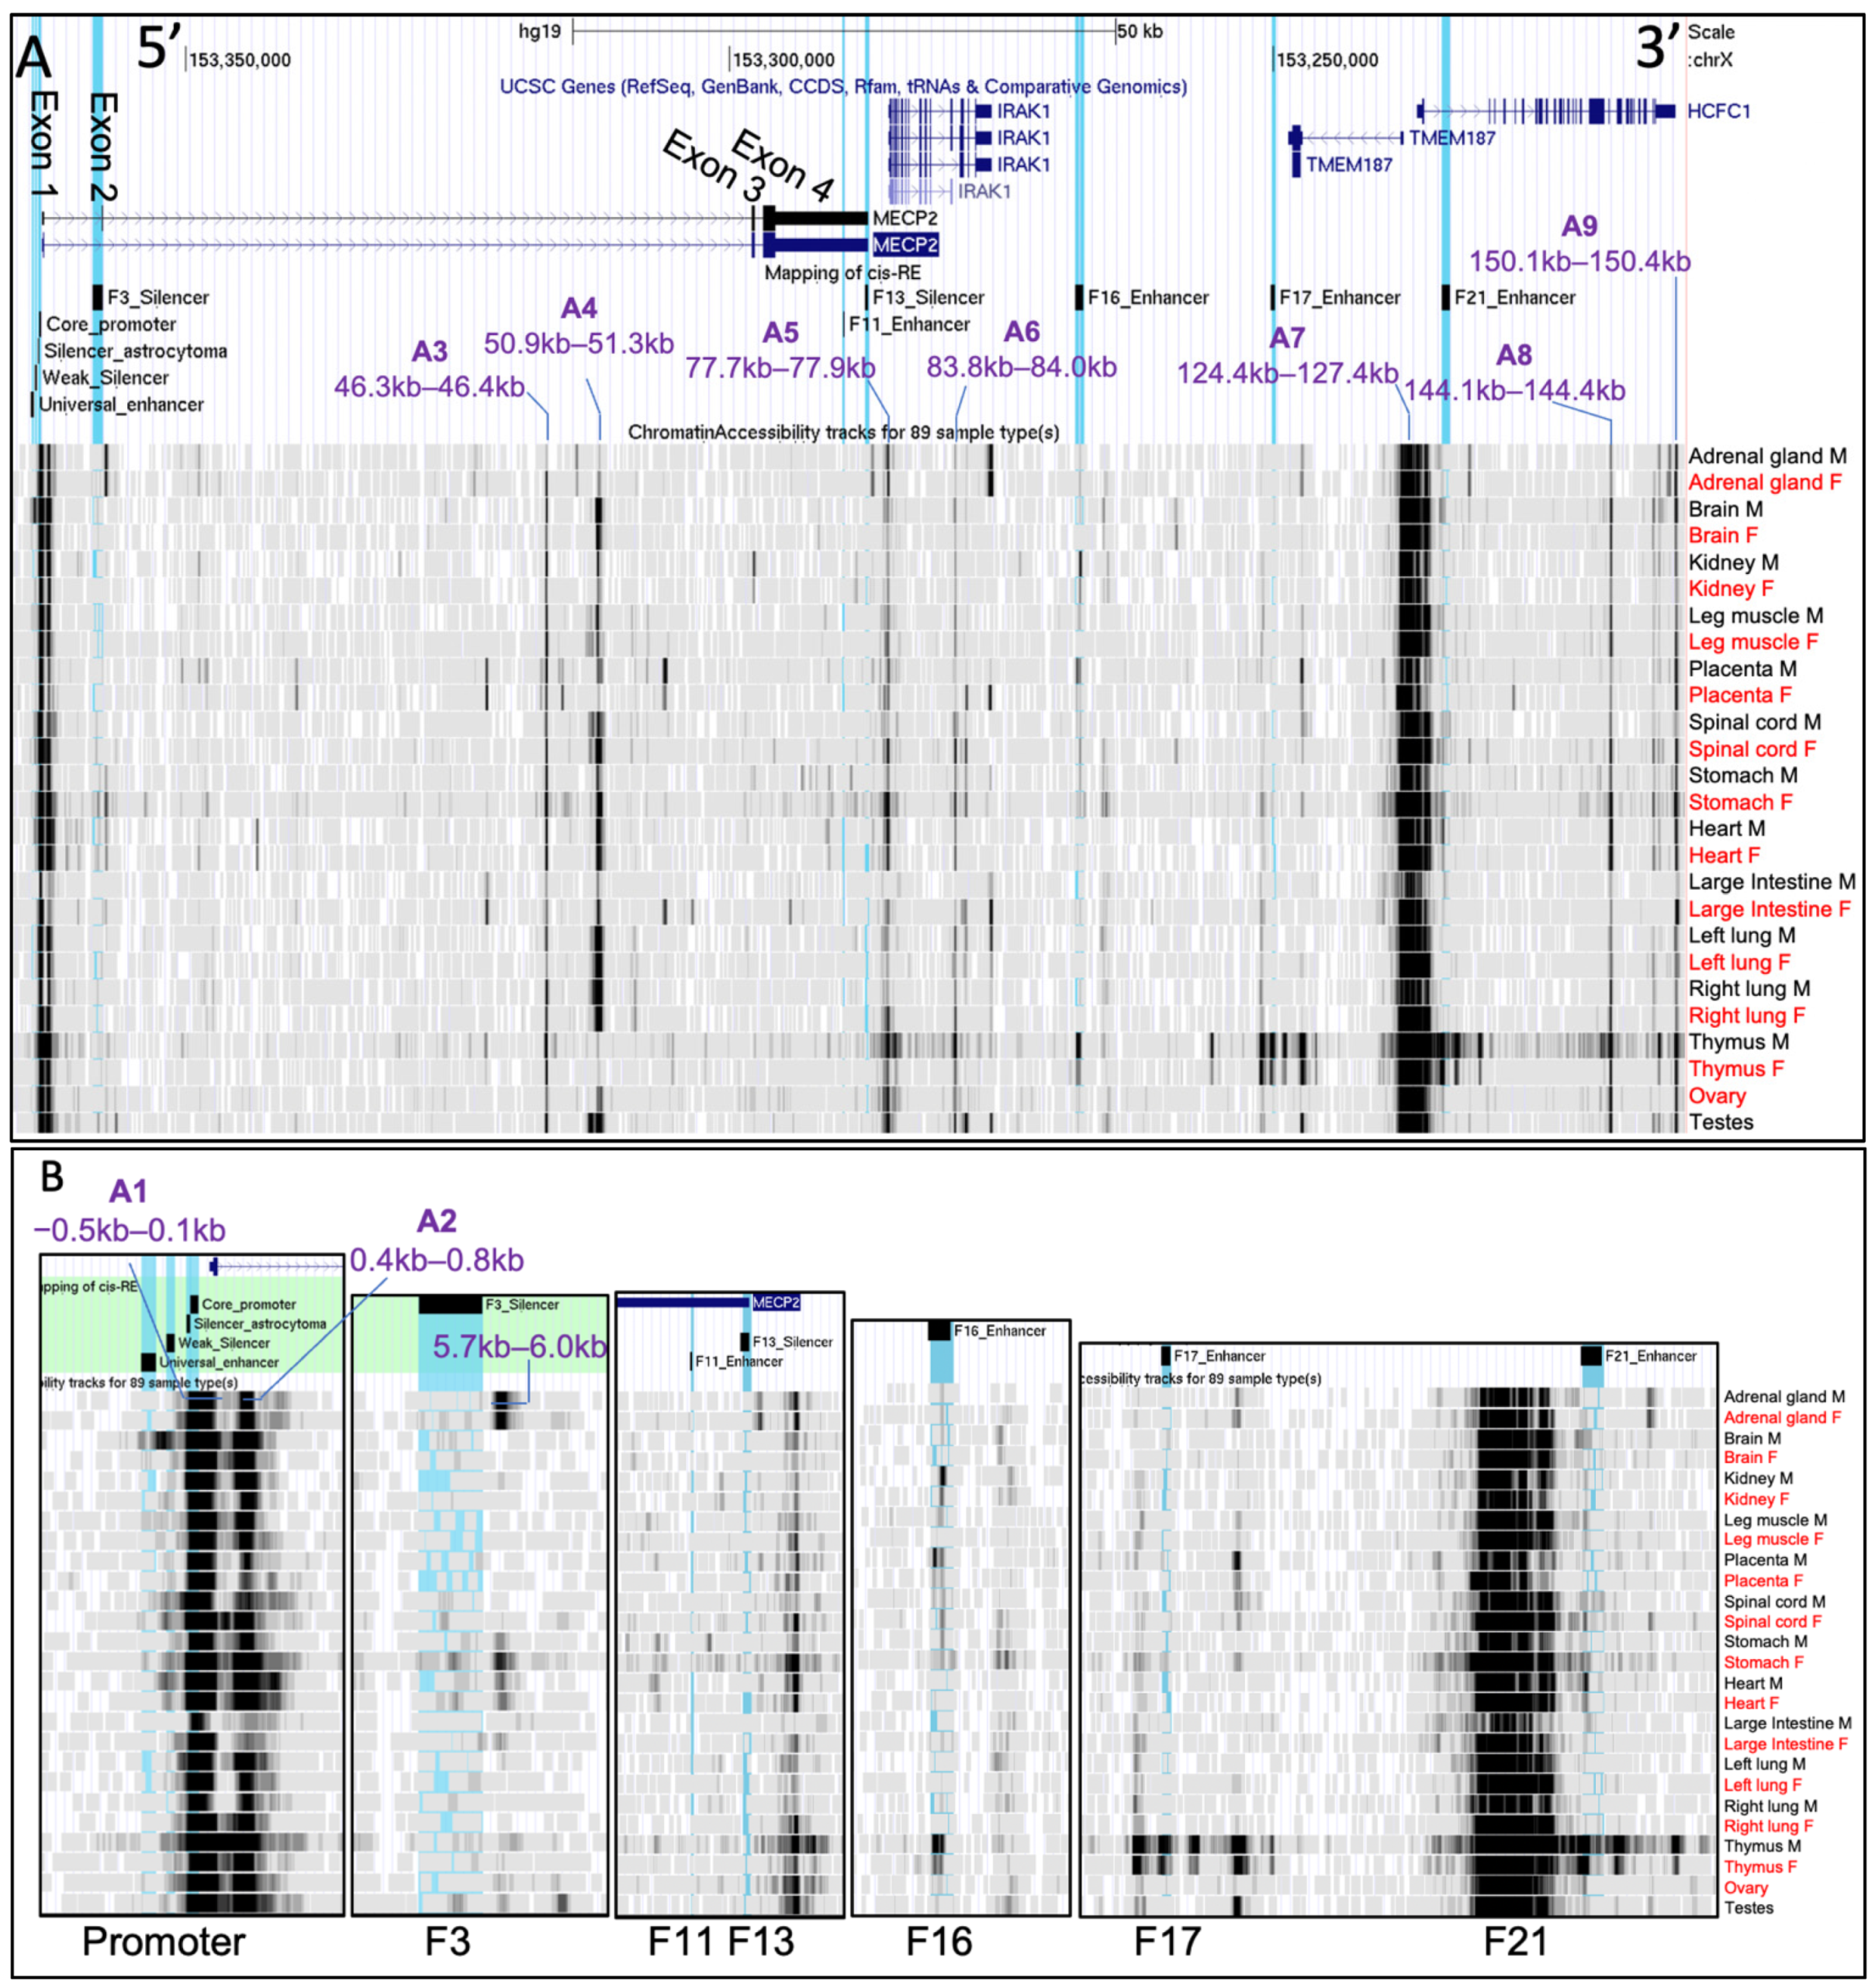
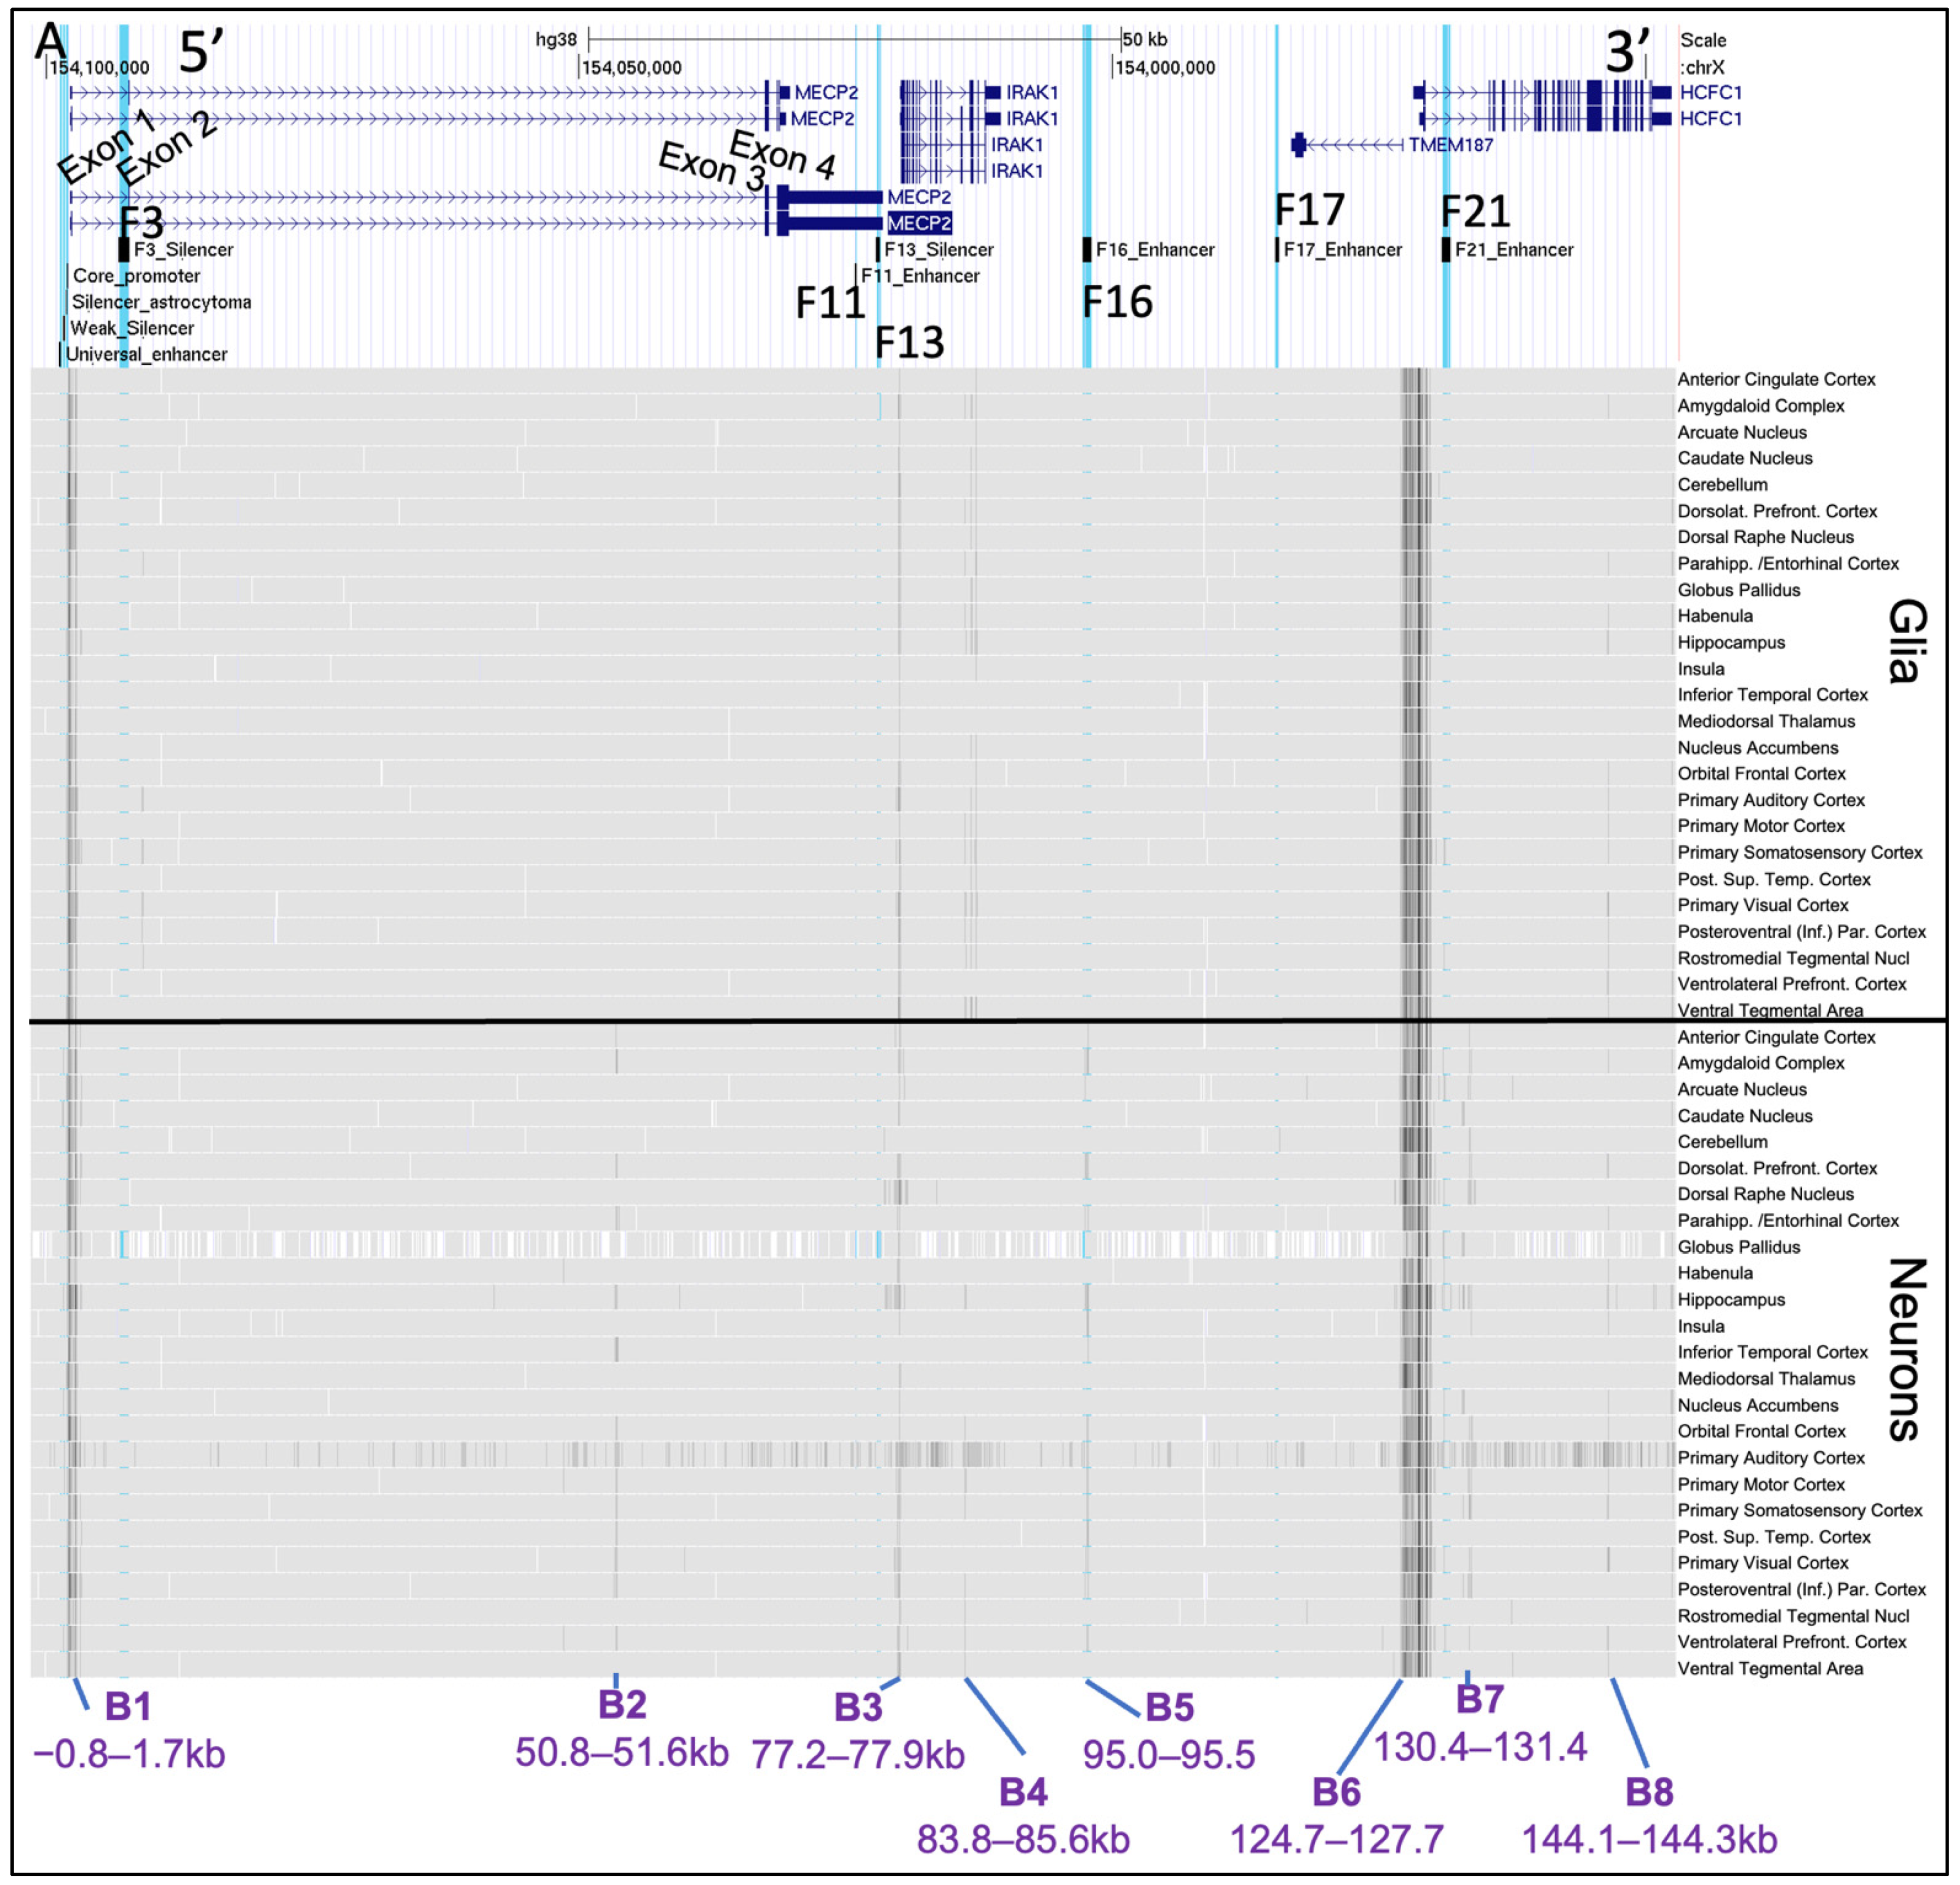
2.3. Chromatin Availability Profiles of the MECP2 Gene and its Cis-Regulatory Elements Characterized by DNase-seq and ATAC-seq in Different Human Tissues and Brain Regions

To characterize chromatin accessibility of the MECP2 gene and its cis-regulatory elements, we aligned DNase-seq datasets from 12 different human tissue samples (adrenal gland, brain, kidney, leg muscle, placenta, spinal cord, stomach, heart, large intestine, left and right lungs, thymus) from both male and female fetuses as well as ovary and testis tissues. As for the histone modification analysis, we first focused on general chromatin accessibility trends within the MECP2 and other upstream genes which included the MECP2 cis-REs (hg19 chrX:153,212,176–153,366,832).
On the scale of 50 kb, we report 9 genomic regions (Figure 4A) which have consistently higher chromatin accessibility compared to the nearby regions in most of the studied tissues in both sexes, which we will refer to as A1–A9, of which A1–A4 are MECP2 intragenic: A1 (−0.5–0.1 kb) includes MECP2 silencer of astrocytoma, core promoter, and exon 1 (Figure 4B); A2 (0.4–0.8 kb) is a fragment of MECP2 intron 1 (Figure 4B); A3 (46.3–46.4 kb) and A4 (50.9–51.3 kb) are fragments of MECP2 intron 2; A5 (77.7–77.9 kb) includes IRAK1 promoter; A6 (83.8–84.0 kb) is IRAK1 intragenic fragment; A7 (124.4–127.4 kb) includes promoters of TMEM187 and HCFC1 as well as their exons 1 and introns 1; A8 (144.1–144.4 kb) and A9 (150.1–150.4 kb) are intragenic HCFC1 fragments in intron 18 and exon 26. Outside of A1–A11, conservation of accessible regions is highly reduced between different tissues, while there is a low degree of similarity between sexes within each tissue. Both female and male thymus tissue appear to have the highest average accessibility of chromatin in the analyzed regions.
Then, we assessed chromatin accessibility at each of the MECP2 cis-regulatory elements (Figure 4B). MECP2 universal enhancer has an increased chromatin accessibility only in male brain tissue, with only some accessibility increase in females. Other tissues exhibit variable accessibility at universal enhancer and no apparent conclusion about differences between sexes or different tissues can be made. MECP2 silencers of astrocytoma, core promoter, and exon 1 appear to be highly accessible in all tissues of both sexes. MECP2 F3 silencer chromatin shows some degree of accessibility in the spinal cord, stomach, heart in both sexes and testes. 5.7–6.0 kb fragment (upstream of MECP2 exon 2 and F3 silencer) shows a high degree of chromatin accessibility in both female and male adrenal glands, stomach, and heart with lower accessibility in thymus, ovary, and testes. MECP2 F11 enhancer and F13 silencer show no signs of chromatin accessibility and seem to have low read mapping densities. F16 enhancer of MECP2 was found to be highly accessible in the kidney, placenta, and thymus of both sexes, with lower accessibility in the adrenal gland, spinal cord, and stomach. F17 and F21 enhancers of MECP2 are highly accessible in the thymus of both sexes. F21 is also distinguishably more accessible in the male brain, and both male and female spinal cords, stomach, heart, and large intestine.
Next, we assessed chromatin accessibility at the MECP2 gene promoter, corresponding cis-REs, and nearby genomic regions in glia and neurons from 25 brain cortical and subcortical areas from GSE211822 ATAC-seq datasets. High accessibility regions were defined as B1–B9 (Figure 5) and further investigation was performed at a lower scale on each of the previously discovered cis-REs and the MECP2 promoter.
The results showed that B1 (−0.8–1.7 kb), B3 (77.2–77.9 kb) and B6 (124.7–127.7 kb) are consistently accessible in all brain regions in both glial and neuronal cells (Figure 5A). B1 was found to partially overlap with the MECP2 promoter elements with highest accessibility levels observed on −0.2–0.1 kb between the core promoter and TSS, and within 5′ proximal end of intron 1 of the MECP2 gene (0.2–0.3 kb; 0.4–0.7 kb) in all brain regions of glial cells and neurons (Figure 5B). Neuronal cells had more inconsistent levels of accessibility between the brain regions within B1. Differences in accessibility between the brain regions in both neurons and glia were found at the MECP2 core promoter, silencer of astrocytoma, weak silencer, and universal enhancer. These regions exhibited highly inconsistent chromatin availability between the brain regions and cell types. B3 and B6 might overlap with the IRAK1 and HCFC1/TMEM187 promoters, respectively. Evidently, the highest chromatin availability is observed at the HCFC1/TMEM187 promoters, followed by MECP2 and then IRAK1 promoters. B6 exhibits a high level of chromatin accessibility conservation between the brain regions and cell types with a pattern of alternating accessibility throughout the fragments (Figure 5B). B9 (6.5–7.0 kb) was found in the MECP2 intron 1 downstream of F3 silencer upon closer examination of the cis-REs (Figure 5B). B9 exhibits consistently higher chromatin availability in glia from most of the brain regions with only some accessibility in neurons.
With variation between the brain regions, B2 (50.8–51.6 kb/a portion of the MECP2 intron 2), B5 (95.0–95.5/F16 enhancer), and B7 (130.4–131.4/a portion of the HCFC1 intron 1) have a higher chromatin availability in neurons and in most brain regions (Figure 5A). B5 overlaps with F16 enhancer (Figure 5B). B4 (83.8–85.6 kb/a portion of the IRAK1 intron) and B8 (144.1–144.3 kb/a portion of HCFC1 intron) had inconsistent chromatin availability between the analyzed brain regions and cell types (Figure 5A).
F17 had no distinctive accessibility patterns. F3, F11 and F13 had reduced accessibility in all brain regions in both cell types. F21 exhibited a variable accessibility predominantly higher in neurons than in glia inconsistently between different brain regions.

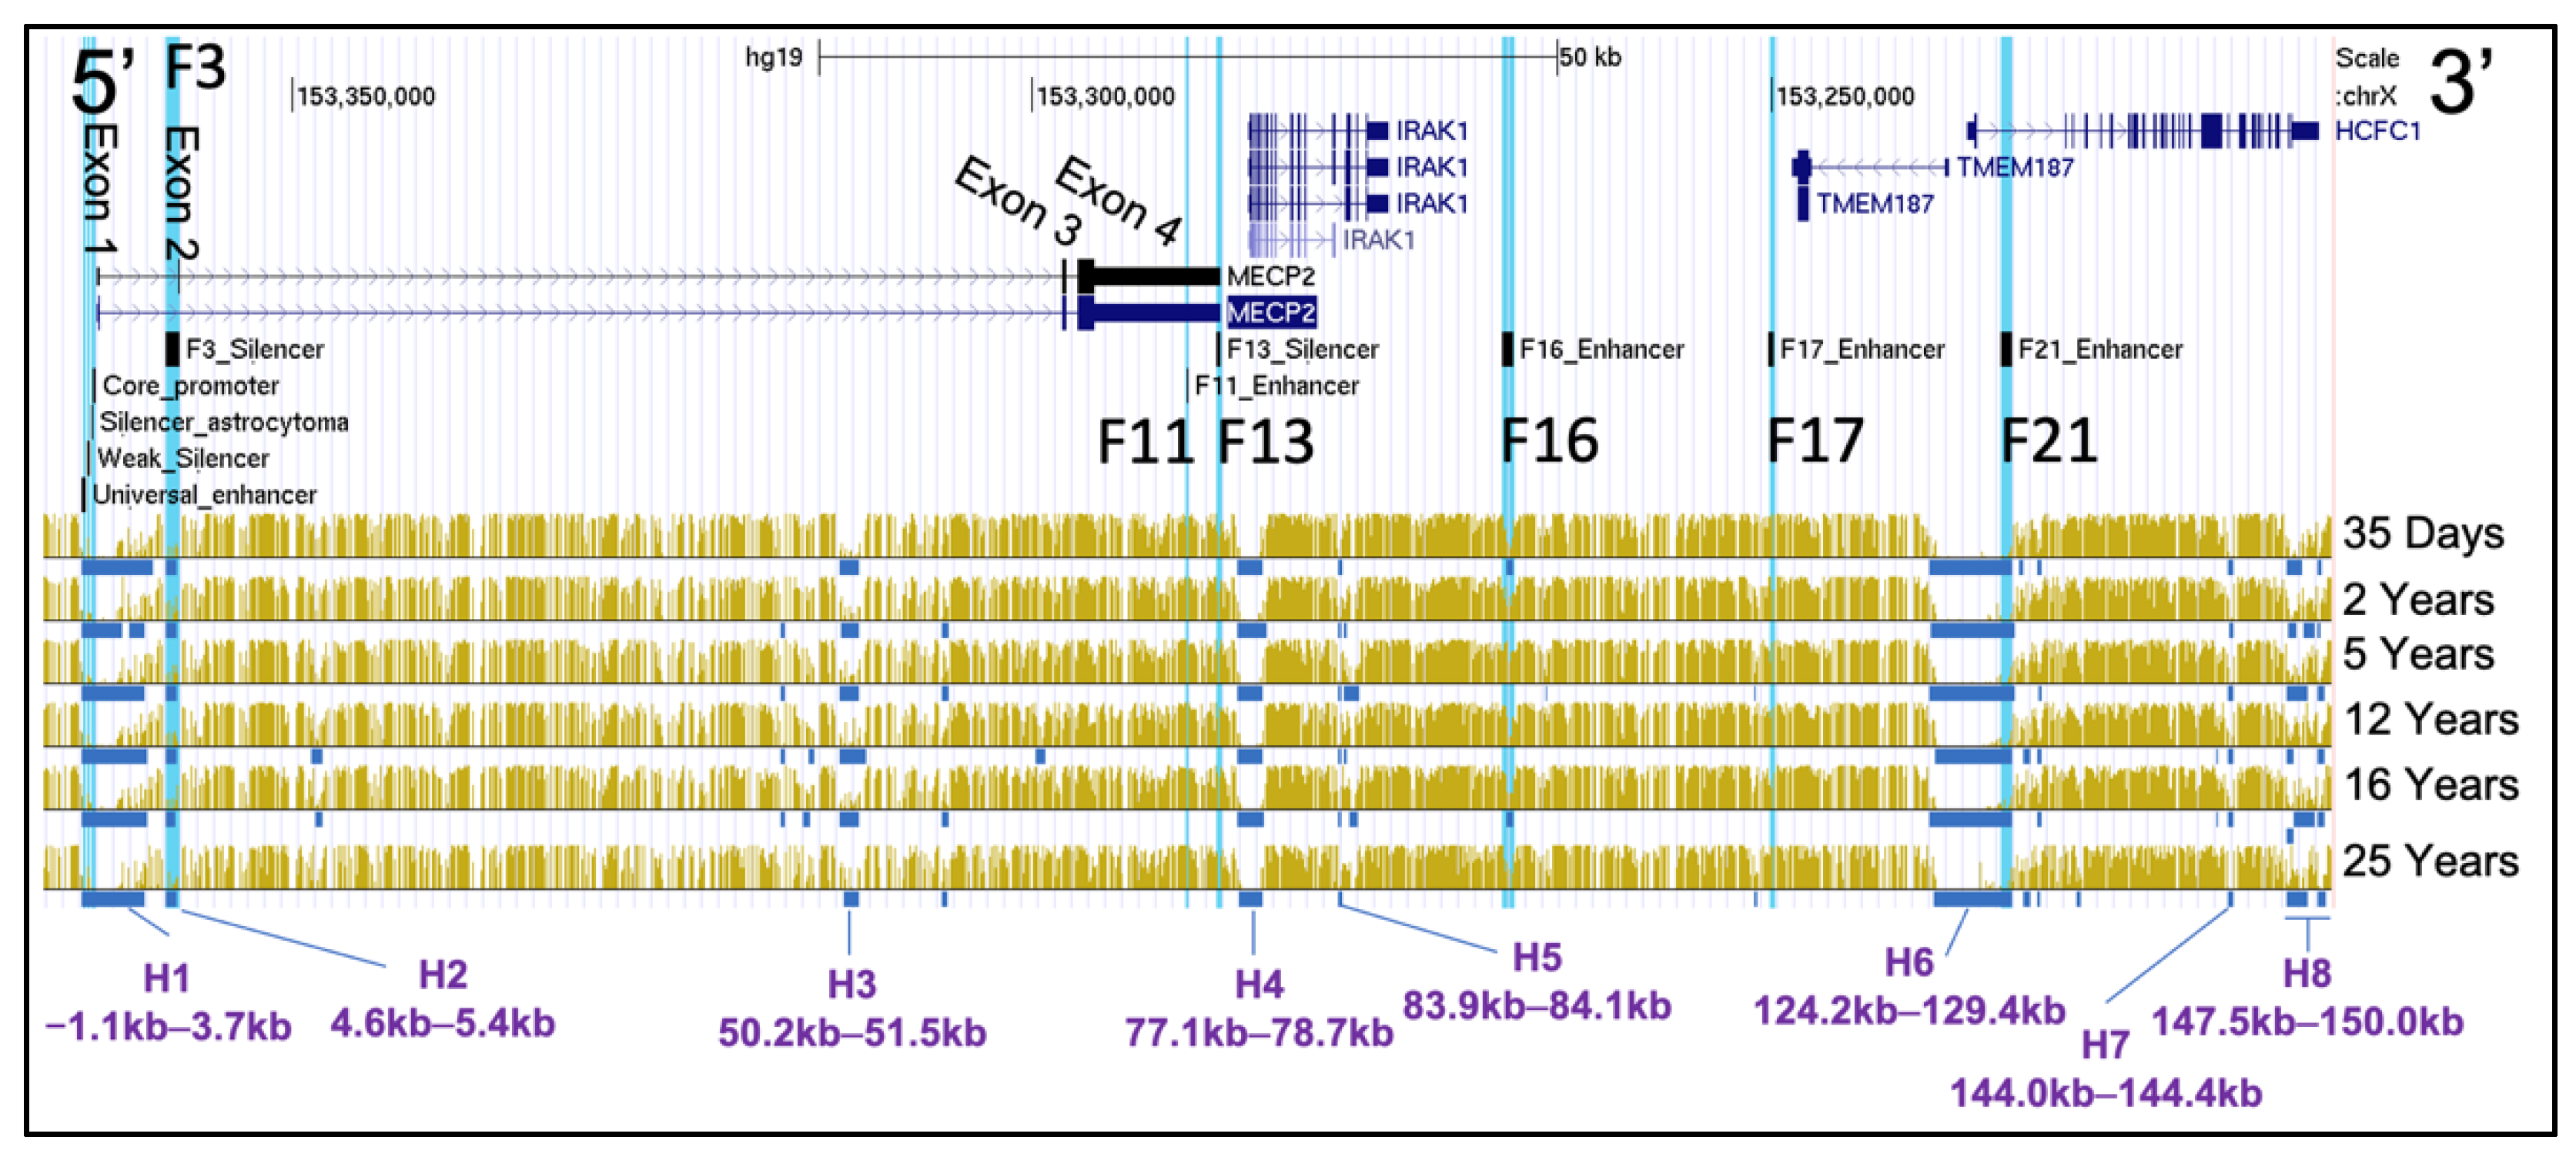
2.4. DNA Methylation of Mid Frontal Gyrus at Different Stages of Human Development

Next, we assessed DNA methylation of the genomic region hg19 chrX:153,212,176–153,366,832, containing the MECP2 and other upstream genes with the MECP2 cis-REs. BS-seq data [45] of healthy male human mid frontal gyrus were compared between 6 donors of different ages: 35 days, 2 years, 5 years, 12 years, 16 years, and 25 years of age (Figure 6). We report 8 hypomethylated genomic segments analyzed on the X chromosome, which will be referred to as “H1–H8”. These segments are consistently hypomethylated at all 6 ages. H1(−1.1–3.7 kb) includes all the MECP2 promoter regulatory elements (universal enhancer, weak silencer, the silencer of astrocytoma, core promoter, and a portion of MECP2 intron 1 (0–3.7 kb). H2 (4.6–5.4 kb) aligns with the MECP2 F3 silencer. H3 (50.2–51.5 kb) is within the MECP2 intron 2. H4 (77.1–78.7kb) includes IRAK1 promoter and 5′ intra genic fragment (exons 1–4, introns 1–3). H5 (83.9–84.1kb) is the IRAK1 intron 11 fragment. H6 (124.2–129.4 kb) includes the TMEM187 and HCFC1 promoters and 5′ intragenic regions (exons 1 and introns 1 of both genes), as well as the MECP2 F21 enhancer. H7 (144.0–144.4 kb) was found to be a part of intron 18 of the HCFC1 gene. H8 (147.5–150.0 kb) segment is composed of multiple hypomethylation subsegments variable between the analyzed ages, and it included exons 25–26 and intron 25 of the HCFC1 gene. F11, F16, F17 enhancer or F13 silencer were not found to be hypomethylated. Within the MECP2 gene, there are some differences in the locations of the hypomethylated regions in intron 2 between the 6 ages, however, it is not clear if this is due to difference in methylation density or insufficient genome mapping reads coverage as the overall methylation profiles between the different ages show a high degree of similarity.

3. Discussion

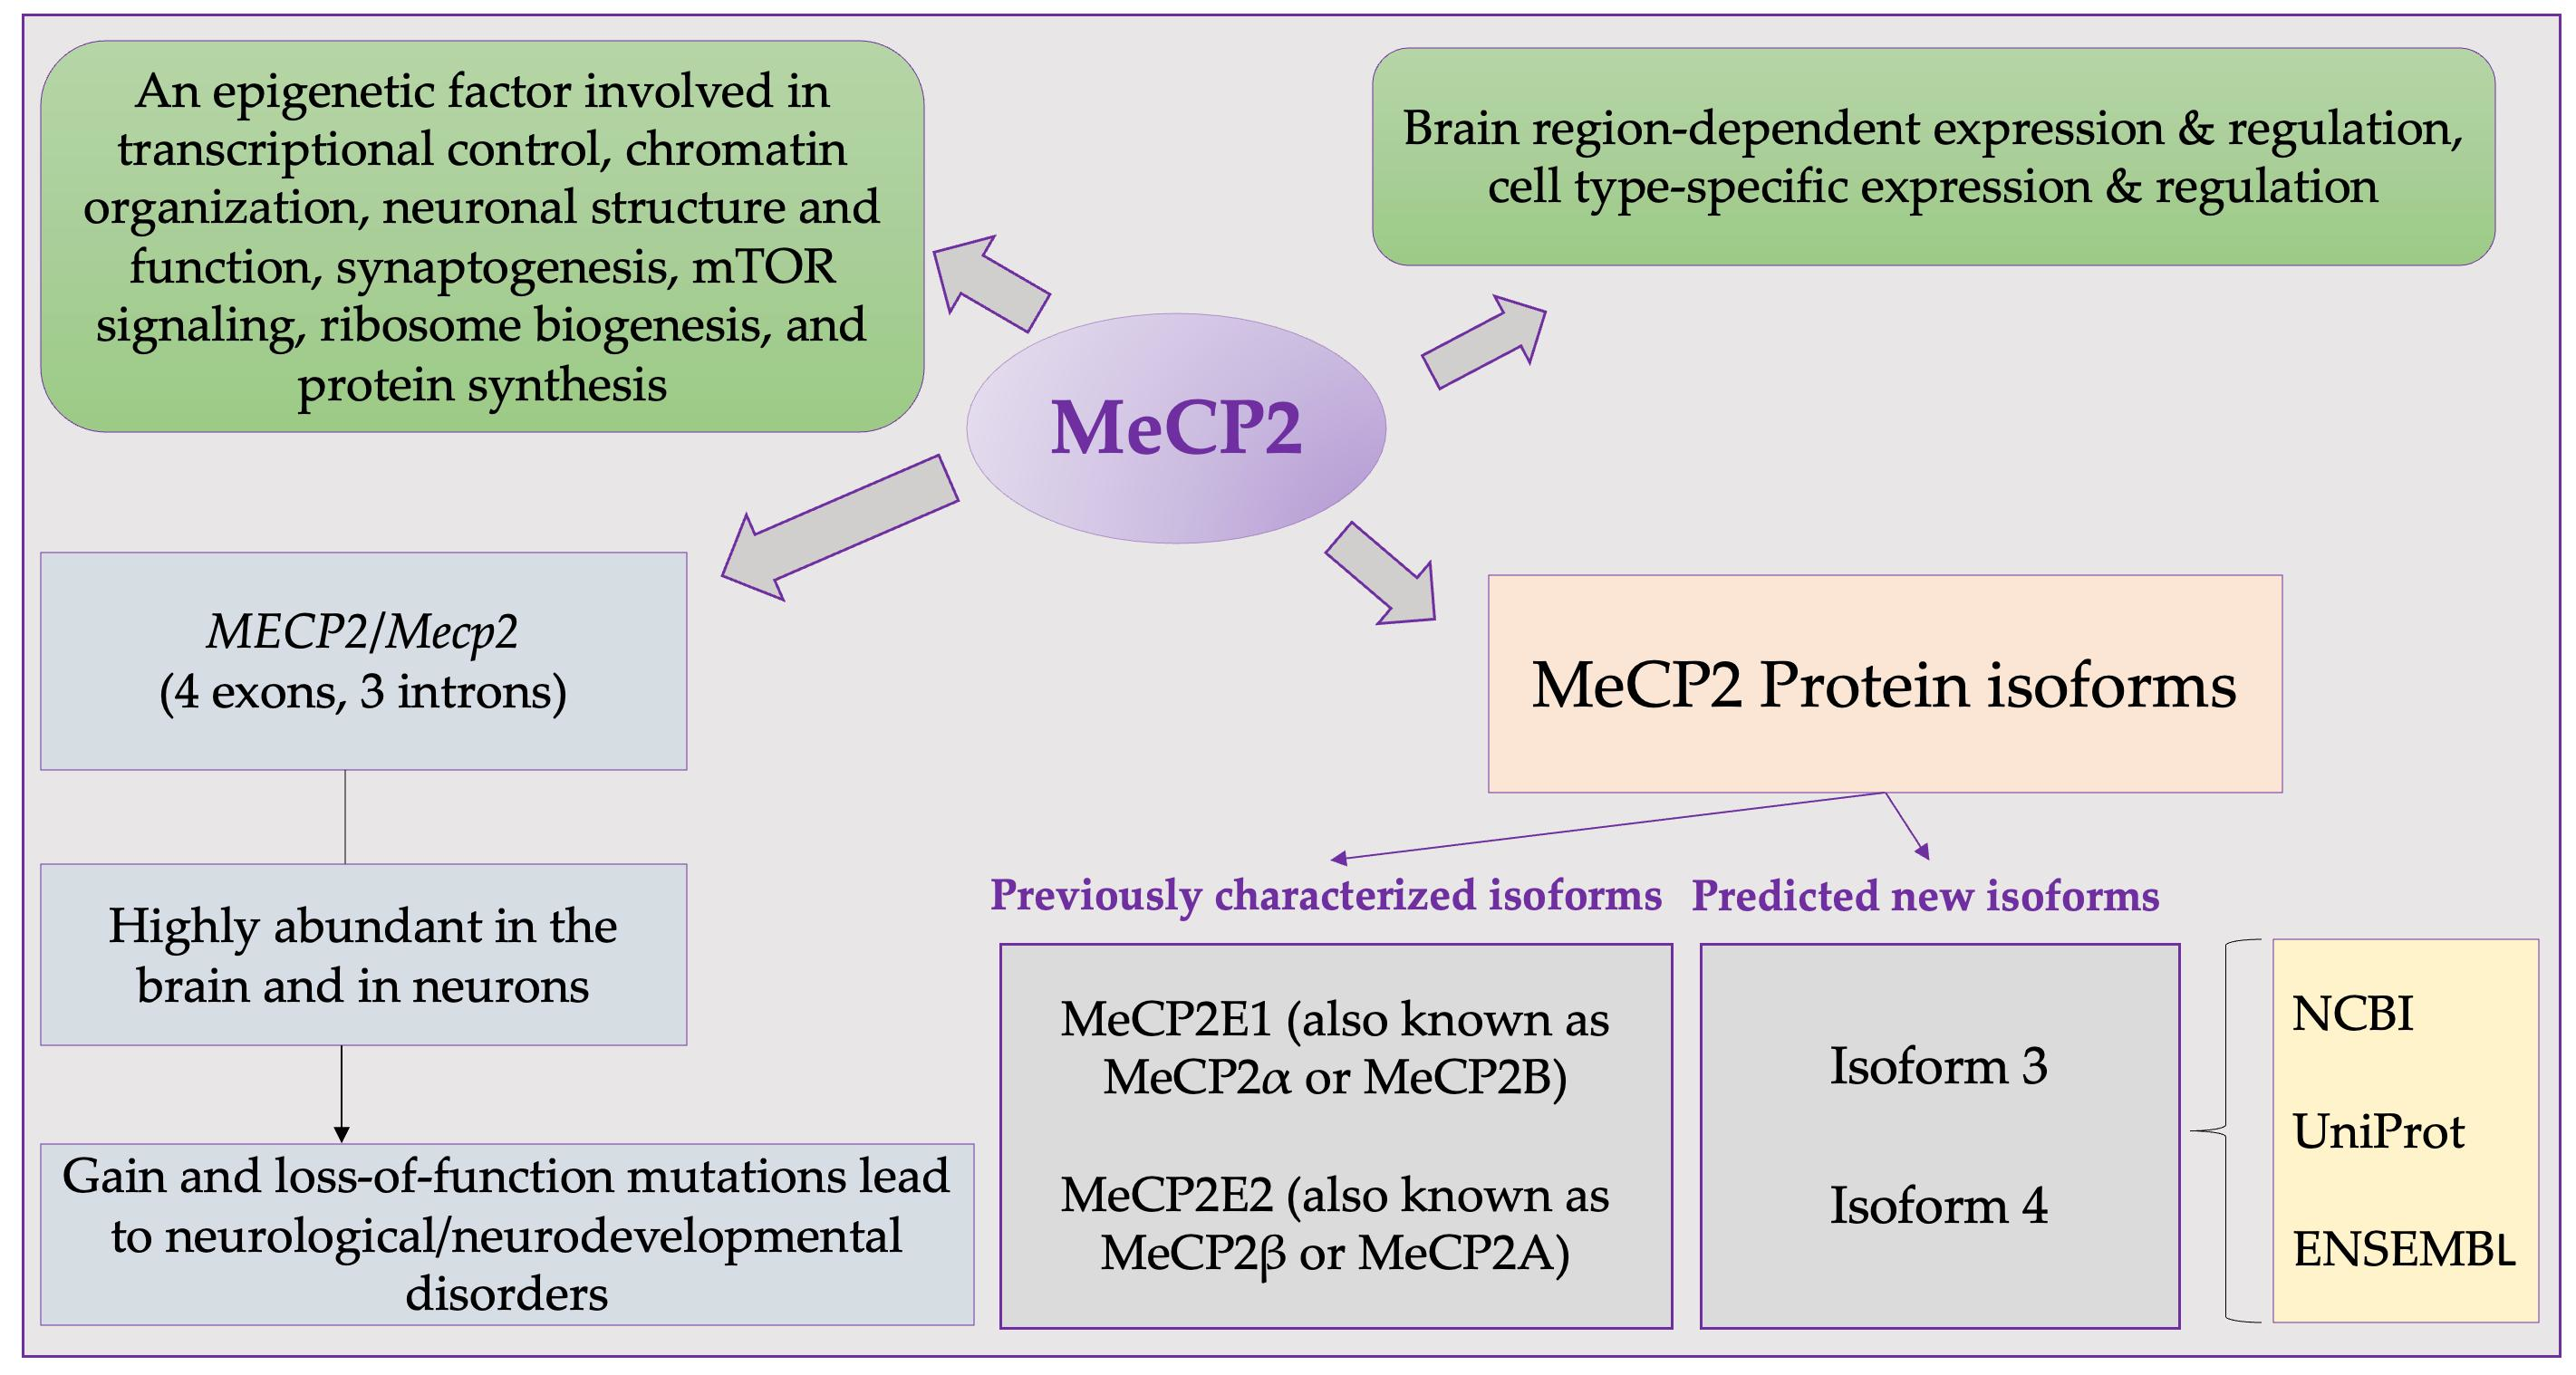
3.1. Potential MeCP2 Protein Isoforms

Several previous studies have provided evidence for a difference in relevance of known MeCP2E1 and MeCP2 E2 isoforms in neurodevelopment and associated disorders [53,54,56]. Analysis of potential MeCP2 isoforms is essential for the understanding of all MeCP2 functions and its complete role in the development of different organs.
NCBI lists 10 reviewed transcripts that are predicted to encode 4 protein isoforms, 2 of which are MeCP2E1 and MeCP2E2. The other 2 isoforms, isoforms 3 and 4, have shorter N-termini than E1 or E2 (Figure 1). UniProt lists 10 proteins isoforms, 2 of which are MeCP2E1 (P51608-2) and MeCP2E2 (P51608-1).
Alignment of both NCBI and UniProt MeCP2 protein isoforms provides insights into potential functions of the isoforms if they exist in vivo. Functional domains are defined as minimal protein regions required for certain protein functions; therefore, we can assume that if only a part of a defined functional domain is present, the respective protein function is expected to be reduced or eliminated. As expected, NCBI isoforms 1 and 2 and UniProt isoforms P51608-1 and -2 have all of the functional domains as these are MeCP2E2 and MeCP2E1, respectively. The rest of potential MeCP2 isoforms were found to be missing complete or portions of their functional domains or interaction sites with other proteins (Table 3 and Table 4) potentially suggesting their limited functions. NCBI MeCP2 isoform 3 was missing HMGD1 and had incomplete methyl-CpG-binding domain (MBD) and H3-M-T interaction sequence, suggesting that this isoform could still be transported to the nucleus, and may have the capability of binding to DNA non-specifically, remodel chromatin, repress transcription, and interact with histone H3 methyltransferase (H3-M-T), NCoR/Smrt co-repressor, TBL1XR1, and group 2 WW motif-containing protein. NCBI MeCP2 isoform 4 is missing or has incomplete functional domains except for NLS2 and AT-hook 2, and it also has all of the protein interacting sites, besides H3-M-T. Isoform 4 is predicted to mostly function as a mediator for other transcription repressing proteins (NCoR/Smrt co-repressor, TBL1XR1, and group 2 WW motif-containing protein) by binding to DNA non-specifically with its AT-hook 2. Since C-terminal domain (CTD) is present, isoform 4 is also potentially expected to participate in the assembly of chromatin structures. All of the predicted isoforms from UniProt were found to be missing most of their functional features including NLS1 and 2, suggesting that even if they existed in vivo, they would have little to no effect on transcription as they would not be transported into the nucleus after translation.

3.2. In Silico Analysis of the Human MECP2 Gene

MeCP2 isoforms are known to exhibit differential expression between brain regions [36] and between different brain cell types [34] in mice. Despite the importance of MeCP2 expression regulation during brain development, the mechanisms through which MeCP2 expression is regulated are not well defined. In this part of the study, we produced MECP2 gene epigenetic maps to characterize MECP2 gene promoter and cis-REs in different brain regions and tissues of human donors of various ages and sexes. We focused on previously described MECP2 cis-REs [55] and applied in silico methods for data mining and visualization of datasets using the UCSC genome viewing browser.
All the genomic fragments identified in this study were overlayed in UCSC to assess the relation between different epigenetic modifications and chromatin accessibility (Figure 7). It can be observed that the distinct epigenetically significant fragments identified in this study tend to co-localize. This was expected, considering that the nucleosome free regions would contain binding sites for various transcription factors. It was also anticipated that the gene promoters would exhibit more open chromatin structure and epigenetic modifications associated with euchromatin, suggesting their essential role in transcription initiation. Previously identified F-elements have been further characterized. However, we also observed co-localization of “A”, “B” and “H” fragments at the A4 (MECP2 intron 2), A6 (IRAK1 intron) and A8 (HCFC1 intron) suggesting that they are hypomethylated and are accessible throughout different tissues.
H3K27ac in tandem with H3K4me1 defines active enhancers [57]. An increase in these histone PTMs is observed in F16, F17, F21 enhancers, and F3 silencer in various human brain regions. Even despite the confirmed function of F3 as a silencer of MECP2, its histone modification profile fits enhancer criteria. At the same time, F3 and F21 were found hypomethylated in mid-frontal human gyrus of different age, while F16 was found to be accessible (fragment B5) throughout the neural and glial cells of various parts of adult brain. F13 silencer was found to have a lower abundance of H3K27ac and H3K4me1 when compared to the nearby genomic regions. H3K4me3 is known to be highly abundant at the transcription start sites [58], which is consistent with what we observe in Figure 3B.
H3K4me3 is also highly abundant upstream of the MECP2 TSS in intron 1 (~0.6–1.2 kb), which in combination with H3K27ac and H3K36me3 [59] may facilitate alternative splicing of the MECP2 isoforms. This segment was also found to be hypomethylated in mid-frontal human gyrus of different age (H1) and accessible in different tissues (A1, A2) and throughout the brain (B1). H3K36me3 which associates with euchromatin differs in regions of high abundance from H3K4me1 and H3K27ac mostly outside of the MECP2 gene, potentially indicating its possible co-acting role with other modifications within the MECP2 gene. H3K27me3 is associated with a long-term silencing of genes [60] via the formation of the facultative heterochromatin. H3K9me3 is known to be associated with constitutive heterochromatin [60]. We report even distribution for both of the transcription repressive modifications (H3K27me3, H3K9me3) throughout the MECP2 gene and its cis-REs suggesting on the activity level of the MECP2 gene in these analyzed 7 brain regions. H3K4me1 and H3K4me3 are found to be almost mutually exclusive, suggesting their positional restriction to outside and within the promoter, respectively.
Some previously identified enhancers and silencers exhibited similar chromatin accessibility profiles. Even though this information does not provide any insights regarding MECP2 expression in different tissue types and cellular subtypes, these findings may suggest the presence of antagonistic effect of various active cis-REs on the MECP2 expression.

4. Materials and Methods

4.1. Analysis of MECP2 Transcripts and Protein Isoforms from NCBI, UniProt, ENSEMBL

MECP2 human gene was identified in the NCBI database (Gene ID: 4204). GenBank records for all 10 transcripts relevant to the 4204 gene were extracted as a .gb file. From the file, XM_ sequences were identified and excluded from this study as being non-reviewed. “Comment” sections of each record were analyzed to identify MeCP2E1 (also known as MeCP2α or MeCP2B) and MeCP2E2 (also known as MeCP2β or MeCP2A) coding transcripts. Information about the difference between MECP2E1/E2 and other transcripts as well as encoded protein isoforms was also extracted from the “Comment” sections. “Evidence-Data” codes were interpreted using Evidenceontology.org [61]. NCBI respective protein sequences encoded by 10 transcripts were extracted as a .gp file. UniProt record for human MeCP2 protein (P51608) has also been analyzed. Eight potential protein isoform record sequences and 2 reviewed sequences were extracted from the record. Additionally, from each potential isoform record, Ensembl cross-references were extracted from the “Genome annotation databases” section. Then, Ensembl transcript support level was used to assess the quality of the sequences. Then, selected sequences were aligned using ClustalOmega [62] multiple sequence alignment web tool. Exon nucleotide sequences were retrieved from NG_007107.3 human MECP2 record and translated using Expasy “Translate” tool [63]. Then, the translated exons sequences from the appropriate reading frames were highlighted in the alignment. The following functional groups were also labelled on the alignment: methyl-CpG-binding domain (MBD) sequence [64,65], transcriptional-repression domain (TRD) [55], high mobility group-like domains 1 and 2 (HMGD1 and 2) [65], nuclear localization signals 1 and 2 (NLS1 and 2) [65], alternative DNA binding domain (aDBD) [65], group 2 WW motif-containing protein interaction region (WW-2) [65], histone H3 methyltransferase interaction region [65], two AT hooks (from UniProt P51608 record), TBL1XR1 interaction region (from UniProt P51608 record), NCoR/SMRT interaction domain (NID) [22], C-terminal domains α and β (CTDα and CTDβ) [65] (Supplementary Table S1). To find the origin of the reference non-matching sequences, cDNA of Ensembl transcript sequences, from which UniProt isoforms were derived, was used as a query for UCSC BLAT [66] along with the reference exon sequences for the human MECP2 gene extracted from NCBI. The output of BLAT was visualized in the UCSC genome viewing browser in the form of mapping of query sequences to the hg38 version of the human genome (Supplementary Figure S1). All information collected from the databases and alignment analysis were summarized in Table 1, Table 2, Table 3 and Table 4. The data were last verified on 15 October 2022.

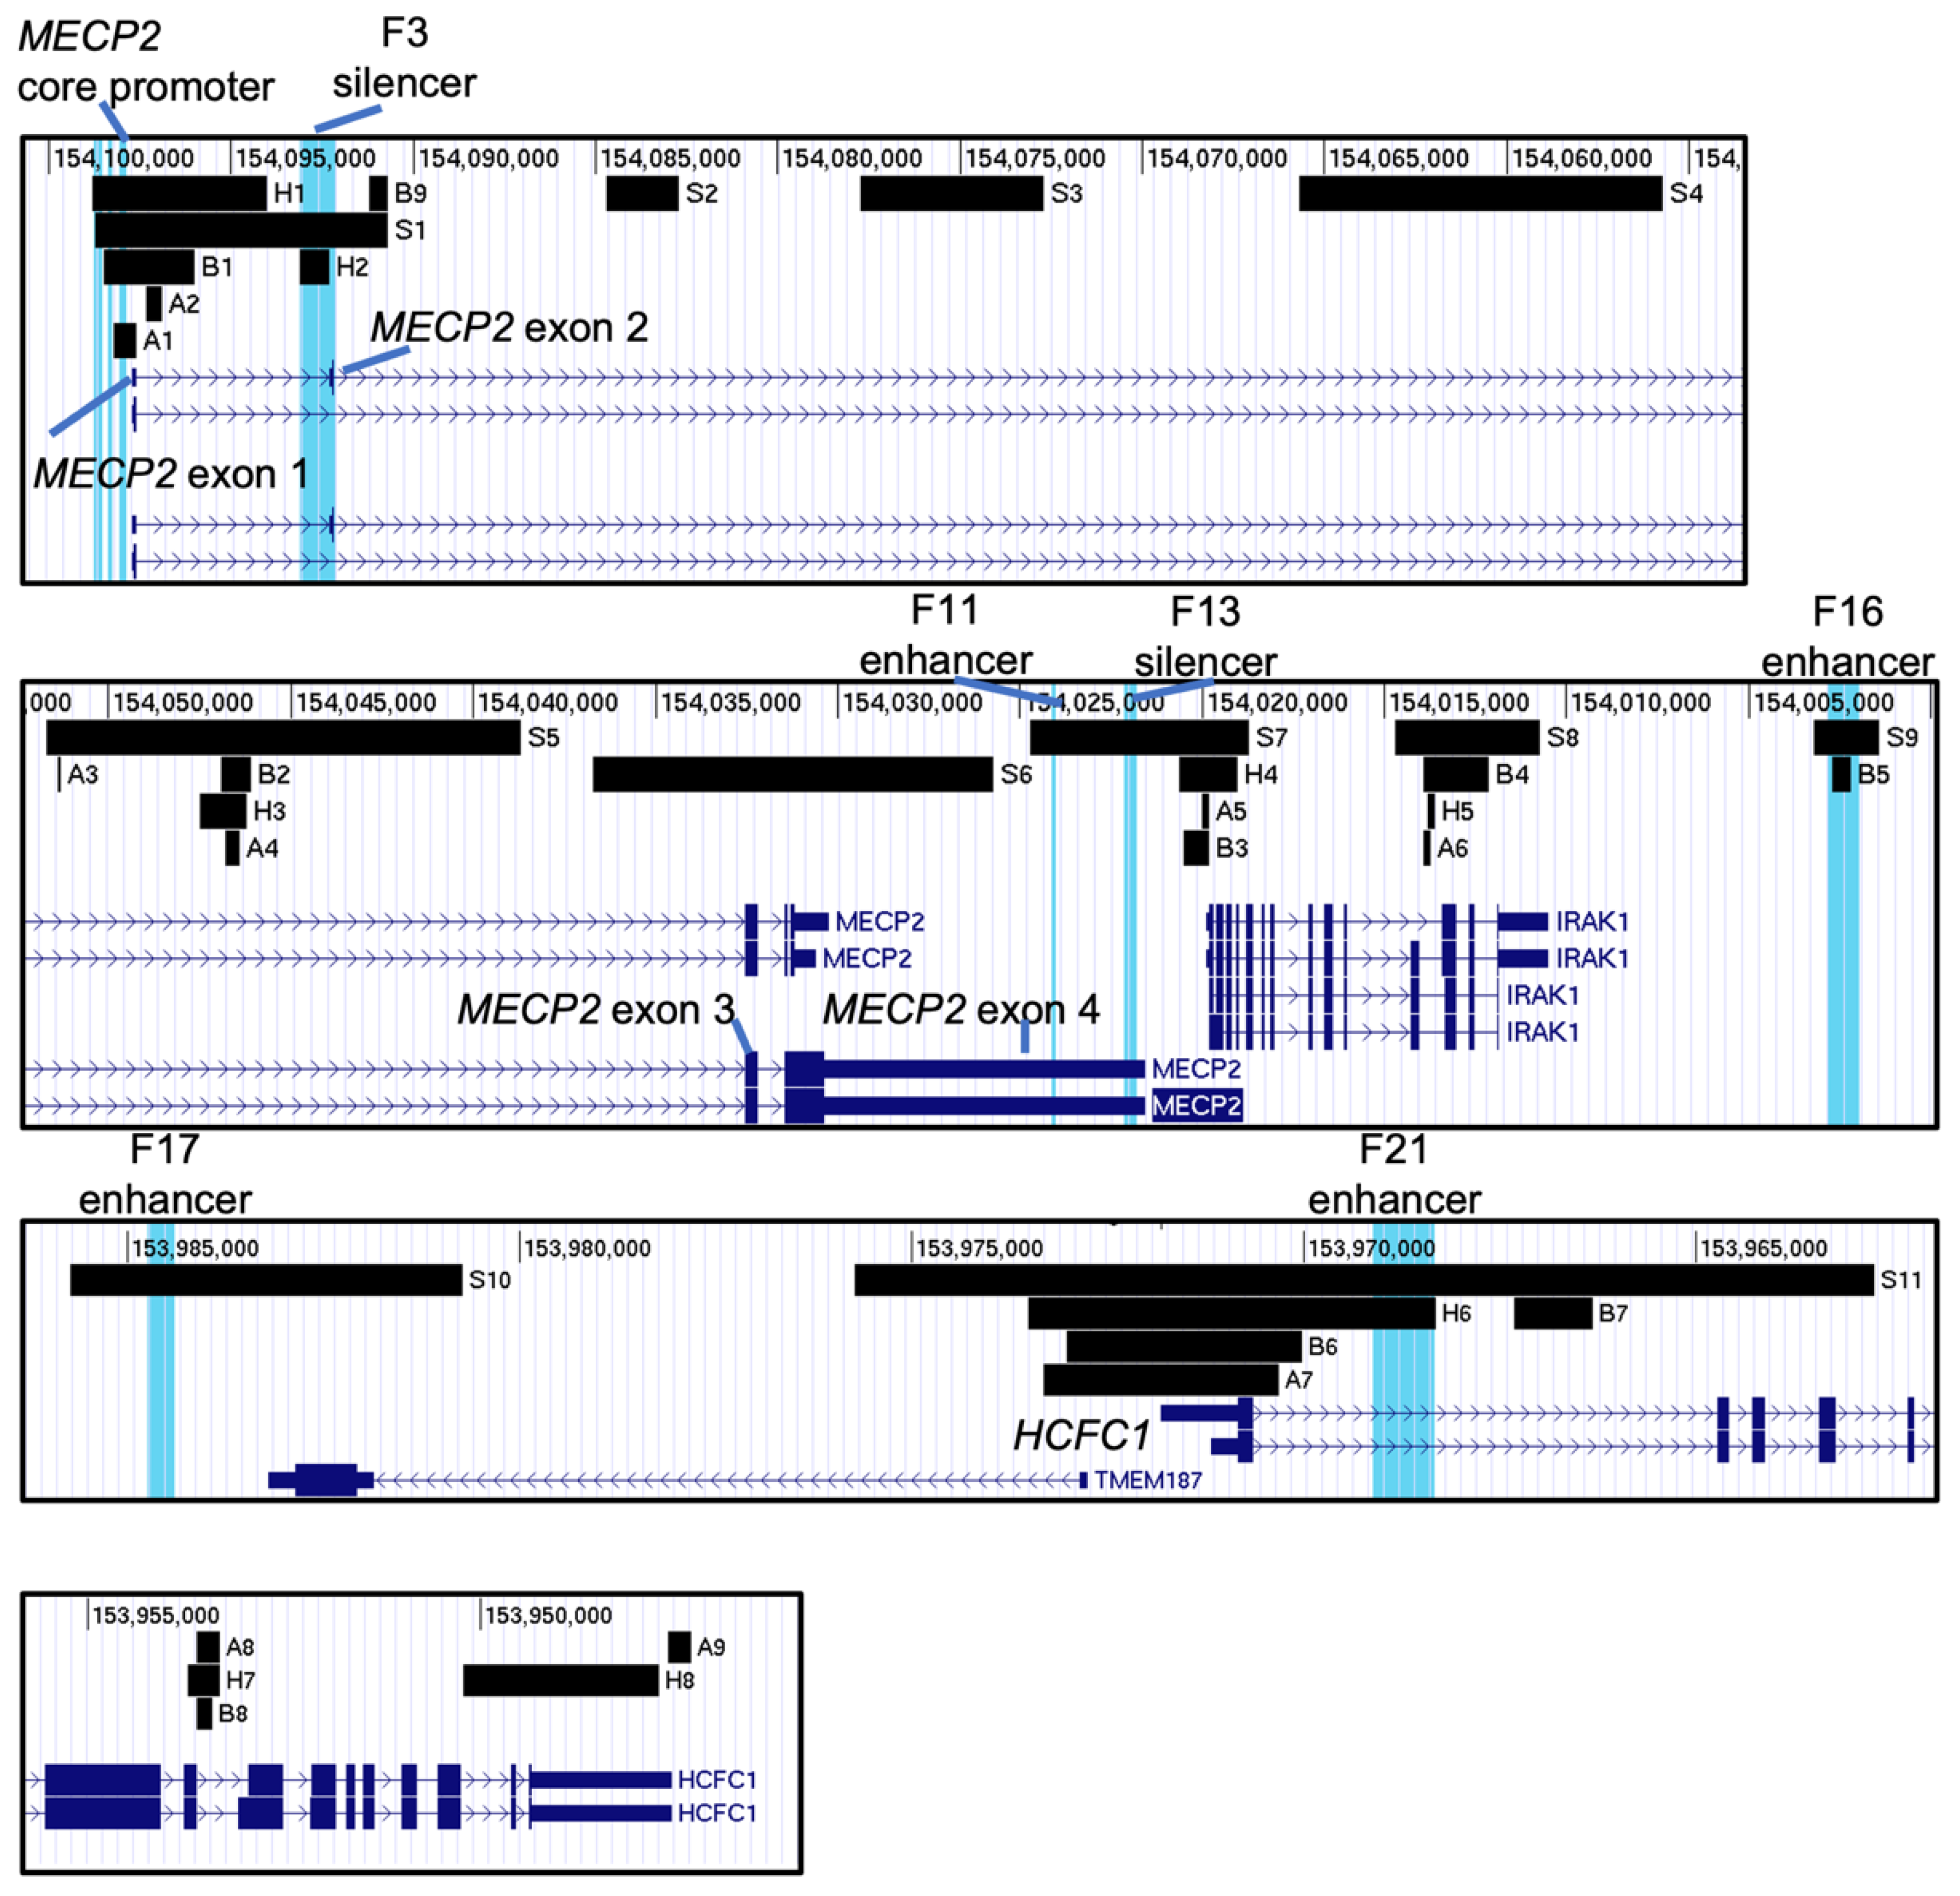
4.2. Locating the MECP2 Gene Regulatory Elements in UCSC

Previously, in 4 human cell lines (HeLa, SK-N-SH, HT1080, and CRL1718) 2 silencer and 4 enhancer elements were identified and functionally confirmed around MECP2, as well as at the MECP2 core and proximal promoter [55]. The human MECP2 gene was identified in the NCBI database (Gene ID: 4204). Relative to TSS position numbers of the promoter elements were subtracted from the first nucleotide number of exon 1 to find the sequences. F3, F11, F13, F16, F17, F21 regulatory elements sequences were extracted from NCBI Nucleotide Database based on their “gi:” accession number and positions of the regions. All the sequences were formatted in fasta and used as input to BLAT [66] to be aligned with Human hg19 genome assembly. This assembly was chosen as the one having the largest number of datasets available. Then, the alignment was visualized in UCSC as a custom track.

4.3. Selection and Visualization of Datasets in UCSC

UCSC genome viewing browser [50] was used to visualize whole-genome sequencing data files deposited from NCBI Gene Expression Omnibus (GEO) [67] and ENCODE [68,69] databases.
Roadmap Epigenomics Visualization Hub, collection of Roadmap Epigenomics Project data files (also available in GEO [67]: Series GSE17312), was used to search for available whole-genome sequencing datasets pre-uploaded to UCSC file collection. A part of the information about data tracks selected is labelled on top of each track in UCSC. For histone PTMs analysis, the donors selected were: #112 (75 Y, female, disease-free, Rush University Medical Center), and #149 (81 Y, male, disease-free, Rush University Medical Center). All available data for histone PTMs were included in the analysis. Multiple brain region histone PTMs analysis alignment was created using all data from male data sets used for sex comparison figures.
The analysis of DNase-seq data included data tracks from various donors of 85 to 127 days old during the fetal stage of development from The NIH Roadmap Epigenomics Mapping Consortium data series (GSE18927). The representative replicates were selected to be close in age between male and female tissue samples. Tissue selection was based on the presence of both male and female tissue datasets available in UCSC.
ATAC-seq data was added to UCSC Human hg38 genome from GSE211822 submitted by Fullard J.F., Dong P., Bendl J., and Roussos P. as custom data tracks. Both glial and neuronal cells from 25 brain cortical and subcortical areas were included from 6 neurotypical controls as per the data series description section.
The analysis of methylation data of frontal gyrus of different donors’ ages is from GEO: GSE17312 [67,70], which had also been pre-uploaded to UCSC. Processed bisulphate sequencing data was displayed in 6 data tracks as the mean value DNA methylation on the scale from 0 to 1 (limited by black lines). The other 6 data tracks highlight hypomethylated regions (HMRs) in blue. All tissue samples are from healthy males of respective ages as labelled.
All data tracks were configured as follows: type of graph = bar, data view scaling = auto-scale to data view. The genome sequence was reversed so that MECP2 exon 1 is on the left. Other settings were kept as default. Relative distances to a TSS were determined by subtracting the first nucleotide position of MECP2 exon 1 (including 5′ UTR) from the first and last nucleotide positions of the genomic segment of interest. Upstream and downstream sequences relative to TSS were assigned positive and negative values, respectively. Mapped cis-REs were highlighted in UCSC to find the corresponding fragments on the data tracks.
The links to the UCSC sessions with the described above data tracks are included as Supplementary Table S2.

5. Conclusions

Based on the support level, sequence alignments and identification of which functional domains are present in each isoform, we report NCBI MeCP2 isoforms 3 and 4 have the potential for functional existence in vivo, unless they are degraded at the transcript level. We hypothesize that if they existed in vivo, they would have required functional domains to bind to DNA non-specifically, reconfigure chromatin, repress transcription and interact with other proteins. As a future direction, the presence and the expression levels of these transcripts need to be confirmed in vivo and in vitro, along with their protein levels and their stability.
We identified genomic fragments with distinct patterns of histone PTMs, hypomethylation, and DNA accessibility in various human tissues and cell types. In addition to their co-localization in promoter regions, we also described other intronic potential areas of interest. Overall, despite high degree of similarity, the differences in these epigenetic profiles might result in previously reported differential MECP2 expression in different tissues and brain regions.

Supplementary Materials

The following supporting information can be downloaded at: https://www.mdpi.com/article/10.3390/ijms232415643/s1.

Author Contributions

D.S. prepared the first draft of Figures and text. Y.M.V. and D.S. prepared the Tables. J.R.D. provided scientific insight. M.R. provided supervision, scientific guidance, and research support. All authors have read and agreed to the published version of the manuscript.

Funding

This research is supported by funding from the Natural Sciences and Engineering Research Council of Canada (NSERC) Discovery Grant RGPIN-2016-06035 to MR, and Canadian Institutes of Health Research (CIHR) Project Grant 202203PJG-482520-CIA-CDAA-111824 to MR and JRD.

Institutional Review Board Statement

Not applicable.

Informed Consent Statement

Not applicable.

Data Availability Statement

Not applicable. All information for this manuscript has been extracted from publicly available datasets.

Acknowledgments

We would like to thank all members of the Rastegar Lab for helpful discussions.

Conflicts of Interest

The authors declare no conflict of interest.

Abbreviations

5-hmC: 5-hydroxy-methyl cytosine; 5-mC: 5-methyl cytosine; aDBD: alternative DNA binding domain; ATAC-seq: assay for transposase-accessible chromatin with sequencing; BAC: brain anterior caudate; BAG: brain angular gyrus: BCG: brain cingulate gyrus; BHM: brain hippocampus middle; BITL: brain inferior temporal lobe; BMFL: brain mid frontal lobe; BRE: B recognition element; BSN: brain substantia nigra; BS-seq: bisulfite sequencing; CDS: coding sequence; cis-REs: cis-regulatory elements; CTDα: C-terminal domain α; CTDβ: C-terminal domain β; DNAse-seq: DNase I hypersensitive sites sequencing; DPE: downstream promoter element; EMBL-EBI: European Bioinformatics Institute; EST: expressed sequence tag; GEO: Gene Expression Omnibus; F: female(s); H3-M-T: histone H3 methyltransferase; H3-M-T IS: histone H3 methyltransferase interaction sequence; HDAC: histone deacetylases; HMGD1:high mobility group protein-like domain 1; HMGD2: high mobility group protein-like domain 2; HMR: hypomethylated region; Inr: Initiator element; INSDC: International Nucleotide Sequence Database Collaboration; kb: kilobase; M: male (s); MBD: methyl-CpG-binding domain; MeCP2: Methyl CpG binding protein 2; NCBI: National Center for Biotechnology Information; NID: NCoR/SMRT interaction domain; NLS1: nuclear localization signals 1; NLS2: nuclear localization signals 2; NM_: mRNA; PIR: Protein Information Institute; PTM: post-translational modifications; RefSeq: Reference Sequence; RTT: Rett Syndrome; SIB: Swiss Institute of Bioinformatics; TBL1XR1 IS: TBL1XR1 interaction sequence; TRD: transcriptional repression domain; TrEMBL: Translated EMBL Nucleotide Sequence Data Library; TSS: transcription start site; UniParc: UniProt Archive; UniProt: Universal Protein Resource; UniProtKB: UniProt Knowledgebase; UniRef: UniProt Reference Clusters; WW-2 IS: Group 2 WW motif-containing protein interaction sequence.

References

  1. Signor, S.A.; Nuzhdin, S.V. The Evolution of Gene Expression in cis and trans. Trends Genet. 2018, 34, 532–544. [Google Scholar] [CrossRef] [PubMed]
  2. Carthew, R.W. Gene Regulation and Cellular Metabolism: An Essential Partnership. Trends Genet. 2021, 37, 389–400. [Google Scholar] [CrossRef] [PubMed]
  3. Bin Akhtar, G.; Buist, M.; Rastegar, M. MeCP2 and transcriptional control of eukaryotic gene expression. Eur. J. Cell Biol. 2022, 101, 151237. [Google Scholar] [CrossRef] [PubMed]
  4. Riethoven, J.J. Regulatory regions in DNA: Promoters, enhancers, silencers, and insulators. Methods Mol. Biol. 2010, 674, 33–42. [Google Scholar] [CrossRef]
  5. Rastegar, M.; Szpirer, C.; Rousseau, G.G.; Lemaigre, F.P. Hepatocyte nuclear factor 6: Organization and chromosomal assignment of the rat gene and characterization of its promoter. Biochem. J. 1998, 334 Pt 3, 565–569. [Google Scholar] [CrossRef] [Green Version]
  6. Kolovos, P.; Knoch, T.A.; Grosveld, F.G.; Cook, P.R.; Papantonis, A. Enhancers and silencers: An integrated and simple model for their function. Epigenetics Chromatin 2012, 5, 1. [Google Scholar] [CrossRef] [Green Version]
  7. Calhoun, V.C.; Stathopoulos, A.; Levine, M. Promoter-proximal tethering elements regulate enhancer-promoter specificity in the Drosophila Antennapedia complex. Proc. Natl. Acad. Sci. USA 2002, 99, 9243–9247. [Google Scholar] [CrossRef] [Green Version]
  8. Delcuve, G.P.; Rastegar, M.; Davie, J.R. Epigenetic control. J. Cell Physiol. 2009, 219, 243–250. [Google Scholar] [CrossRef]
  9. Liyanage, V.R.; Jarmasz, J.S.; Murugeshan, N.; Del Bigio, M.R.; Rastegar, M.; Davie, J.R. DNA modifications: Function and applications in normal and disease States. Biology 2014, 3, 670–723. [Google Scholar] [CrossRef]
  10. Rastegar, M.; Yasui, D.H. Editorial: Epigenetic Mechanisms and Their Involvement in Rare Diseases. Front. Genet. 2021, 12, 755076. [Google Scholar] [CrossRef]
  11. Biswas, S.; Rao, C.M. Epigenetic tools (The Writers, The Readers and The Erasers) and their implications in cancer therapy. Eur. J. Pharmacol. 2018, 837, 8–24. [Google Scholar] [CrossRef] [PubMed]
  12. Rastegar, M. Epigenetics and Cerebellar Neurodevelopmental Disorders. In Development of the Cerebellum from Molecular Aspects to Diseases; Marzban, H., Ed.; Springer International Publishing: Cham, Switzerland, 2017; pp. 197–218. [Google Scholar]
  13. Mnatzakanian, G.N.; Lohi, H.; Munteanu, I.; Alfred, S.E.; Yamada, T.; MacLeod, P.J.; Jones, J.R.; Scherer, S.W.; Schanen, N.C.; Friez, M.J.; et al. A previously unidentified MECP2 open reading frame defines a new protein isoform relevant to Rett syndrome. Nat. Genet. 2004, 36, 339–341. [Google Scholar] [CrossRef] [PubMed] [Green Version]
  14. Rodrigues, D.C.; Mufteev, M.; Ellis, J. Regulation, diversity and function of MECP2 exon and 3’UTR isoforms. Hum. Mol. Genet. 2020, 29, R89–R99. [Google Scholar] [CrossRef] [PubMed]
  15. Lewis, J.D.; Meehan, R.R.; Henzel, W.J.; Maurer-Fogy, I.; Jeppesen, P.; Klein, F.; Bird, A. Purification, sequence, and cellular localization of a novel chromosomal protein that binds to methylated DNA. Cell 1992, 69, 905–914. [Google Scholar] [CrossRef]
  16. Meehan, R.R.; Lewis, J.D.; McKay, S.; Kleiner, E.L.; Bird, A.P. Identification of a mammalian protein that binds specifically to DNA containing methylated CpGs. Cell 1989, 58, 499–507. [Google Scholar] [CrossRef]
  17. Mellen, M.; Ayata, P.; Dewell, S.; Kriaucionis, S.; Heintz, N. MeCP2 binds to 5hmC enriched within active genes and accessible chromatin in the nervous system. Cell 2012, 151, 1417–1430. [Google Scholar] [CrossRef] [Green Version]
  18. Meehan, R.R.; Lewis, J.D.; Bird, A.P. Characterization of MeCP2, a vertebrate DNA binding protein with affinity for methylated DNA. Nucleic Acids Res. 1992, 20, 5085–5092. [Google Scholar] [CrossRef] [Green Version]
  19. Nan, X.; Campoy, F.J.; Bird, A. MeCP2 is a transcriptional repressor with abundant binding sites in genomic chromatin. Cell 1997, 88, 471–481. [Google Scholar] [CrossRef] [Green Version]
  20. Yu, F.; Thiesen, J.; Stratling, W.H. Histone deacetylase-independent transcriptional repression by methyl-CpG-binding protein 2. Nucleic Acids Res. 2000, 28, 2201–2206. [Google Scholar] [CrossRef] [Green Version]
  21. Fuks, F.; Hurd, P.J.; Wolf, D.; Nan, X.; Bird, A.P.; Kouzarides, T. The methyl-CpG-binding protein MeCP2 links DNA methylation to histone methylation. J. Biol. Chem. 2003, 278, 4035–4040. [Google Scholar] [CrossRef]
  22. Lyst, M.J.; Ekiert, R.; Ebert, D.H.; Merusi, C.; Nowak, J.; Selfridge, J.; Guy, J.; Kastan, N.R.; Robinson, N.D.; de Lima Alves, F.; et al. Rett syndrome mutations abolish the interaction of MeCP2 with the NCoR/SMRT co-repressor. Nat. Neurosci. 2013, 16, 898–902. [Google Scholar] [CrossRef] [PubMed] [Green Version]
  23. Kokura, K.; Kaul, S.C.; Wadhwa, R.; Nomura, T.; Khan, M.M.; Shinagawa, T.; Yasukawa, T.; Colmenares, C.; Ishii, S. The Ski protein family is required for MeCP2-mediated transcriptional repression. J. Biol. Chem. 2001, 276, 34115–34121. [Google Scholar] [CrossRef] [PubMed] [Green Version]
  24. Nan, X.; Hou, J.; Maclean, A.; Nasir, J.; Lafuente, M.J.; Shu, X.; Kriaucionis, S.; Bird, A. Interaction between chromatin proteins MECP2 and ATRX is disrupted by mutations that cause inherited mental retardation. Proc. Natl. Acad. Sci. USA 2007, 104, 2709–2714. [Google Scholar] [CrossRef] [PubMed] [Green Version]
  25. Kaludov, N.K.; Wolffe, A.P. MeCP2 driven transcriptional repression in vitro: Selectivity for methylated DNA, action at a distance and contacts with the basal transcription machinery. Nucleic Acids Res. 2000, 28, 1921–1928. [Google Scholar] [CrossRef] [PubMed]
  26. Li, Y.; Wang, H.; Muffat, J.; Cheng, A.W.; Orlando, D.A.; Loven, J.; Kwok, S.M.; Feldman, D.A.; Bateup, H.S.; Gao, Q.; et al. Global transcriptional and translational repression in human-embryonic-stem-cell-derived Rett syndrome neurons. Cell Stem Cell 2013, 13, 446–458. [Google Scholar] [CrossRef] [Green Version]
  27. Buist, M.; El Tobgy, N.; Shevkoplyas, D.; Genung, M.; Sher, A.A.; Pejhan, S.; Rastegar, M. Differential Sensitivity of the Protein Translation Initiation Machinery and mTOR Signaling to MECP2 Gain- and Loss-of-Function Involves MeCP2 Isoform-Specific Homeostasis in the Brain. Cells 2022, 11, 1442. [Google Scholar] [CrossRef] [PubMed]
  28. Olson, C.O.; Pejhan, S.; Kroft, D.; Sheikholeslami, K.; Fuss, D.; Buist, M.; Ali Sher, A.; Del Bigio, M.R.; Sztainberg, Y.; Siu, V.M.; et al. MECP2 Mutation Interrupts Nucleolin-mTOR-P70S6K Signaling in Rett Syndrome Patients. Front. Genet. 2018, 9, 635. [Google Scholar] [CrossRef] [Green Version]
  29. Chahrour, M.; Jung, S.Y.; Shaw, C.; Zhou, X.; Wong, S.T.; Qin, J.; Zoghbi, H.Y. MeCP2, a key contributor to neurological disease, activates and represses transcription. Science 2008, 320, 1224–1229. [Google Scholar] [CrossRef] [Green Version]
  30. Shahbazian, M.D.; Antalffy, B.; Armstrong, D.L.; Zoghbi, H.Y. Insight into Rett syndrome: MeCP2 levels display tissue- and cell-specific differences and correlate with neuronal maturation. Hum. Mol. Genet. 2002, 11, 115–124. [Google Scholar] [CrossRef]
  31. Liyanage, V.R.; Zachariah, R.M.; Davie, J.R.; Rastegar, M. Ethanol deregulates Mecp2/MeCP2 in differentiating neural stem cells via interplay between 5-methylcytosine and 5-hydroxymethylcytosine at the Mecp2 regulatory elements. Exp. Neurol 2015, 265, 102–117. [Google Scholar] [CrossRef]
  32. Xu, W.; Liyanage, V.R.B.; MacAulay, A.; Levy, R.D.; Curtis, K.; Olson, C.O.; Zachariah, R.M.; Amiri, S.; Buist, M.; Hicks, G.G.; et al. Genome-Wide Transcriptome Landscape of Embryonic Brain-Derived Neural Stem Cells Exposed to Alcohol with Strain-Specific Cross-Examination in BL6 and CD1 Mice. Sci. Rep. 2019, 9, 206. [Google Scholar] [CrossRef] [Green Version]
  33. Zachariah, R.M.; Olson, C.O.; Ezeonwuka, C.; Rastegar, M. Novel MeCP2 isoform-specific antibody reveals the endogenous MeCP2E1 expression in murine brain, primary neurons and astrocytes. PLoS ONE 2012, 7, e49763. [Google Scholar] [CrossRef] [PubMed]
  34. Liyanage, V.R.B.; Olson, C.O.; Zachariah, R.M.; Davie, J.R.; Rastegar, M. DNA Methylation Contributes to the Differential Expression Levels of Mecp2 in Male Mice Neurons and Astrocytes. Int. J. Mol. Sci. 2019, 20, 1845. [Google Scholar] [CrossRef] [PubMed] [Green Version]
  35. Liyanage, V.R.; Zachariah, R.M.; Rastegar, M. Decitabine alters the expression of Mecp2 isoforms via dynamic DNA methylation at the Mecp2 regulatory elements in neural stem cells. Mol. Autism 2013, 4, 46. [Google Scholar] [CrossRef] [PubMed] [Green Version]
  36. Olson, C.O.; Zachariah, R.M.; Ezeonwuka, C.D.; Liyanage, V.R.; Rastegar, M. Brain region-specific expression of MeCP2 isoforms correlates with DNA methylation within Mecp2 regulatory elements. PLoS ONE 2014, 9, e90645. [Google Scholar] [CrossRef]
  37. Pejhan, S.; Rastegar, M. Role of DNA Methyl-CpG-Binding Protein MeCP2 in Rett Syndrome Pathobiology and Mechanism of Disease. Biomolecules 2021, 11, 75. [Google Scholar] [CrossRef]
  38. Pejhan, S.; Del Bigio, M.R.; Rastegar, M. The MeCP2E1/E2-BDNF-miR132 Homeostasis Regulatory Network Is Region-Dependent in the Human Brain and Is Impaired in Rett Syndrome Patients. Front. Cell Dev. Biol. 2020, 8, 763. [Google Scholar] [CrossRef]
  39. Zachariah, R.M.; Rastegar, M. Linking epigenetics to human disease and Rett syndrome: The emerging novel and challenging concepts in MeCP2 research. Neural Plast. 2012, 2012, 415825. [Google Scholar] [CrossRef] [Green Version]
  40. Buist, M.; Fuss, D.; Rastegar, M. Transcriptional Regulation of MECP2E1-E2 Isoforms and BDNF by Metformin and Simvastatin through Analyzing Nascent RNA Synthesis in a Human Brain Cell Line. Biomolecules 2021, 11, 1253. [Google Scholar] [CrossRef]
  41. Amir, R.E.; Van den Veyver, I.B.; Wan, M.; Tran, C.Q.; Francke, U.; Zoghbi, H.Y. Rett syndrome is caused by mutations in X-linked MECP2, encoding methyl-CpG-binding protein 2. Nat. Genet. 1999, 23, 185–188. [Google Scholar] [CrossRef]
  42. Liyanage, V.R.; Rastegar, M. Rett syndrome and MeCP2. Neuromol. Med. 2014, 16, 231–264. [Google Scholar] [CrossRef] [PubMed] [Green Version]
  43. Sheikh, T.I.; Ausio, J.; Faghfoury, H.; Silver, J.; Lane, J.B.; Eubanks, J.H.; MacLeod, P.; Percy, A.K.; Vincent, J.B. From Function to Phenotype: Impaired DNA Binding and Clustering Correlates with Clinical Severity in Males with Missense Mutations in MECP2. Sci. Rep. 2016, 6, 38590. [Google Scholar] [CrossRef] [PubMed] [Green Version]
  44. Pejhan, S.; Siu, V.M.; Ang, L.C.; Del Bigio, M.R.; Rastegar, M. Differential brain region-specific expression of MeCP2 and BDNF in Rett Syndrome patients: A distinct grey-white matter variation. Neuropathol. Appl. Neurobiol. 2020, 46, 735–750. [Google Scholar] [CrossRef] [PubMed]
  45. Hagberg, B.; Aicardi, J.; Dias, K.; Ramos, O. A progressive syndrome of autism, dementia, ataxia, and loss of purposeful hand use in girls: Rett’s syndrome: Report of 35 cases. Ann. Neurol 1983, 14, 471–479. [Google Scholar] [CrossRef]
  46. Ramocki, M.B.; Tavyev, Y.J.; Peters, S.U. The MECP2 duplication syndrome. Am. J. Med. Genet. A 2010, 152, 1079–1088. [Google Scholar] [CrossRef] [Green Version]
  47. The NCBI Handbook [Internet]; 2nd ed.; National Center for Biotechnology Information (US): Bethesda (MD, USA). 2013. Available online: https://www.ncbi.nlm.nih.gov/books/NBK143764/ (accessed on 1 October 2022).
  48. Yates, A.D.; Achuthan, P.; Akanni, W.; Allen, J.; Allen, J.; Alvarez-Jarreta, J.; Amode, M.R.; Armean, I.M.; Azov, A.G.; Bennett, R.; et al. Ensembl 2020. Nucleic Acids Res. 2020, 48, D682–D688. [Google Scholar] [CrossRef]
  49. UniProt Consortium, T. UniProt: The universal protein knowledgebase. Nucleic Acids Res. 2018, 46, 2699. [Google Scholar] [CrossRef] [Green Version]
  50. Kent, W.J.; Sugnet, C.W.; Furey, T.S.; Roskin, K.M.; Pringle, T.H.; Zahler, A.M.; Haussler, D. The human genome browser at UCSC. Genome Res. 2002, 12, 996–1006. [Google Scholar] [CrossRef] [Green Version]
  51. Robinson, J.T.; Thorvaldsdottir, H.; Winckler, W.; Guttman, M.; Lander, E.S.; Getz, G.; Mesirov, J.P. Integrative genomics viewer. Nat. Biotechnol. 2011, 29, 24–26. [Google Scholar] [CrossRef] [Green Version]
  52. Kriaucionis, S.; Bird, A. The major form of MeCP2 has a novel N-terminus generated by alternative splicing. Nucleic Acids Res. 2004, 32, 1818–1823. [Google Scholar] [CrossRef]
  53. Yasui, D.H.; Gonzales, M.L.; Aflatooni, J.O.; Crary, F.K.; Hu, D.J.; Gavino, B.J.; Golub, M.S.; Vincent, J.B.; Carolyn Schanen, N.; Olson, C.O.; et al. Mice with an isoform-ablating Mecp2 exon 1 mutation recapitulate the neurologic deficits of Rett syndrome. Hum. Mol. Genet. 2014, 23, 2447–2458. [Google Scholar] [CrossRef] [PubMed]
  54. Martinez de Paz, A.; Khajavi, L.; Martin, H.; Claveria-Gimeno, R.; Tom Dieck, S.; Cheema, M.S.; Sanchez-Mut, J.V.; Moksa, M.M.; Carles, A.; Brodie, N.I.; et al. MeCP2-E1 isoform is a dynamically expressed, weakly DNA-bound protein with different protein and DNA interactions compared to MeCP2-E2. Epigenetics Chromatin 2019, 12, 63. [Google Scholar] [CrossRef] [PubMed] [Green Version]
  55. Liu, J.; Francke, U. Identification of cis-regulatory elements for MECP2 expression. Hum. Mol. Genet. 2006, 15, 1769–1782. [Google Scholar] [CrossRef] [Green Version]
  56. Itoh, M.; Tahimic, C.G.; Ide, S.; Otsuki, A.; Sasaoka, T.; Noguchi, S.; Oshimura, M.; Goto, Y.; Kurimasa, A. Methyl CpG-binding protein isoform MeCP2_e2 is dispensable for Rett syndrome phenotypes but essential for embryo viability and placenta development. J. Biol. Chem. 2012, 287, 13859–13867. [Google Scholar] [CrossRef] [Green Version]
  57. Creyghton, M.P.; Cheng, A.W.; Welstead, G.G.; Kooistra, T.; Carey, B.W.; Steine, E.J.; Hanna, J.; Lodato, M.A.; Frampton, G.M.; Sharp, P.A.; et al. Histone H3K27ac separates active from poised enhancers and predicts developmental state. Proc. Natl. Acad. Sci. USA 2010, 107, 21931–21936. [Google Scholar] [CrossRef] [Green Version]
  58. Schneider, R.; Bannister, A.J.; Myers, F.A.; Thorne, A.W.; Crane-Robinson, C.; Kouzarides, T. Histone H3 lysine 4 methylation patterns in higher eukaryotic genes. Nat. Cell Biol. 2004, 6, 73–77. [Google Scholar] [CrossRef] [PubMed]
  59. Schwartz, S.; Meshorer, E.; Ast, G. Chromatin organization marks exon-intron structure. Nat. Struct. Mol. Biol. 2009, 16, 990–995. [Google Scholar] [CrossRef] [PubMed]
  60. Cao, R.; Wang, L.; Wang, H.; Xia, L.; Erdjument-Bromage, H.; Tempst, P.; Jones, R.S.; Zhang, Y. Role of histone H3 lysine 27 methylation in Polycomb-group silencing. Science 2002, 298, 1039–1043. [Google Scholar] [CrossRef] [Green Version]
  61. Giglio, M.; Tauber, R.; Nadendla, S.; Munro, J.; Olley, D.; Ball, S.; Mitraka, E.; Schriml, L.M.; Gaudet, P.; Hobbs, E.T.; et al. ECO, the Evidence & Conclusion Ontology: Community standard for evidence information. Nucleic Acids Res. 2019, 47, D1186–D1194. [Google Scholar] [CrossRef] [Green Version]
  62. McWilliam, H.; Li, W.; Uludag, M.; Squizzato, S.; Park, Y.M.; Buso, N.; Cowley, A.P.; Lopez, R. Analysis Tool Web Services from the EMBL-EBI. Nucleic Acids Res. 2013, 41, W597-600. [Google Scholar] [CrossRef]
  63. Gasteiger, E.; Gattiker, A.; Hoogland, C.; Ivanyi, I.; Appel, R.D.; Bairoch, A. ExPASy: The proteomics server for in-depth protein knowledge and analysis. Nucleic Acids Res. 2003, 31, 3784–3788. [Google Scholar] [CrossRef] [PubMed] [Green Version]
  64. Nan, X.; Meehan, R.R.; Bird, A. Dissection of the methyl-CpG binding domain from the chromosomal protein MeCP2. Nucleic Acids Res. 1993, 21, 4886–4892. [Google Scholar] [CrossRef] [PubMed] [Green Version]
  65. Adams, V.H.; McBryant, S.J.; Wade, P.A.; Woodcock, C.L.; Hansen, J.C. Intrinsic disorder and autonomous domain function in the multifunctional nuclear protein, MeCP2. J. Biol. Chem. 2007, 282, 15057–15064. [Google Scholar] [CrossRef] [PubMed] [Green Version]
  66. Kent, W.J. BLAT--the BLAST-like alignment tool. Genome Res. 2002, 12, 656–664. [Google Scholar] [CrossRef] [Green Version]
  67. Edgar, R.; Domrachev, M.; Lash, A.E. Gene Expression Omnibus: NCBI gene expression and hybridization array data repository. Nucleic Acids Res. 2002, 30, 207–210. [Google Scholar] [CrossRef] [Green Version]
  68. Consortium, E.P. An integrated encyclopedia of DNA elements in the human genome. Nature 2012, 489, 57–74. [Google Scholar] [CrossRef] [Green Version]
  69. Davis, C.A.; Hitz, B.C.; Sloan, C.A.; Chan, E.T.; Davidson, J.M.; Gabdank, I.; Hilton, J.A.; Jain, K.; Baymuradov, U.K.; Narayanan, A.K.; et al. The Encyclopedia of DNA elements (ENCODE): Data portal update. Nucleic Acids Res. 2018, 46, D794–D801. [Google Scholar] [CrossRef] [Green Version]
  70. Lister, R.; Mukamel, E.A.; Nery, J.R.; Urich, M.; Puddifoot, C.A.; Johnson, N.D.; Lucero, J.; Huang, Y.; Dwork, A.J.; Schultz, M.D.; et al. Global epigenomic reconfiguration during mammalian brain development. Science 2013, 341, 1237905. [Google Scholar] [CrossRef]
Figure 1. Alignment of potential MeCP2 protein isoforms from NCBI and UniProt. The sequences are in the N-terminal to C-terminal orientation. MeCP2E1 and MeCP2E2 from both NCBI and UniProt are shown in bold. The raw output from ClustalOmega was split into 2 panes and exons were colour-coded as indicated in the figure legend. Functional domains are labeled with start and end flags on MeCP2E2 (NCBI isoform 1 and UniProt P51608-1), while protein interaction sequences were underlined. The sequences of exons 1, 2, 3, and 4 were coloured purple, green, red and black respectively. Non-matching to either isoform sequences were coloured blue. aDBD: alternative DNA binding domain; CTDα: C-terminal domain α; CTDβ: C-terminal domain β; HMGD1: high mobility group protein-like domain 1; HMGD2: high mobility group protein-like domain 2; MBD: methyl-CpG-binding domain; NID: NCoR/SMRT interaction domain; NLS1: nuclear localization signals 1; NLS2: nuclear localization signals 2; TBL1XR1 IS: TBL1XR1 interaction sequence; TRD: transcriptional repression domain; WW-2 IS: Group 2 WW motif-containing protein interaction sequence. References and amino acid numbers of each feature were summarized in Supplementary Table S1.
Ijms 23 15643 g001aIjms 23 15643 g001b
Figure 2. Human Adult Hippocampus histone post-translational modification profiles in males and females. The chrX:153,212,176–153,366,832 genomic region of hg19 human genome assembly is displayed in UCSC genome viewing browser. Direction is 5′–3′ (sense orientation relative to the MECP2 gene). Tracks displayed from top to bottom: UCSC genes, mapping of previously identified [55] cis-regulatory elements (REs) (F3-F21) to genome, 13 histone modification CHIP-seq data tracks. M: male, F: female. Cis-REs were highlighted in blue in UCSC. Scale on top represents distance equivalent to 50 kb. MECP2 exons and F regulatory elements are labelled; F regulatory elements are also highlighted in blue. Histone PTMs data are from GSE17312. The donors selected were: #112 (75 Y, female, disease-free, Rush University Medical Center), and #149 (81 Y, male, disease-free, Rush University Medical Center).
Ijms 23 15643 g002
Figure 3. Histone post-translational modification profiles of 7 brain regions. (A) The chrX:153,212,176–153,366,832 genomic region of hg19 human genome assembly is displayed in UCSC genome viewing browser. Direction is 5′–3′ (sense orientation relative to the MECP2 gene). Tracks displayed from top to bottom: UCSC genes, mapping of previously identified [55] cis-REs (F3-F21) to genome, histone modification CHIP-seq data tracks. Cis-regulatory elements (REs) are highlighted in blue in UCSC. Scale on top represents distance equivalent to 50 kb. MECP2 exons are labeled on UCSC Genes data track. Genomic segments with consistently high H3K27ac and H3K4me1 were labeled S1–S11. The distances are relative to the first nucleotide of MECP2 exon 1 (hg19 chrX:153,363,188). Labels consist of 3 letter code for brain region followed by histone PTM type. BAG: brain angular gyrus, BAC: brain anterior caudate, BCG: brain cingulate gyrus, BHM: brain hippocampus middle, BITL: brain inferior temporal lobe, BMFL: brain mid frontal lobe, BSN: brain substantia nigra. Darker areas represent more mapping reads binding to that specific genomic region, hence higher abundance of certain histone PTM. (B) Zoomed in portion of the genome focused on the MECP2 promoter and cis-REs. Cis-REs are labeled inside and on top of each box. Histone PTMs data are from GSE17312.
Ijms 23 15643 g003
Figure 4. DNase-seq of different fetal tissues: males and females. (A) The chrX:153,212,176–153,366,832 genomic region of hg19 human genome assembly is displayed in UCSC genome viewing browser. Direction is 5′–3′ (sense orientation relative to the MECP2) gene. Tracks displayed from top to bottom: UCSC genes, mapping of previously identified [55] cis-REs (F3-F21) to genome, DNase-seq data tracks. Cis-REs were highlighted in blue in UCSC. Scale on top represents distance equivalent to 50 kb. MECP2 exons are labeled on UCSC Genes data track. Genomic segments with consistently high chromatin accessibility (darker regions) are labeled A1–A9. The distances are relative to the first nucleotide of the MECP2 exon 1 (hg19 chrX:153,363,188). Labels are copied and added to the left for easier reference. Labels consist of a tissue type followed by M (male) or F (female). Darker areas represent more mapping reads binding to that specific genomic region, hence higher chromatin accessibility. (B) Zoomed in portion of the genomes focused on the MECP2 promoter and cis-REs. Cis-REs are labeled inside and on the top of each box. Labels are the same as in pane A. DNase-seq data included data tracks from various donors of 85 to 127 days old during the fetal stage of development from data series GSE18927.
Ijms 23 15643 g004
Figure 5. ATAC-seq of 25 brain regions: glia and neurons. (A) The chrX:153,947,013–154,101,440 genomic region of hg38 human genome assembly is displayed in UCSC genome viewing browser. Direction is 5′–3′ (sense orientation relative to the MECP2 gene). Tracks displayed from top to bottom: ENCODE genes, mapping of previously identified [55] cis-REs (F3-F21) to genome, ATAC-seq data tracks. Cis-REs are highlighted in blue in UCSC. Scale on top represents distance equivalent to 50 kb. MECP2 exons are labeled on ENCODE Genes data track. Genomic segments with higher chromatin accessibility (darker regions) were labeled B1–B9. The distances are relative to the first nucleotide of MECP2 exon 1 (hg38 chrX:154,097,717). Labels are replaced for better readability. The labels define glial and neural cells from the 25-brain region analyzed Darker areas represent more mapping reads binding to that specific genomic region, hence higher chromatin accessibility. (B) Zoomed in portion of the genomes focused on the MECP2 promoter and cis-REs. Cis-REs are labeled inside and at the bottom of each box. The labels are the same as in panel (A). The ATAC-seq data tracks were uploaded from GSE211822.
Ijms 23 15643 g005aIjms 23 15643 g005b
Figure 6. BS-seq of mid-frontal gyrus at different ages. The chrX:153,212,176–153,366,832 genomic region of hg19 human genome assembly is displayed in UCSC genome viewing browser. Direction is 5′–3′ (sense orientation relative to the MECP2 gene). Tracks displayed from top to bottom: UCSC genes, mapping of previously identified [55] cis-REs (F3-F21) to genome, BS-seq data tracks: combination of DNA-methyl abundance (yellow) and DNA hypomethylated regions (blue). Cis-REs are highlighted blue in UCSC. Scale on top represents distance equivalent to 50 kb. The MECP2 exons are labeled on UCSC Genes data track. Hypomethylated genomic segments which were consistent between the ages (darker regions) were labeled H1–8. The distances are relative to the first nucleotide of the MECP2 exon 1 (hg19 chrX:153,363,188). Labels include donor age. Yellow peaks represent more mapping reads binding to that specific genomic region, hence higher abundance of methyl-DNA. The methylation data of frontal gyrus of different donors’ ages are from GEO: GSE17312.
Ijms 23 15643 g006
Figure 7. Summary of the identified genomic segments potentially involved in regulation of the MECP2 gene. The identified genomic segments of interest were added to the hg38 human genome in UCSC genome viewing browser. Previously published F elements were highlighted blue and labelled on top of each pane. “S” fragments: histone PTMs in various brain regions (Figure 3), “A” fragments: highly accessible chromatin in different fetal tissues based on DNA-seq (Figure 4), “B” fragments: highly accessible chromatin in different brain regions of adults based on ATAC-seq (Figure 5), “H” fragments: hypomethylated genomic regions of mid-frontal gyrus in individuals 35d to 25 years old (Figure 6). Direction is 5′–3′ (sense direction relative to the MECP2 gene).
Ijms 23 15643 g007
Table 1. Summary of NCBI MECP2 mRNA variants and their respective protein isoforms. (Updated 15 October 2022).
Accession NumberTranscript VariantProtein Isoform Encoded
NM_004992.41Translation initiates in exon 2, producing protein isoform 1 with a distinct N-terminus
NM_001110792.22Translation initiates in exon 1, producing protein isoform 2 with a distinct N-terminus
NM_001316337.23Product: Protein isoform 3; it has a shorter N-terminus compared to isoform 1
NM_001369391.24
NM_001369392.25
NM_001369393.26
NM_001369394.27
NM_001386137.18Product: Protein isoform 4
NM_001386138.19
NM_001386139.110
Table 2. Summary of UniProt MeCP2 protein isoform variants and their respective transcripts from Ensembl (Updated 15 October 2022).
UniProt DataEnsembl Data
UniProt IdentifierStatusEvidenceEnsembl Transcript IDBiotypeTranscript Support Level (TSL)Incomplete
P51608-1ReviewedEvidence at protein levelENST00000303391.11Protein codingTSL:1-
P51608-2ReviewedEvidence at protein levelENST00000453960.7Protein codingTSL:1-
B5MCB4UnreviewedEvidence at protein levelENST00000407218.5Protein codingTSL:5-
A0A0D9SFX7UnreviewedEvidence at protein levelENST00000628176.2Protein codingTSL:3-
C9JH89UnreviewedEvidence at protein levelENST00000415944.3Protein codingTSL:5CDS 3’ incomplete
A0A1B0GTV0UnreviewedEvidence at protein levelENST00000637917.1Protein codingTSL:5CDS 5’ and 3’ incomplete
A0A0D9SEX1UnreviewedEvidence at protein levelENST00000630151.2Protein codingTSL:5CDS 3’ incomplete
H7BY72UnreviewedProtein predictedENST00000369957.5Nonsense mediated decayTSL:3-
A0A6Q8PHQ3UnreviewedProtein predictedENST00000674996.1Nonsense mediated decay--
A0A6Q8PF93UnreviewedProtein predictedENST00000675526.1Nonsense mediated decay--
Table 3. Summary of the functional domains present in predicted protein isoforms from NCBI (Updated 15 October 2022).
NCBI
Isoform 1Isoform 2Isoform 3Isoform 4
Exon 1---
Exon 2---
Exon 3N-term. incompl. Starts at alternative M in exon 3-
Exon 4N-term. incompl. Starts at alternative M in exon 4
HMGD1Possible different N-terminus--
HMGD2-
MBDN-term. incompl.-
aDBDN-term. incompl.
TRDN-term. incompl.
NLS1-
NLS2
AT hook 1-
AT hook 2
H3-M-T ISN-term. incompl.-
NID
TBL1XR1 IS
WW-2 IS
CTD⍺
CTDβ
Table 4. NLS1-2, AT-hook 1-2, and CTDβ sequences were not found in any of the potential isoforms from UniProt (Updated 15 October 2022).
UniProt
B5MCB4A0A0D
9SFX7
C9JH89A0A1B0
GTV0
A0A0D
9SEX1
H7BY72A0A6Q
8PHQ3
A0A6Q
8PF93
Exon 1-------
Exon 2--C-term. incompl.
Exon 3C-term. incompl.-C-term. incompl.---
Exon 4C-term. incompl.C-term. incompl.-C-term. incompl, missing fragment inside----
HMGD1Possible different N-terminusC-term. incompl.-C-term. incompl.C-term. incompl.C-term. incompl.C-term. incompl.
HMGD2-C-term. incompl.------
MBDC-term. incompl.C-term. incompl.-N-term. and C-term. Incompl.----
aDBD---N-term. incompl.----
TRD---N-term. incompl.----
H3-M-T IS------
NID---N-term. incompl.----
TBL1XR1 IS---N-term. incompl.----
WW-2 IS--------
CTDα---C-term. incompl.----
CTDβ--------
Publisher’s Note: MDPI stays neutral with regard to jurisdictional claims in published maps and institutional affiliations.

