Article

Advanced Treatment of Direct Dye Wastewater Using Novel Composites Produced from Hoshanar and Sunny Grey Waste

1
Nano and Biomaterials Lab, Department of Chemistry, University of Agriculture, Faisalabad 38040, Pakistan
2
Institute of Nanoscience and Nanotechnology (ION2), Universiti Putra Malaysia, Serdang 43400, Selangor, Malaysia
3
Chemistry Department, College of Science, King Saud University, Riyadh 1145, Saudi Arabia
4
Department of Applied Biosciences, Kyungpook National University, Daegu 41566, Republic of Korea
*
Author to whom correspondence should be addressed.
Separations 2022, 9(12), 425; https://doi.org/10.3390/separations9120425
Submission received: 11 November 2022 / Revised: 1 December 2022 / Accepted: 5 December 2022 / Published: 9 December 2022

Abstract

:
The present project is designed to investigate the potential of hoshanar and sunny grey marble wastes to remove direct violet 51 dye from wastewater using adsorption process. The effect of different parameters such as pH, adsorbent dose, initial dye concentration, and contact time were studied to optimize the results of adsorption process. Different isothermic models (Temkin, Langmuir isotherm, Freundlich isotherm, Harkin Jura, and Dubinin-Radushkevich models) and kinetic models (pseudo-first order and pseudo-second order) were employed to adsorption data to find out the best fit model, i.e., Langmuir isotherm and pseudo-second order model. Marble waste composites were also characterized by using different techniques such as scanning electron microscopy (SEM) for surface morphology and Fourier transform infrared spectroscopy (FTIR) to determine chemical arrangements, structure, and functional groups of adsorbents. Hoshanar treated with a mixture of potassium ferricyanide, and sodium meta silicate showed maximum adsorption capacity of 105.31 mg/g as compared to untreated hoshanar (67.19.45 mg/g). So, the conversion of HM into HMPS makes it an affordable, efficient, and available adsorbent for wastewater treatment.

Graphical Abstract

1. Introduction

The world is facing the problems of fresh water scarcity because of rapid urbanization, industrialization, and climate change [1]. Potable water of many countries does not satisfy the criteria of the World Health Organization [2]. Polluted and low-quality water causes 3.1 percent of deaths [3]. Water-related diseases affect approximately 2.3 billion people around the world. Poor sanitation and consumption of contaminated water is the major reason of deaths of more than 2 million people in developing countries. Infectious and parasitic disorders caused by water account for 60 percent of deaths of infants worldwide [4]. Water-related disorders affect 20–40% of individuals in Pakistan, according to UNICEF research. Hepatitis, giardiasis, cholera, cryptosporidiosis, and typhoid dysentery are among the diseases that kill one third of the country’s population [5].
The release of untreated industrial effluents into water bodies is the major cause of rapid degradation of water. Wastewater coming out of the textile industry containing harmful chemicals including organic and synthetic dyes, is of a serious concern. Dyes are utilized in a variety of industrial processes including textile industry, food processing, cosmetics, medicines, and paper printing. Hence, they are frequently found in the industrial effluents. Primary industries responsible for the discharge of coloring compounds in aquatic ecosystems are textile industries (54 percent) accounts half of the existing dye effluents present in the world-wide environment followed by the dyeing industries (21 percent), paper and pulp industries (10 percent), tannery and paint industries (8 percent), and the dye production industries (7 percent) [6].
Dyes discharged by industries into water bodies are not degradable, so different methods are used for their removal from water [7]. Various methods such as multi-step coagulation, sedimentation, precipitation, filtration, electrochemical destruction, flocculation, ion exchange, distillation, adsorption, electrolysis, membrane- based processes (reverse osmosis, microfiltration, nano filtration and ultrafiltration), photo catalysis, incineration, advanced oxidation process using hydrogen per oxide and Fenton’s reagent, chlorination, ozonation, nanotechnology, and microorganisms such as algae, fungi and bacteria are used for the removal of dyes from wastewater [8,9,10,11,12]. These methods have their own advantages and disadvantages [13]. Among these methods, photo catalysis is an advanced process which oxidizes a wide range of organic pollutants as compared to adsorption. Both anionic and cationic dyes can be easily removed by this process. However, adsorption is a physical process and better than photo catalysis as adsorption is a low-cost procedure and adsorbents are easily available. Adsorption also has many disadvantages such as hard separation of adsorbent from dye and low surface area [14]. The present project is designed to check the efficiency of adsorption in wastewater treatment as low-cost marble waste adsorbents are used in this study. Marble powder is an inorganic adsorbent that contains chemical ingredients of calcium carbonate and oxides of silicon, aluminum, magnesium, iron, potassium, and sodium. The use of marble waste powder to eliminate dyes is not only economically feasible but also helps to reduce waste from environment.
Previously, many researchers have also removed direct violet 51 dye by adsorption on various adsorbents. Treated and untreated nano composites of hoshanar and sunny grey marble wastes have never been used before for the removal of direct violet 51 from wastewater. So, it is a novel approach and in future, other dyes can also be removed by using these nanocomposites. In aqueous state, the surface of marble becomes negatively charged. The presence of weak van der waal forces between negatively charged marble surface and positively charged dye molecules lead to adsorption of dye on the surface of marble.
In the present research work, novel and low-cost nanocomposites of hoshanar and sunny grey marble wastes were used for the removal of direct violet 51 from aqueous solutions. Effect of different parameters such as contact time, temperature, pH, dose, and initial concentration was studied to evaluate the adsorption capacity of adsorbents. This study is the first report to check and compare the kinetic and adsorption isotherms of the treated and untreated nanocomposites of the hoshanar and sunny grey marble wastes.

2. Materials and Methods

2.1. Materials

Cationic Direct Violet 51 dye was purchased in powdered form from local market, Faisalabad. Powdered marble wastes of hoshanar and sunny grey were collected from local factory of Faisalabad. Chemical reagents used in this research are HNO3, NaOH, potassium ferricyanide, sodium meta silicate and mixture of potassium ferricyanide, and sodium meta silicate. Distilled water was used in the preparation of solutions.

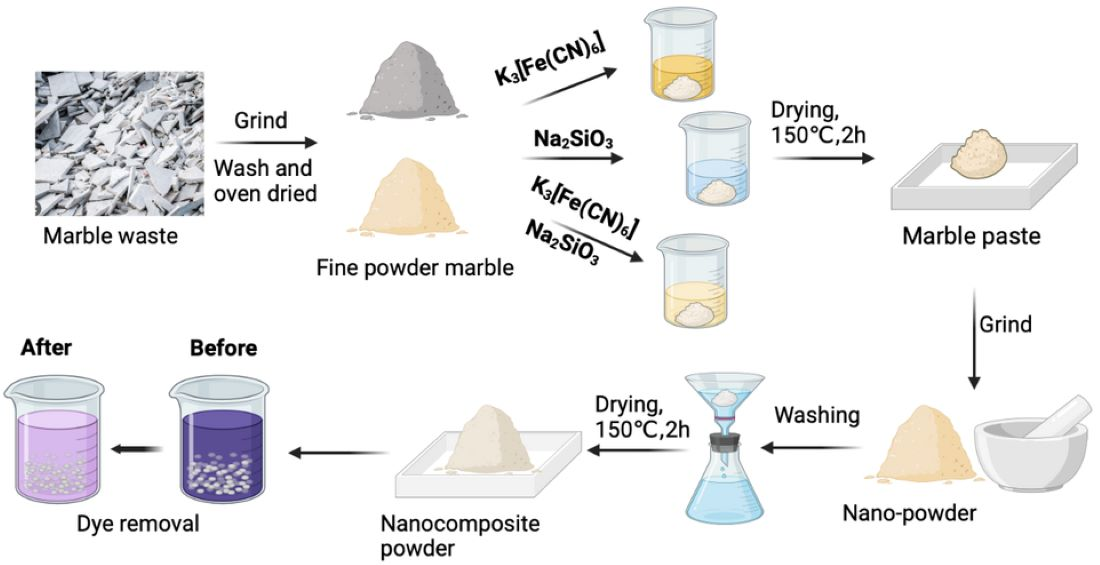
2.2. Preparation of Adsorbents

Raw powdered marble wastes of hoshanar and sunny grey were washed several times with distilled water to remove dust and impurities present in powder. These samples were air dried and ground to fine powder by using ceramic based pestle mortar so that it can be used as adsorbent. This fine powder of hoshanar and sunny grey marble was used to prepare their nanocomposites. Five grams of hoshanar and sunny grey each were mixed with each of potassium ferricyanide, sodium meta silicate, and a mixture of both for the formation of paste. These pastes were then placed in the oven for drying at 150 °C for 2 h. After drying, the samples were again grinded in pestle mortar to obtain nanocomposites. All the six dried samples were then washed and filtered by filter paper using excess of water to remove the color of chemicals used until the filtrate leaves no color and the residue on the filter paper is collected, and stored for further processing. The solid residues after filtration were again dried in the oven at 150 °C for 2 h and grinded into very fine powder to obtain the nanocomposites. The treated samples of both marbles were stored and used as adsorbents (Figure 1) and their results were compared with the untreated samples of hoshanar and sunny grey marble wastes [15].

2.3. Optimization of Process Parameters

2.3.1. Optimization of Initial Dye Concentration

Effect of initial dye concentration was investigated by changing the dye concentration from 5–50 g/mL by keeping dosage of adsorbent, time, temperature, and pH constant. Stock solution of 100 ppm concentration was prepared by adding 0.01 g of dye in 100 mL of distilled water and further dilutions of 5 ppm, 10 ppm, 15 ppm, 25 ppm, and 50 ppm were prepared from 100 ppm stock solution. Absorbance for all concentrations of dye solutions was determined in the spectrophotometer. Further, 0.01 g of all the eight adsorbents (six treated and two untreated) were mixed with 5 ppm, 10 ppm, 15 ppm, 25 ppm, and 50 ppm solutions of dye.
Twenty falcon tubes were filled with 10 mL of each ppm solutions of dye and 0.01 g each of the eight adsorbents were added in each ppm solution of both the dyes. Control of each ppm was also taken in 5 falcon tubes. All the eight adsorbents were added in 8 falcon tubes filled with 10 mL of distilled water. Shaking treatment was then performed by placing the stand on orbital shaker at 300 rpm for 2 h. Afterwards, the solutions were filtered by syringe filtration and absorbance was measured by scanning all the solutions at λmax of 549 nm through spectrophotometer [16].

2.3.2. Optimization of Adsorbent Dosage

Stock solution of 50 ppm was prepared by adding 0.01 g of dye in 200 mL of distilled water and adsorbent dosage of 0.005 g, 0.01 g, 0.02 g, 0.03 g, and 0.04 g was measured using the analytical balance. Ten mL of 50 ppm solution of the dye was filled in 20 falcon tubes and treated with all the dosages. One falcon tube filled with 10 mL of 50 ppm solution was used as blank. Five falcon tubes filled with 10 mL of distilled water and treated with each of the 5 dosages were also used. Afterwards, the stand was installed on orbital shaker for 2 h at 300 rpm shaking speed. The solutions were filtered by syringe filtration absorbance was determined at maximum wavelength of each dye by using spectrophotometer [17].

2.3.3. Optimization of Time and Temperature

In optimization of temperature, 50 ppm of dye solutions were prepared and 0.005 g of all the eight adsorbents were added in 8 falcon tubes filled with 15 mL of the dye solutions. The stand was placed in the oven at five variable temperatures of 30 °C, 40 °C, 50 °C, 60 °C, and 70 °C, at time intervals of 15 min, 30 min, 60 min, 120 min, and 240 min. Afterwards, the 3 mL of solutions were filtered by syringe filtration after every time interval at each temperature and the absorbance was measured at λmax of dye by spectrophotometer. Adsorption of dye by nanocomposites/nano-adsorbents could be endothermic if the rate of adsorption increases with the increase of temperature and exothermic if rate of adsorption decreases with increase of temperature [18].

2.3.4. Optimization of pH

Dye solution of 50 ppm was treated with 0.005 g of all the eight adsorbents at six different pH of 5, 6, 7, 8, 9, and 10. The pH of different solutions was maintained by adding 0.1M HNO3 and 0.1M NaOH and checked by pH strips. The solutions of dye with maintained pH were placed on the shaker for 2 h at 300 rpm. Afterwards, the solutions were filtered by syringe filtration and the absorbance was measured at λmax by spectrophotometer. The dye molecules have different structures at different pH. At low pH the adsorption of negatively charged ions increased due to increase of H+ ions and at high pH adsorption of positively charged ions increased due to increase of OH- ions [19].

2.4. Determination of λmax before Treatment

For determination of the λmax of dye namely Direct violet 51, a solution of dye was prepared by adding a minute amount of the dye in distilled water until it makes a color transparent solution of the dye. The dye solution was then run in UV-Visible spectrophotometer and scanned through a wavelength ranging from 340 nm to 1000 nm in order to determine the wavelength at which the dye showed maximum absorbance λmax [20].

3. Results and Discussion

3.1. Spectrophotometric Analysis

Spectrophotometric analysis is the quantitative measurement of the reflection, absorption, and transmission properties of a material as a function of wavelength. Spectrophotometric analysis of the dye Direct yellow 51 was performed and the λ m a x value was calculated at range of wavelength 340–1000 nm. The maximum wavelength of Direct violet 51 at 25 ppm was 549 nm.

3.2. Optimization of Parameters

The variables studied were initial concentration of dye, adsorbent dose, pH, contact time, and temperature. The time and shaking speed in orbital shaker were 2 h for 300 rpm and absorbance of dye solutions were measured at maximum wavelength (λmax = 549).

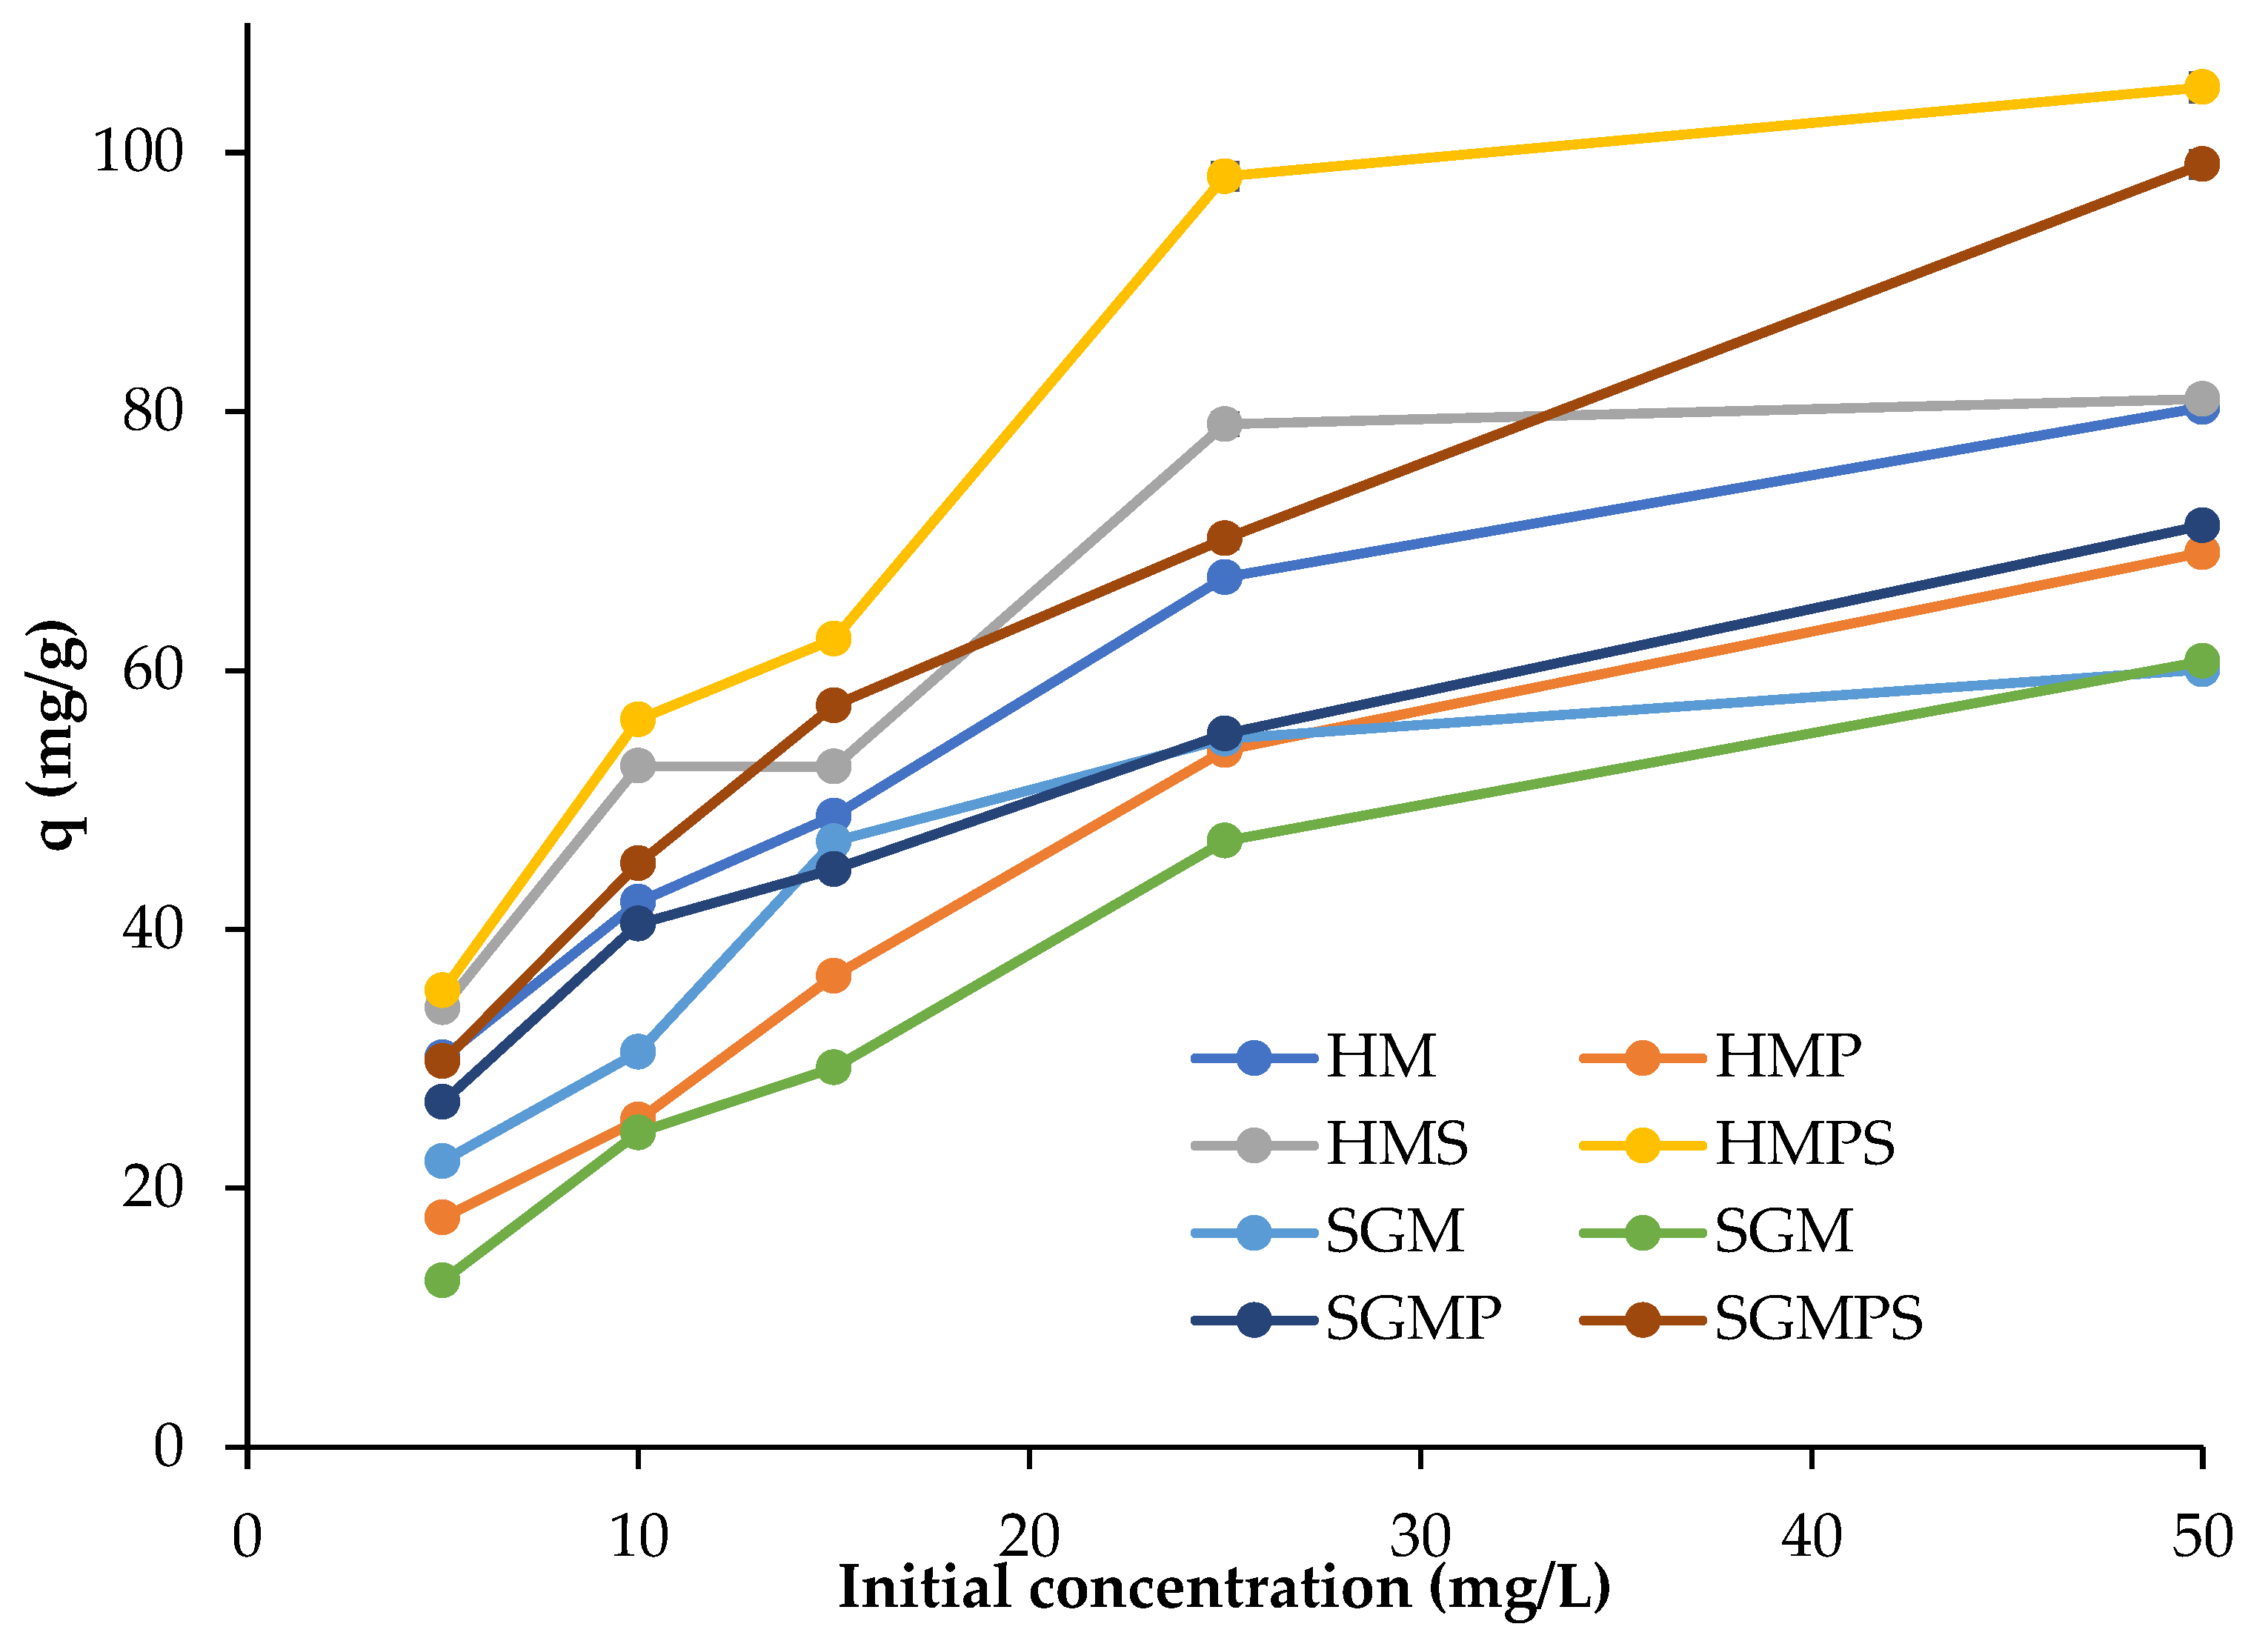
3.2.1. Effect of Initial Dye Concentration

Effect of initial concentration of dye was investigated by changing the dye concentration from 5–50 mg/L by keeping temperature, adsorbent dose, and time constant. The time and shaking speed for the study was 2 h and 300 rpm, respectively. The graphical representation of spectrophotometric analysis of the dye after treatment is shown in Figure 2.
At room temperature, the effect of the initial concentration of dye ranging from 5–50 mg/L on adsorption capacity was examined, without any modification in the pH of the solution. The graph shows that the percentage removal capacity of marble increases as the initial concentration of dye tends to increase. The increase in percentage removal of dye with increase in the concentration of dye indicates that rate of adsorption increases with increase in concentration of dye. The reason is that, as the concentration of dye increases, the number of molecules adsorbed on the surface of marble increases and leads to greater percentage removal. This trend is observed in the case of both adsorbents, hoshanar and sunny grey marble wastes. Since the amount of adsorbent remains constant, so the rise in the concentration of dye results in the greater adsorption of dye on marble. The initial concentration of dye provides the driving force, which overcome the resistance of mass transfer of the dye molecule between the solid and aqueous phases. As a result, the number of dye molecules competing for available sites on the marble surface was high at higher initial concentration of dye, resulting in increased adsorption of direct violet 51 [21].

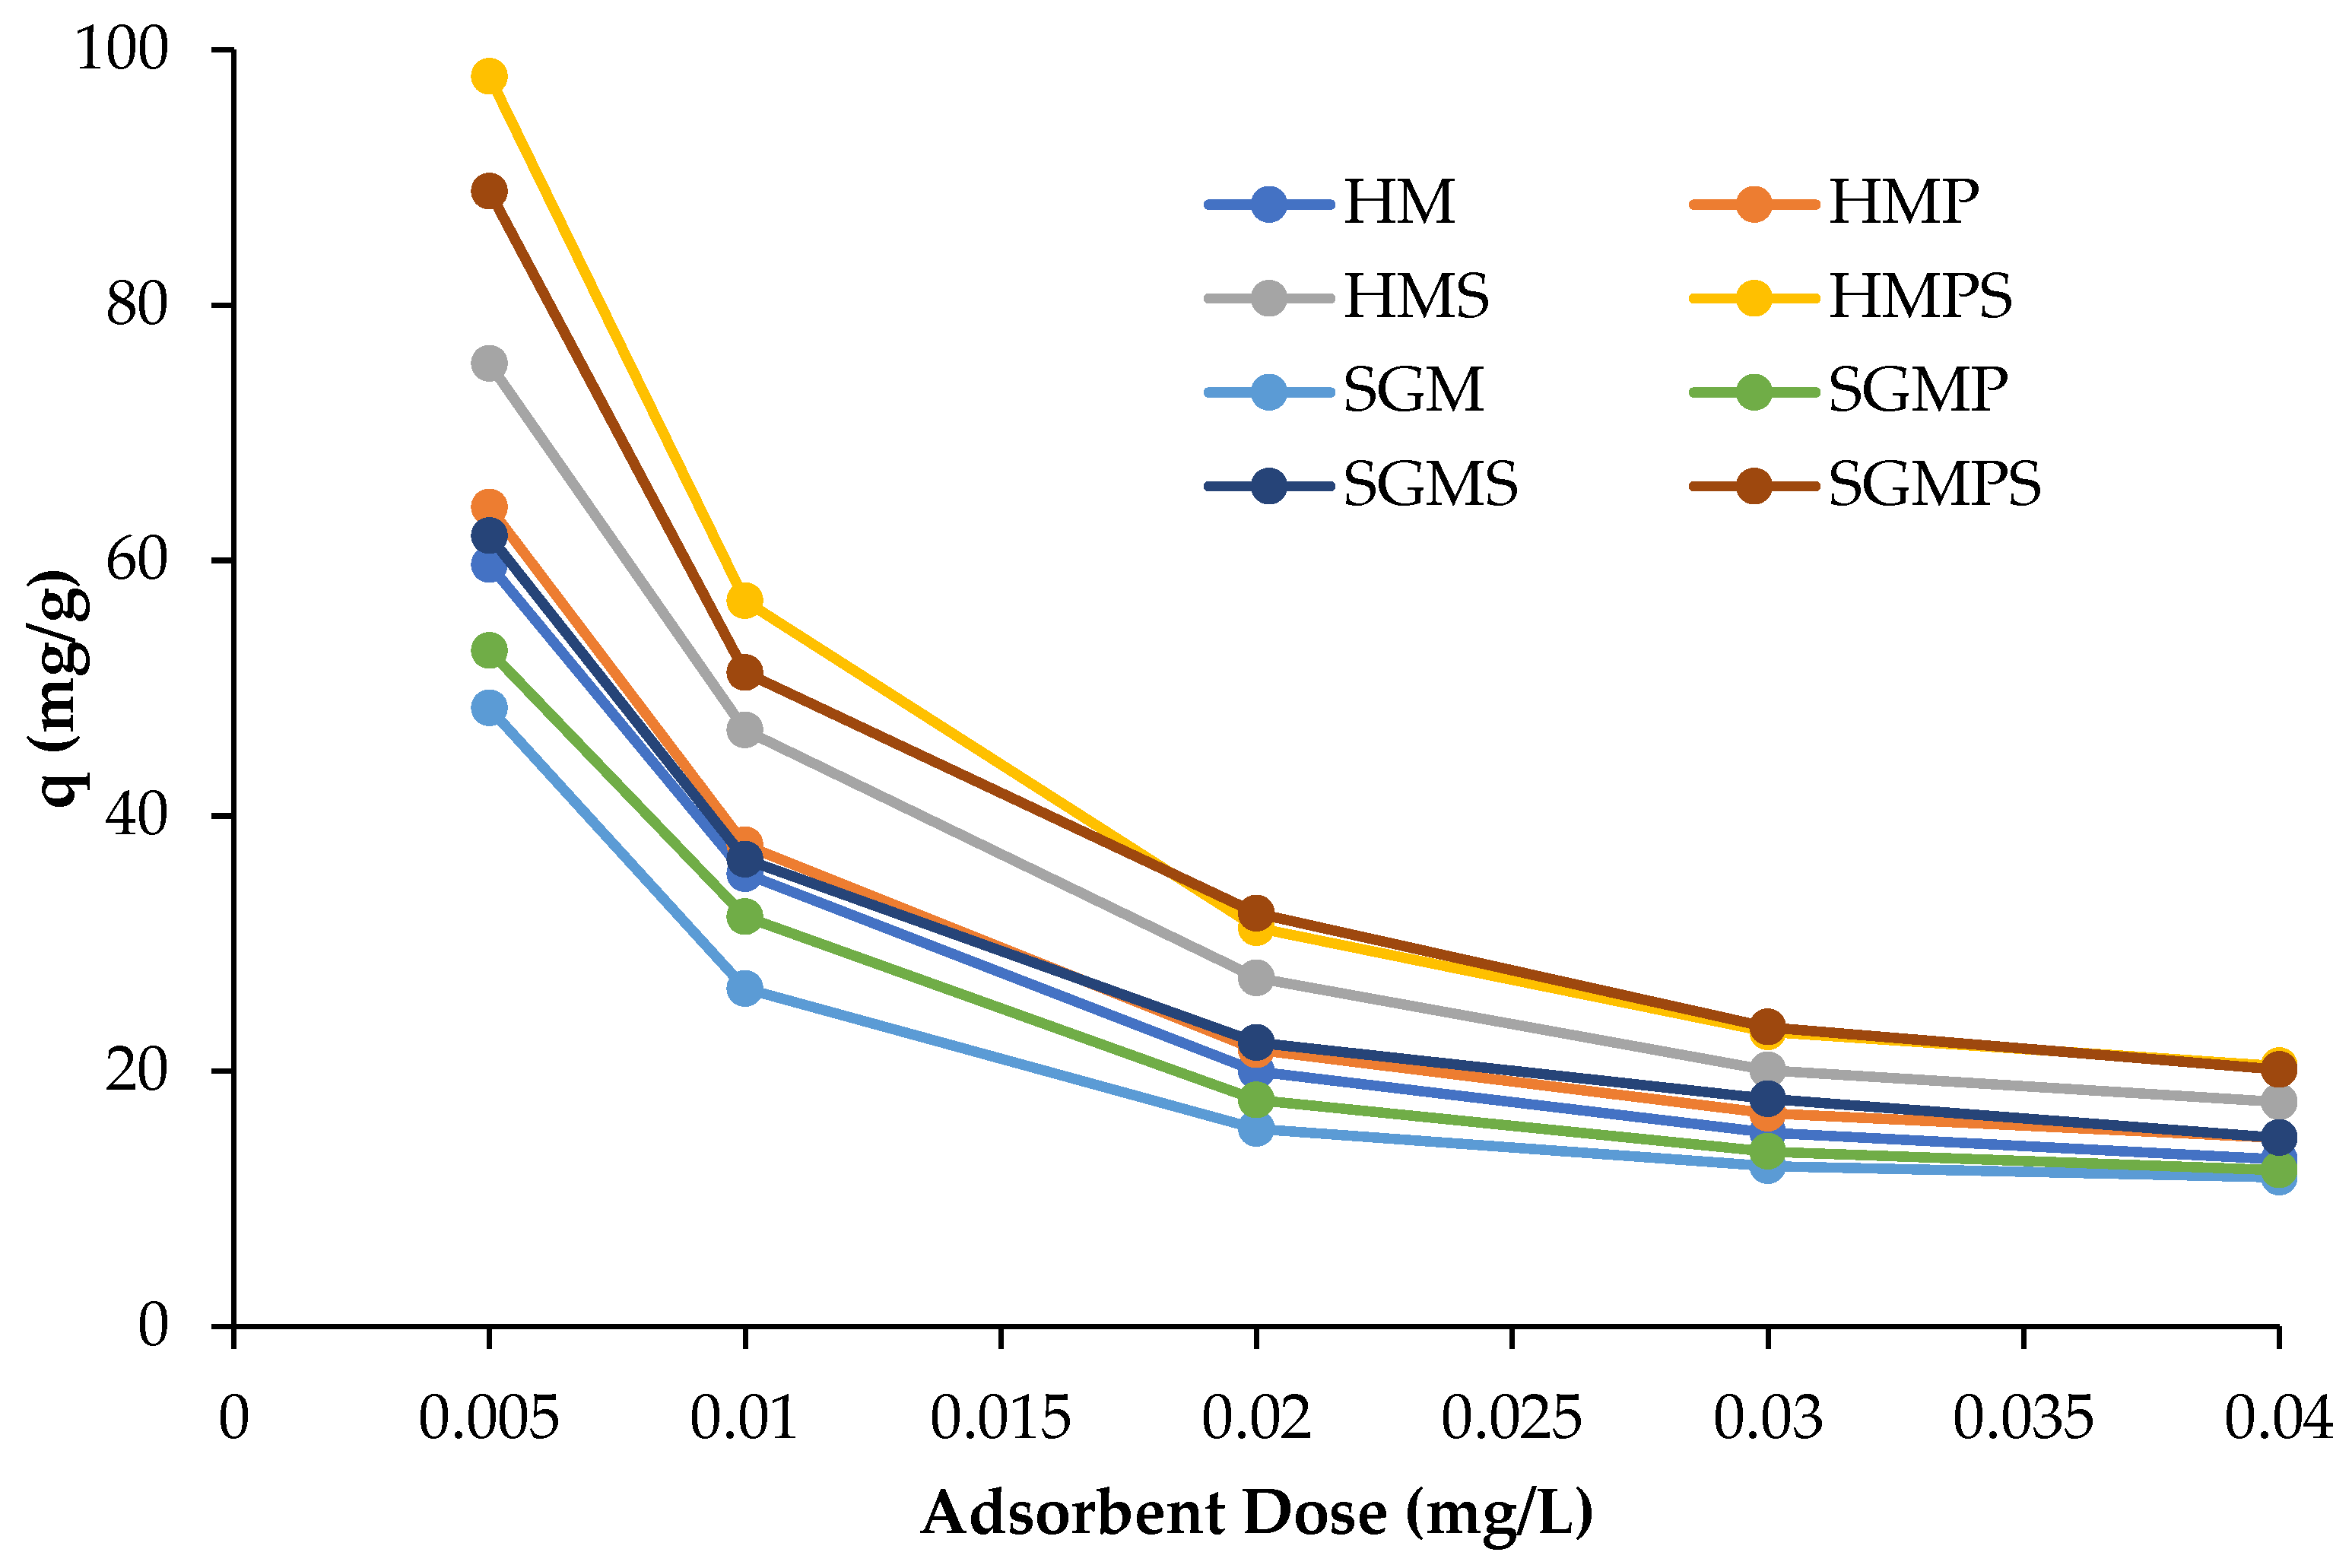
3.2.2. Effect of Adsorbent Dose on Efficiency of Dye Removal

The study of effect of adsorbent dose was carried out with different doses of adsorbents ranging from the 5–40 mg with the concentrations of dye 50 mg/L at room temperature. The solid/solution ratio is a key factor to determine adsorbent capacity. The graph in Figure 3 depicts the relationship between the dose of adsorbents and percentage removal of adsorbents. It was seen that the percentage of adsorption decreases as the dose of adsorbents increases. This is due to increased mass transfer resistance, because the increased amount of adsorbents hinders the movement of dye molecules and decrease the adsorption of dyes on surface of adsorbents, which becomes critical at high adsorbent dose. It is apparent that the percentage removal of adsorbents decreased as the amount of adsorbents increased. The same pattern is observed for the removal efficiencies of marble adsorbents, hoshanar and sunny grey waste. As indicated in the graph, the amount of adsorbed dye per unit weight (q) of the marbles dropped as the solid/solution ratio increased. The increase in amount of adsorbent should increase the adsorption rate because of increase in the number of available sites. However, the adsorption sites remained unsaturated as the dye molecules could not get adsorbed on the surface due to resistance offered by increased amount of adsorbents [22].

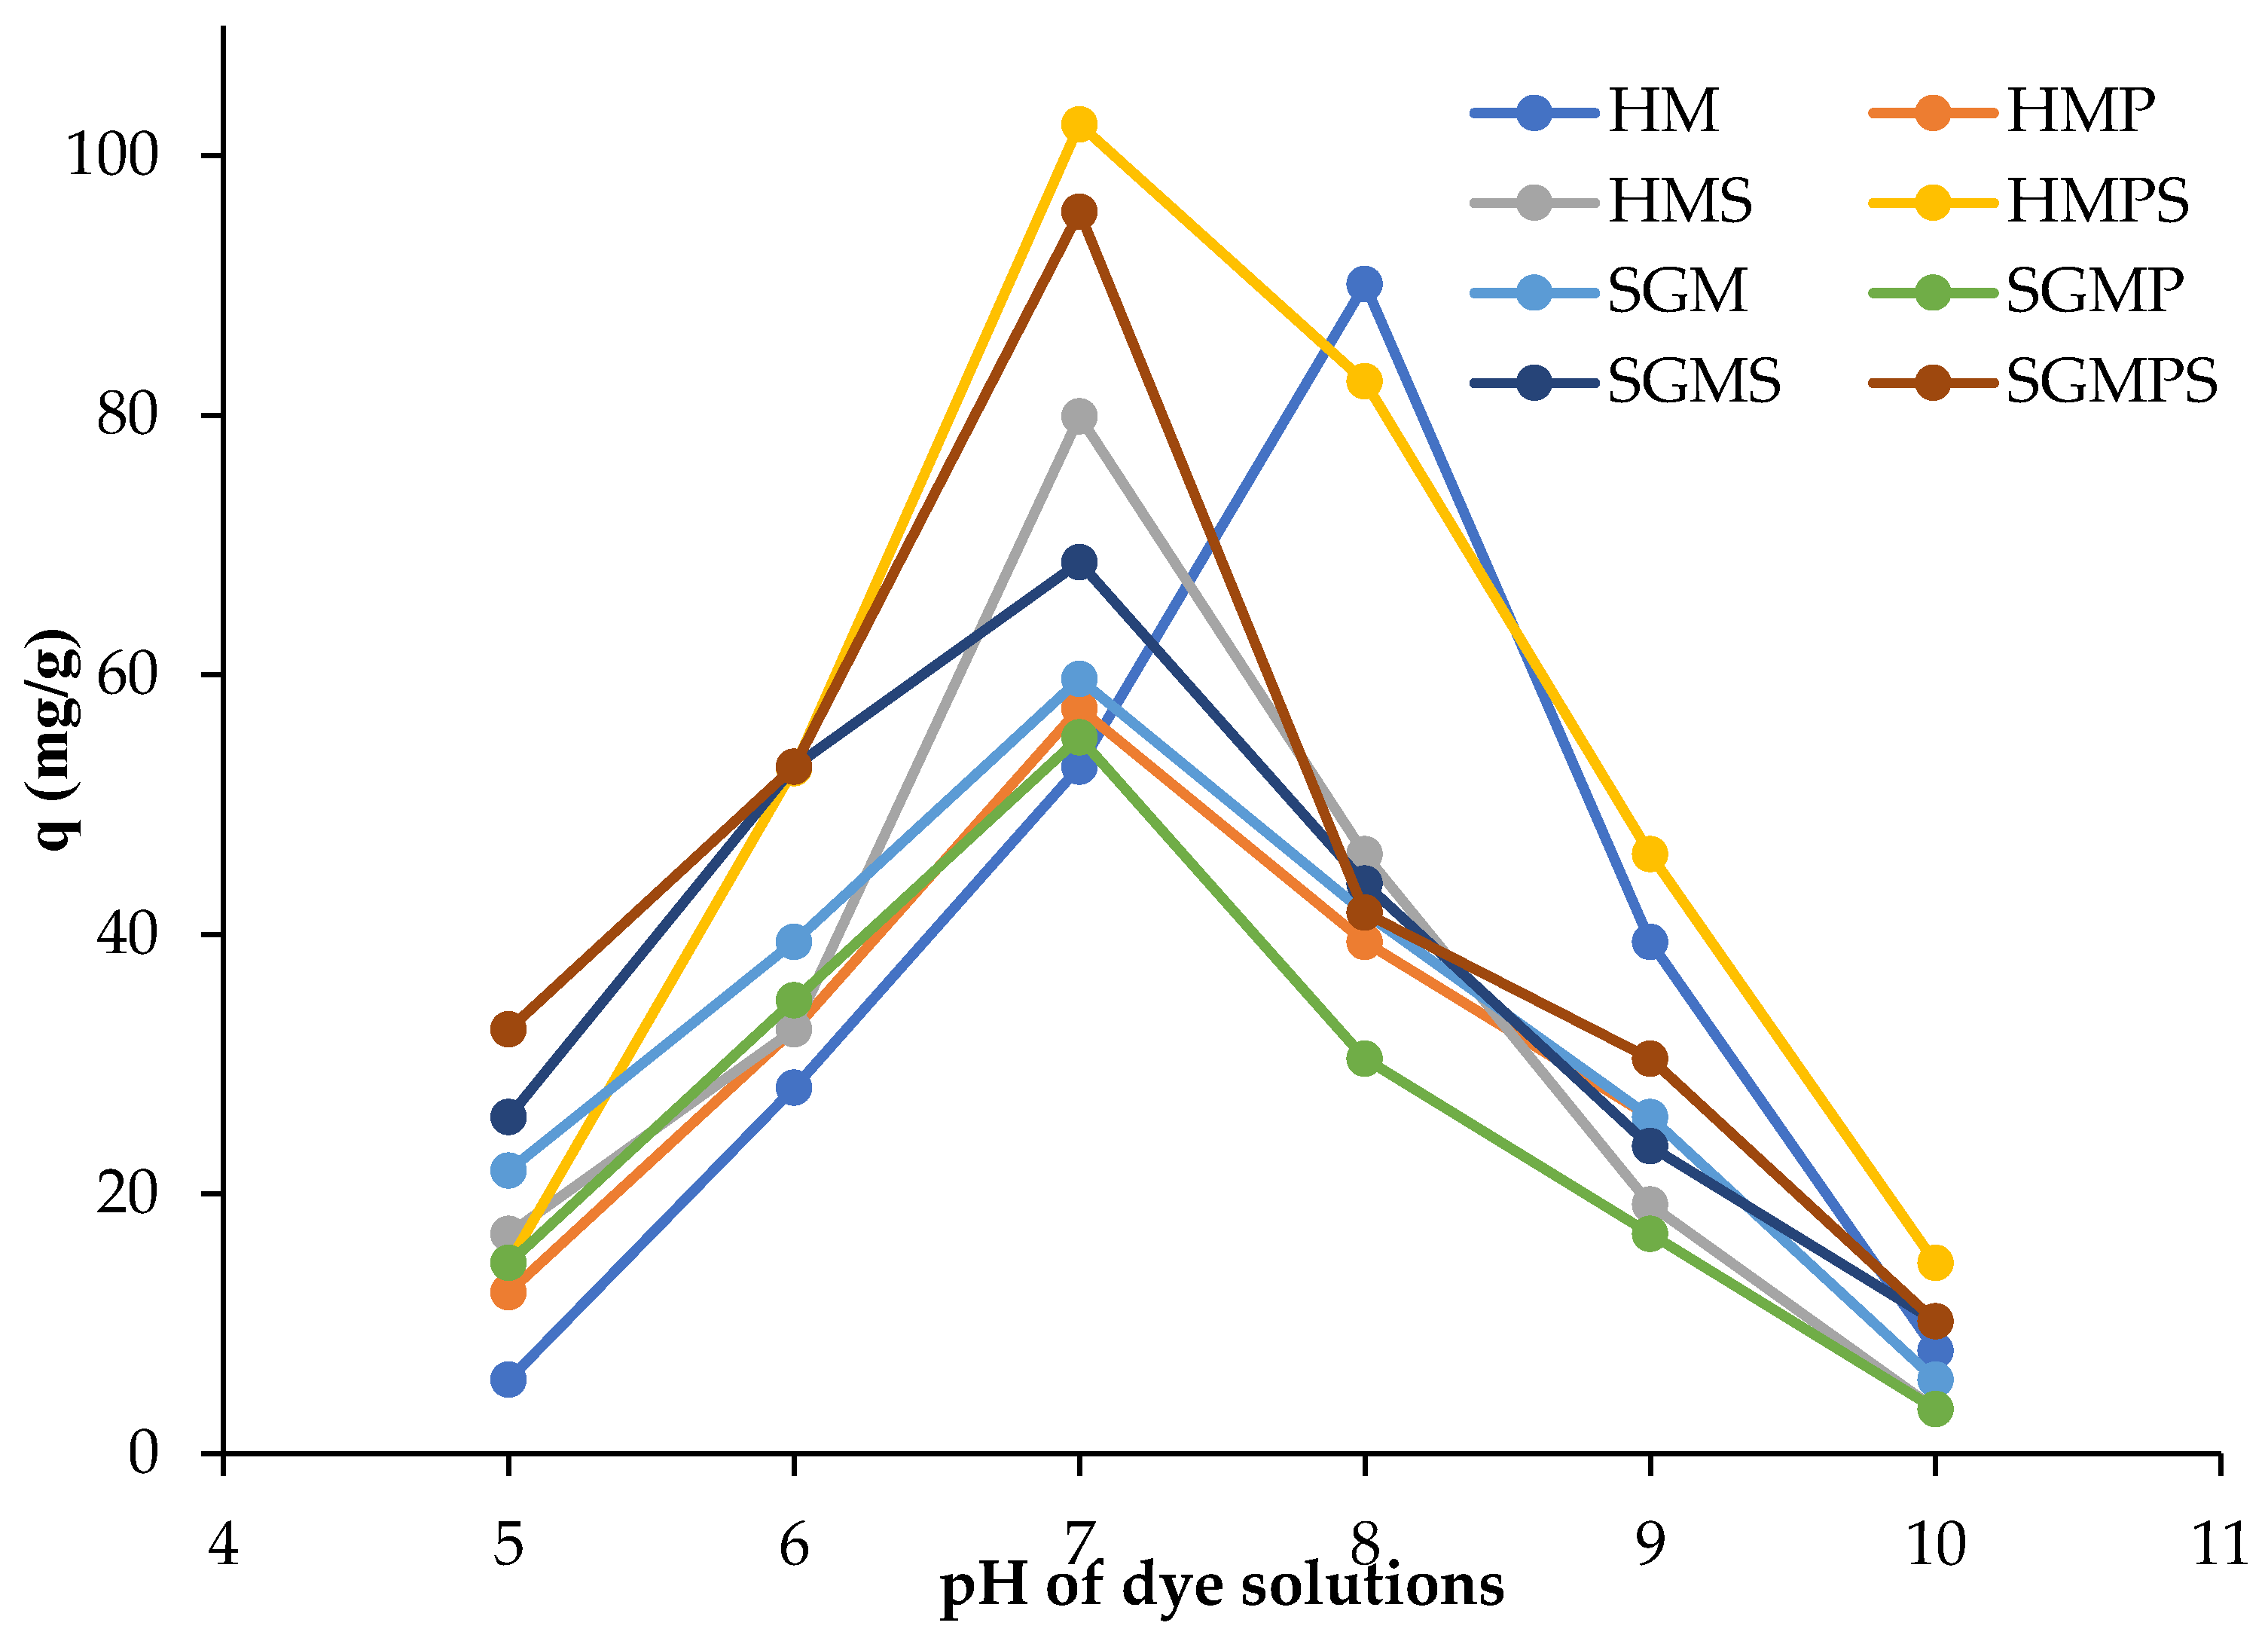
3.2.3. Effect of Solution pH on Dye Adsorption

The effect of pH was studied in the treatment of aqueous solutions of dye with (0.005 gm) dose of adsorbent and dye concentrations is 50 mg/L. The shaking treatment was performed at the speed of 300 rpm for 2 h. The effect of pH of dye solution on the amount of Direct violet 51 adsorbed per unit mass of marble waste is shown in the Figure 4.
In the adsorption process, the pH value of the solution is an important regulating parameter, and the initial pH of the solution has a greater influence than the final pH. Any change in the pH of medium generate changes in the structure of adsorbate and adsorbent. The amount of Direct violet 51 adsorbed per gram of marble waste is higher at pH 7 and decreases for both acidic and basic pH [23].

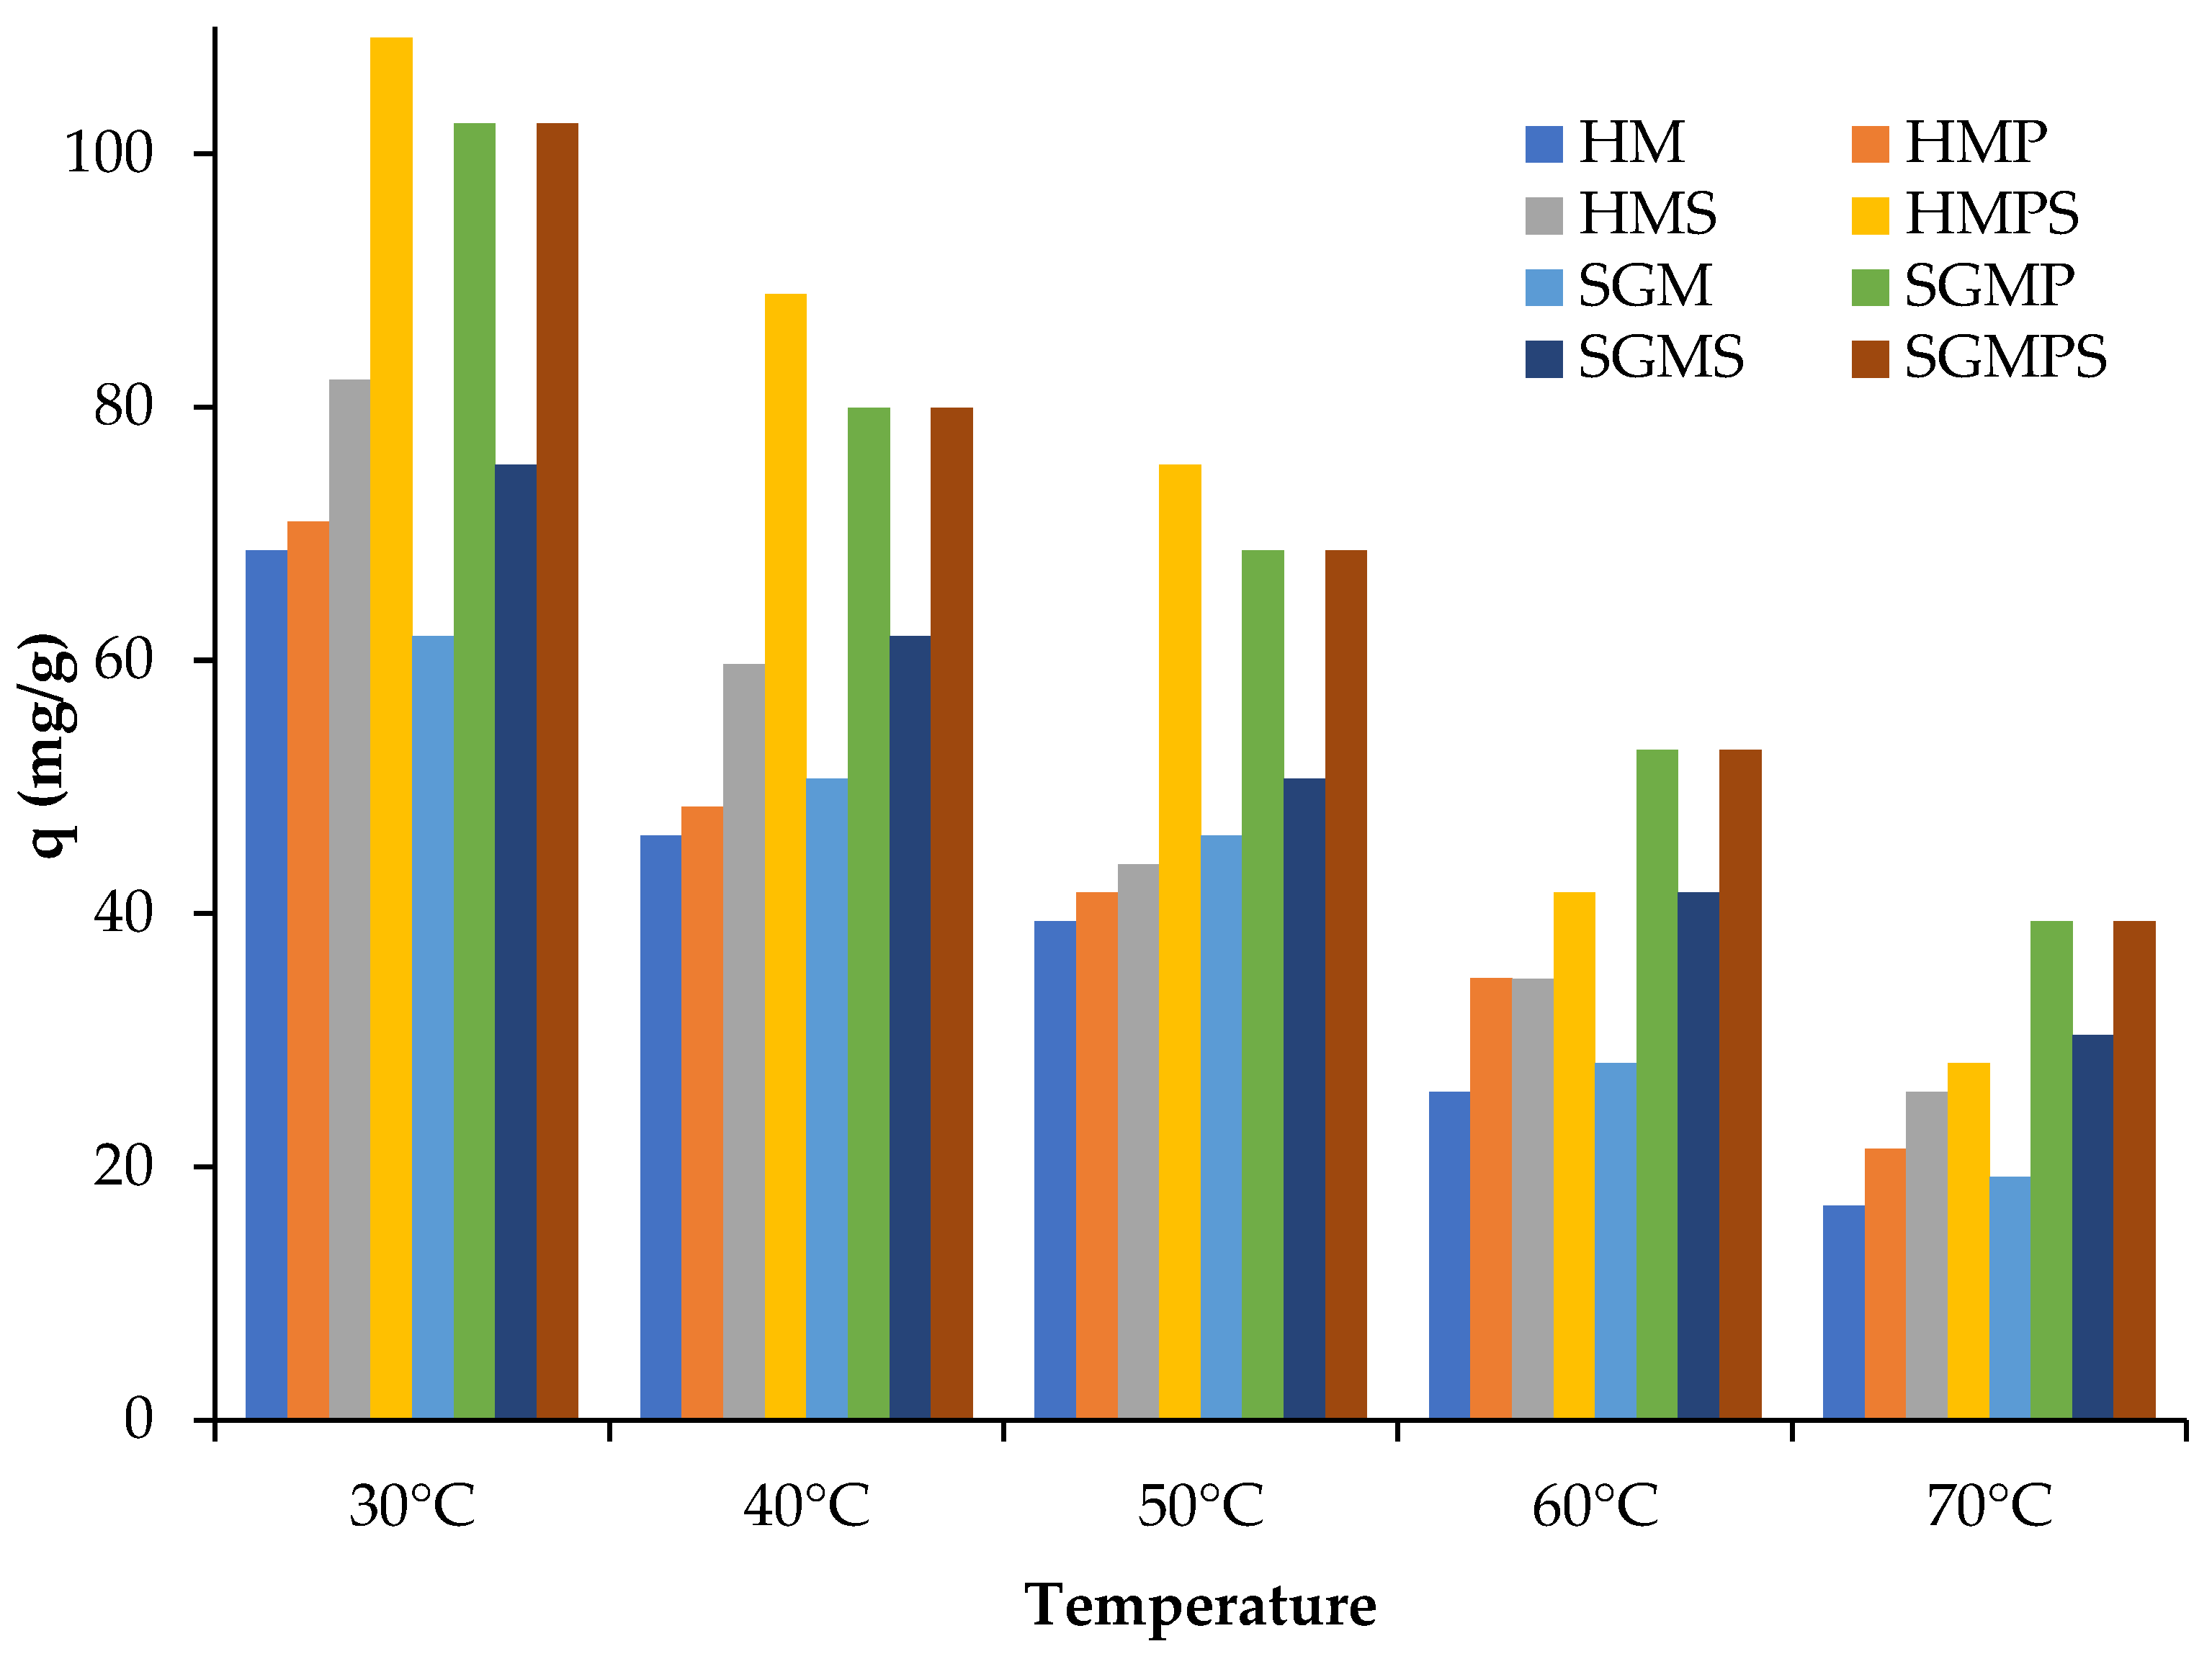
3.2.4. Effect of Contact Time and Solution Temperature

The effect of temperature was investigated from 30–70 °C with adsorbent dose of 0.5 mg/L mixing with dye solution of 50 mg/L concentration and the samples were kept in oven separately at 30–70 °C temperature for 4 h and spectrophotometric analysis were calculated after filtration of solutions at intervals of 15, 30, 60, 120, and 240 min. The study of adsorption of the Direct violet 51 by marble wastes in aqueous solution is shown in the above graphs. The analysis of the temporal evolution of the quantity of Direct violet 51 adsorbed per unit mass of marble waste, shows that the efficiency of adsorption increases with increase in time and maximum percentage removal is observed at 240 min shown in Figure 5. Because as time increases, driving force, which is related with concentration gradient, also increases. As the graph represents, the adsorption capacity of Direct violet 51 dye on the marble at temperature of 30–70 °C is at 50 ppm concentration of dye. When temperature increases, kinetic energy of molecules also increases. This increased kinetic energy of molecules causes more collisions among molecules, as a result number of molecules gets adsorb on the marble decreases. However, the adsorption phenomenon is usually affected by many parameters, particularly temperature. Temperature has an impact on the process of adsorption as it determines the equilibrium position in regard to the process’ exothermicity and the adsorbent’s swelling capacity. As a result, temperature adjustment may be required throughout the adsorption process. Due to the occupation of all active sites on the marble, the absorption capacity of marble material diminishes with increasing time [24].

3.3. Optimization of Parameters by Theoretical Modelling

3.3.1. Adsorption Isothermal Modelling

The adsorption isotherm describes how adsorbate interacts with absorbents and is critical in optimizing the use of absorbents. Adsorption equilibrium studies are conducted to correlate the adsorption capacity and absorbate concentration in liquid phase. Due to the complex adsorption system in a liquid phase, it was essential to apply various isotherm models. The nature of adsorption was examined by using Langmuir, Freundlich, Temkin, Dubinin–Radushkevich (D–R) and Harkin Jura isothermal models. Results obtained from the comparison of Langmuir, Freundlich, Temkin, Dubinin, and Harkin jura isotherms are listed in Table 1, evaluated that R² values of Langmuir isotherm are greater than 0.96 for treated and untreated composites, and q (mg/g) experimental values are also closer to the langmuir isotherm as compared to others. While using treated and untreated composites, results of q (mg/g) values are better for treated composites than untreated composites, while q (mg/g) is the value of mass of dye adsorbed to the adsorbent at equilibrium [25].

3.3.2. Kinetic Studies

Pseudo first order and pseudo second order kinetic models have been applied to test the experimental data, to investigate adsorption mechanism, chemical reactions, potential rate controlling steps, mass transfer, and dyes adsorption kinetics onto marble- based composites. Model predicted values and the experimental data can be studied by correlation coefficients (R2, values near or equal to 1). High R2 value showed the effectiveness of model on adsorption process kinetics [21]. The results obtained from the kinetic modelling are listed in Table 2. The R2 values for pseudo second order kinetics are greater than pseudo first order kinetics. R² values of pseudo second order kinetic models were higher or equal to 0.99. qe (mg/g) is the value of mass of dye adsorbed to the adsorbent at equilibrium. K1ads is the first order reaction rate constant. K2ads is the reaction rate constant of pseudo second order. Experiments performed with dyes by treating them with treated and untreated composite of hoshanar and sunny grey marble wastes. Value of q (mg/g) was also close to pseudo second order kinetics instead of pseudo first order kinetics. So, maximum adsorption removal was favored by pseudo second order kinetics [26].

3.4. Possible Mechanism of Adsorption

Adsorption is a process in which a substance (adsorbate) accumulates on the surface of another substance (adsorbent). Adsorption is categorized into two types; physical adsorption or physio sorption and chemical adsorption or chemisorption. In the physical adsorption, weak physical forces such as van der waal forces, hydrogen bonding, static interactions, hydrophobicity, dipole interactions, polarity, and π-π interactions are present between the surface of adsorbate and adsorbent. In the chemical adsorption, both the adsorbate and adsorbent are chemically bound to each other due to exchange of electrons between them [27]. In this study, adsorption between dye and marble surface is studied. According to Table 1, untreated marble composites showed less removal efficiency as compared to the treated marble composites. In treated marble composites, the presence of ferricyanide and silicate anions in addition to oxides of aluminum, silicon, magnesium, calcium, and sodium on the marble surface in the aqueous form enhanced the adsorption capacity of treated composites. Distilled water was used to prepare the dye solution, so there is no possibility of interference of other cations and anions commonly found in wastewater. Maximum adsorption capacity of marble was observed in neutral medium because in acidic and basic media, reaction of oxides of Al, Na, Si, Ca, Mg with acidic and basic substances interferes with the adsorption of dye. Maximum adsorption of dye at 7 pH indicates the neutral nature of dye. That’s why, methanol (neutral eluent) used for desorption of the dye which suggests that adsorption in this study was physical adsorption.

3.5. Charaterization of Composites
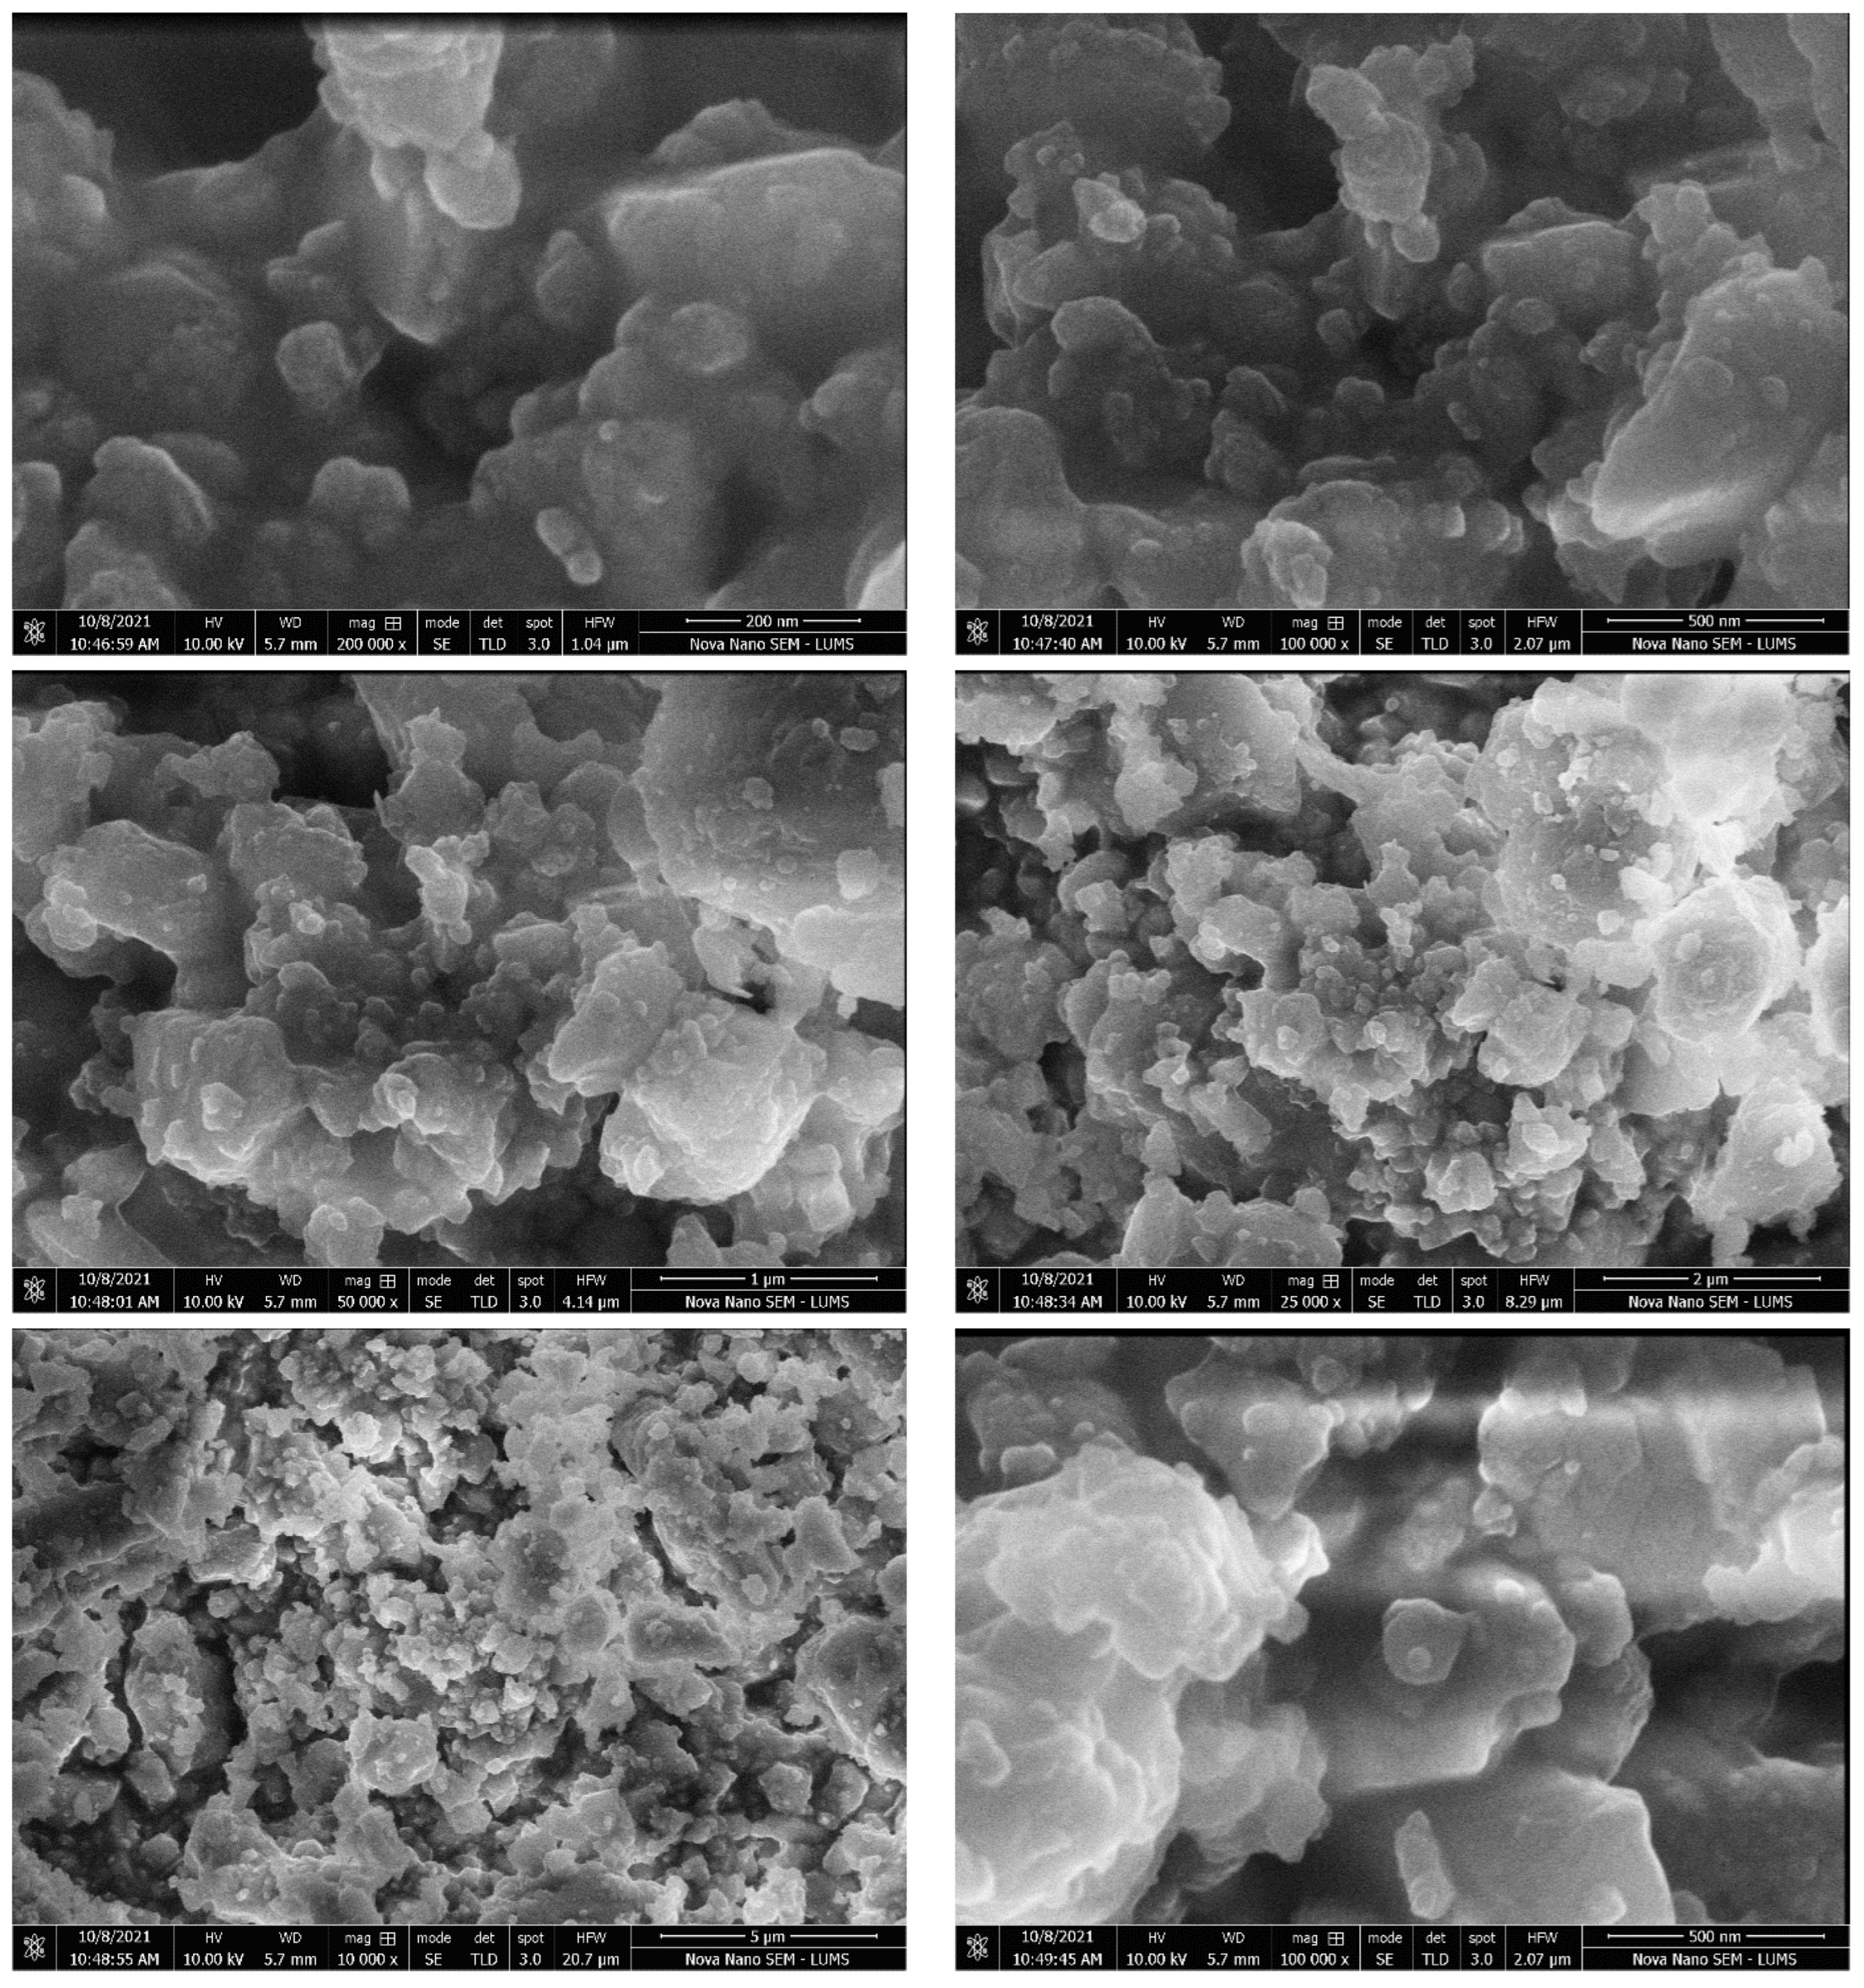
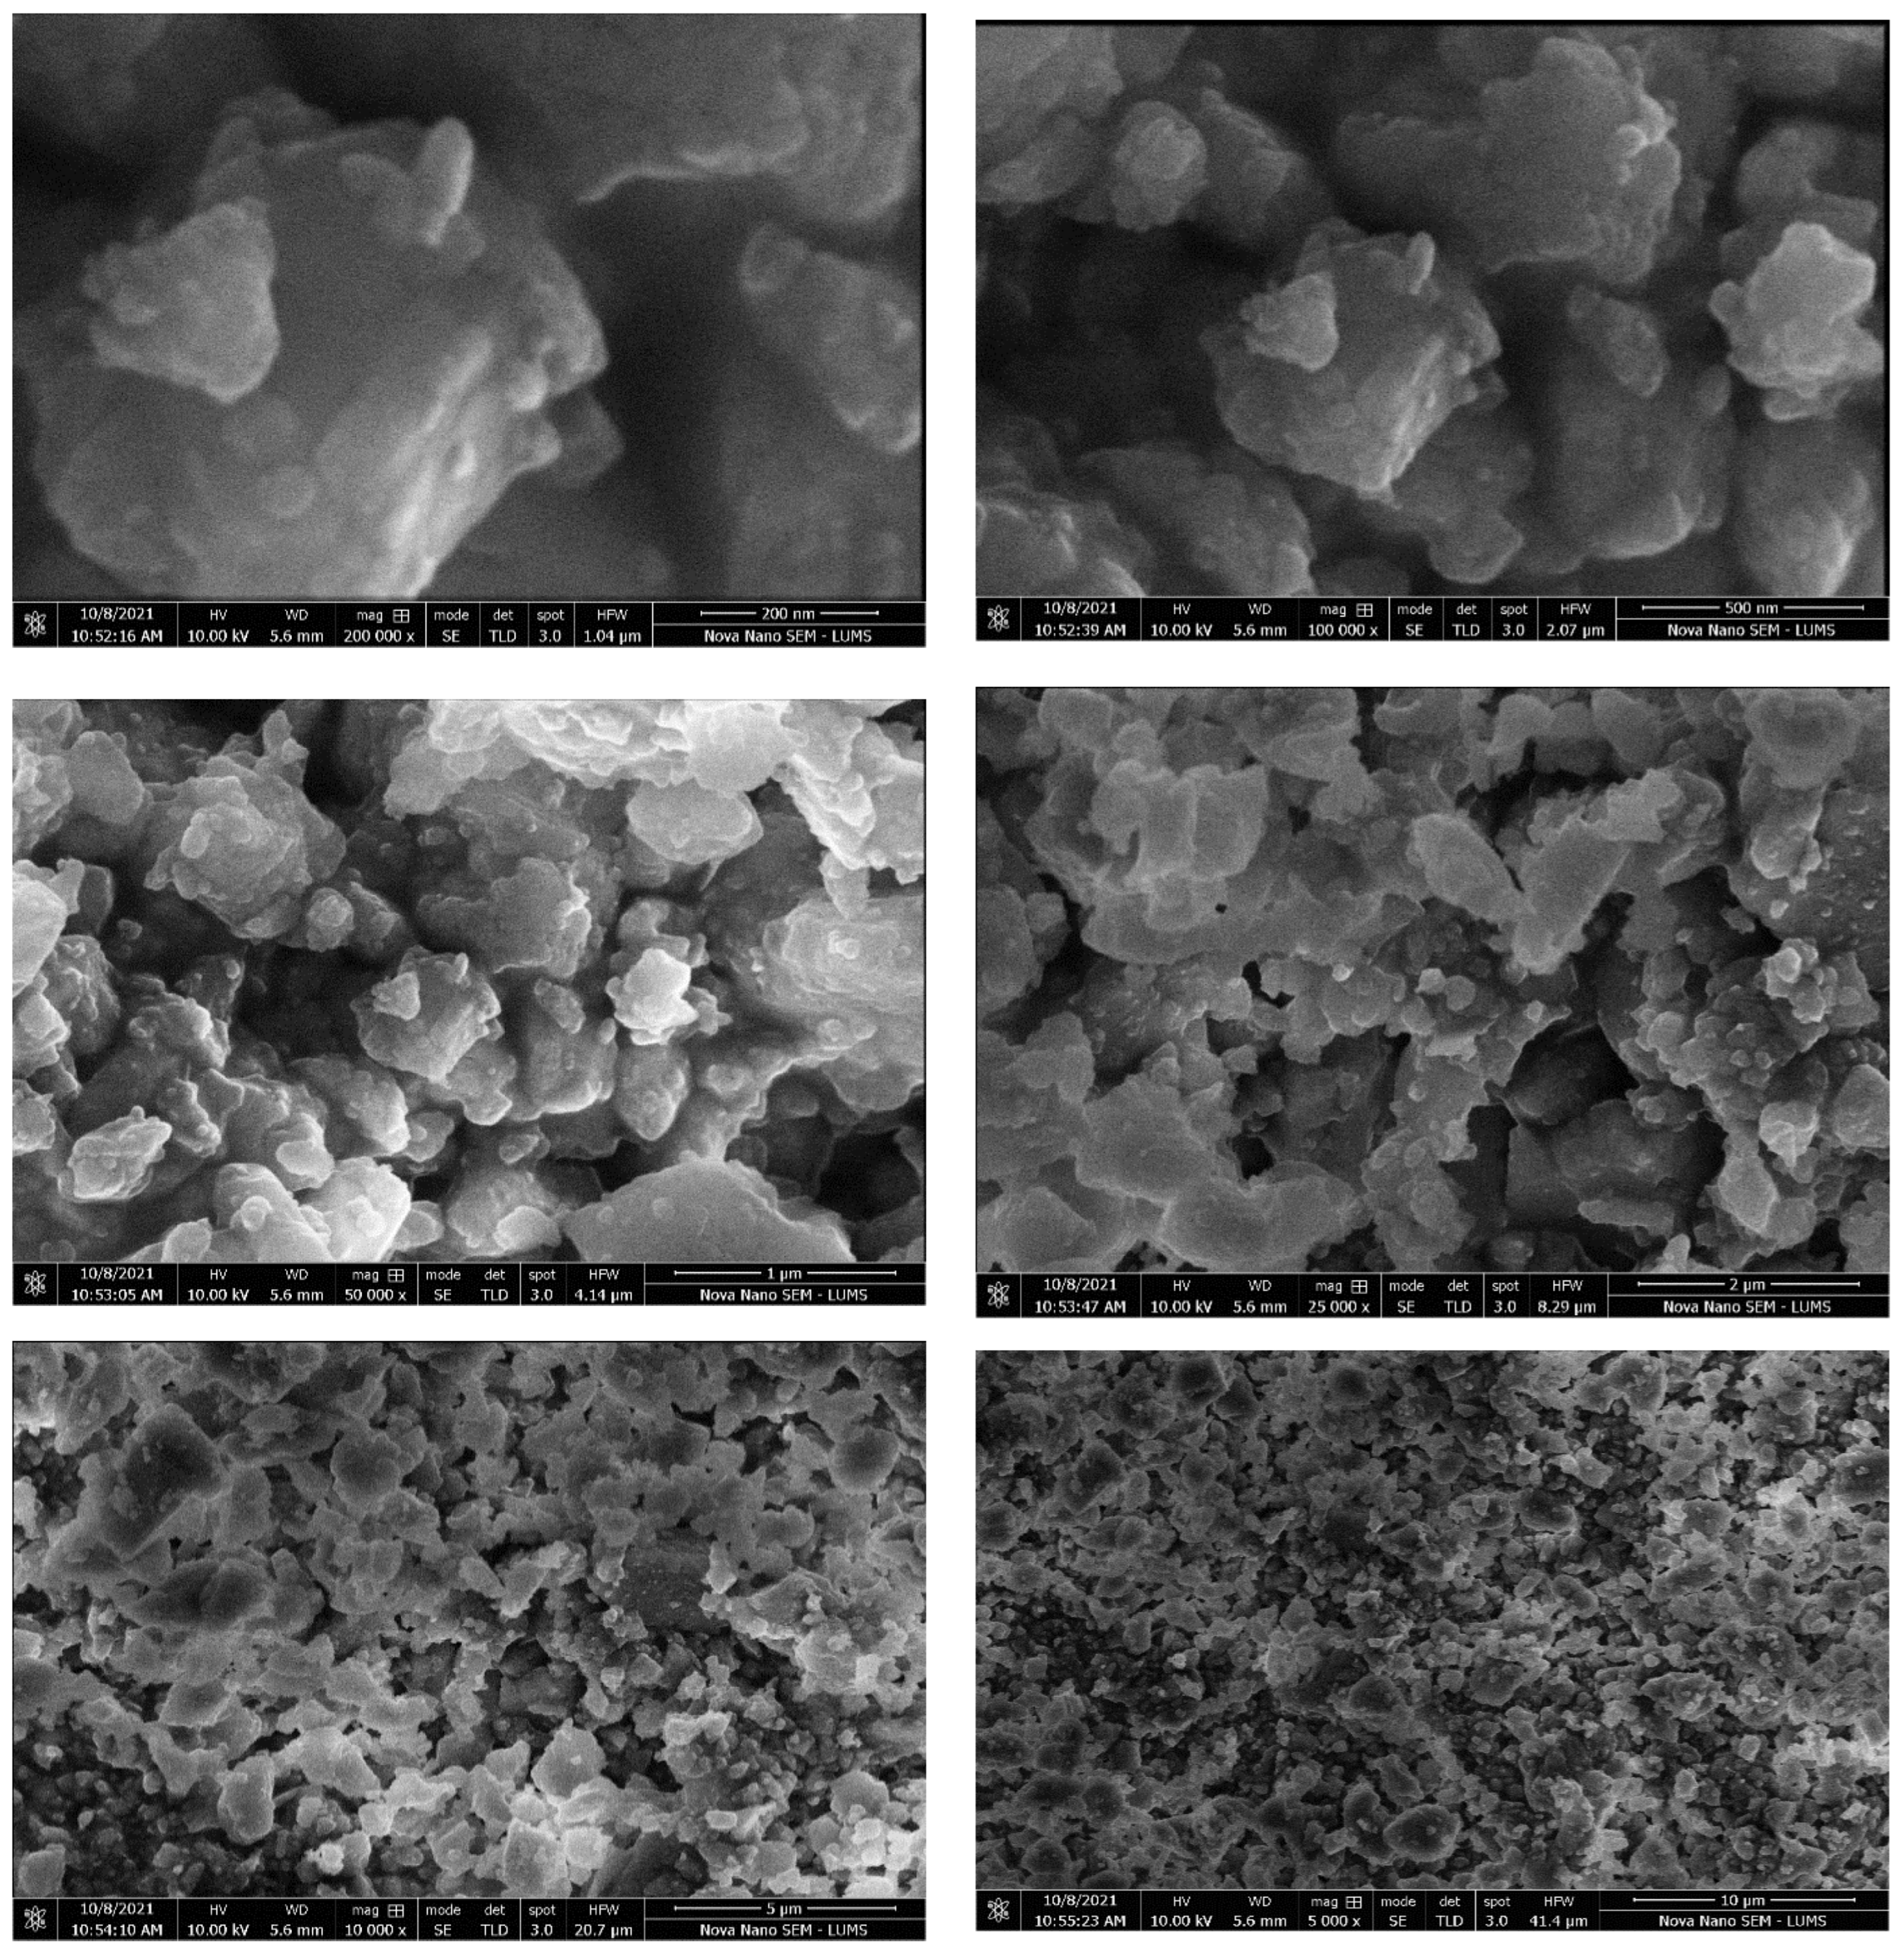
3.5.1. SEM Analysis

Scanning electron microscopy with TLD and ETD analysis were used to study surface morphology of composites. The SEM micrographs obtained for the composites at 200 nm, 500 nm, 1 µ, 5 µ, and 10 µ are shown in Figure 6 and Figure 7.
These micrographs suggested that the hoshanar marble have shown massive aggregated coarse morphology with heterogenous surface. While treated hoshanar marble composites exhibit several pores with irregular shapes, rough and uneven surfaces. These pores exhibit higher contact area and easy diffusion of pores during adsorption. Different cage like cavities were also present. In treated composite, surface area enhanced with the porosity and cavities increased the adsorption sites and spacing between them. Due to enhanced surface area, porosity and cavities, the treated composites are very efficient in dye removal by providing more sites for reaction to occur [28].

3.5.2. FTIR Analysis

According to FTIR spectrum of treated and untreated hoshanar showed absorption peaks at 1796, 1395, 872, 711 cm−1. However, by comparing untreated hoshanar with treated hoshanar marble, an additional peak was observed at 2512 cm−1. Absorption bands at 2512, 1796, 1395 and 711 cm−1 are assigned to calcite CaCO3. Carbonyl group is indicated by absorption band at 1796 cm−1. This indicated that the functional groups at these wave numbers participate in the dyes adsorption by sharing or exchanging electrons among sorbent and sorbate. When the dye was adsorbed, the peaks of vibrations became small which suggested that carbonyl groups may play the most important role in adsorption of these dyes [29].

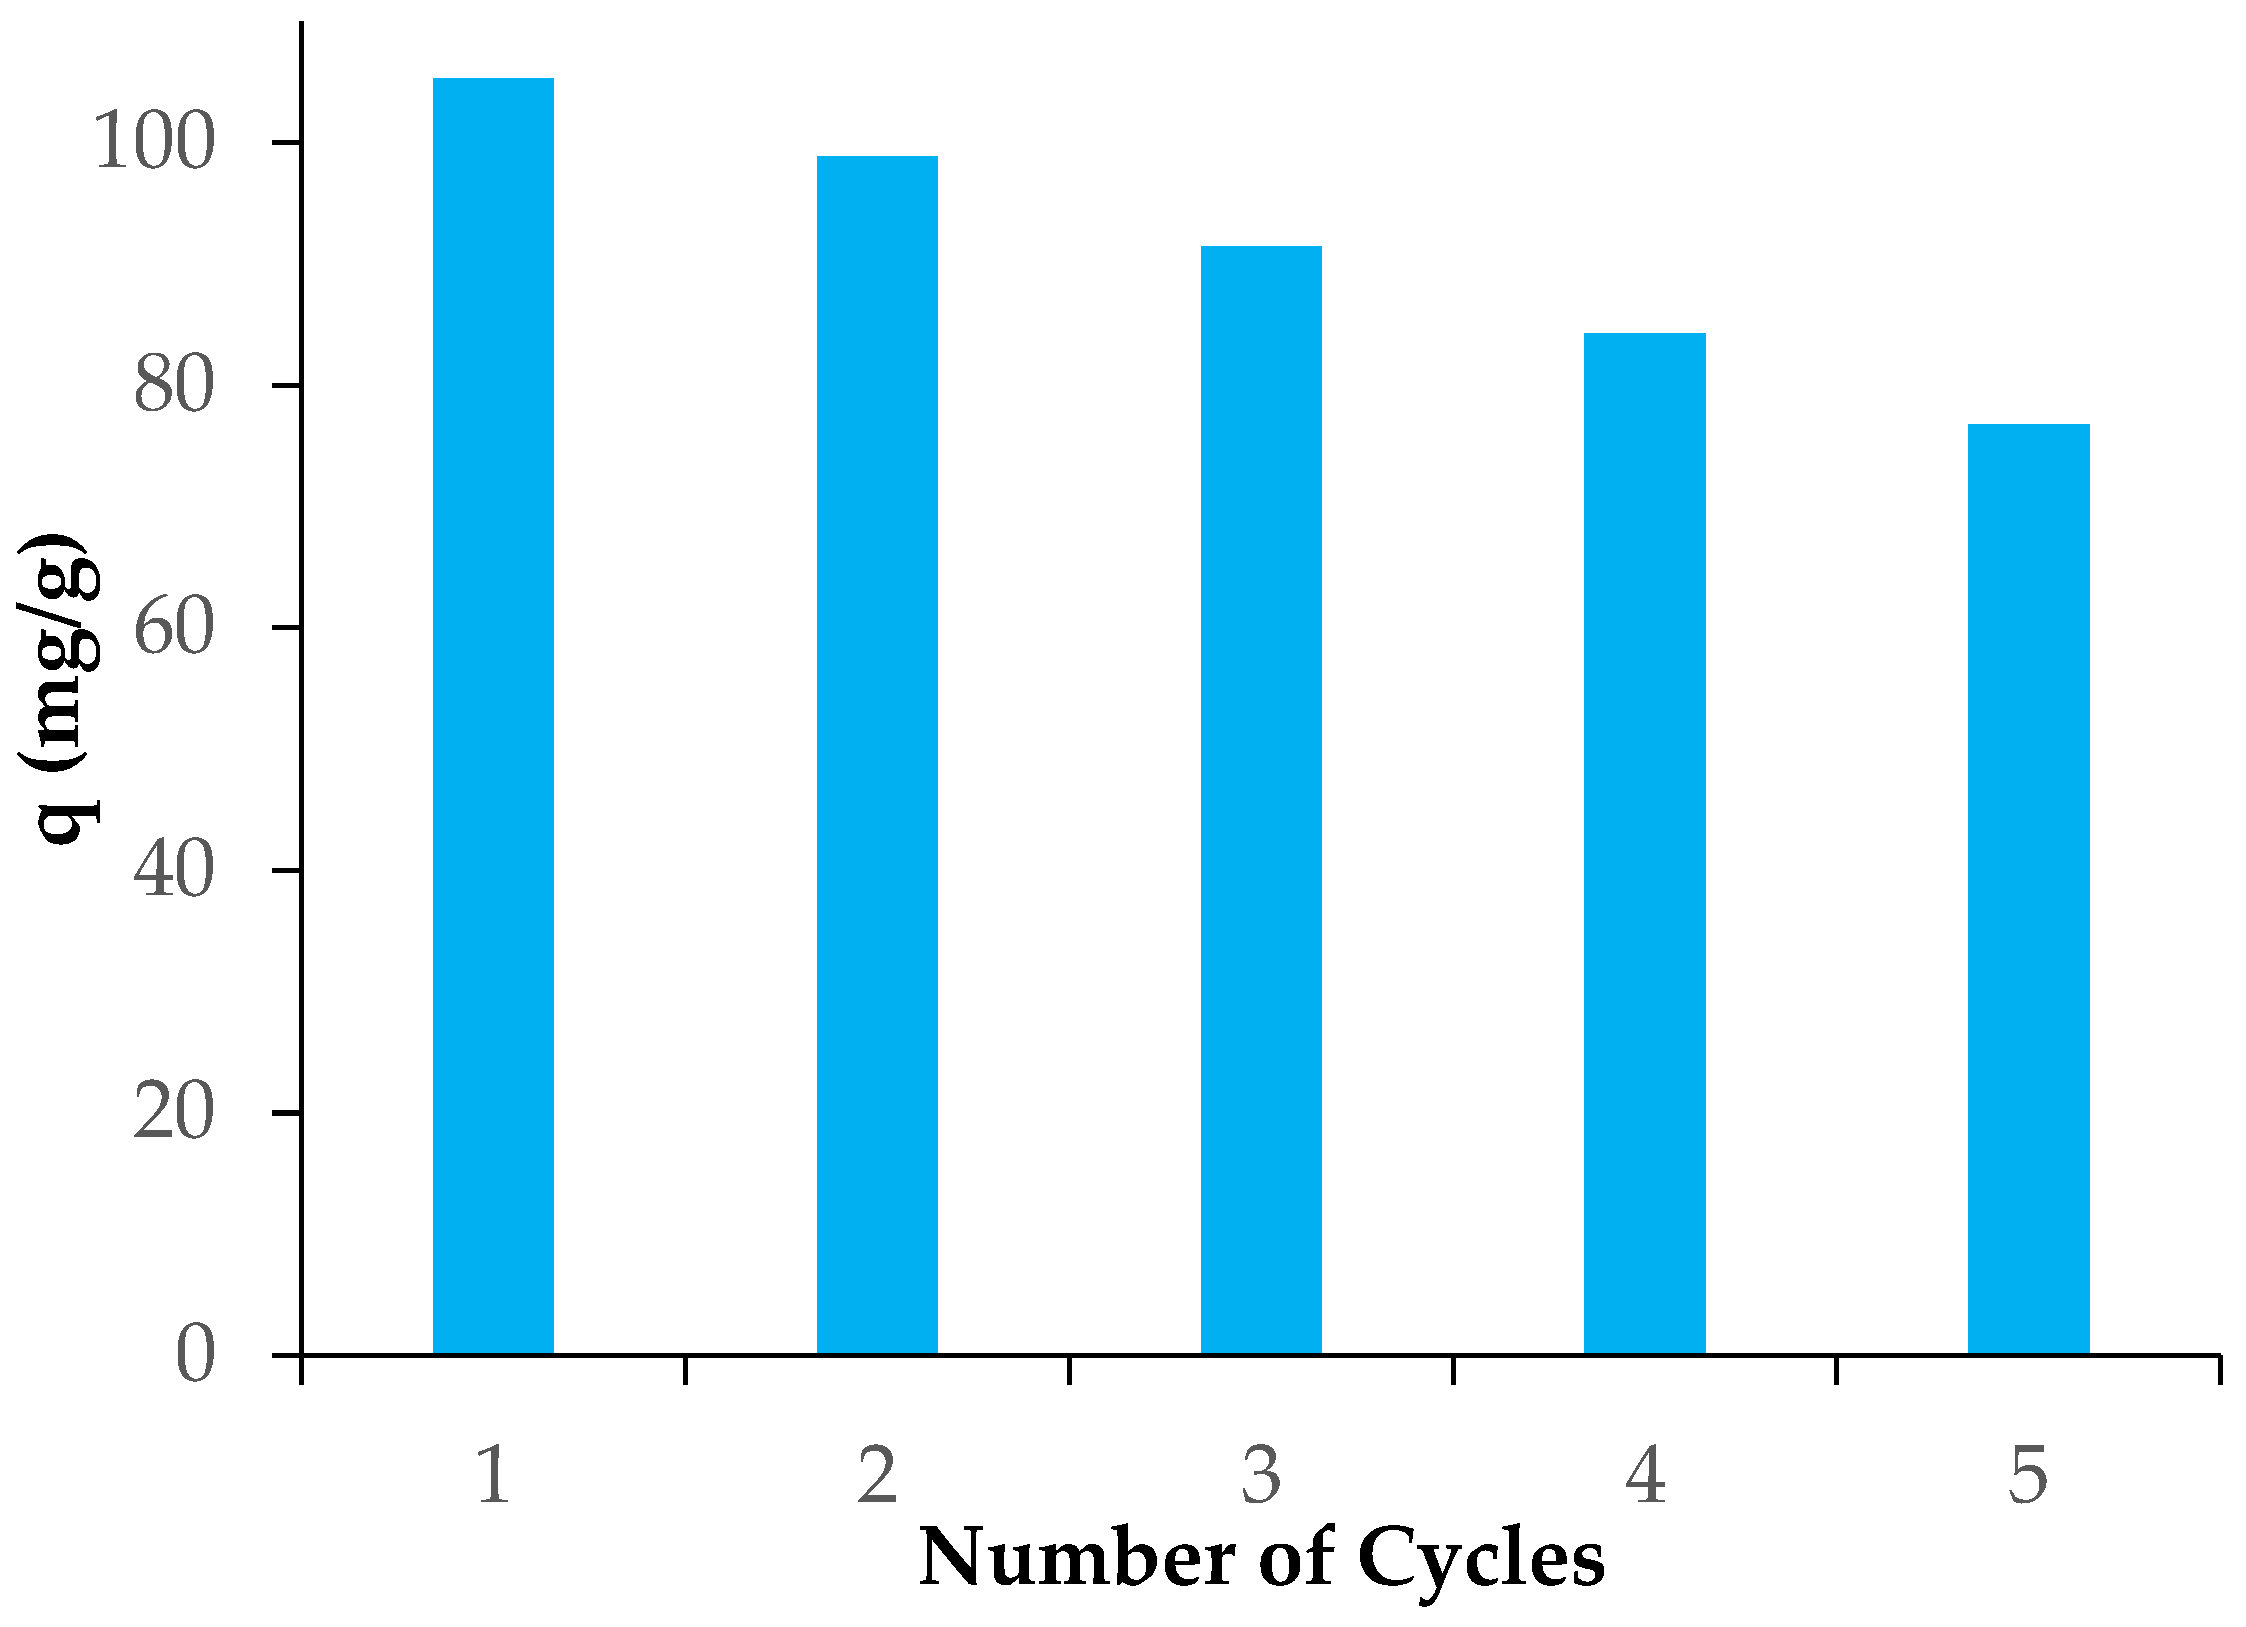
3.6. Study of Desorption and Reusability of Adsorbents

In this context, the reusability of marble having maximum adsorption capacity (HMPS) was investigated by using CH3OH as an eluent for up to five consecutive cycles. The adsorption-desorption cycles were studied five times as shown in Figure 8. For adsorption, the adsorbent (HMPS) was added in dye solution. The presence of dye in the solution was checked to calculate the removal efficiency after each cycle. Methyl alcohol was used as the eluent to remove the dye from the adsorbent’s surface, and the adsorbent was then dried for use in the following cycles. The removal efficiency of adsorption was high in first cycle due to availability of more adsorption sites, and it started decreasing gradually because of damage to nonrenewable adsorption sites. However, in the last cycle, adsorbent showed more than 70% of its efficiency. Therefore, HMPS is regarded as a good regenerable adsorbent based on the reusability results.

3.7. Comparative Study

To evaluate the performance of adsorbent, the removal capacity of HMPS was compared with previously reported adsorbents of direct violet 51 dye as listed in Table 3. The reported other adsorbents showed less removal capacity than HMPS (Table 3). The higher adsorption capacity of HMPS may be due to high surface area, porosity, and the presence of F e C N 6 on the surface of adsorbent in solution which helps in adsorption of cationic dye via electrostatic forces of attraction. Consequently, this comparison suggests that HMPS can be an excellent adsorbent for the removal of direct violet 51 dye.

4. Conclusions

Treatment methods for wastewater is one of the major prerequisites for development, economic growth, and health maintenance. Despite the advancement in technologies for the treatment of wastewater, adsorption is a common approach, because of its ease in operation, greater proficiency and affordable cost when it is compared with other approaches. Marble wastes are cheap and easily available adsorbents, so hoshanar and sunny grey marble wastes treated with the different chemicals have been applied for adsorption of dye namely Direct violet 51. Absorbance results by using spectrophotometer suggested that the marble wastes of hoshanar treated with the mixture of potassium ferricyanide and sodium metasilicate have better percentage removal than the untreated marble waste. Optimization of parameters such as concentration, dose of adsorbent, contact time, and pH were also observed and their results were calculated by Freundlich isotherm, Langmuir, Temkin, Dubinin–Radushkevich and Harkinjura isotherms. The results obtained suggested that R2 value is greater than 0.96 for Langmuir isotherm, so it fits accurately on treated and untreated nanocomposites than other isotherms. Results obtained from kinetics suggested that pseudo second order described the better performance than the pseudo first order.

Author Contributions

Conceptualization, M.A.H. and U.R.; methodology, A.A., M.A.H. and U.R.; software, U.R.; validation, M.A.H., I.A.B., F.A.A., U.R. and E.A.K.; formal analysis, A.A., M.A.H., F.A.A. and U.R.; investigation, A.A. and M.A.H.; resources, U.R., I.A.B. and F.A.A.; data curation, A.A., M.A.H. and U.R.; writing—original draft preparation, A.A. and M.A.H.; writing—review and editing, M.A.H., I.A.B., F.A.A., U.R. and E.A.K.; visualization, M.A.H. and U.R.; supervision, M.A.H.; project administration, M.A.H. and U.R.; funding acquisition, F.A.A. All authors have read and agreed to the published version of the manuscript.

Funding

The authors extend their thanks to Researchers Supporting Project (RSP-2021/160), King Saud University, Riyadh, Saudi Arabia.

Data Availability Statement

Not applicable.

Conflicts of Interest

The authors declare no conflict of interest.

References

  1. Halder, J.N.; Islam, M.N. Water pollution and its impact on the human health. J. Environ. Hum. 2015, 2, 36–46. [Google Scholar] [CrossRef]
  2. Khan, R.; Bhawana, P.; Fulekar, M. Microbial decolorization and degradation of synthetic dyes: A review. Rev. Environ. Sci. Bio. Technol. 2013, 12, 75–97. [Google Scholar] [CrossRef]
  3. Pawari, M.; Gawande, S. Ground water pollution and its consequence. Int. J. Eng. Res. Gen. Sci. 2015, 3, 773–776. [Google Scholar]
  4. Ullah, R.; Malik, R.N.; Qadir, A. Assessment of groundwater contamination in an industrial city, Sialkot, Pakistan. Afr. J. Environ. Sci. Technol. 2009, 3, 429–446. [Google Scholar]
  5. Azizullah, A.; Khattak, M.N.K.; Richter, P.; Häder, D.-P. Water pollution in Pakistan and its impact on public health—A review. Environ. Int. 2011, 37, 479–497. [Google Scholar] [CrossRef] [PubMed]
  6. De Gisi, S.; Lofrano, G.; Grassi, M.; Notarnicola, M. Characteristics and adsorption capacities of low-cost sorbents for wastewater treatment: A review. Sustain. Mater. Technol. 2016, 9, 10–40. [Google Scholar] [CrossRef]
  7. Zwiener, C.; Richardson, S.D.; De Marini, D.M.; Grummt, T.; Glauner, T.; Frimmel, F.H. Drowning in disinfection byproducts? Assessing swimming pool water. Environ. Sci. Technol. 2007, 41, 363–372. [Google Scholar] [CrossRef]
  8. Dutta, S.; Gupta, B.; Srivastava, S.K.; Gupta, A.K. Recent advances on the removal of dyes from wastewater using various adsorbents: A critical review. Mater. Adv. 2021, 2, 4497–4531. [Google Scholar] [CrossRef]
  9. Crini, G.; Lichtfouse, E. Wastewater treatment: An overview. In Green Adsorbents for Pollutant Removal. Environmental Chemistry for a Sustainable World; Crini, G., Lichtfouse, E., Eds.; Springer: Berlin/Heidelberg, Germany, 2018; Volume 18. [Google Scholar]
  10. Sharma, S.; Kaur, A. Various methods for removal of dyes from industrial effluents-a review. Indian J. Sci. Technol. 2018, 11, 1–21. [Google Scholar] [CrossRef]
  11. Akpor, O. Wastewater effluent discharge: Effects and treatment processes. In Proceedings of the 2011 3rd International Conference on Chemical, Biological and Environmental Engineering, Singapore, 23–25 September 2011; Volume 20, pp. 85–91. [Google Scholar]
  12. Montaño-Medina, C.U.; Lopéz-Martínez, L.M.; Ochoa-Terán, A.A.; López-Maldonado, E.A.; Salazar-Gastelum, M.I.; Trujillo-Navarrete, B.; Pérez-Sicairos, S.; Cornejo-Bravoc, J.M. New pyridyl and aniline-functionalized carbamoylcarboxylic acids for removal of metal ions from water by coagulation-flocculation process. Chem. Eng. J. 2023, 451, 138396. [Google Scholar] [CrossRef]
  13. Duan, X.; Srinivasakannan, C.; Wang, X.; Wang, F.; Liu, X. Synthesis of activated carbon fibers from cotton by microwave induced H3PO4 activation. J. Taiwan Inst. Chem. Eng. 2017, 70, 374–381. [Google Scholar] [CrossRef]
  14. Glassmeyer, S.T.; Furlong, E.T.; Kolpin, D.W.; Cahill, J.D.; Zaugg, S.D.; Werner, S.L.; Meyer, M.T.; Kryak, D.D. Transport of chemical and microbial compounds from known wastewater discharges: Potential for use as indicators of human fecal contamination. Environ. Sci. Technol. 2005, 39, 5157–5169. [Google Scholar] [CrossRef]
  15. Mehta, D.; Mondal, P.; George, S. Utilization of marble waste powder as a novel adsorbent for removal of fluoride ions from aqueous solution. J. Environ. Chem. Eng. 2016, 3, 932–942. [Google Scholar] [CrossRef]
  16. Merzouk, B.; Gourich, B.; Sekki, A.; Madani, K.; Vial, C.; Barkaoui, M. Studies on the decolorization of textile dye wastewater by continuous electrocoagulation process. Chem. Eng. J. 2009, 149, 207–214. [Google Scholar] [CrossRef]
  17. Myers, R.H.; Montgomery, D.C.; Anderson-Cook, C.M. Response Surface Methodology: Process and Product Optimization Using Designed Experiments, 4th ed.; John Wiley & Sons: Hoboken, NJ, USA, 2016; pp. 1–856. [Google Scholar]
  18. Ahmad, R.; Kumar, R.; Haseeb, S. Adsorption of Cu2+ from aqueous solution onto iron oxide coated eggshell powder: Evaluation of equilibrium, isotherms, kinetics, and regeneration capacity. Arab. J. Chem. 2012, 5, 353–359. [Google Scholar] [CrossRef]
  19. Vijayaraghavan, K.; Yun, Y.-S. Bacterial biosorbents and biosorption. Biotechnol. Adv. 2008, 26, 266–291. [Google Scholar] [CrossRef]
  20. Baqar, M.; Sarwar, A.; Shahwar, D.-e.; Nazir, R.; Shahid, S.; Shaikh, I.A.; Arslan, M.; Machado, S. Adsorption of acid yellow-73 and direct violet-51 dyes from textile wastewater by using iron doped corncob charcoal. Pak. J. Anal. Environ. Chem. 2015, 16, 31–38. [Google Scholar]
  21. Bouberka, Z.; Khenifi, A.; Benderdouche, N.; Derriche, Z. Removal of supranol yellow 4GL by adsorption onto Cr-intercalated montmorillonite. J. Hazard. Mater. 2006, 133, 154–161. [Google Scholar] [CrossRef]
  22. Senturk, H.B.; Ozdes, D.; Duran, C. Biosorption of Rhodamine 6G from aqueous solutions onto almond shell (Prunus dulcis) as a low cost biosorbent. Desalination 2010, 252, 81–87. [Google Scholar] [CrossRef]
  23. Sadaf, S.; Bhatti, H.N. Biosorption of Foron turquoise SBLN using mixed biomass of white rot fungi from synthetic effluents. Afr. J. Biotechnol. 2011, 10, 13548–13554. [Google Scholar] [CrossRef]
  24. Aqdam, S.R.; Otzen, D.E.; Mahmoodi, N.M.; Morshedi, D. Adsorption of azo dyes by a novel bio-nanocomposite based on whey protein nanofibrils and nano-clay: Equilibrium isotherm and kinetic modeling. J. Colloid Interface Sci. 2021, 602, 490–503. [Google Scholar] [CrossRef]
  25. Amin, M.T.; Alazba, A.A.; Shafiq, M. Adsorptive removal of reactive black 5 from wastewater using bentonite clay: Isotherms, kinetics and thermodynamics. Sustainability 2015, 7, 15302–15318. [Google Scholar] [CrossRef]
  26. Bushra, R.; Mohamad, S.; Alias, Y.; Jin, Y.; Ahmad, M. Current approaches and methodologies to explore the perceptive adsorption mechanism of dyes on low-cost agricultural waste: A review. Microp. Mesoporous Mater. 2021, 319, 111040. [Google Scholar] [CrossRef]
  27. Ruan, W.; Hu, J.; Qi, J.; Hou, Y.; Zhou, C.; Wei, X. Removal of dyes from wastewater by nanomaterials: A review. Adv. Mater. Lett. 2019, 10, 9–20. [Google Scholar] [CrossRef]
  28. Hamed, M.M.; Ahmed, I.; Metwally, S. Adsorptive removal of methylene blue as organic pollutant by marble dust as eco-friendly sorbent. J. Ind. Eng. Chem. 2014, 20, 2370–2377. [Google Scholar] [CrossRef]
  29. Ricci, C.; Miliani, C.; Brunetti, B.G.; Sgamellotti, A. Non-invasive identification of surface materials on marble artifacts with fiber optic mid-FTIR reflectance spectroscopy. Talanta 2006, 69, 1221–1226. [Google Scholar] [CrossRef]
  30. Utara, S.; Phataib, P. Adsorption Characteristics of Direct Violet Dye by Natural Rubber Chips. In Advanced Materials Research; Trans Tech Publications, Ltd.: Wollerau, Switzerland, 2013; Volume 844, pp. 391–394. [Google Scholar]
  31. Chrastil, J. Adsorption of direct dyes on cotton: Kinetics of dyeing from finite baths based on new information. Text. Res. J. 1990, 60, 413–416. [Google Scholar] [CrossRef]
  32. Sadaf, S.; Bhatti, H.N.; Nausheen, S.; Noreen, S. Potential use of low-cost lignocellulosic waste for the removal of direct violet 51 from aqueous solution: Equilibrium and breakthrough studies. Arch. Environ. Contam. Toxicol. 2014, 66, 557–571. [Google Scholar] [CrossRef]
  33. Ho, S. Removal of dyes from wastewater by adsorption onto activated carbon: Mini review. J. Geosci. Environ. Prot. 2020, 8, 120–131. [Google Scholar] [CrossRef]
  34. Mahmoodi, N.M.; Abdi, J.; Bastani, D. Direct dyes removal using modified magnetic ferrite nanoparticle. J. Environ. Health Sci. Eng. 2014, 12, 1–10. [Google Scholar] [CrossRef]
Figure 1. Synthesis of nanocomposite from marble waste.
Separations 09 00425 g001
Figure 2. Effect of initial concentration on direct violet 51 adsorption by various materials.
Separations 09 00425 g002
Figure 3. Effect of adsorbent dose on direct violet 51 adsorption by various materials.
Separations 09 00425 g003
Figure 4. Effect of pH on direct violet 51 adsorption by various materials.
Separations 09 00425 g004
Figure 5. Effect of temperature on direct violet 51 adsorption by various materials.
Separations 09 00425 g005
Figure 6. SEM analysis of hoshanar marble waste.
Separations 09 00425 g006
Figure 7. SEM analysis of hoshanar marble waste treated with mixture of potassium ferricyanide and sodium metasilicate.
Separations 09 00425 g007
Figure 8. Reusability of HMPS for the removal of direct violet 51.
Separations 09 00425 g008
Table 1. A comparison of Langmuir isotherm, Freundlich isotherm, Temkin, Harkin jura, Dubinin–Radushkevich isotherms for predicting involved process direct violet 51 dye adsorption data using hoshanar and sunny grey marble waste composites.
Isothermal ModelsAdsorbents
HMHMPHMSHMPSSGMSGMPSGMSSGMPS
Langmuirqmax (exp)67.1969.1180.95105.3160.0660.7071.299.02
qcal (mg/g)37.4598.0387.72117.6569.4593.4580116.26
KL (L/mg)0.4730.0560.2810.2090.1560.0430.1510.116
R20.960.970.980.980.990.970.980.97
Freundlichqmax (exp)67.1969.1180.95105.3160.0660.7071.299.02
qcal (mg/g)51.9473.9387.31114.9968.1467.3171.8099.08
Kf (L/mg)33.349.1131.4132.1215.586.182122.82
R20.200.970.900.930.900.970.980.99
N8.651.793.652.882.601.583.052.51
Dubinin-Radushkevichqmax (exp)67.1969.1180.95105.3160.0660.7071.299.02
qcal (mg/g)49.1348.6767.8782.3542.5444.5254.9270.04
R20.490.700.740.730.780.820.770.72
E (KJ/mol)−1118−500−1000−1000−500−408−745−790
Β (mol2/J2) 4 × 10 7 2 × 10 6 5 × 10 7 5 × 10 7 2 × 10 6 3 × 10 6 9 × 10 7 8 × 10 7
Temkinqmax (exp)67.1969.1180.95105.3160.0660.7071.299.02
qcal (mg/g)52.6761.8983.43107.4363.2362.7168.6093.24
R20.170.950.890.910.920.970.970.96
B4.9121.0215.1622.6514.8519.8914.8322.74
At (L/g)976.160.5795.862.901.620.4612.3731.504
Harkin juraqmax (exp)67.1969.1180.95105.3160.0660.7071.299.02
qcal (mg/g)24.4910.8324.9125.0114.33818.3520.7
R20.290.860.830.840.810.730.860.86
A−2500−370−2000−2000−666.7−200−1111.1−125
B−2.5−1.51−1.6−1.6−1.6−1.48−1.7−0.15
Table 2. A comparison of pseudo 1st order kinetics and 2nd order kinetics models for describing adsorption data of direct violet 51 dye using hoshanar and sunny grey marble waste composites at different temperatures.
AdsorbentsPseudo 1st Order KineticsPseudo 2nd Order Kinetics
QeK1R2QeK2R2
30 °C
HM68.6710.780.01260.9768.6769.45 3.36 × 10 3 0.99
HMP70.9210.76−0.01330.9970.9271.94 3.51 × 10 3 0.99
HMS82.1610.91−0.01230.9982.1683.33 3.52 × 10 3 0.99
HMPS109.1610.54−0.01340.99109.1610.9.81 3.64 × 10 3 0.99
SGM61.9210.50−0.01310.9961.9262.89 3.53 × 10 3 0.99
SGMP66.4210.44−0.01310.9966.4267.14 3.59 × 10 3 0.99
SGMS75.416.68−0.00960.9275.4175.76 5.03 × 10 3 0.99
SGMPS102.419.91−0.01310.99102.41103.09 3.76 × 10 3 0.99
40 °C
HM46.1710.21−0.01310.9946.1747.17 3.36 × 10 3 0.99
HMP48.4210.61−0.01320.9948.4249.26 3.37 × 10 3 0.99
HMS59.6710.43−0.01320.9959.6760.61 3.52 × 10 3 0.99
HMPS88.9111.97−0.01450.9688.9190.09 3.44 × 10 3 0.99
SGM50.6710.50−0.01290.9950.6751.54 3.76 × 10 3 0.99
SGMP57.4210.79−0.01270.9757.4258.47 3.24 × 10 3 0.99
SGMS61.9210.74−0.01310.9961.9262.89 3.53 × 10 3 0.99
SGMPS79.9112.09−0.00850.9779.9180.64 2.45 × 10 3 0.99
50 °C
HM39.4212.37−0.00870.9839.4240.65 2.03 × 10 3 0.99
HMP41.6711.07−0.01350.9841.6742.73 3.12 × 10 3 0.99
HMS43.9211.22−0.00130.9843.9245.04 3.11 × 10 3 0.99
HMPS75.4125.23−0.01150.9775.4178.12 1.14 × 10 3 0.99
SGM46.1711.37−0.01380.9846.1747.16 3.12 × 10 3 0.99
SGMP48.4212.51−0.01470.9748.4249.50 3.02 × 10 3 0.99
SGMS50.6710.76−0.01330.9950.6751.54 3.35 × 10 3 0.99
SGMPS68.6712.09−0.00850.9768.6769.93 2.36 × 10 3 0.99
60 °C
HM25.9211.37−0.01380.9825.9227.24 2.54 × 10 3 0.99
HMP34.9212.73−0.00870.9834.9236.63 1.92 × 10 3 0.99
HMS34.8210.60−0.01310.9934.8235.97 3.09 × 10 3 0.99
HMPS41.6711.66−0.01400.9741.6742.73 3.17 × 10 3 0.99
SGM28.1711.07−0.01350.9828.1729.41 2.73 × 10 3 0.99
SGMP39.4210.47−0.01310.9939.4240.04 3.23 × 10 3 0.99
SGMS41.6711.37−0.01380.9841.6742.73 3.04 × 10 3 0.99
SGMPS52.9210.76−0.01330.9952.9253.76 3.38 × 10 3 0.99
70 °C
HM16.9310.60−0.01310.9916.9318.55 2.04 × 10 3 0.99
HMP21.4211.37−0.01380.9821.4222.93 2.25 × 10 3 0.99
HMS25.9211.07−0.01350.9825.9227.17 2.63 × 10 3 0.99
HMPS28.1710.65−0.01310.9928.1729.32 2.89 × 10 3 0.99
SGM19.1811.37−0.01380.9819.1820.83 1.90 × 10 3 0.99
SGMP25.9211.22−0.01350.9825.9227.24 2.58 × 10 3 0.99
SGMS30.4210.91−0.01330.9930.4231.54 2.87 × 10 3 0.99
SGMPS39.4210.45−0.01310.9939.4240.48 3.23 × 10 3 0.99
Table 3. Comparison of removal capacity of HMPS with previously reported adsorbents for adsorption of direct violet 51 dye.
AdsorbentsRemoval Capacity (mg/g)Ref.
HM67.19This study
HMPS105.31This study
Natural rubber0.0245 [30]
Cotton fabric2.26[31]
Sugarcane bagasse36.17[32]
Activated carbon26 [33]
Modified magnetic ferrite nanoparticles55.5[34]
Publisher’s Note: MDPI stays neutral with regard to jurisdictional claims in published maps and institutional affiliations.

