1. Introduction
Visualization can be defined as the necessary technique to create an image, video, etc., with the main purpose being to send a message. The first tests were carried out in a high Reynolds number tunnel to study changes in aerodynamic characteristics by modifying the airfoil of a sailplane (simulating the presence of insects) or the Reynolds number itself [
1]. A few years later, there was interest in optimizing the lift-to-drag ratio at lower Reynolds numbers to attempt to understand the behavior of the wings during the soaring maneuver of some species of birds [
2]. It was not until a decade after that the scientific community became interested in the ultra-low Reynolds number experiments [
3]. The flight environment of the insects was studied, attempting to build a man-made aircraft that could work under the same conditions. That same author went into more detail by studying micro air vehicles at ultra-low Reynold numbers, developing and testing appropriate rotors for those conditions [
4]. Thanks to this knowledge, it was possible to try to understand the flow behavior with Reynolds numbers between 400 and 1200, where the model was validated by comparing the solutions obtained with the ones achieved by Kunz [
5]. To fully understand the micro air vehicles, tests were performed on flat-plate airfoils with Reynolds numbers between 1 and 200 [
6]. Having studied the low and ultra-low Reynolds number spectrum, researchers tried to visualize the effect that the number had on the turbulence downstream of an airfoil [
7,
8], or the effect it had on the laminar separation bubble at the leading edge of an airfoil [
9]. Others preferred to study the aerodynamics of some birds and insects, such as a dragonfly at Re below 8000 [
10], or an owl [
11], due to their interest in micro air vehicles with fixed wings. Having studied the behavior of aerodynamic structures (such as airfoils), there was interest in knowing what behavior the flow displays on bluff bodies at low Reynolds numbers [
12]. It is also interesting because this study was placed in the same hydrodynamic towing tank as in this project.
Similarly, to the previous field of study, an interest in knowing the similarities between Mars and Earth appeared. The reason for this is a desire to look for new places to obtain raw materials and even in the future to live. To achieve this, a study of the Martian atmospheric boundary layer was carried out [
13]. This study suggested the need to take new measurements, which could constrain the models so that the next missions would know the requirements. Following that path, the Rover Environmental Monitoring Station (REMS) was taken to Mars [
14]. Its main purpose was to collect more data concerning the thermal environment, ultraviolet radiation, and water cycling. With these data, it could be possible to have more precision during the landing maneuver or by calculating the perturbations the lander may produce on its final approach, no matter the wind speed [
15].
It is at this point where both paths (the low Reynolds number study and the Mars study) converge. Researchers are improving both the design and the performance of rovers, beginning with the Sojourner, and currently with the Mars 2020 Rover (known as
Perseverance). For the latter, numerous studies were carried out. One such report was the study of the flow around the vehicle, showing how the atmosphere of Mars behaves and the perturbations the rover may have as a result of that flow [
16]. Linked to it, there was an investigation about how well the anemometers worked in the presence of the mentioned perturbations, and the regions where each of them measures the best [
17]. The next step was to design space drones, because they allow access to places where the rover cannot reach. There were studies of fixed-wing space drones in different solar system bodies [
18]. The rotary-wing space drone was selected for its first mission and was inside the Mars 2020 rover. To achieve this, it was necessary to study the shape of the rotor, the blades, and the airfoils [
19,
20,
21].
The reason why flow visualization is important in this project is to find out if the anemometers placed at the mast of the Mars rover Perseverance are recording proper data concerning the wind speed on the surface of the mentioned planet. In order to understand the results obtained during the experiment, it is important to comment on the necessary knowledge of fluid mechanics and aerodynamics and how they are connected.
For valid results, the interference study must be done by simulating, as much as possible, the atmospheric conditions which the
Perseverance would encounter. For that reason, it was decided that the Reynolds number (
Re) in the experiment must be the same as on Mars. This number established the importance of the convective acceleration, compared to the viscous stresses. That in mathematics terms is:
where
is the density on the surface of Mars,
U is the wind speed,
Lc is the characteristic length of the
Perseverance, and
µ is the dynamic viscosity of Mars.
For that study, the characteristics of the atmosphere of Mars must be known. Assuming that the temperature on the surface of that planet is the mean value of [
16], the density used would have been the following:
In addition, the dynamic viscosity at the surface of Mars can be calculated by applying its equation:
where the sub-index “
M” refers to Mars.
The maximum wind speed observed on the surface of Mars has been measured [
22], and its value is as follows:
The last parameter needed to obtain the Reynolds number at which the Mars rover
Perseverance works is the characteristic length. Since the aim of the project was to study the interference of the anemometers, the diameter of one of them was selected as this length [
23]:
The Reynolds number looked for is the following:
To understand the experimental results obtained, it is necessary first to learn how the flow will act around the tested element. Because both the mast and the anemometers have a bluff shape, there will be von Karman vortex streets downstream. The shape of them varies with the value of the Reynolds number [
12] so, considering that the test will be performed at very low Re (seen in Equation (6)), one approximation of the expected results would be given in
Figure 1.
2. Materials and Methods
Once a brief introduction of the project is made, it is necessary to comment on the manufacturing of the element to be tested, as well as the hydrodynamic towing tank where the test is going to be placed.
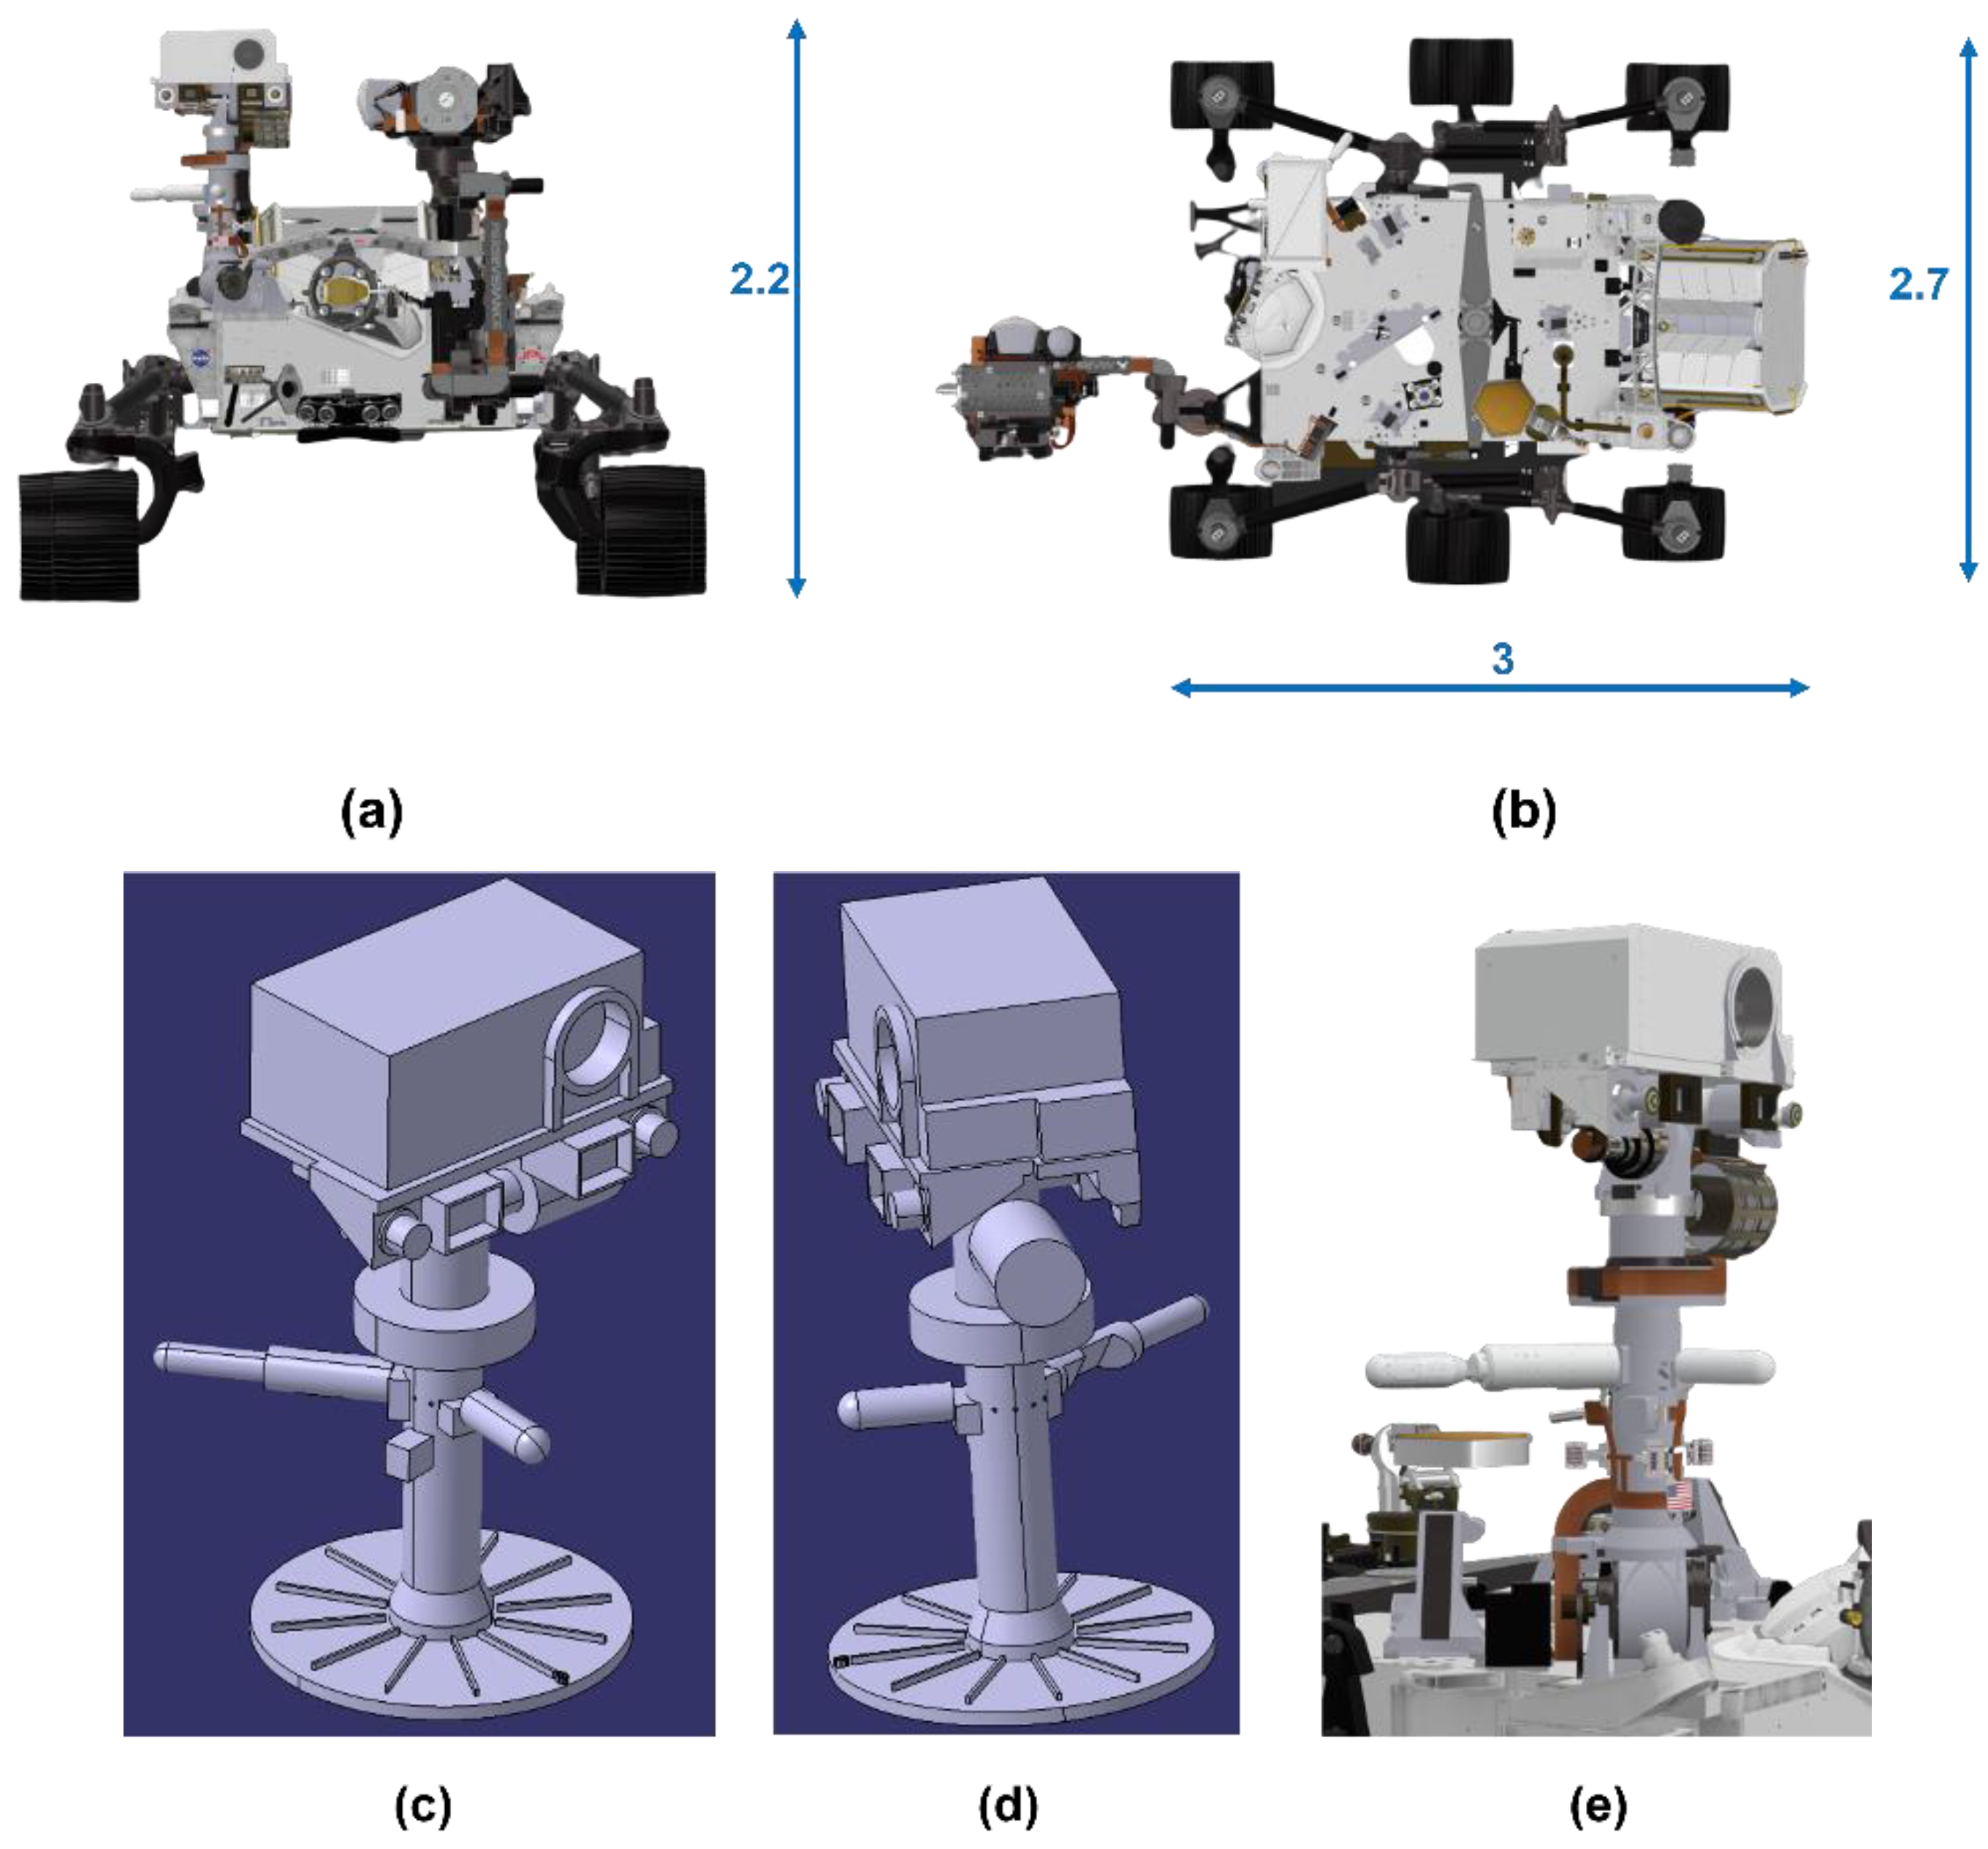
The Mars rover
Perseverance is designed with CATIA V5 (Dassault Systèmes,
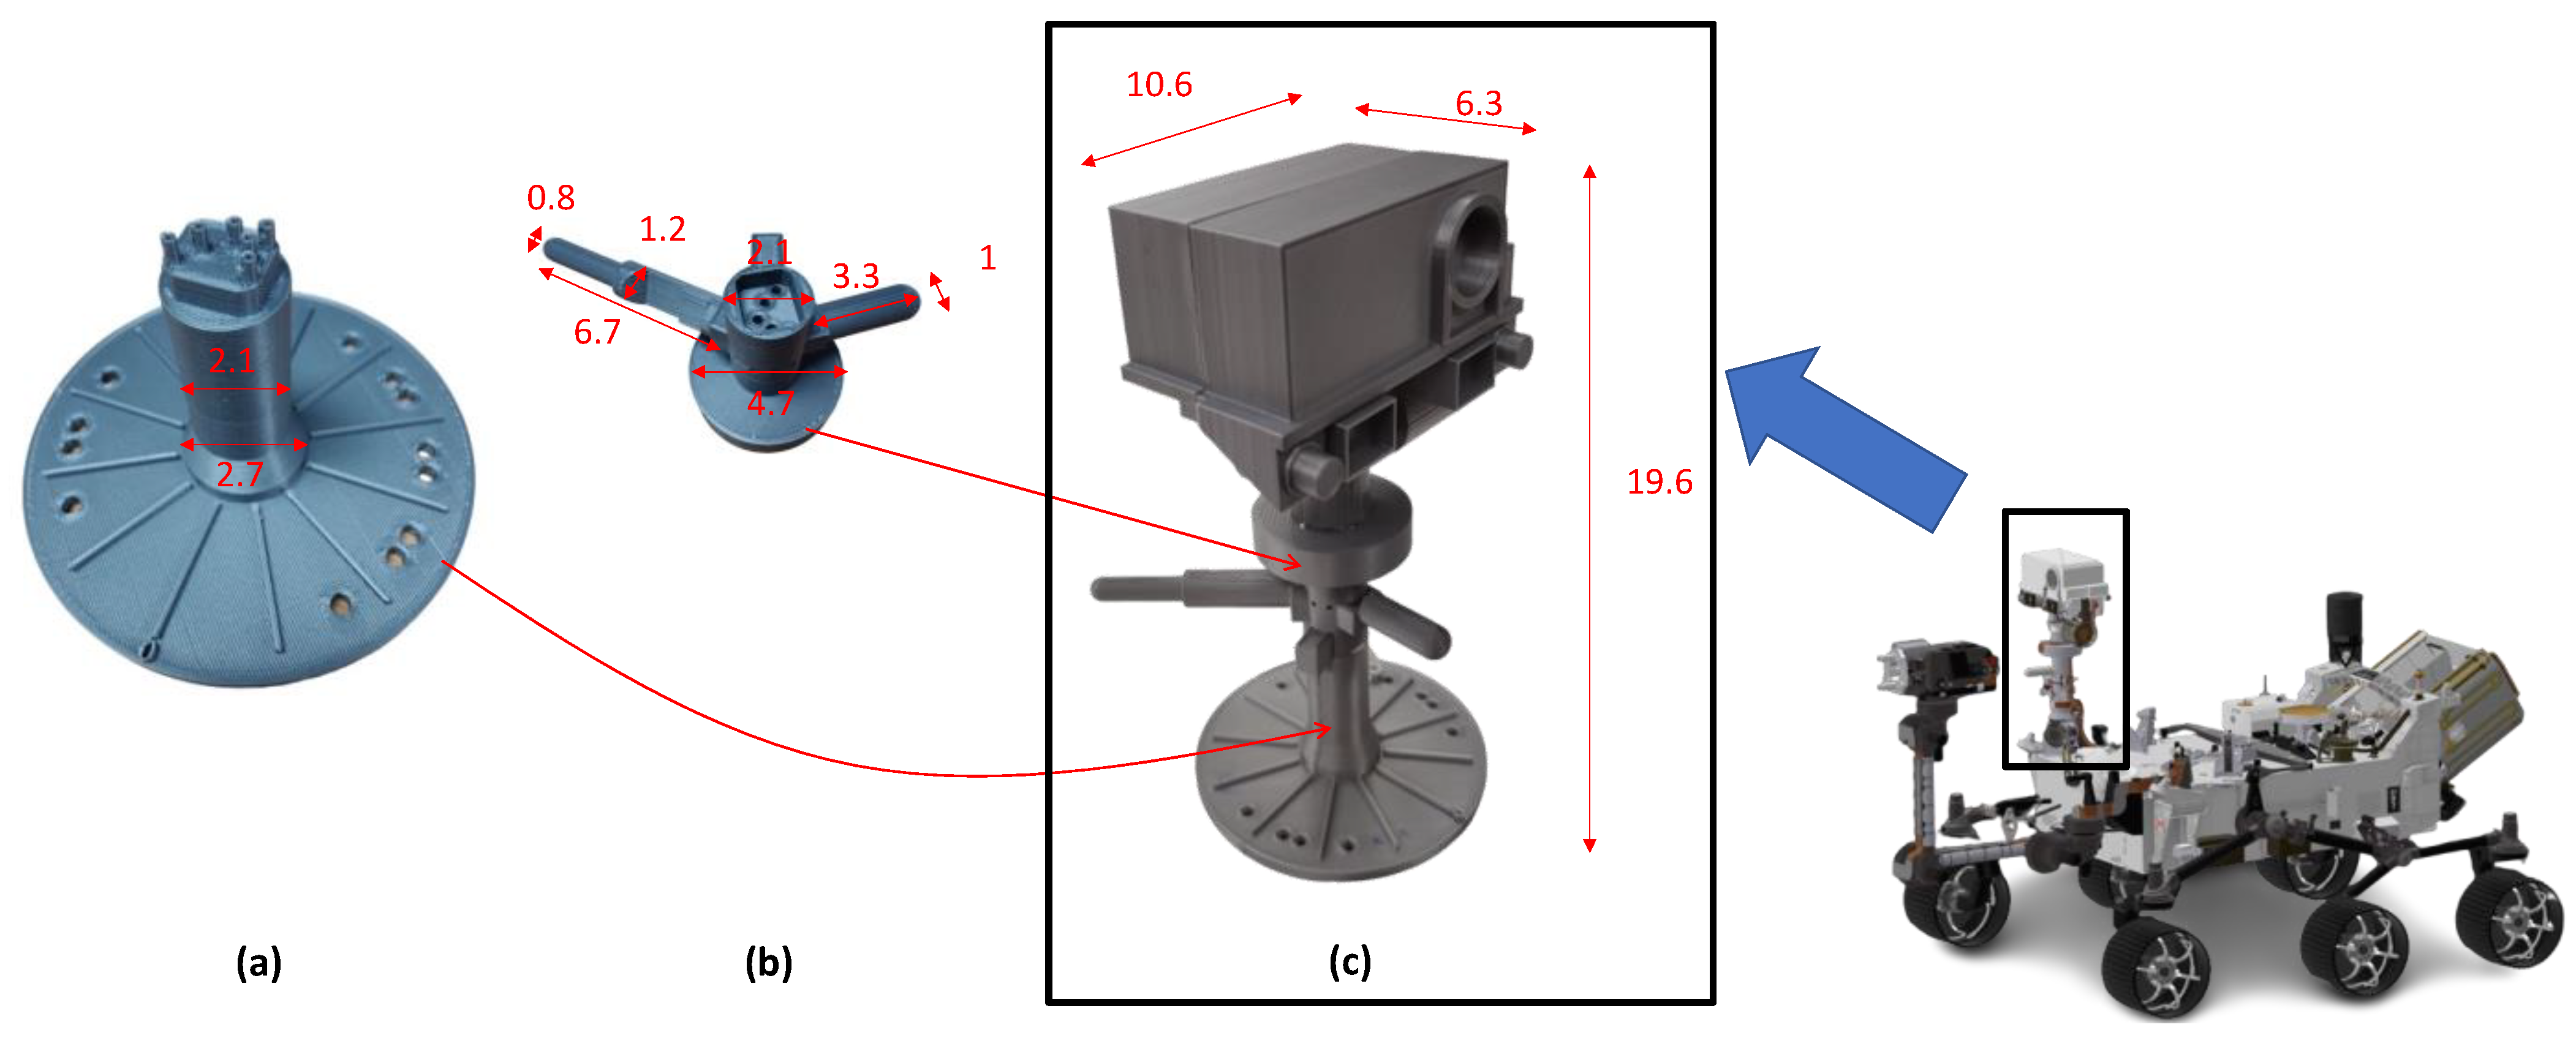
https://www.3ds.com/products-services/catia/, accessed on 27 September 2022). Since the test wants to show preliminary results of the interferences between the mast and the anemometers, the designed part only covers that area. To make the results as realistic as possible, both the main components of the camera held by the mast and the largest volume elements attached to it have been added. The prototype was built based on [
23] with a geometrical scale of 1:5. The result can be seen in
Figure 2.
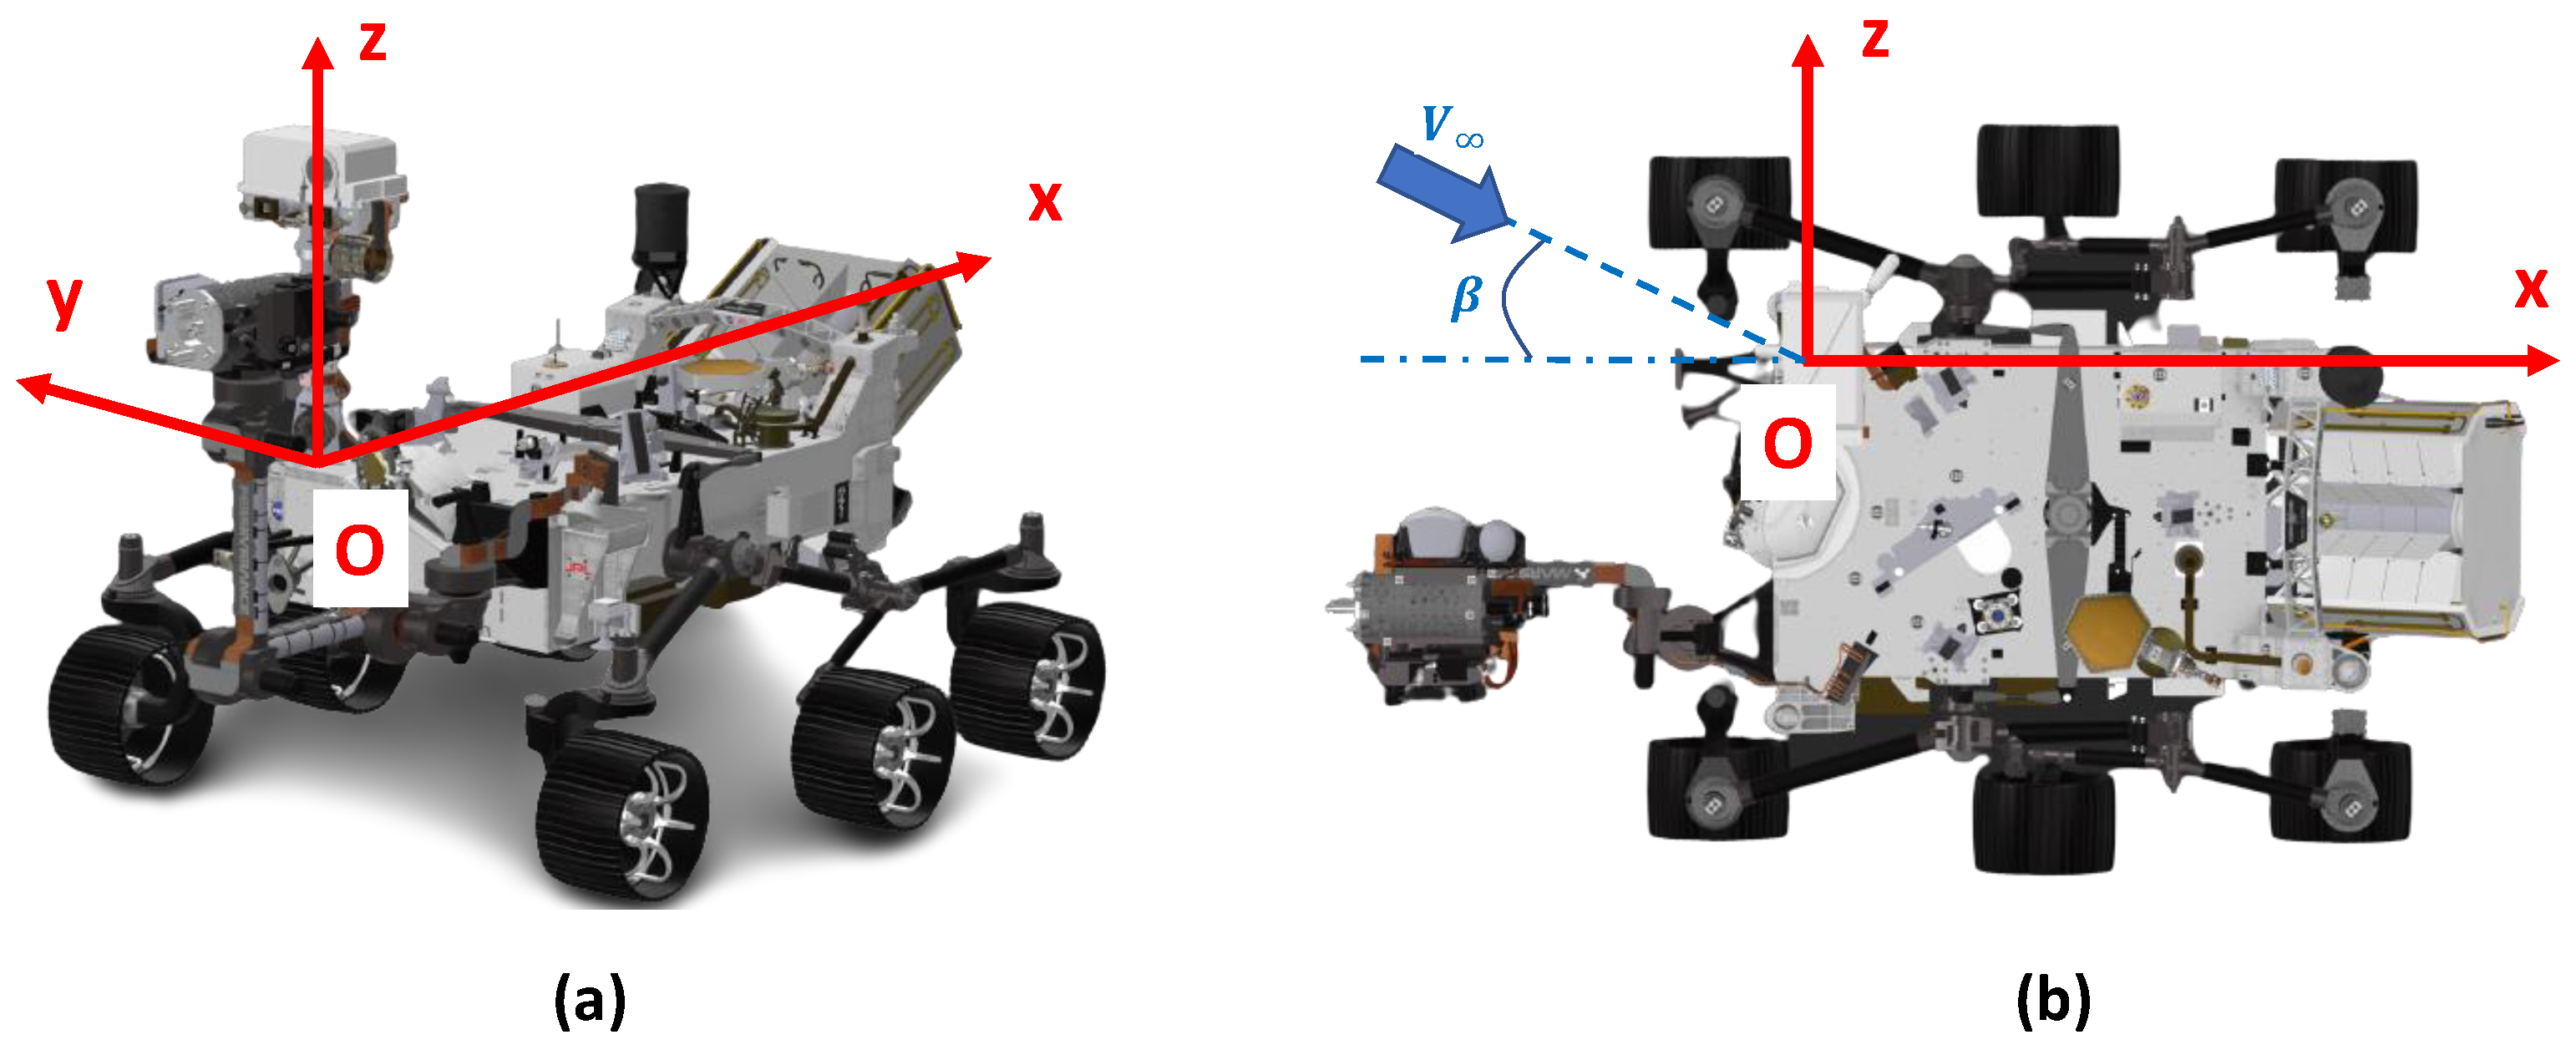
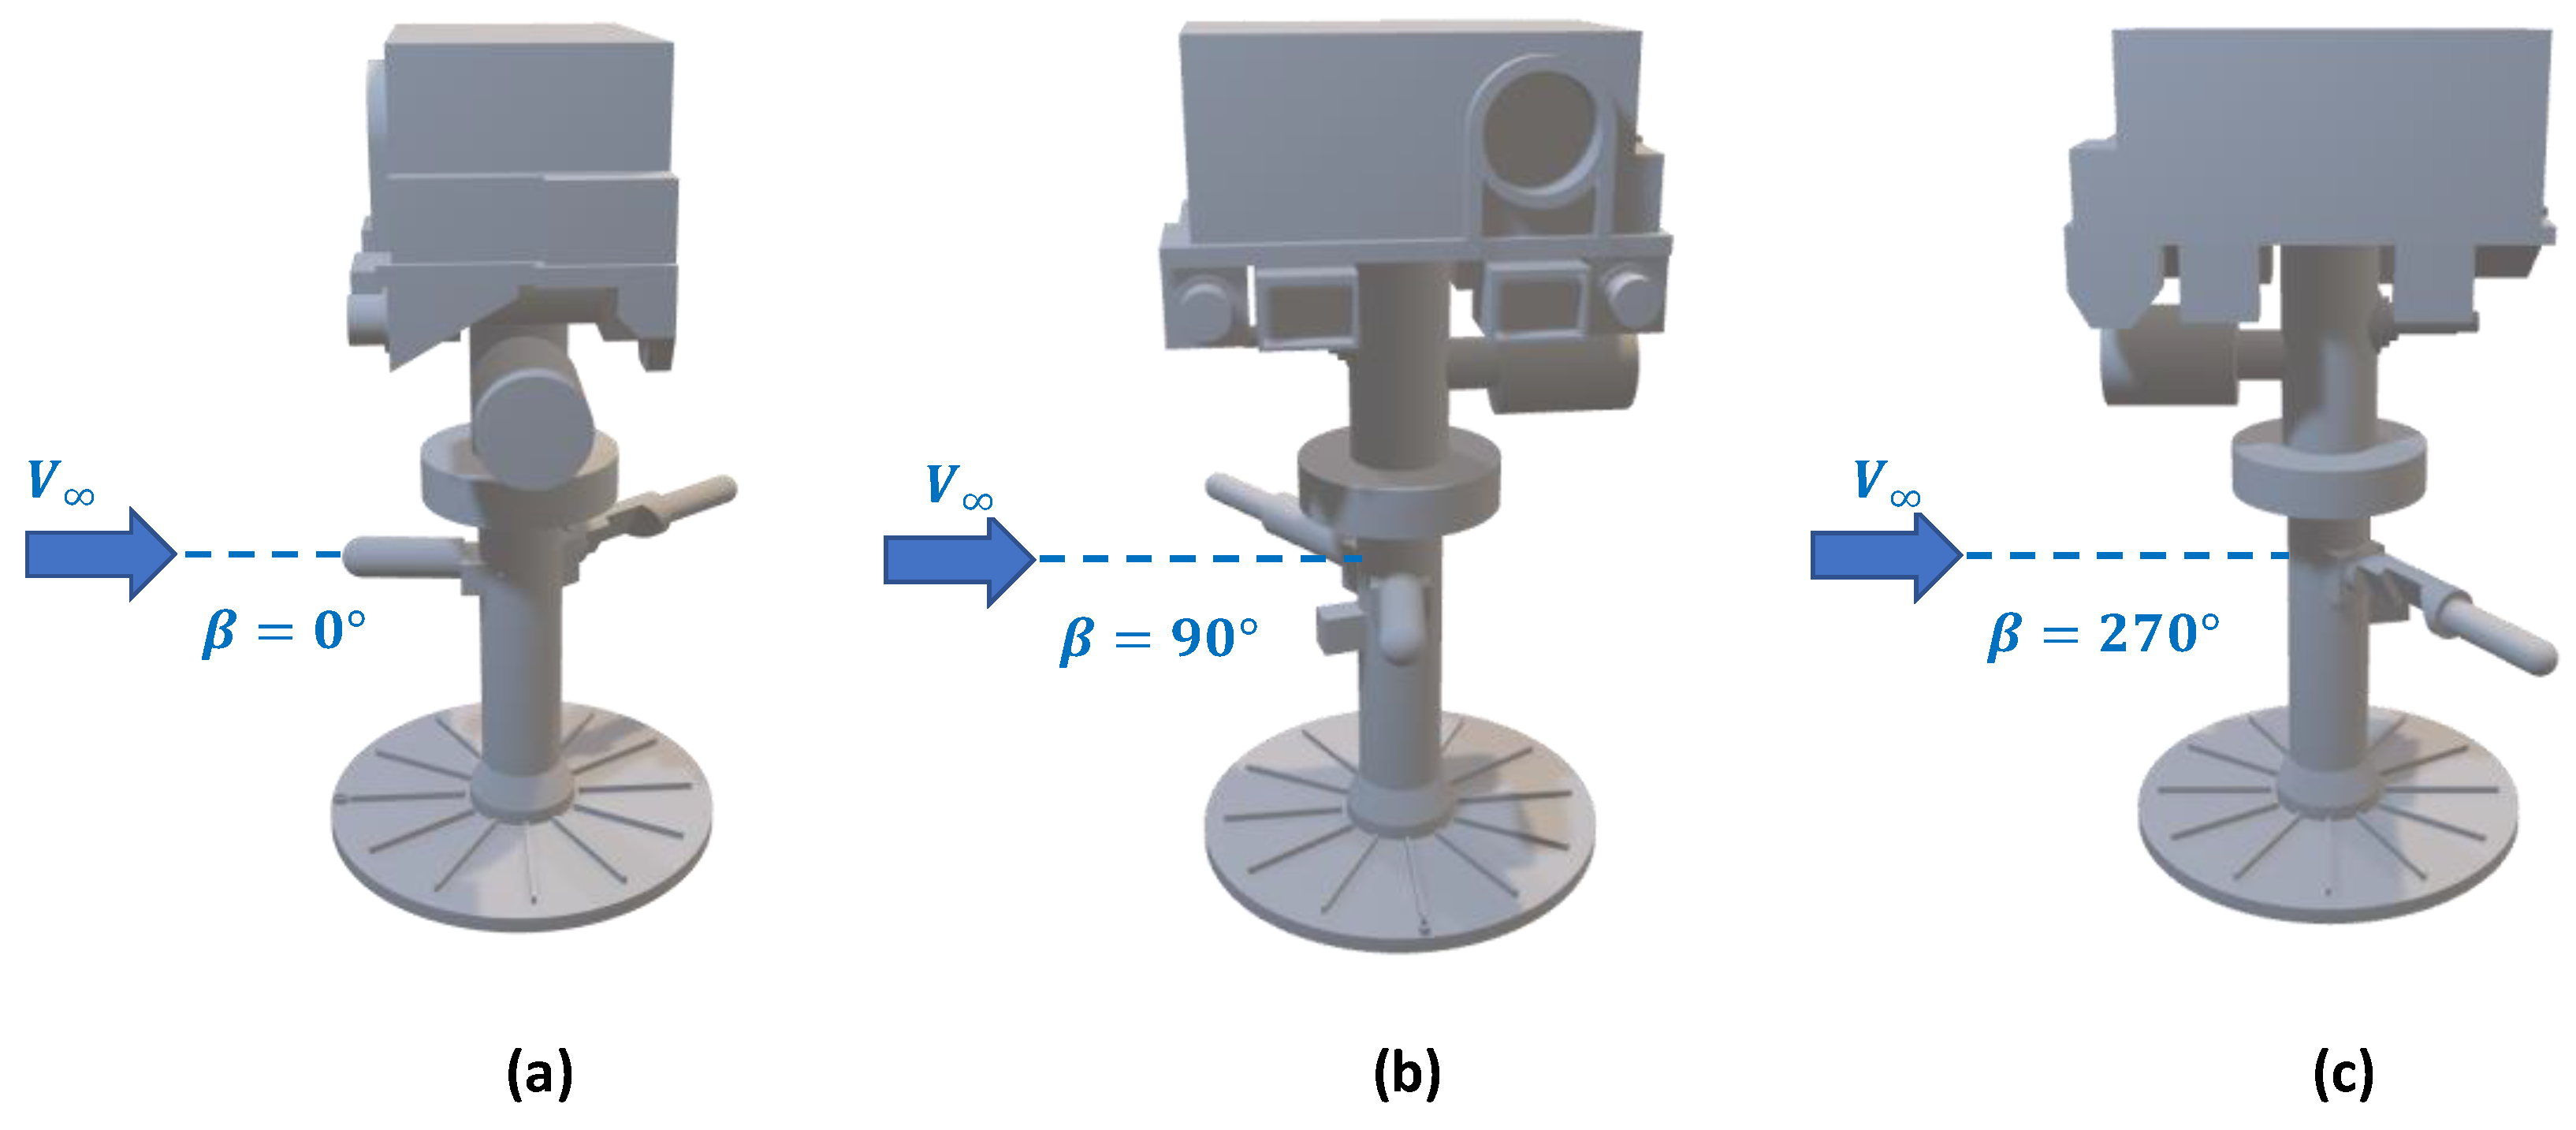
This figure shows that, in addition to the above mentioned, a circular base was designed, so that the entire item could be attached to the hydrodynamic towing tank. That base has segments that are separated by 30 degrees, allowing for a higher precision when testing it. Its function is to simulate the slip angle (that is, the projection of the incident current velocity with the plane OXZ) at which the rover may be. A graphic definition of the slip angle (β), and the axes criteria taken, can be seen in
Figure 3.
At the height where the anemometers are located, 6 holes were designed. They allow the dye to flow downstream to appreciate the behavior in that region. The direction of reference is selected as if the camera was pointing at the negative direction of the X axis (shown in
Figure 3). The tests are performed at slip angles of 60°, 90°, 210°, 240°, 270° and 300°.
Having fully defined the shape of the model, the manufacturing process of the model is introduced. The fused deposition modelling technique (FDM) is the most common form of additive manufacturing. It consists of the fusion of a filament that is subsequently extruded through the nozzle, building the piece layer by layer. Many materials can be used in the process; however, plastics such as PLA (Polylactic acid) or ABS (Acrylonitrile Butadiene Styrene) are frequently utilized. Software plays a key role as it controls the printing process. It must be flexible, trustworthy, standardized, and efficient. To succeed in 3D printing, a proper integration of software, hardware, and materials must be realized. To do so, studies must be carried out to optimize results by changing the different parameters that can be configured.
The 3D printing process begins with a concept and some requisites given to the piece. Then, CAD (Computer-Aided Design) software is used to create a digital model that represents the accurate geometry of the piece (seen in
Figure 2). Afterwards, this file is exported to a CAM (Computer-Aided Manufacturing) program where the printing parameters are set, and the model is laminated in as many layers as needed to reproduce the structure. Finally, manufacturing and most of the post-processing take place. All of these steps have a great influence on each other, so it is essential to take all of them into consideration during the entire manufacturing process to ensure success.
In this case, the outside geometry of the piece is known and scaled to focus only on the area of interest, which is the mast and anemometers of the Mars rover. However, to conduct the experiment, thin channels are designed in the piece so that the ink used to visualize the flow can be carried and ejected through the small holes on the surface of the model. The diameter of these holes and the position of the conducts must be precisely chosen for each 3D printing material and configuration.
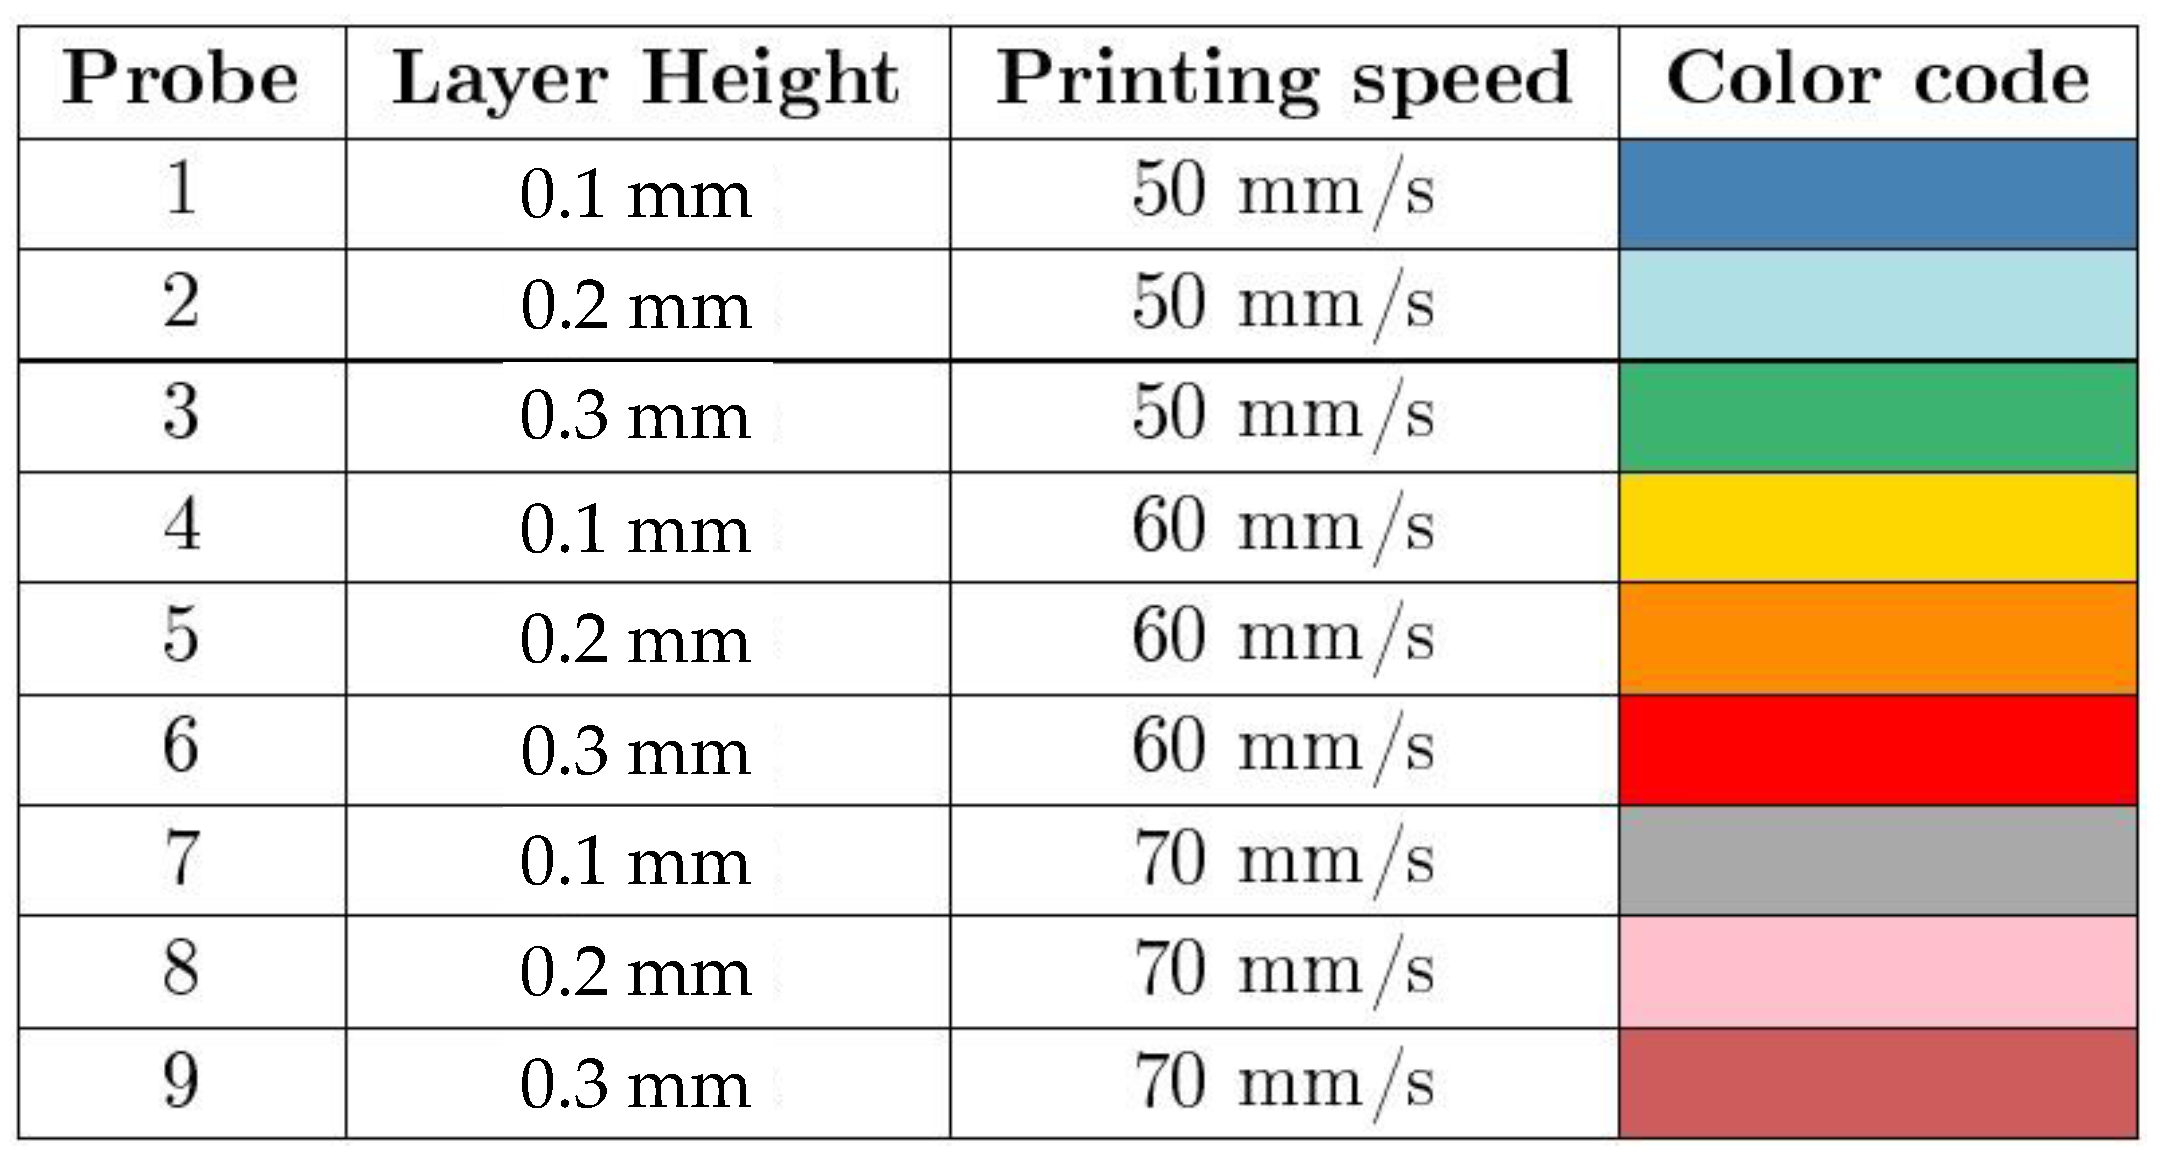
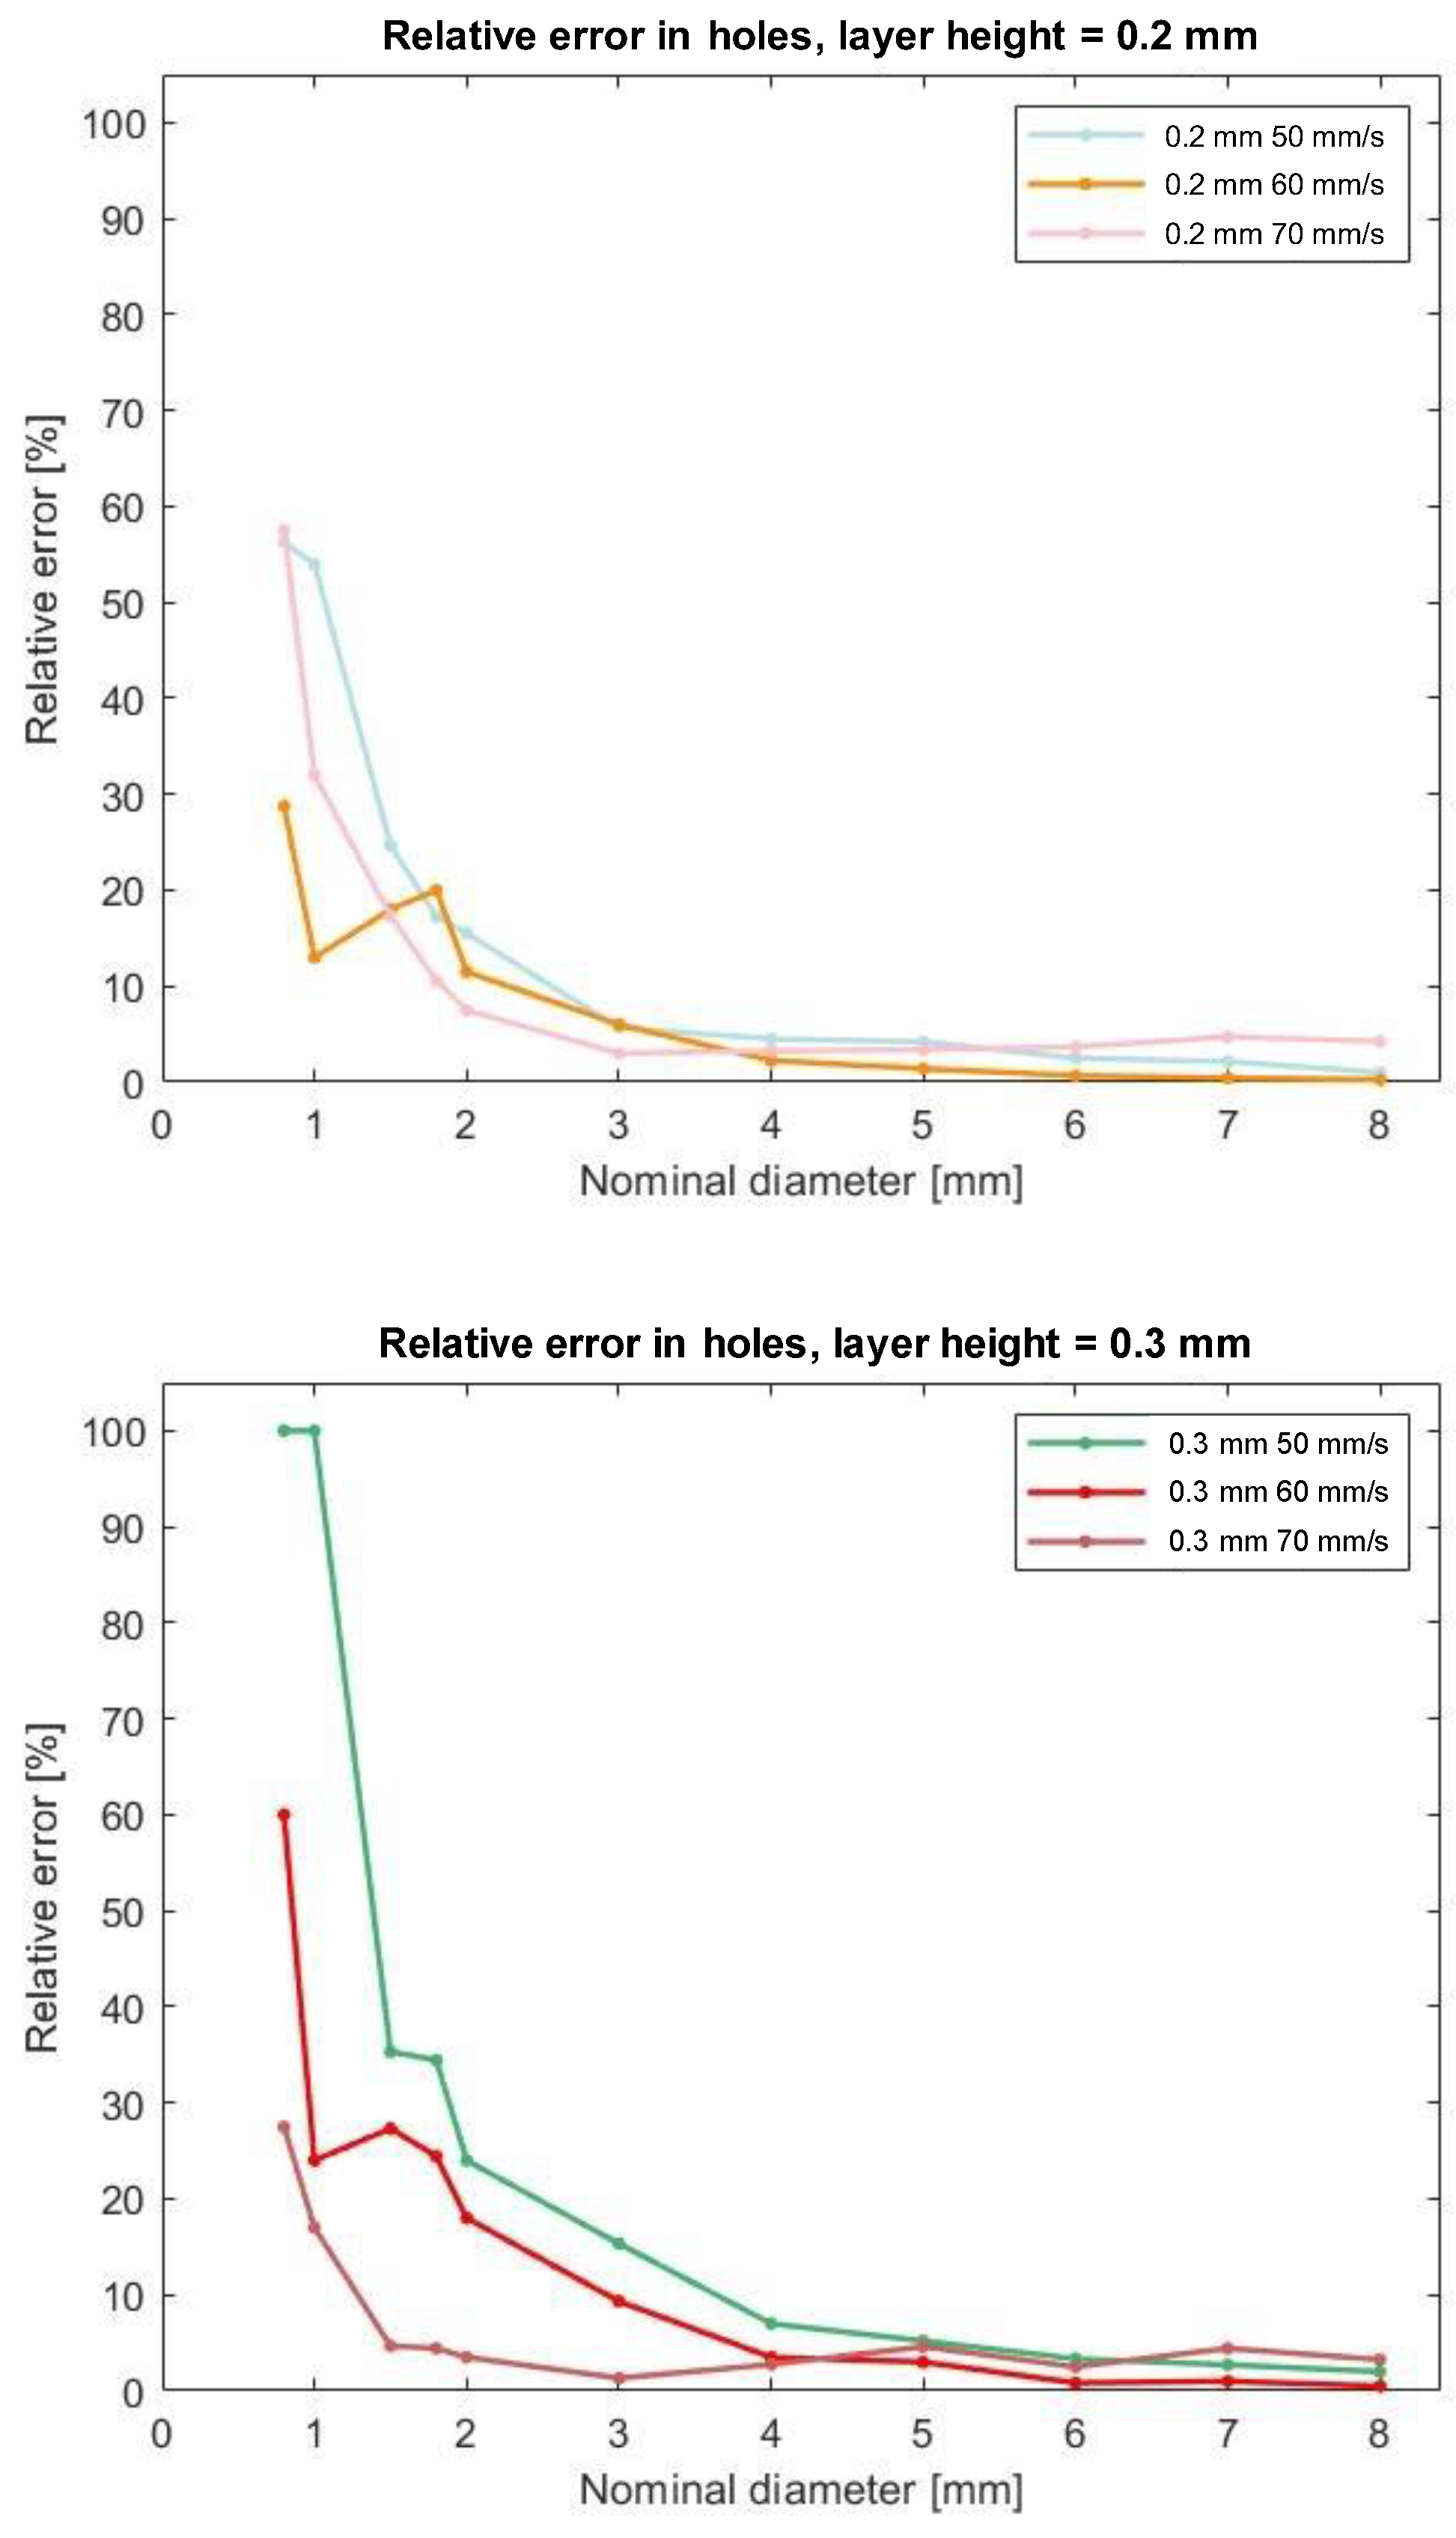
The 3D printing parameters that have a stronger influence on the resulting dimensions of the holes and conducts are the printing speed and layer height. Setting up a higher speed and thicker layer height makes the manufacturing process faster; however, it can also cause a loss in geometric accuracy and surface quality. A calibration probe is designed to compare the different combinations of these two parameters. It consists of a rectangular prism that contains 11 holes whose diameters vary between 8 mm and 0.8 mm. This prism is printed 9 times, for printing speeds of 50, 60 and 70 mm/s and for layer heights of 0.1, 0.2 and 0.3 mm. The color code in calibration probes is detailed in
Figure 4. Then the diameters are measured, and the relative error between the given measures on the CAD file and the real measures obtained is calculated.
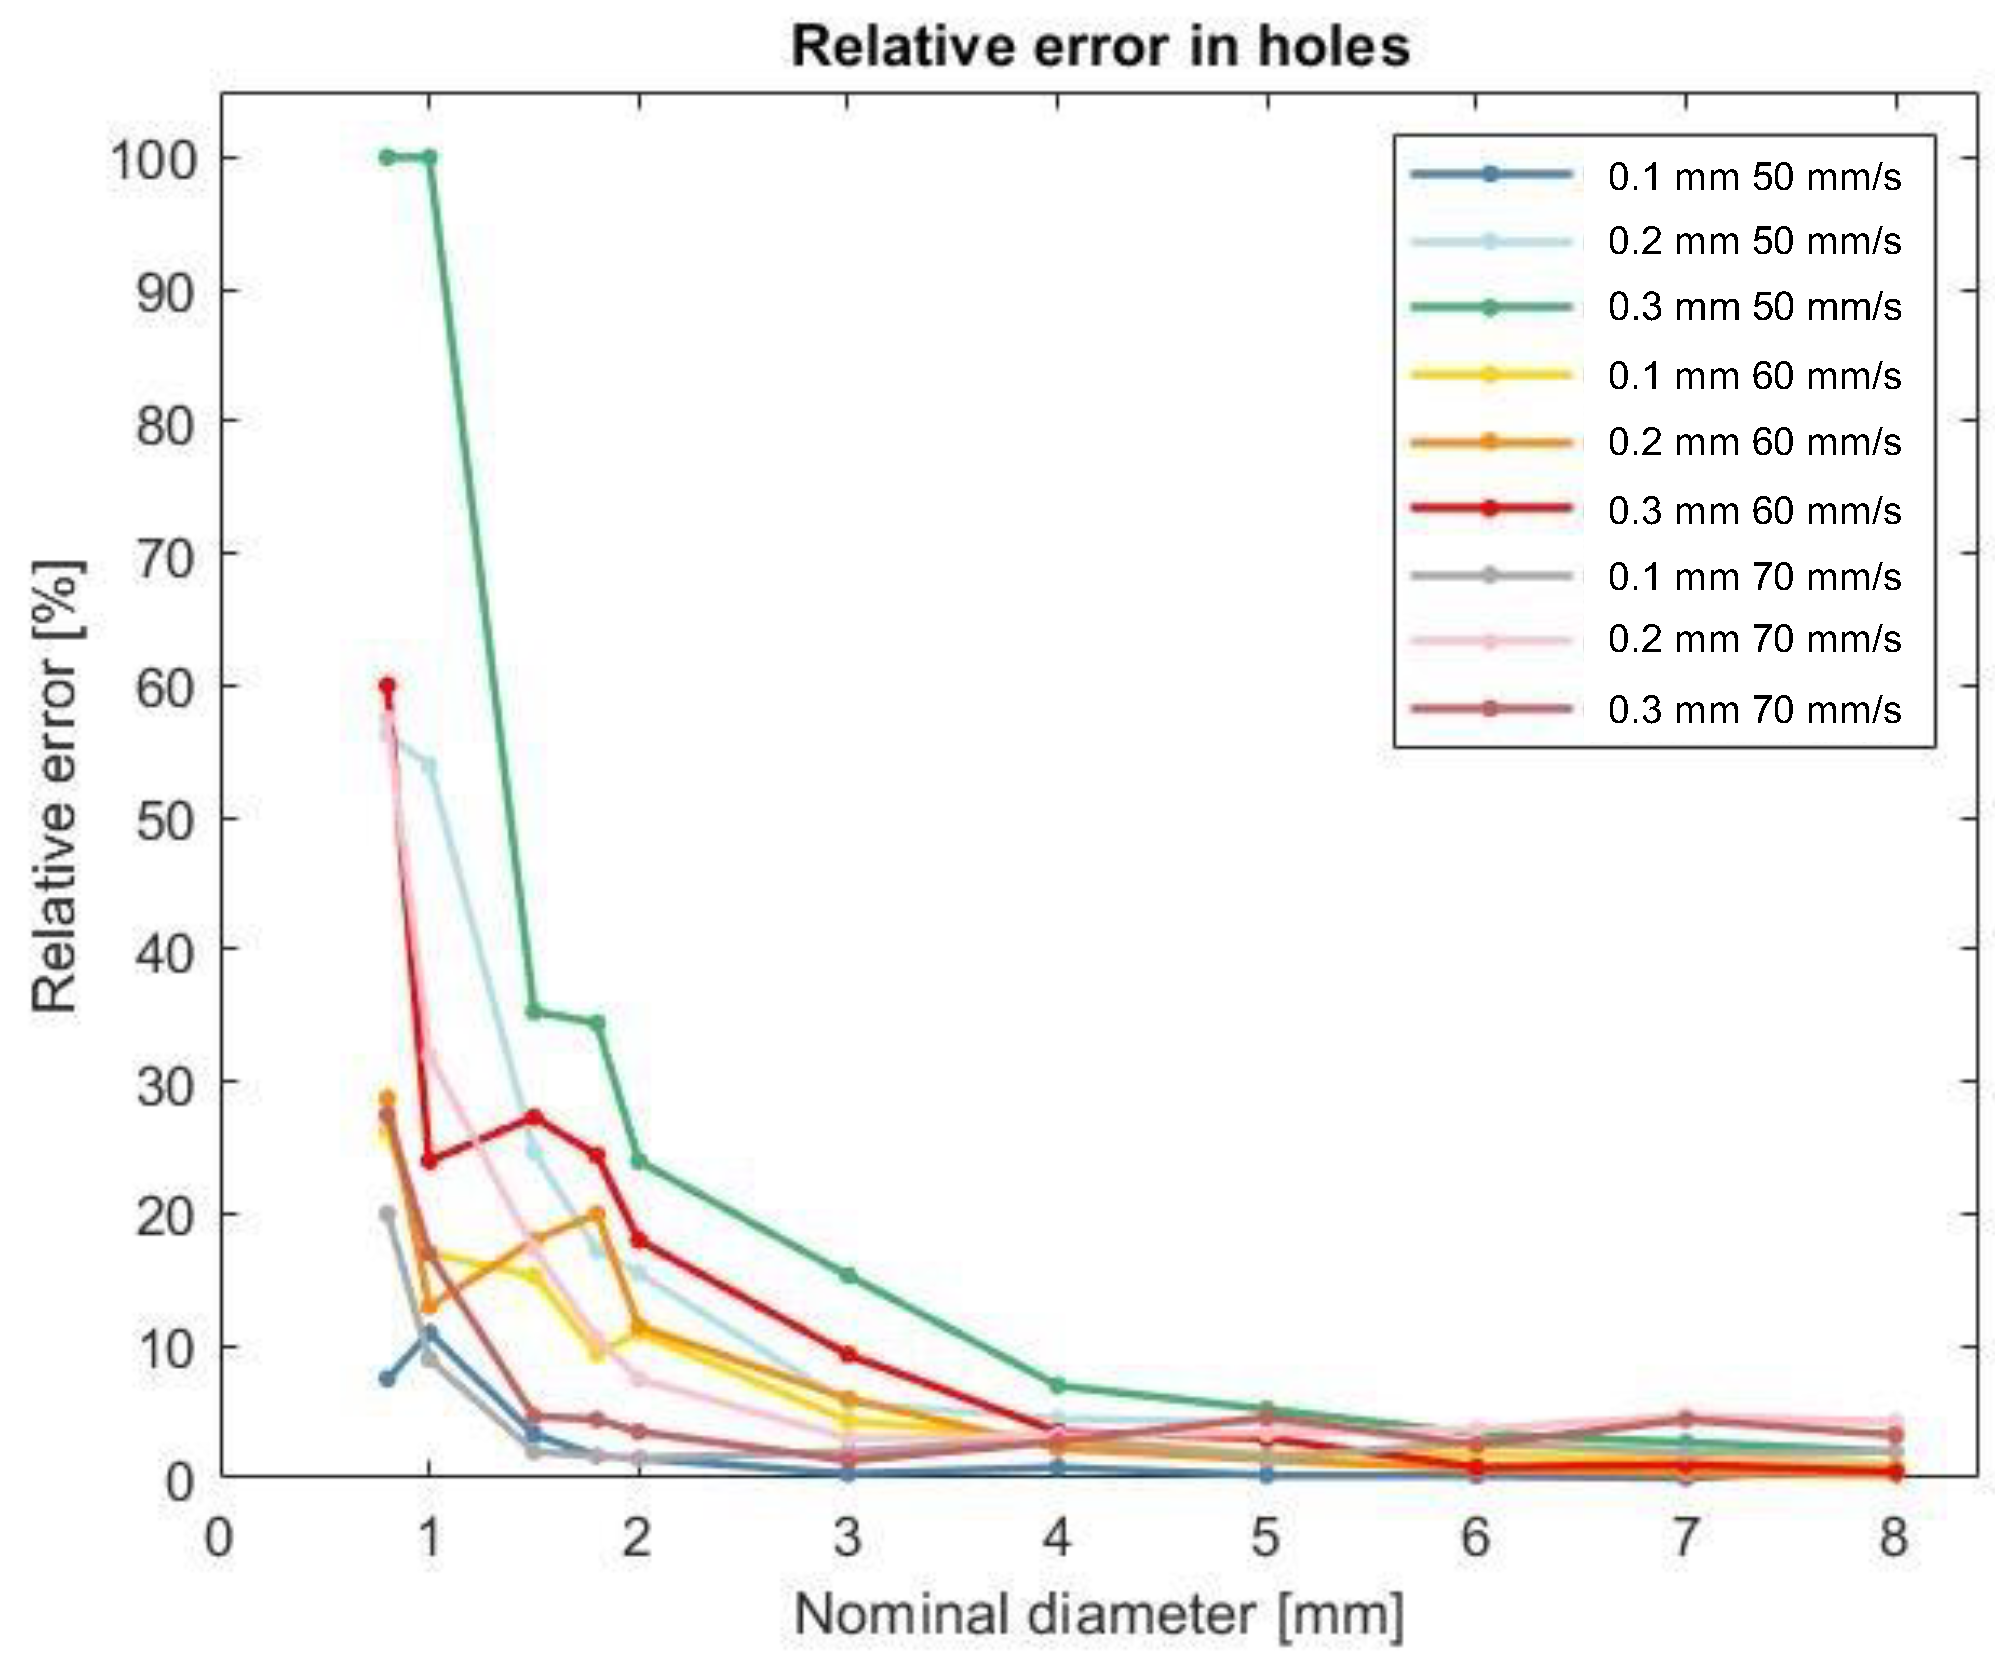
The results obtained show that a thicker layer height and/or a faster printing speed reproduce less accurately the nominal measures given to the model; thus, a slower printing speed and a thinner layer height display the smallest relative error. This can be seen in
Figure 5.
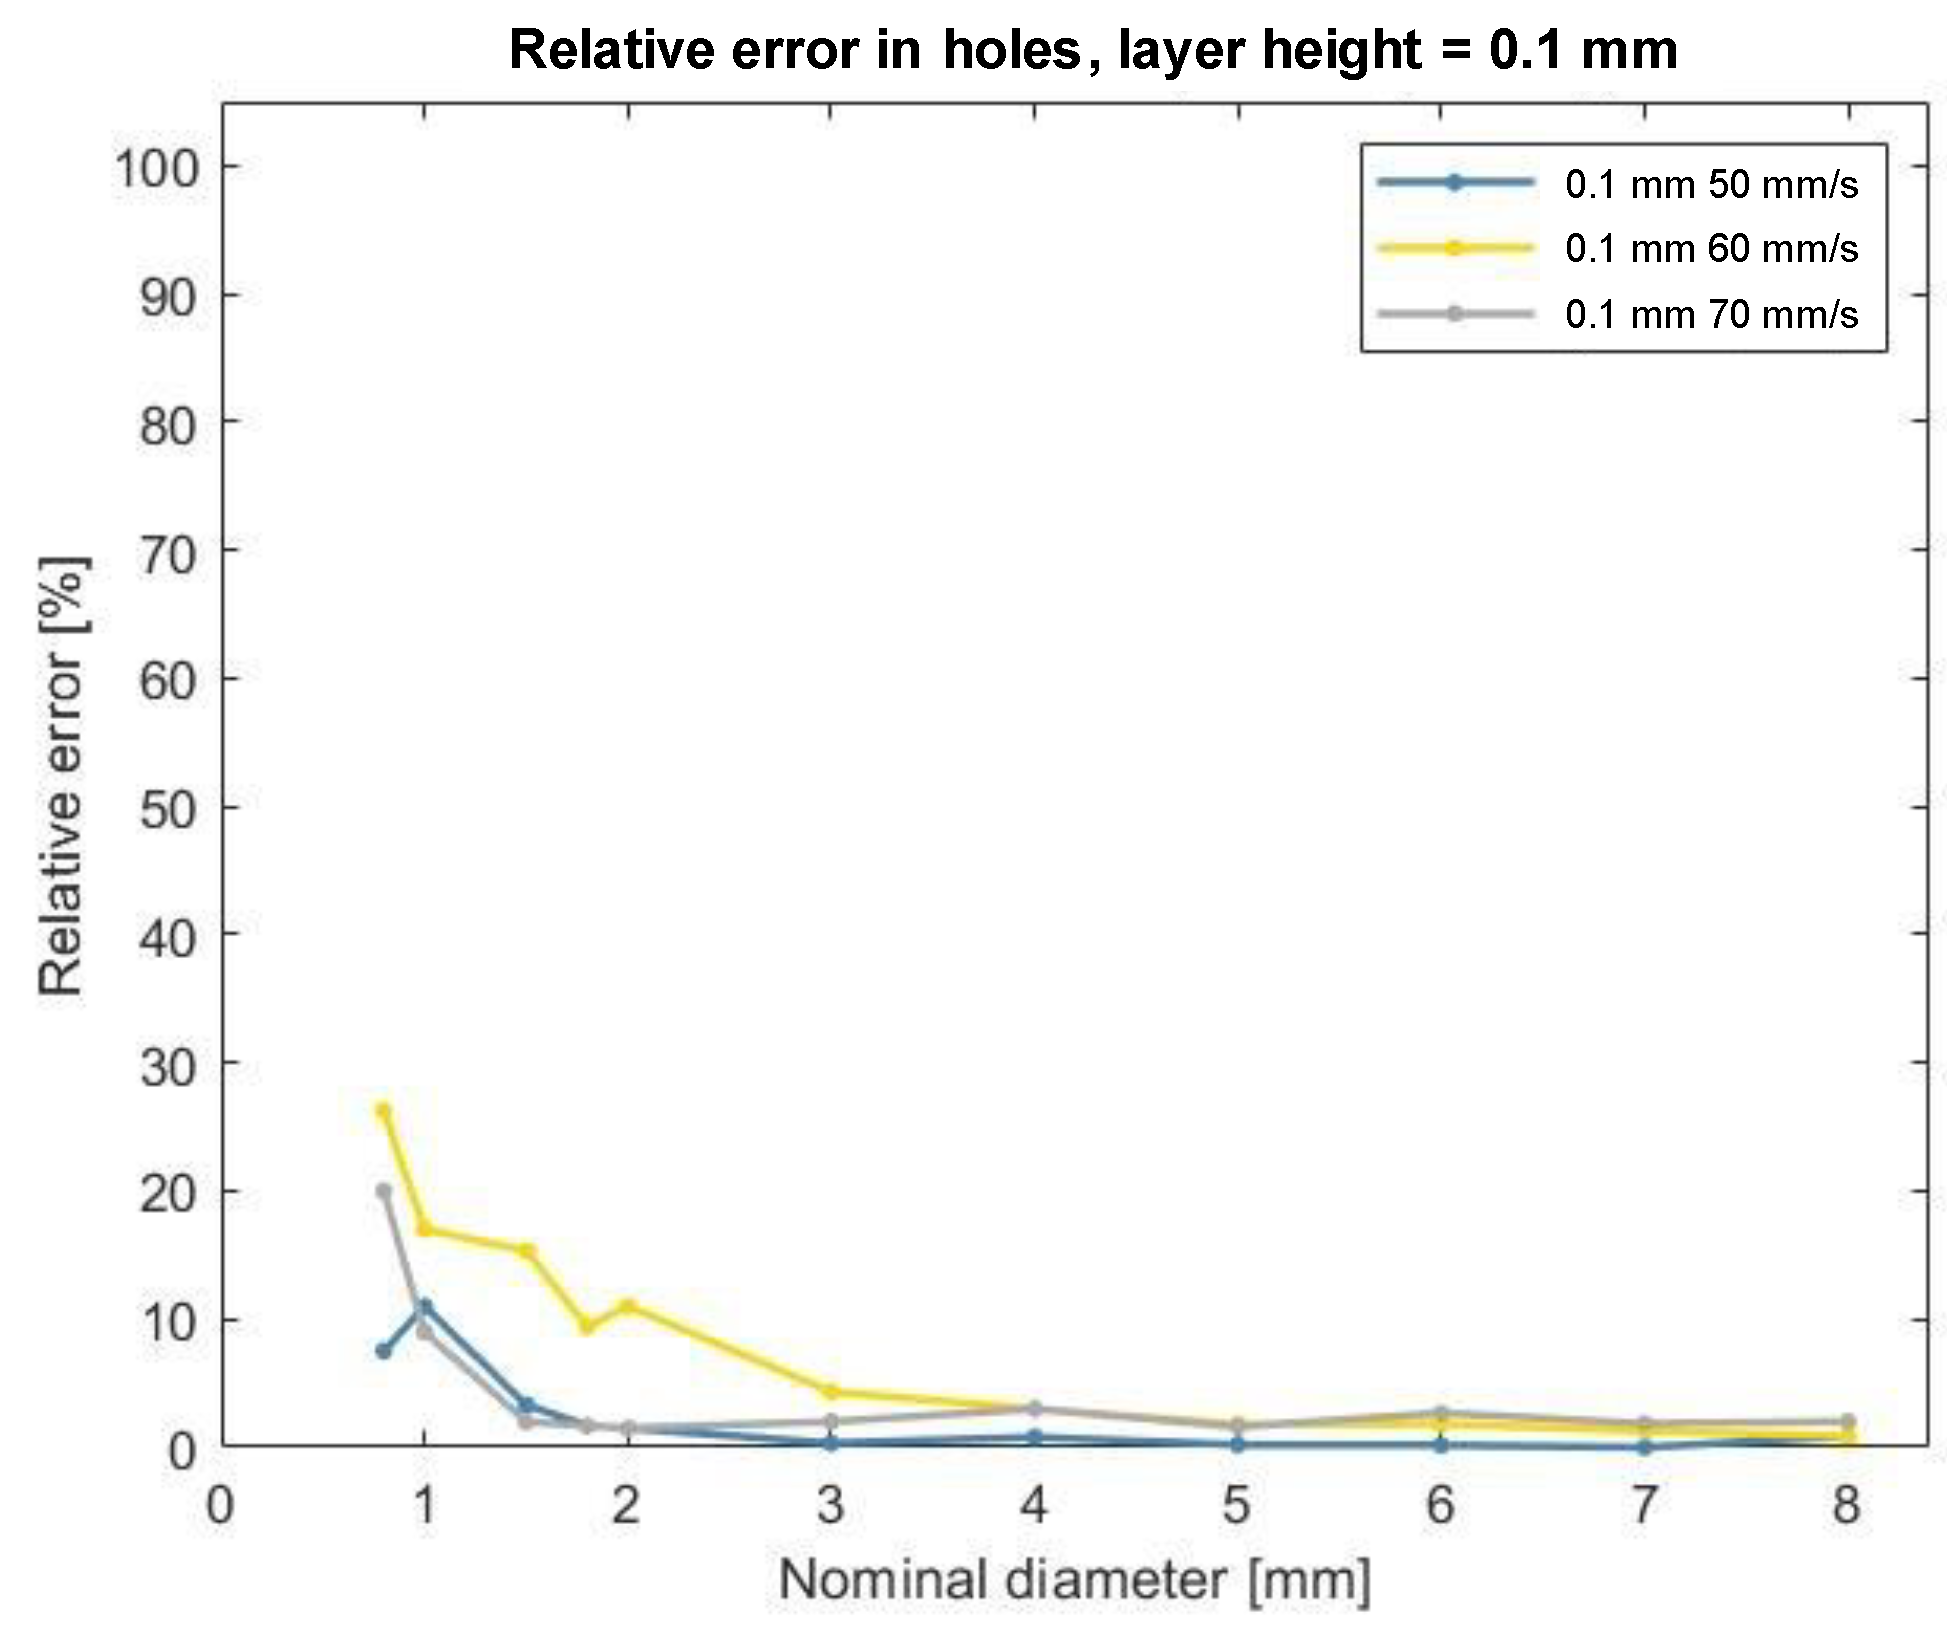
However, an unexpected result has been derived by comparing the relative error using the same layer height and varying the printing speed.
Figure 6 shows how for a small value of the nominal diameter, the relative error will be small for the combinations of parameters (printing speed = 50 mm/s, layer height = 0.1 mm); (printing speed = 60 mm/s, layer height = 0.2 mm); and (printing speed = 70 mm/s, layer height = 0.3 mm). This can be explained by the fact that the amount of extruded material (which depends on the set of layer height set) must be in accordance with the speed at which it is placed on the piece.
These results have been considered when manufacturing the model of the Mars rover Perseverance, and both the printing speed and the layer height have been adapted to ensure an accurate reproduction of the geometry of the piece.
The 3D printer used to manufacture the model is an Ultimaker 3 Extended. In addition, the filament selected was PLA. Due to the height of the mast being greater than the enclosure available for printing, it will be sectioned. These sections have been selected to waste as little support material as possible.
Figure 7 shows the sections of the base and anemometers into which it has been divided and the result once they have been glued. A male–female union between the first two sections has been designed to avoid leaks and blockages, allowing the mixture to flow exclusively through the proper conduit.
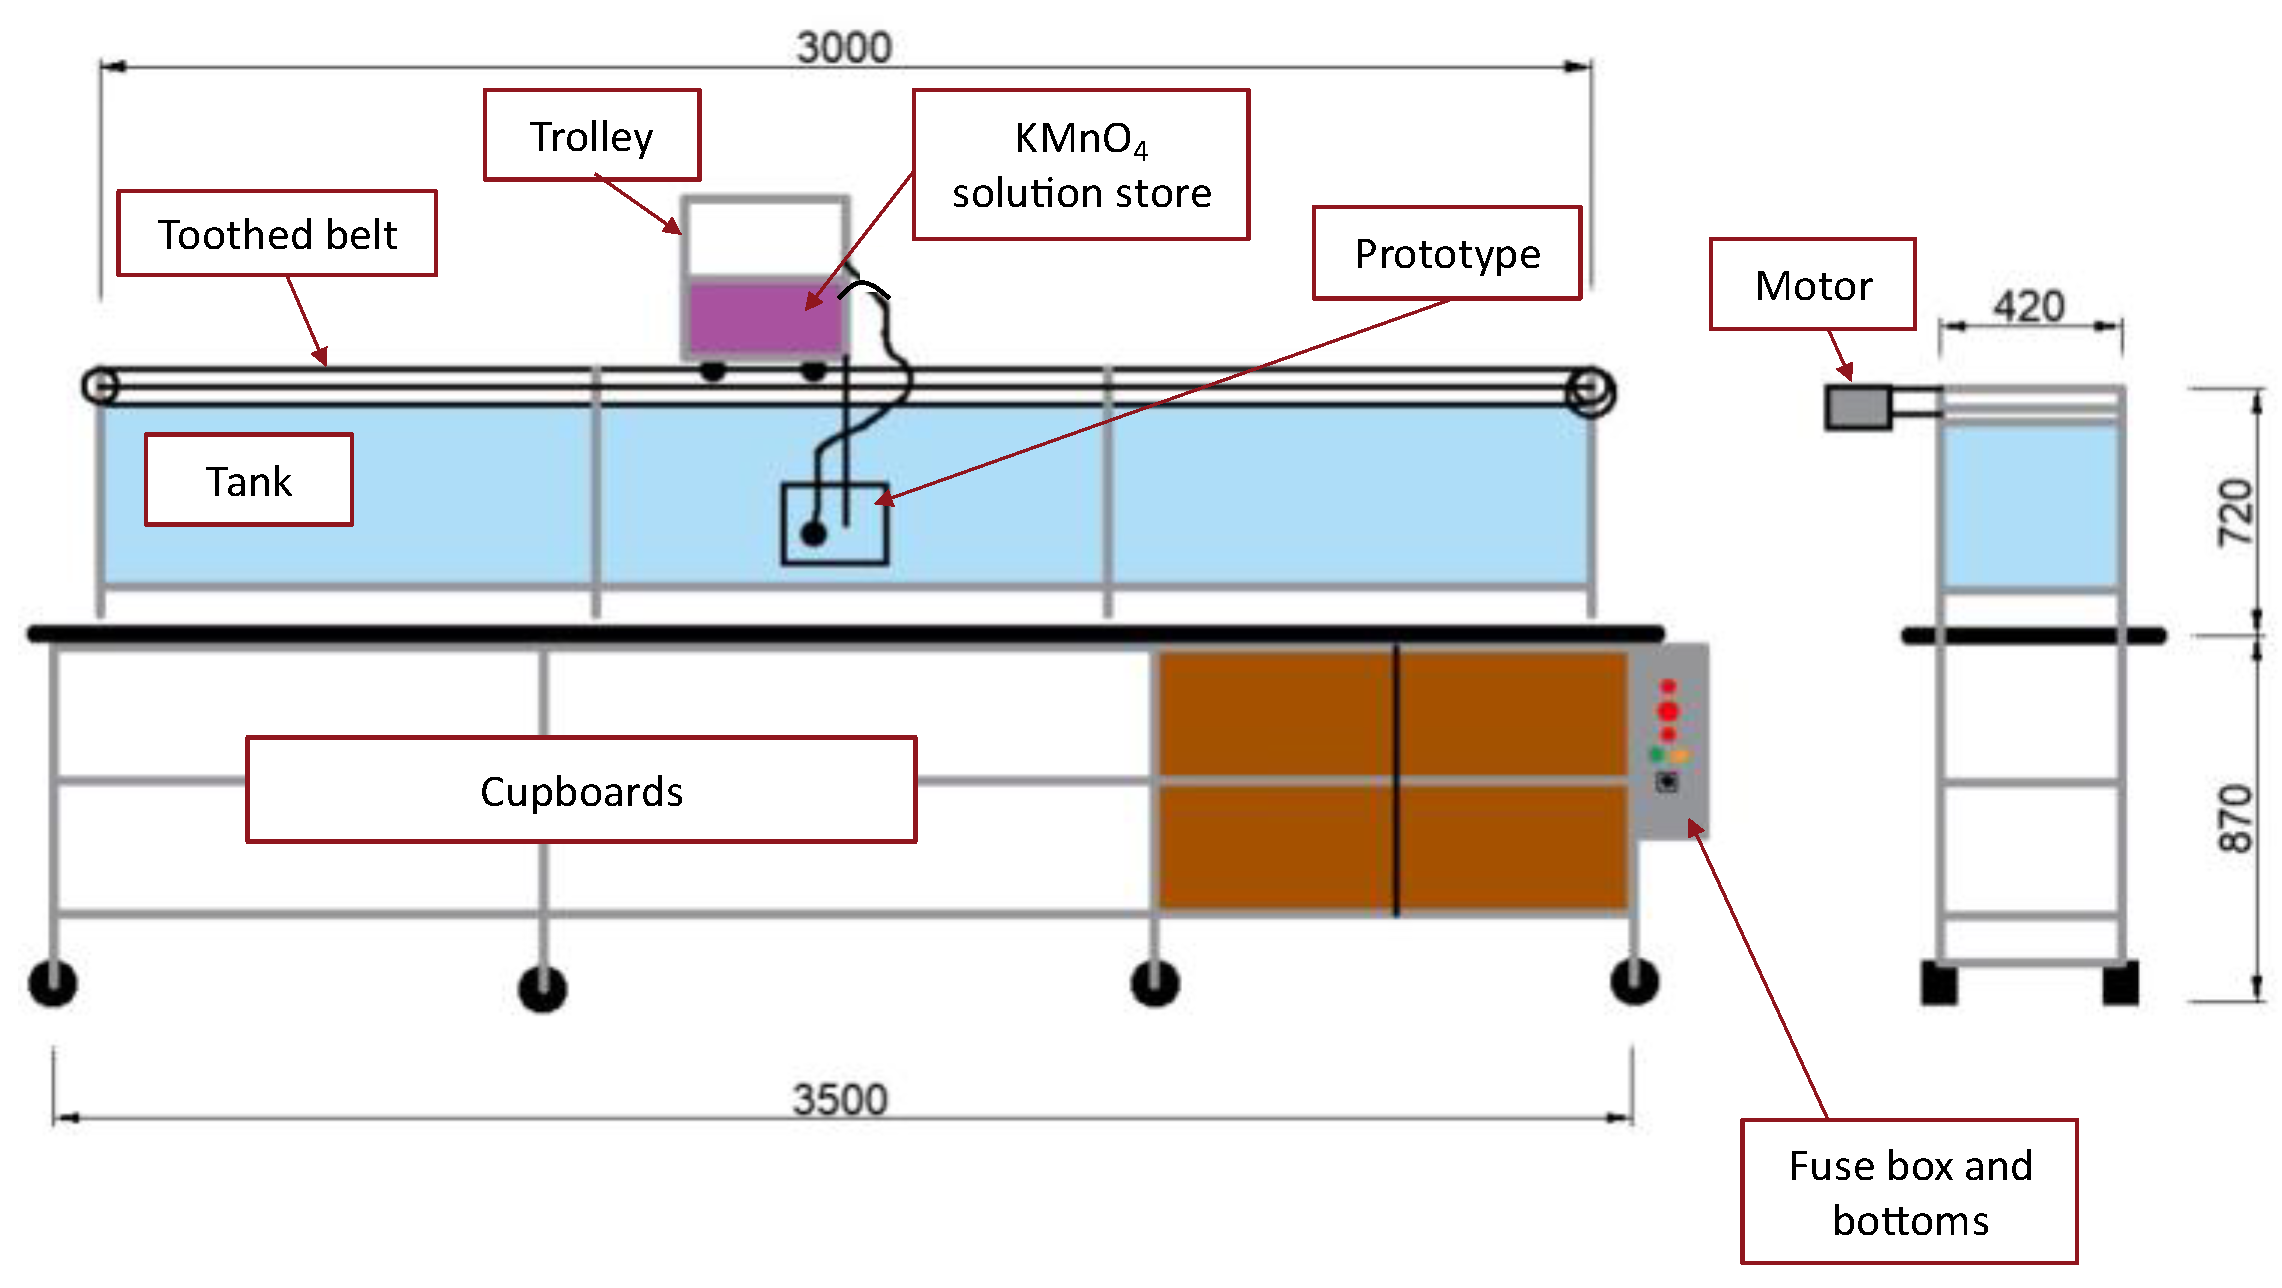
The hydrodynamic towing tank is the element where the test takes place. The channel is a parallelepiped formed by methacrylate panels, the dimensions of which are 3000 mm × 410 mm × 410 mm.
Figure 8 shows a simplified version of the hydrodynamic towing tank [
12].
To appreciate the flow behavior downstream, a dye that can be observed in the water must be selected. The formula will consist of mixing 400 mL of concentrated liquid red dye for each liter of water. This causes the final solution to have approximately the same density as the water. This mixture was placed on the top of the model car, inside a Mariotte flask. The main advantage of the flask is that it ejects the mixture (for a single valve position) at the same pressure regardless of the volume of mixture inside the flask.
The previous mix will exit directly from the mast. Due to the effect the interference of the mast has on the anemometers, there are tests at the slip angles commented before. The aim is to place the mixture outlet orifice as if it were the first point on the mast at which the flow arrives. That allows observation of the two streamlines that arrive at the two anemometers. Because of that, there is only one orifice that ejects the mixture per slip angle.
The way the mixture moves from the Mariotte flask to the model tested is by rubber hoses. Due to the fact that the diameter of the hose in the flask is much larger than in the model, it will be necessary to splice the hoses until the desired diameter is achieved
The car model (including the Mariotte flask and the element to be tested) is moved by an AC engine through the driving belt. The speed of the engine can be selected by modifying the frequency at which it will be rotating. The equation showing the relation between speed and frequency is shown below [
12].
The AC engine can operate at frequencies between 0 Hz and 150 Hz. This parameter is selected in the engine control box. In addition, there are multiple buttons there. These buttons consist of a green button that allows the model car to move forward at the selected frequency, an orange button that makes the model car move backward at the maximum speed (that is, the maximum frequency), a red button that stops the model car from its movement, and an emergency button that shuts down the engine.
To achieve the Reynolds number at which the
Perseverance would be working, the frequency of the AC engine must be determined. Knowing that the fluid in which the experiment is going to take place is water and that the scale of the impressed model is 1:5, the only unknown element is the velocity of the car model.
where the subindex “
E” identifies the experiment in the hydrodynamic towing tank.
Combining Equations (7) and (8), the frequency at which the AC engine must operate can be obtained.
Because the AC engine can only achieve a maximum frequency of 150 Hz, the atmosphere at Mars when the wind speed is maximum cannot be simulated. However, the average wind speed at Mars is between
and
[
24] so, for these cases, the Reynolds number can be achieved. By selecting the mean value of the interval mentioned above, the Re obtained is the following one.
where the sub-subindex “
LS” refers to the fact that the Reynolds number is calculated for low speeds.
Using (8), the new speed at which the AC engine has to work can be obtained.
This value, in terms of frequency, is the one shown below.
The channel capacity is around 500 L, which is filled with a flexible hose. The empty process is done by opening the drain valve. This process may take 30 min, so, to do it more quickly, there is a hydraulic bomb that reduces that time to half.
The mast of the Perseverance will be tested in a horizontal position. This allows the creation of bigger models without changing the results. If it was tested in a vertical position, there could be interactions between the model and the surface of the water, modifying the results downstream.
If the von Karman vortex streets want to be captured, it is necessary to place a camera. For this project, a Sony DSC-QX100 (Sony Europe B.V.) is used. It is placed at the top of the hydrodynamic towing tank, attached to the model car, allowing photographs to be taken from the beginning through to the end of the channel.
The testing procedure is as follows. First, the hydrodynamic towing tank must be filled with water. Then, the model must be screwed to the model car at the desired slip angle. The next step is to connect the Mariotte flask with the desired outlet orifice. After the conduct is purged (that is, making sure that there is no air inside the hose), it is necessary to wait until the water remains calm to simulate a stationary experiment. Then, after the camera is connected to a smartphone and the valve of the flask is opened, the green button is pressed in the engine control box. At this point, the experiment has begun, and it is necessary to take as many photographs as possible. When the model reaches the end of the channel, the flask valve is closed, and the orange button must be pressed to restart the experiment at another slip angle.
4. Conclusions
The aim of this project was to study the interference the mast of the Mars rover
Perseverance has over its anemometers, and to validate the experimental results obtained by INTA (Instituto Nacional de Técnica Aeroespacial) [
16]. Our study has focused on
and
because we try to validate our method with the scientific results of other colleagues. Furthermore, we cannot test
due to the strong interference of the MMRTG (Multi-Mission Radioisotope Thermoelectric Generator).
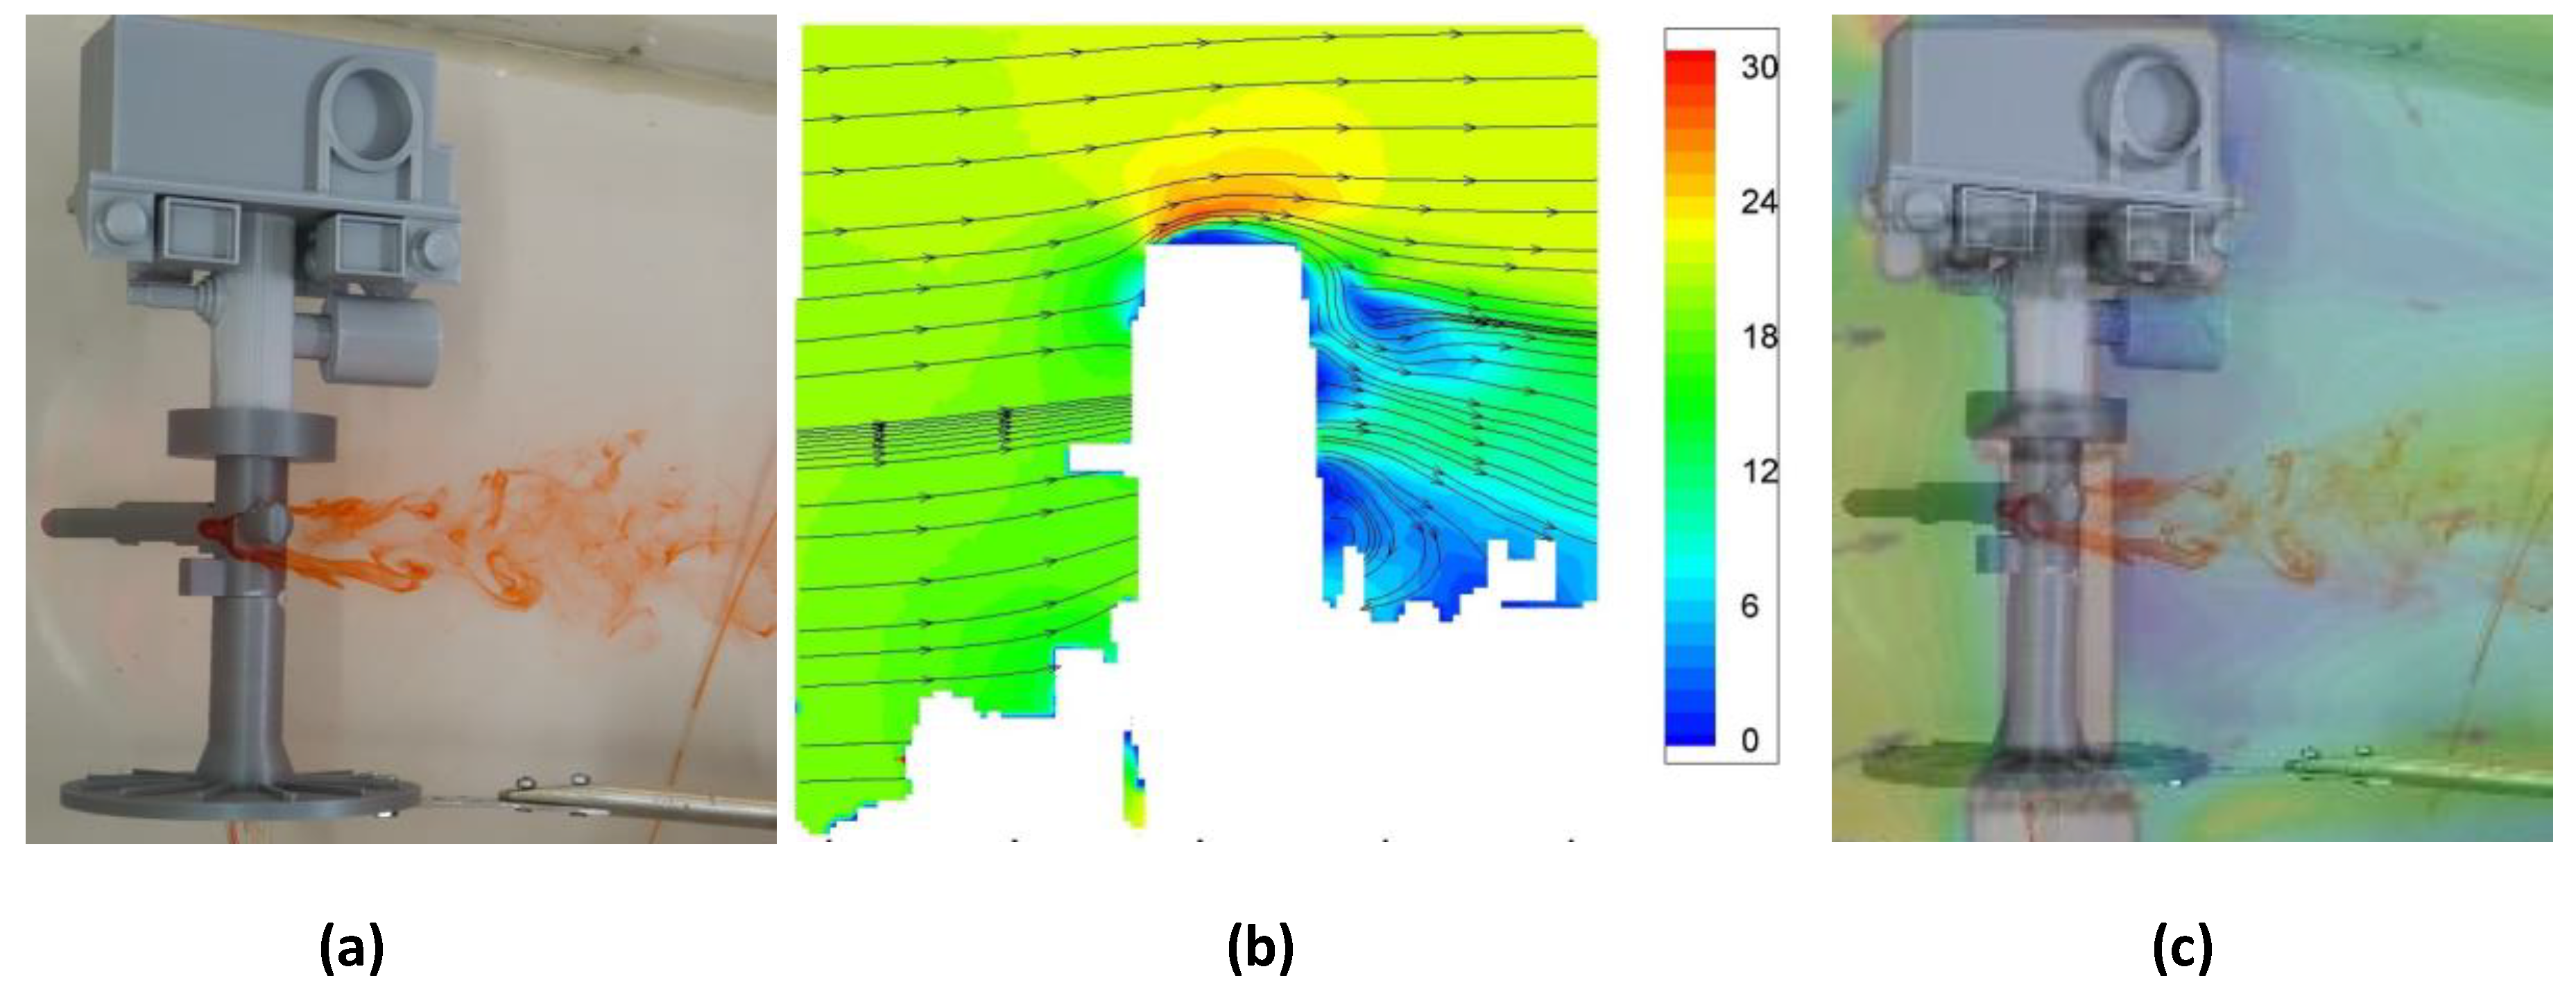
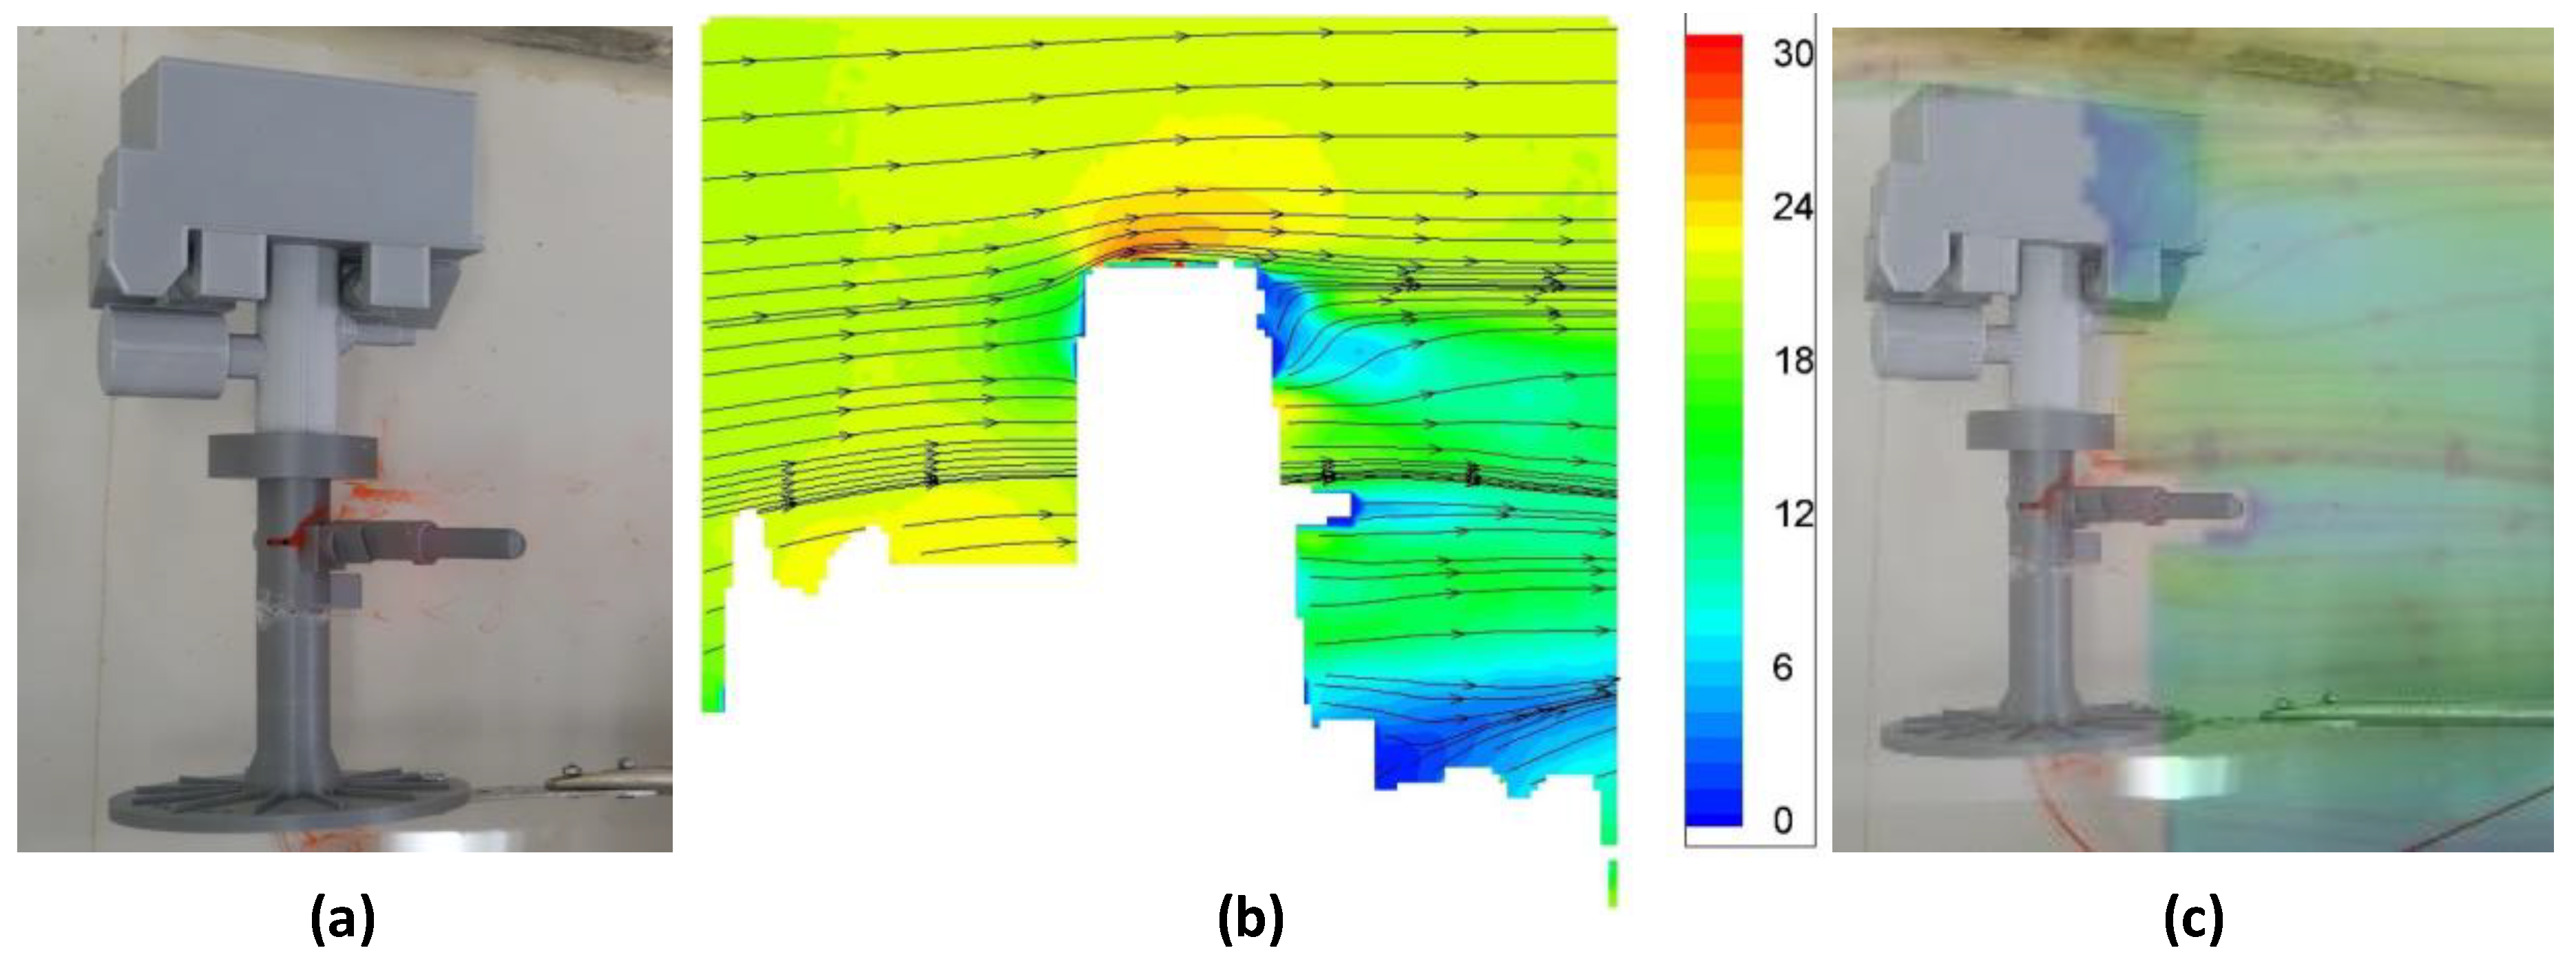
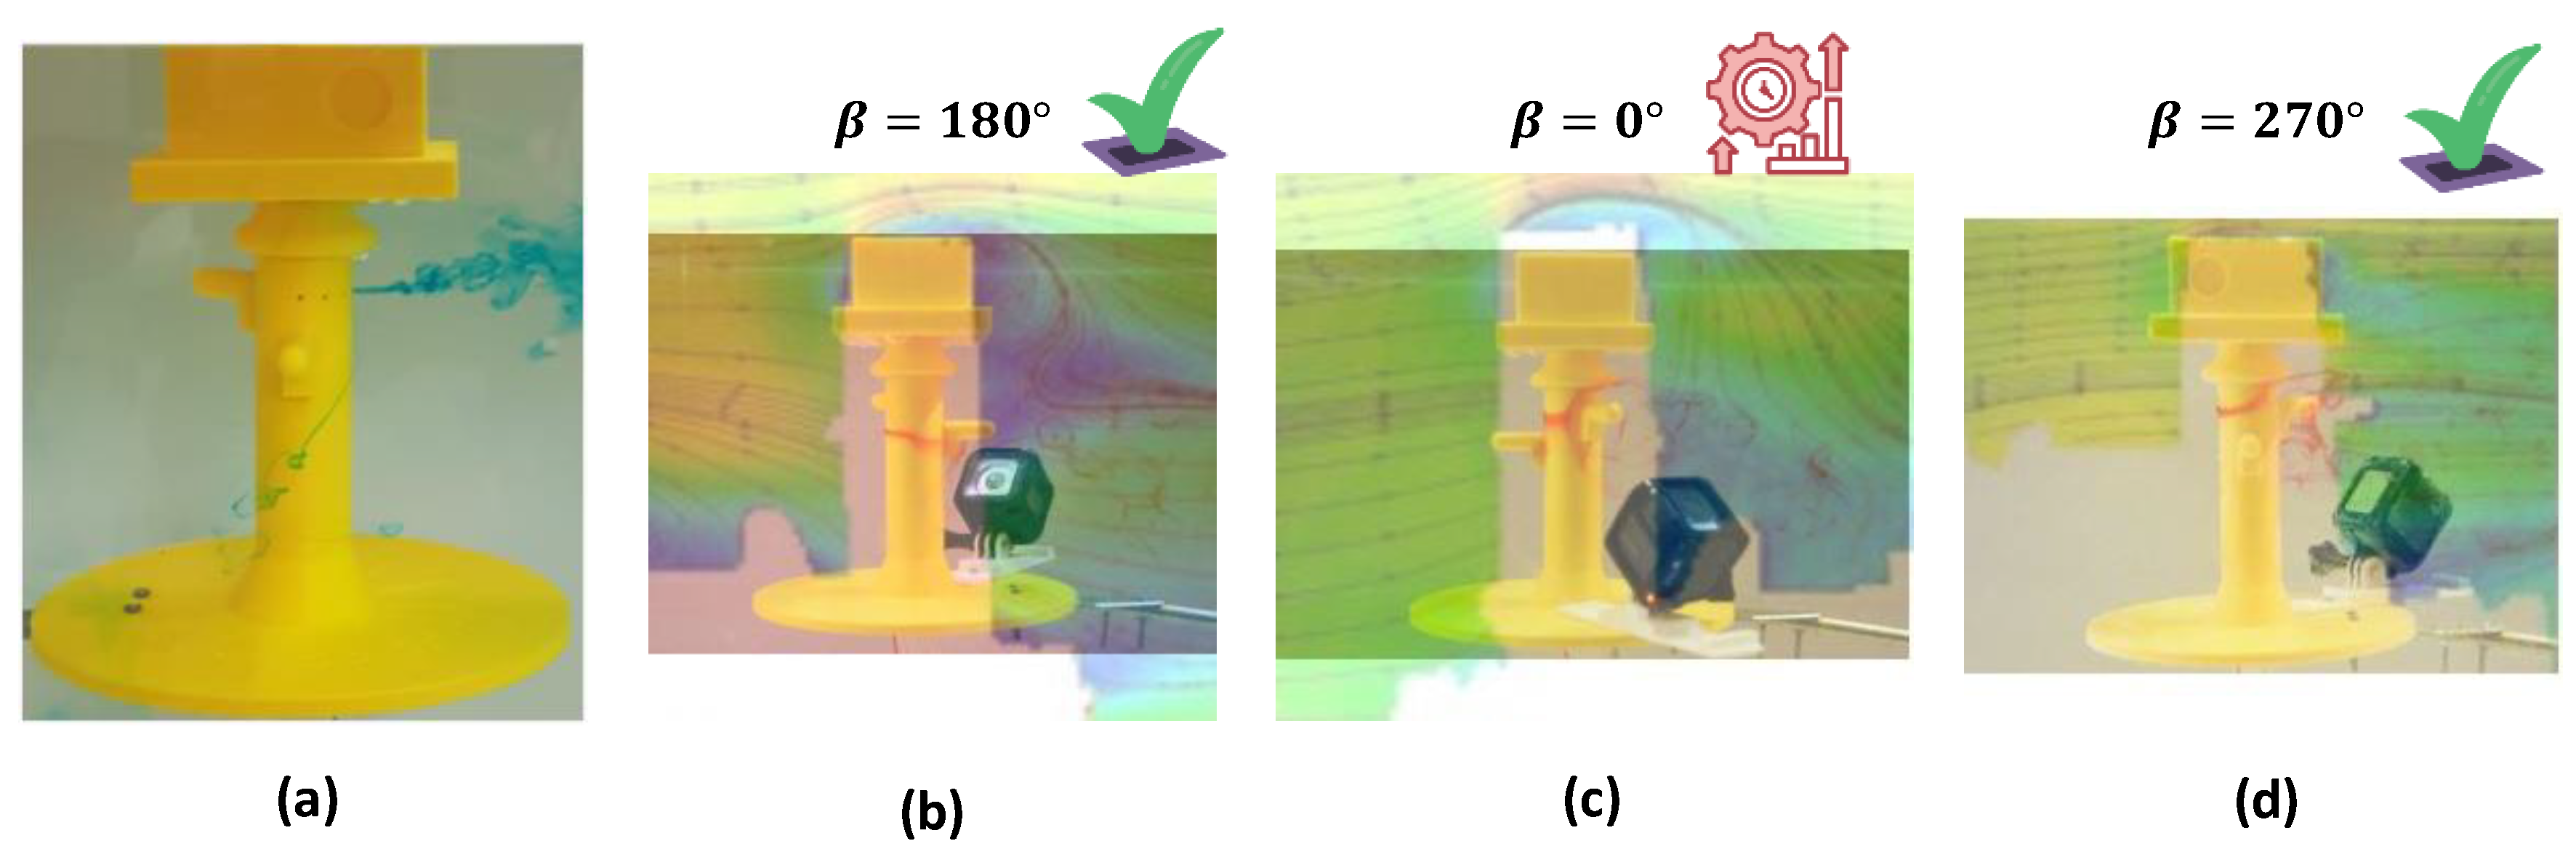
This research has compared the results (the streamlines) of our flow visualization facility around the Mars rover with other experimental and computational techniques that are carried out in the industry, proving the validity of this method. These other industrial techniques would therefore not lead to the same results, but nonetheless required much more expensive equipment. A comparative study is carried out analyzing the deviation of the streamlines above these bluff bodies. Moreover, the technique allows us to analyze not only the deviation but also the size of the separation bubble and the wake behind any bodies.
The importance of knowing the flow behavior lies in the study of the interference effect between the Rover head mast and the booms installed in the mast, because these booms include the sensors that will take the atmospheric data of Mars. This interference analysis is essential to determine the flow behavior of the wind around MEDA (Mars Environmental Dynamics Analyzer); that is, if the interference caused by the mast were not considered, the data sent would be wrong. It is necessary to quantify the deviation of the results through tests to apply an adequate correction to the data collected.
According to [
13,
18,
24] we have assumed the main parameters characterizing the climate and atmosphere for Mars and Earth, due to modelling but also due to recent missions and in situ observations. It is true that our model is a simplified study, and we are not capable of distinguishing some complex Martian flows, such as dust devil vortices. The main objective of our research is not that, but to offer a proper procedure to analyze the impact of the rover mast on its anemometers and its influence based on our flow visualization technique.
The main conclusion drawn is that the experimental results received in the hydrodynamic towing tank are very similar to those in the wind tunnel [
16]. We have observed in our results, and according to [
16], two types of flow regions around the mast and the booms. Two regions separated by upstream and downstream of the mast. Around the booms, the mast generates a strong influence, a strong and massive region of perturbated flow and, generally, a detached flow. This shows that, in preliminary studies, this method is an option to be considered, since its associated cost is cheaper than, for example, testing in a wind tunnel.
Therefore, in this paper we did not focus on studying how much the data (streamlines or speed velocity) are modified due to the interference of mast booms, but on demonstrating that the flow visualization technique is an appropriate technique to carry out flow correction analysis due to this mast boom interference. In addition, the installation of the hydrodynamic towing tank is simpler than that of a wind tunnel (when talking about its materials and the space it occupies).

 ,
, 