
Sustainability, Eco-Point and Engineering Performance of Different Workability OPC Fly-Ash Mortar Mixes


Abstract
:1. Introduction
2. Experimental Program
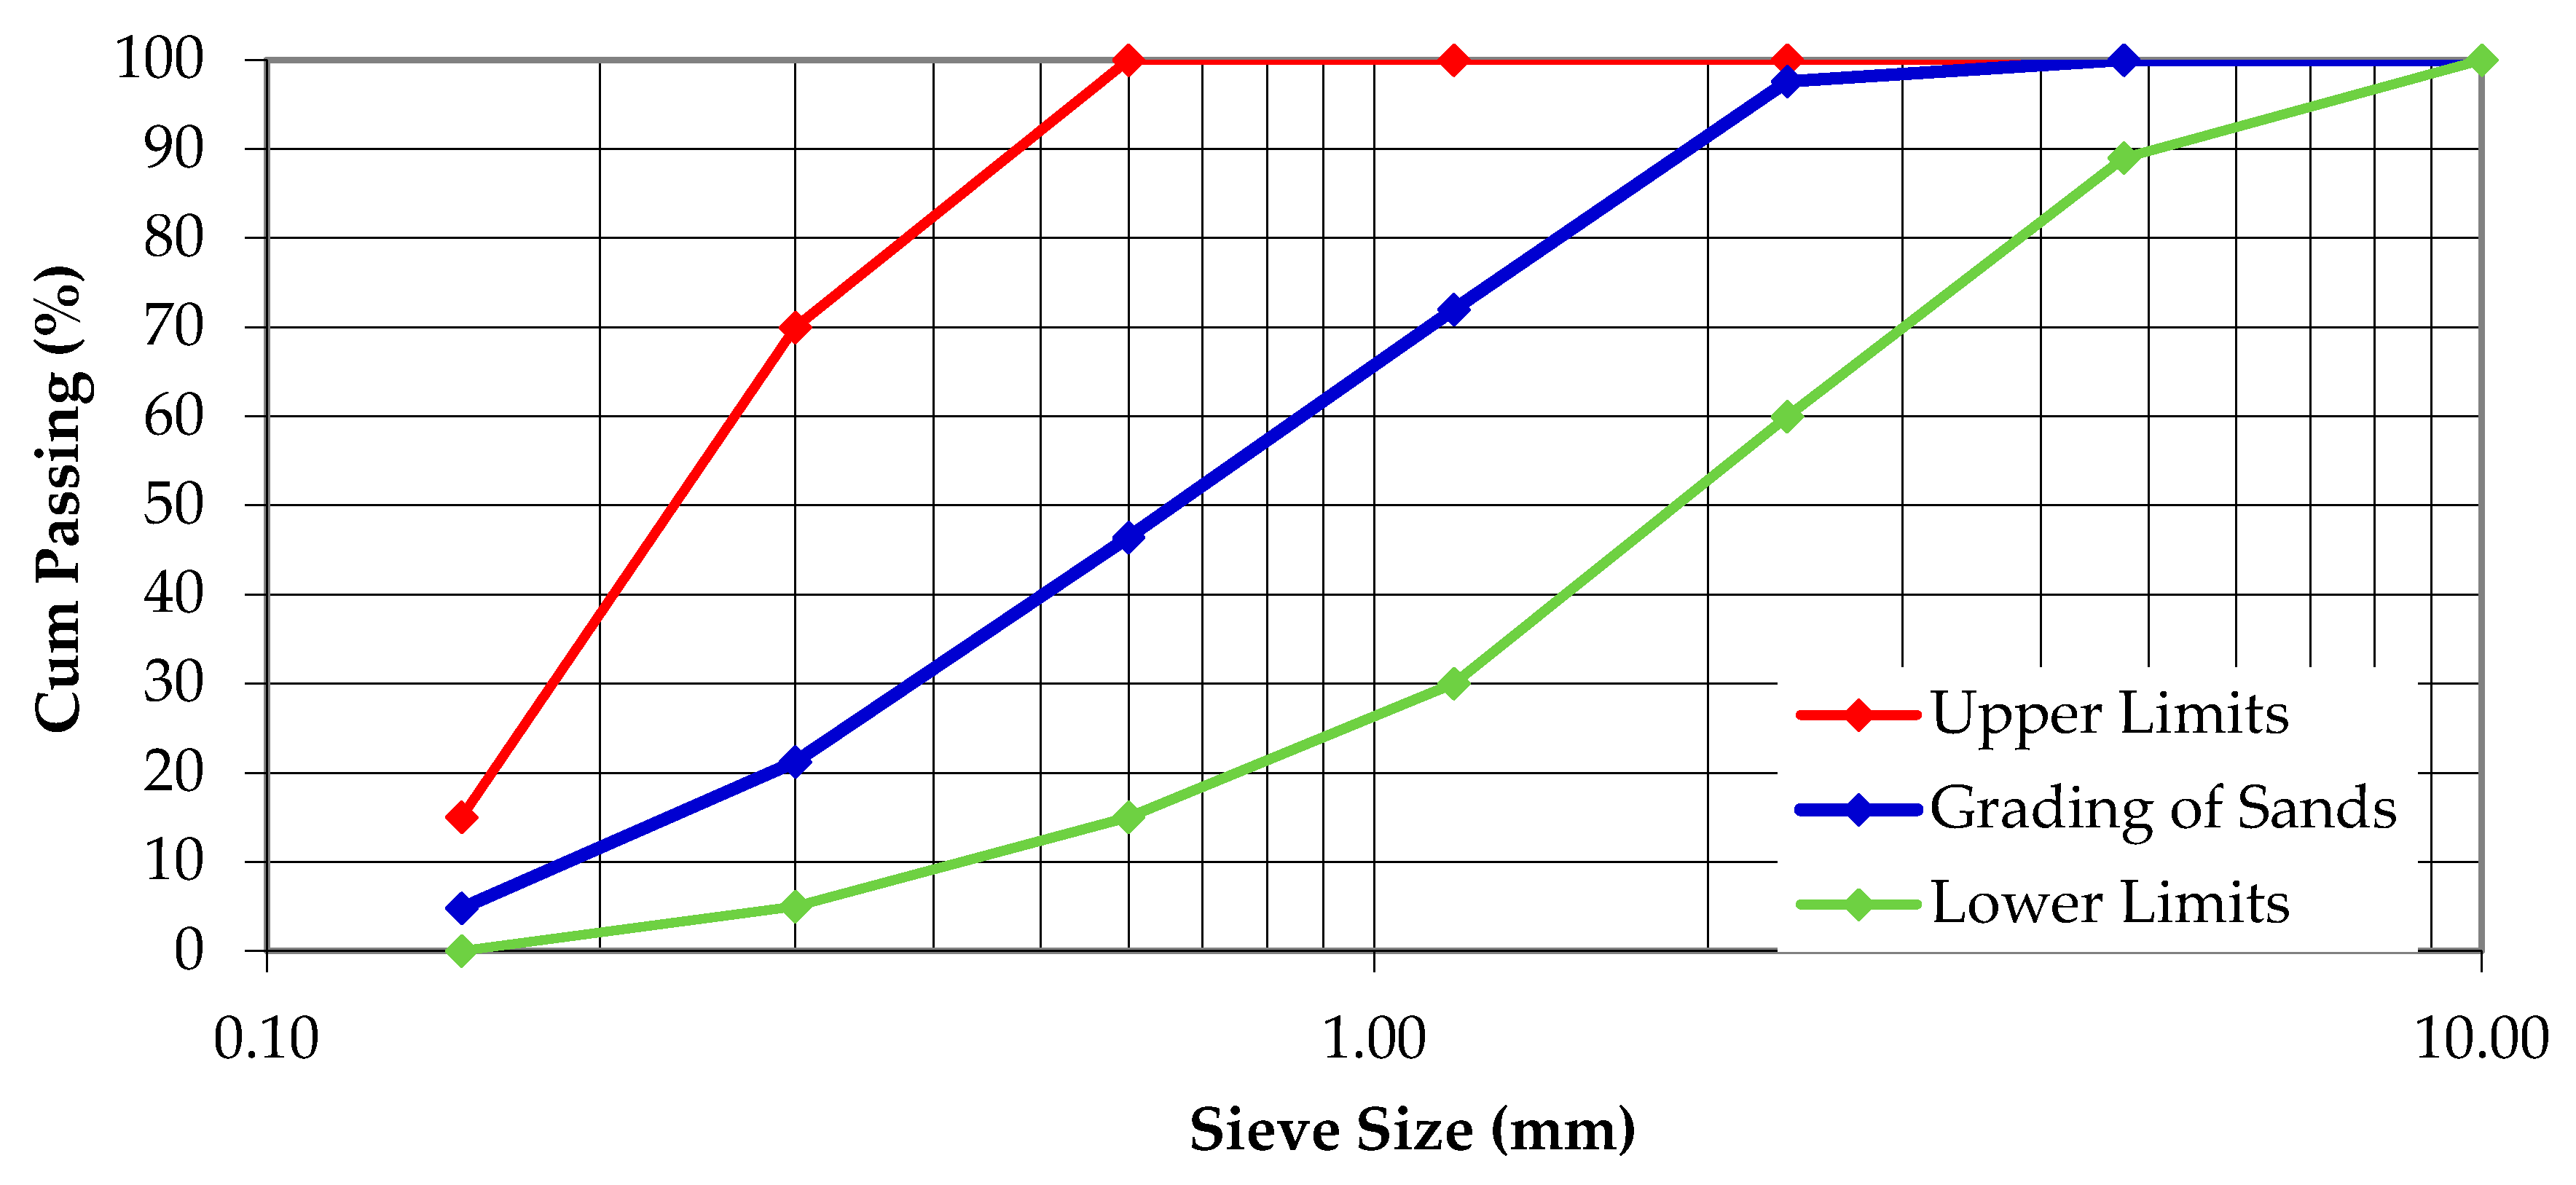
2.1. Specimen Preparation
2.2. Sample Characterization
3. Results and Discussion
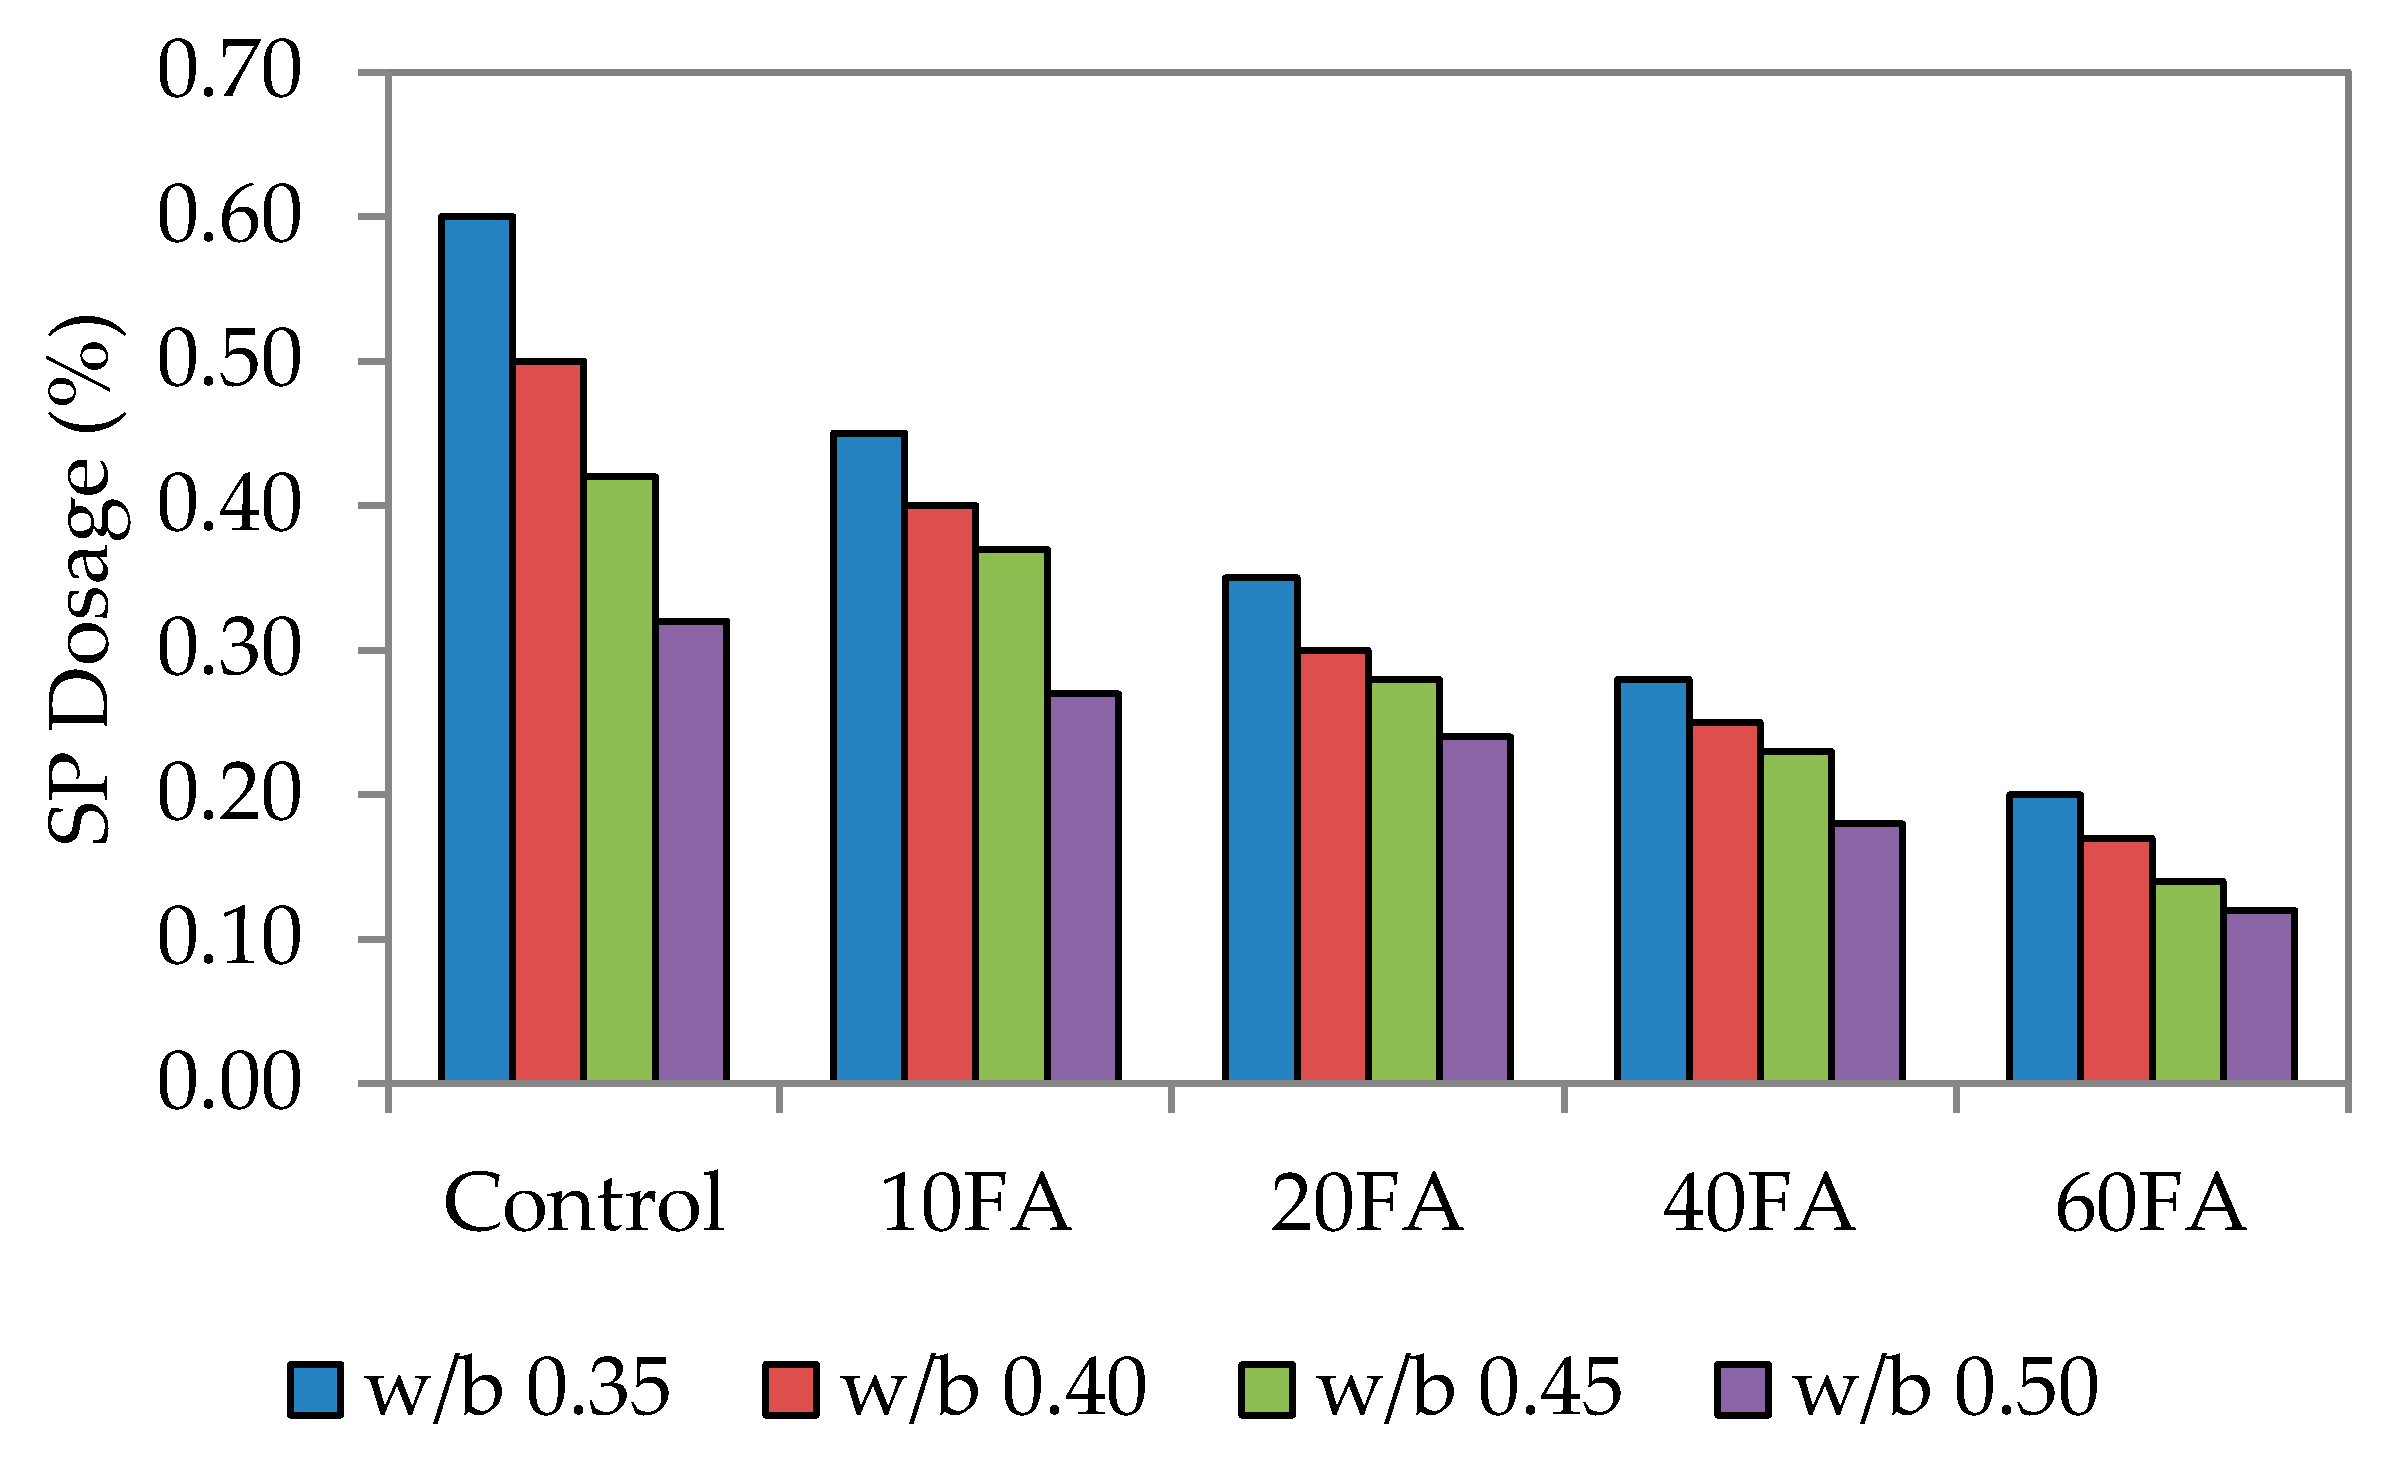
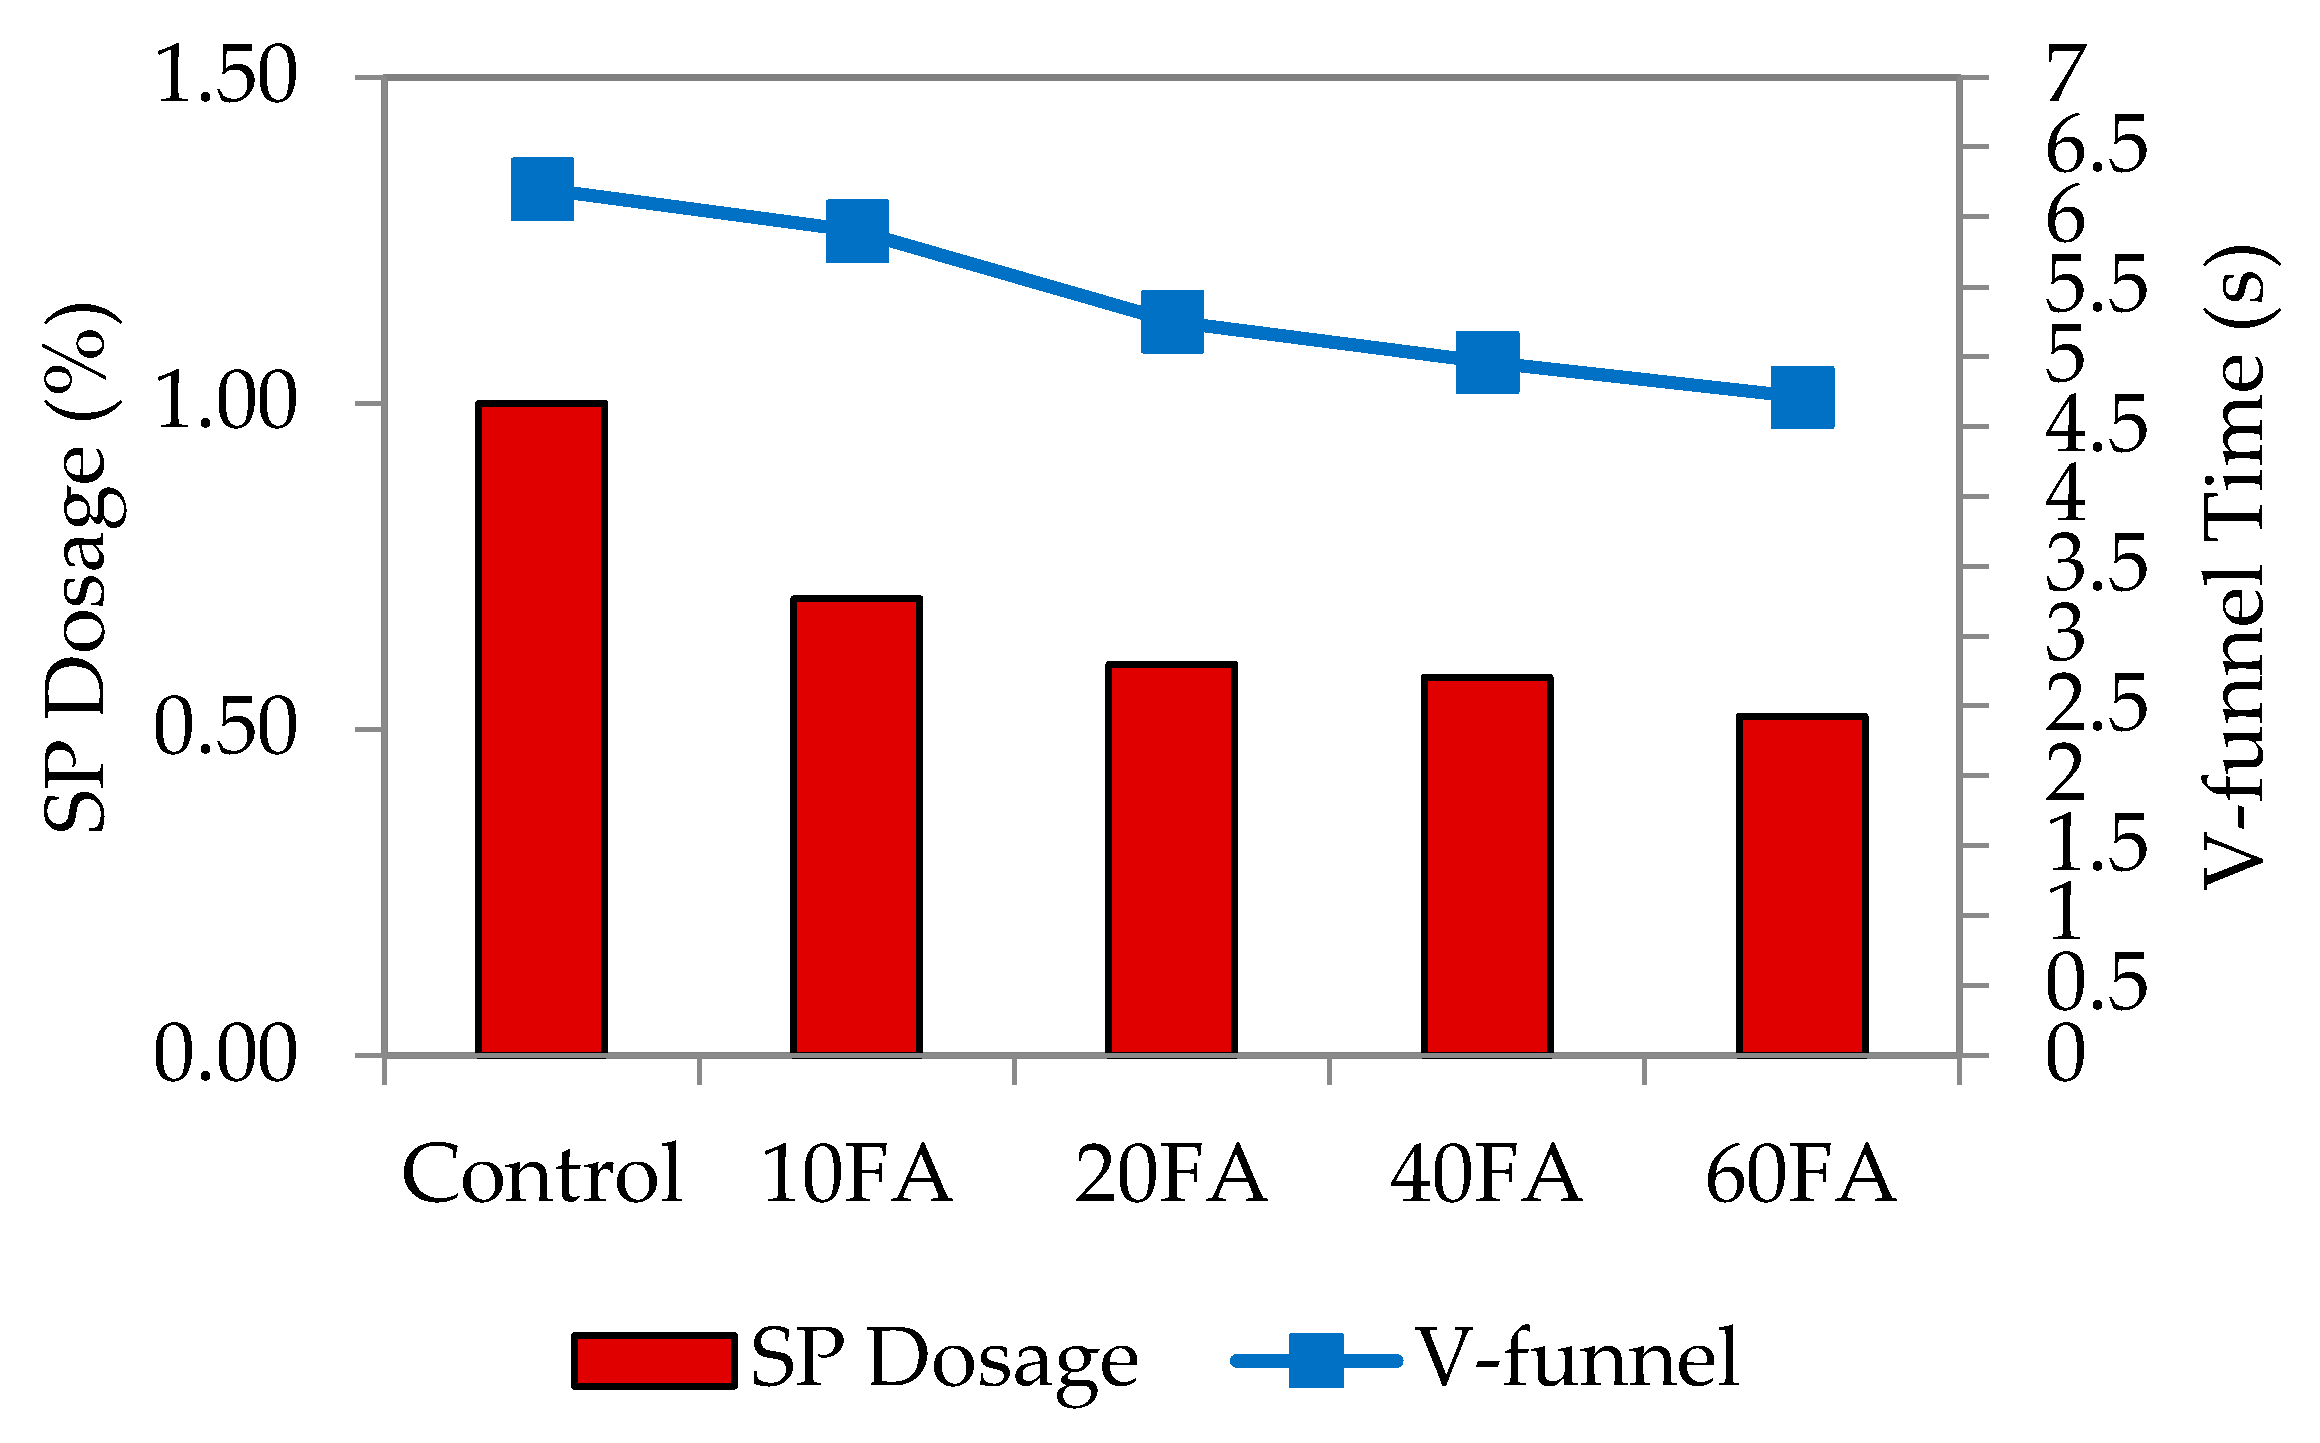
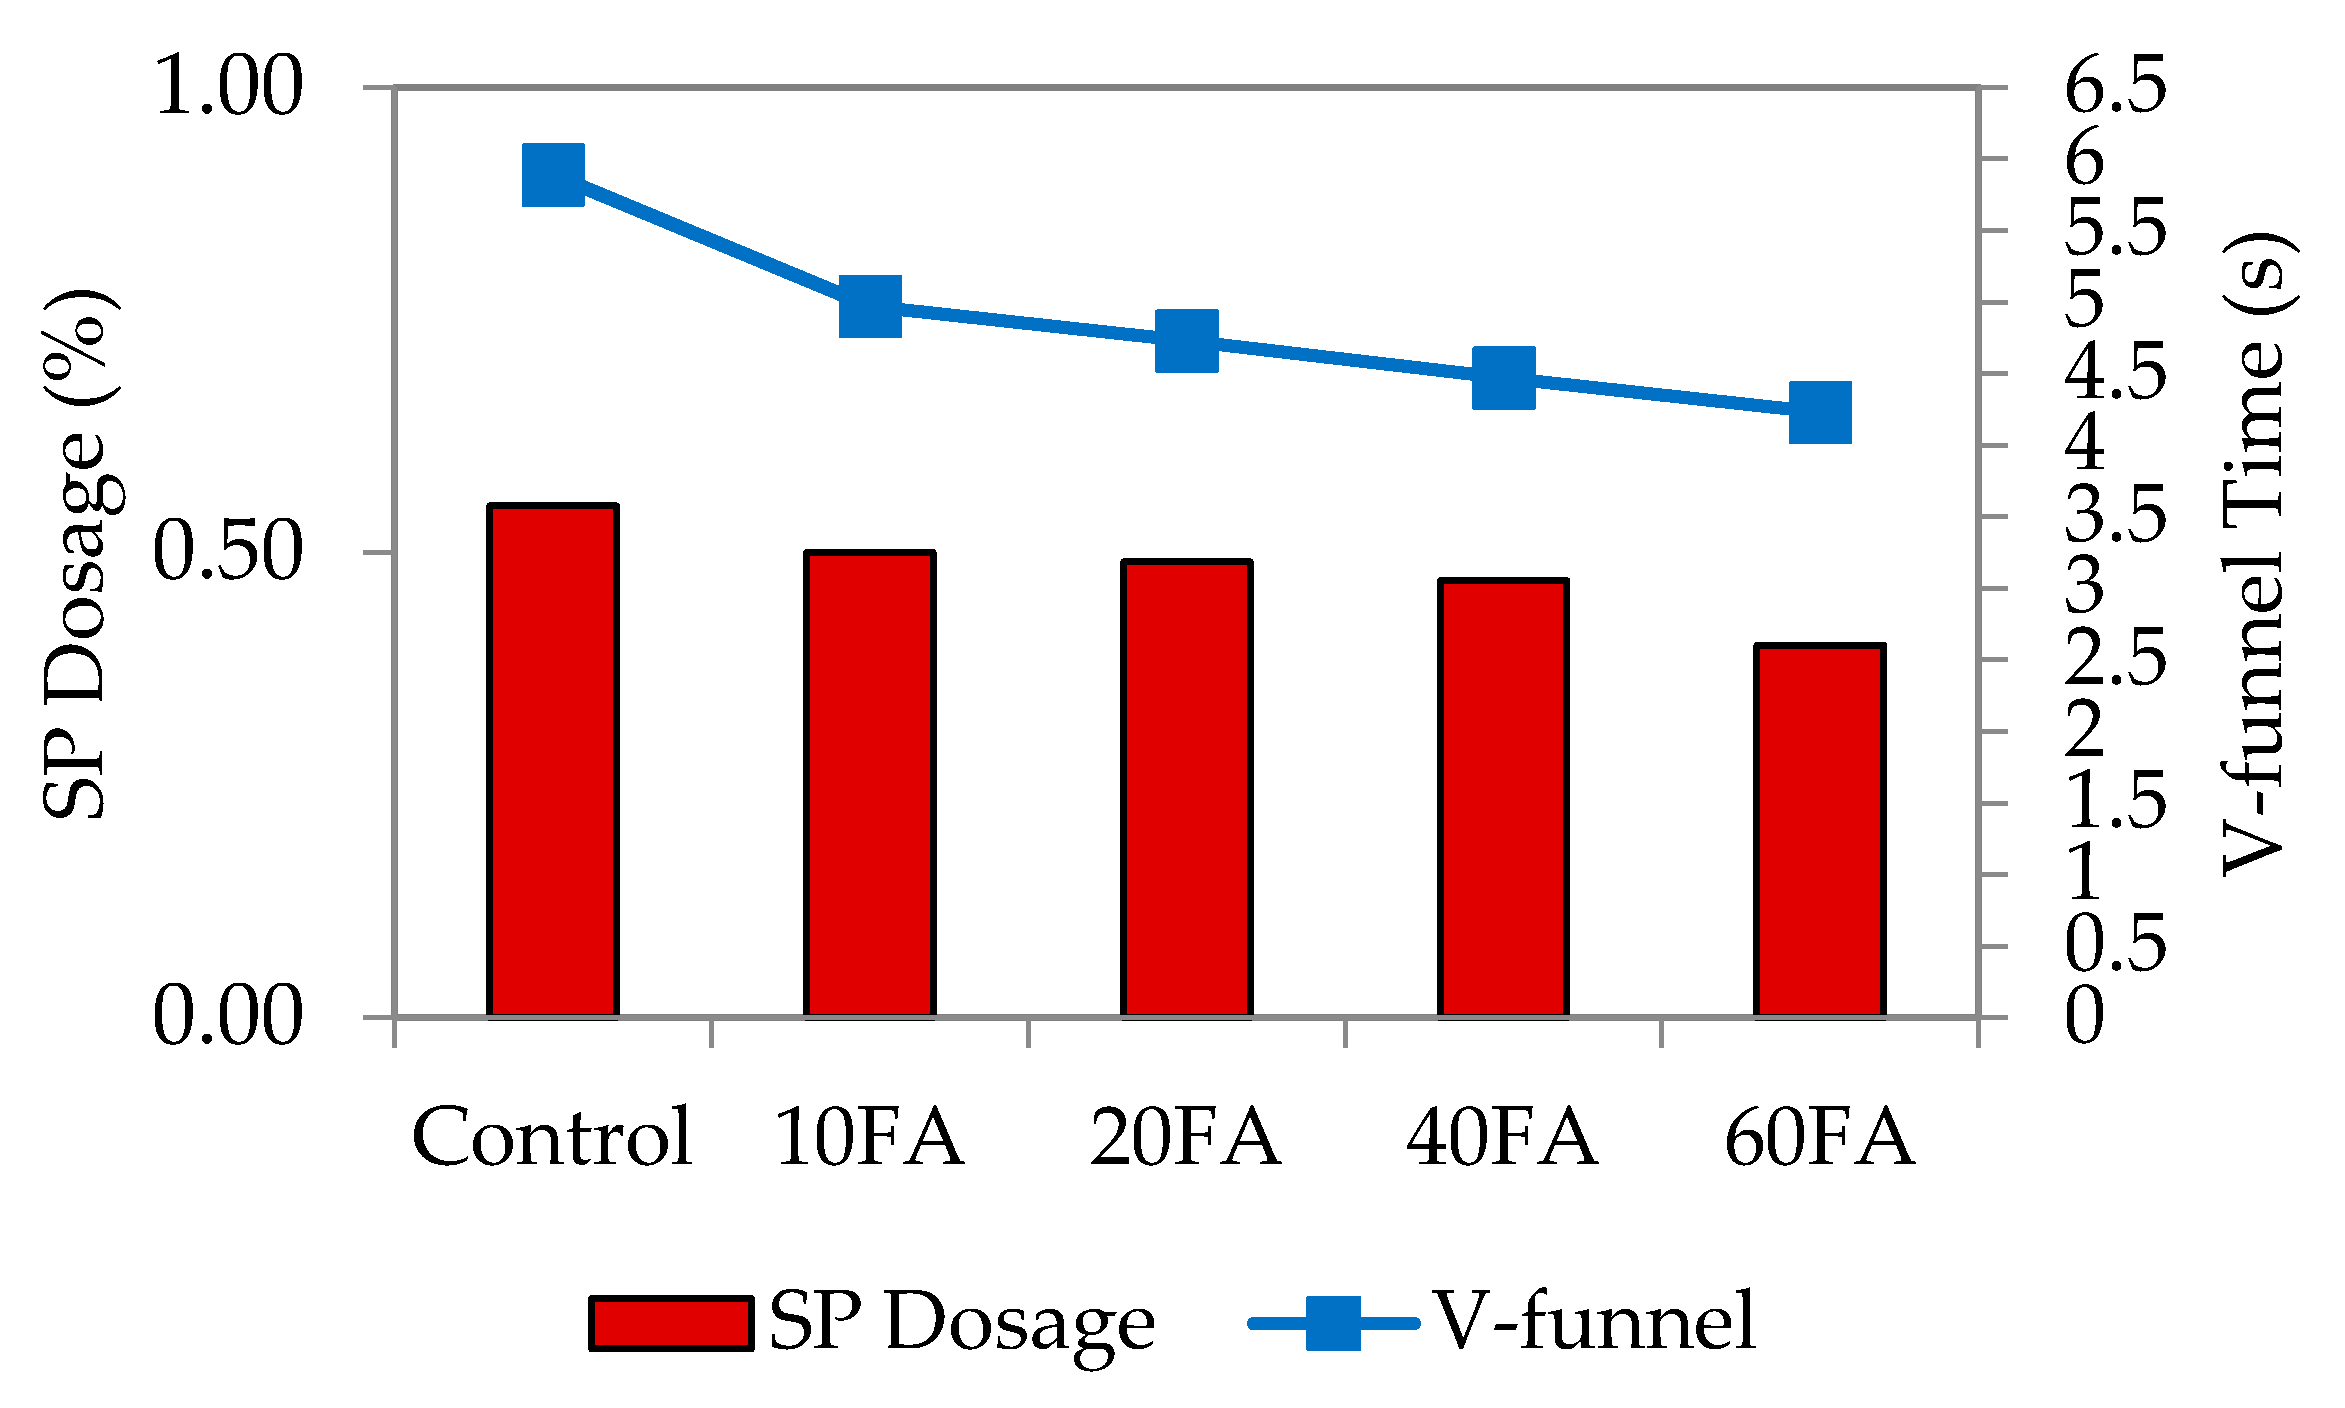
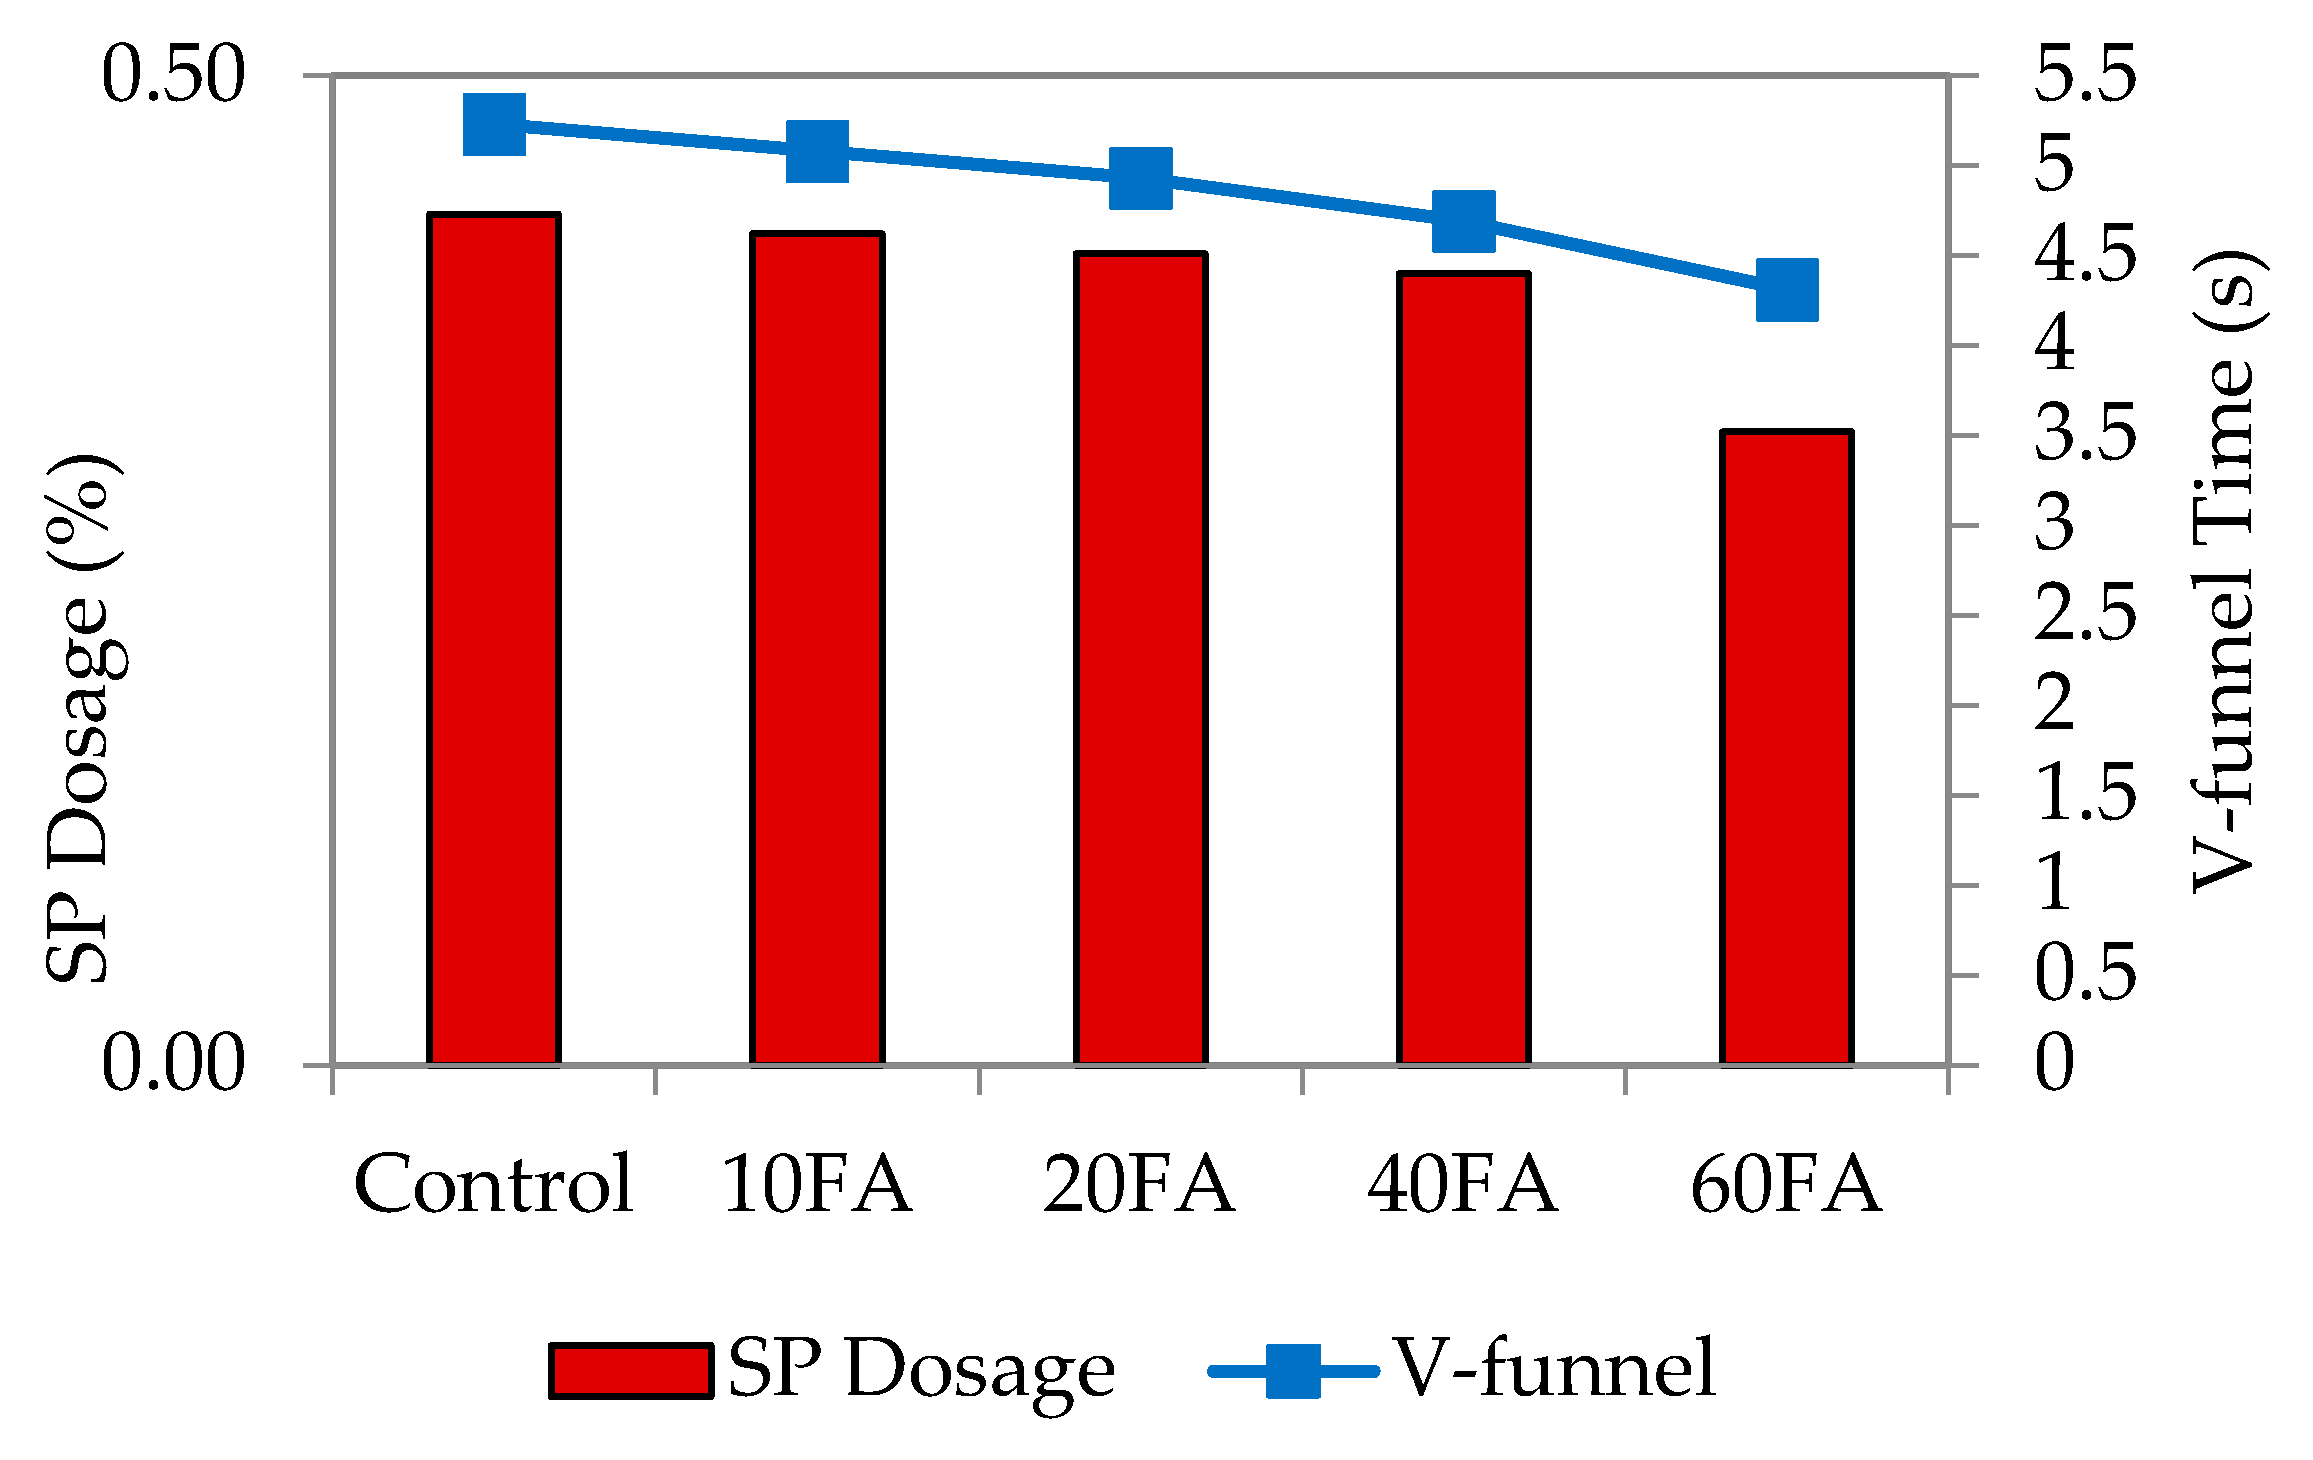
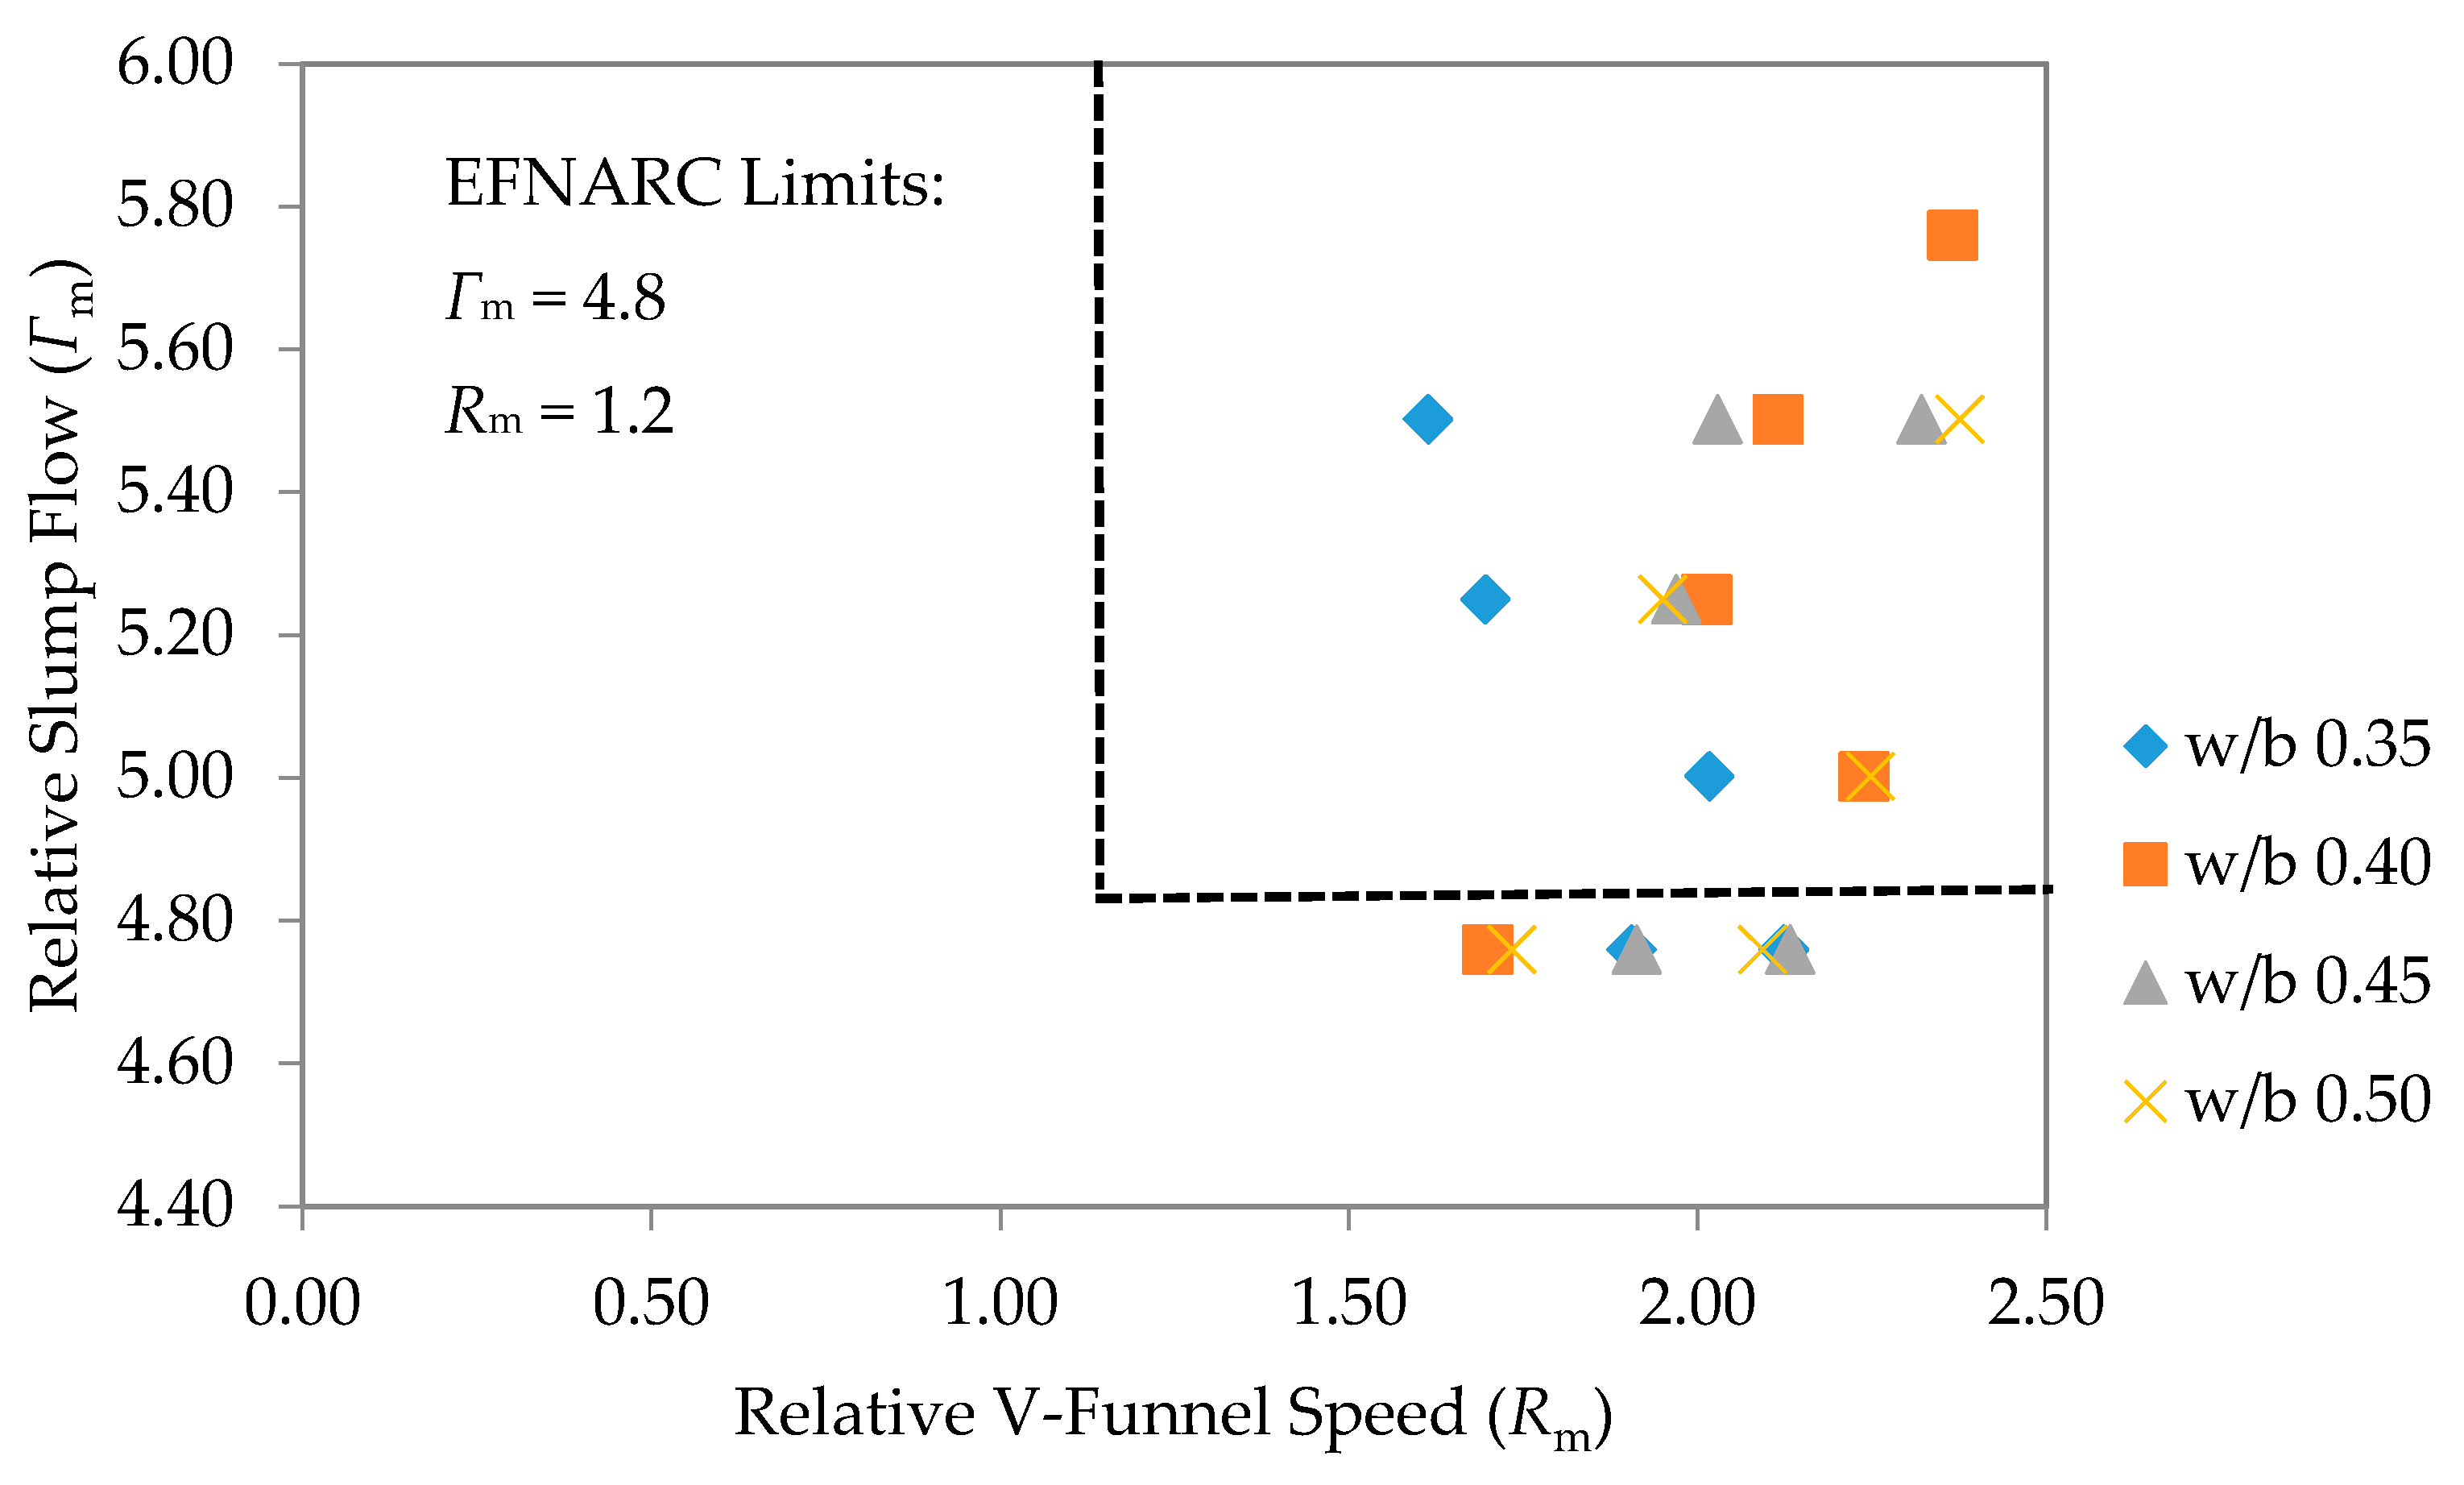
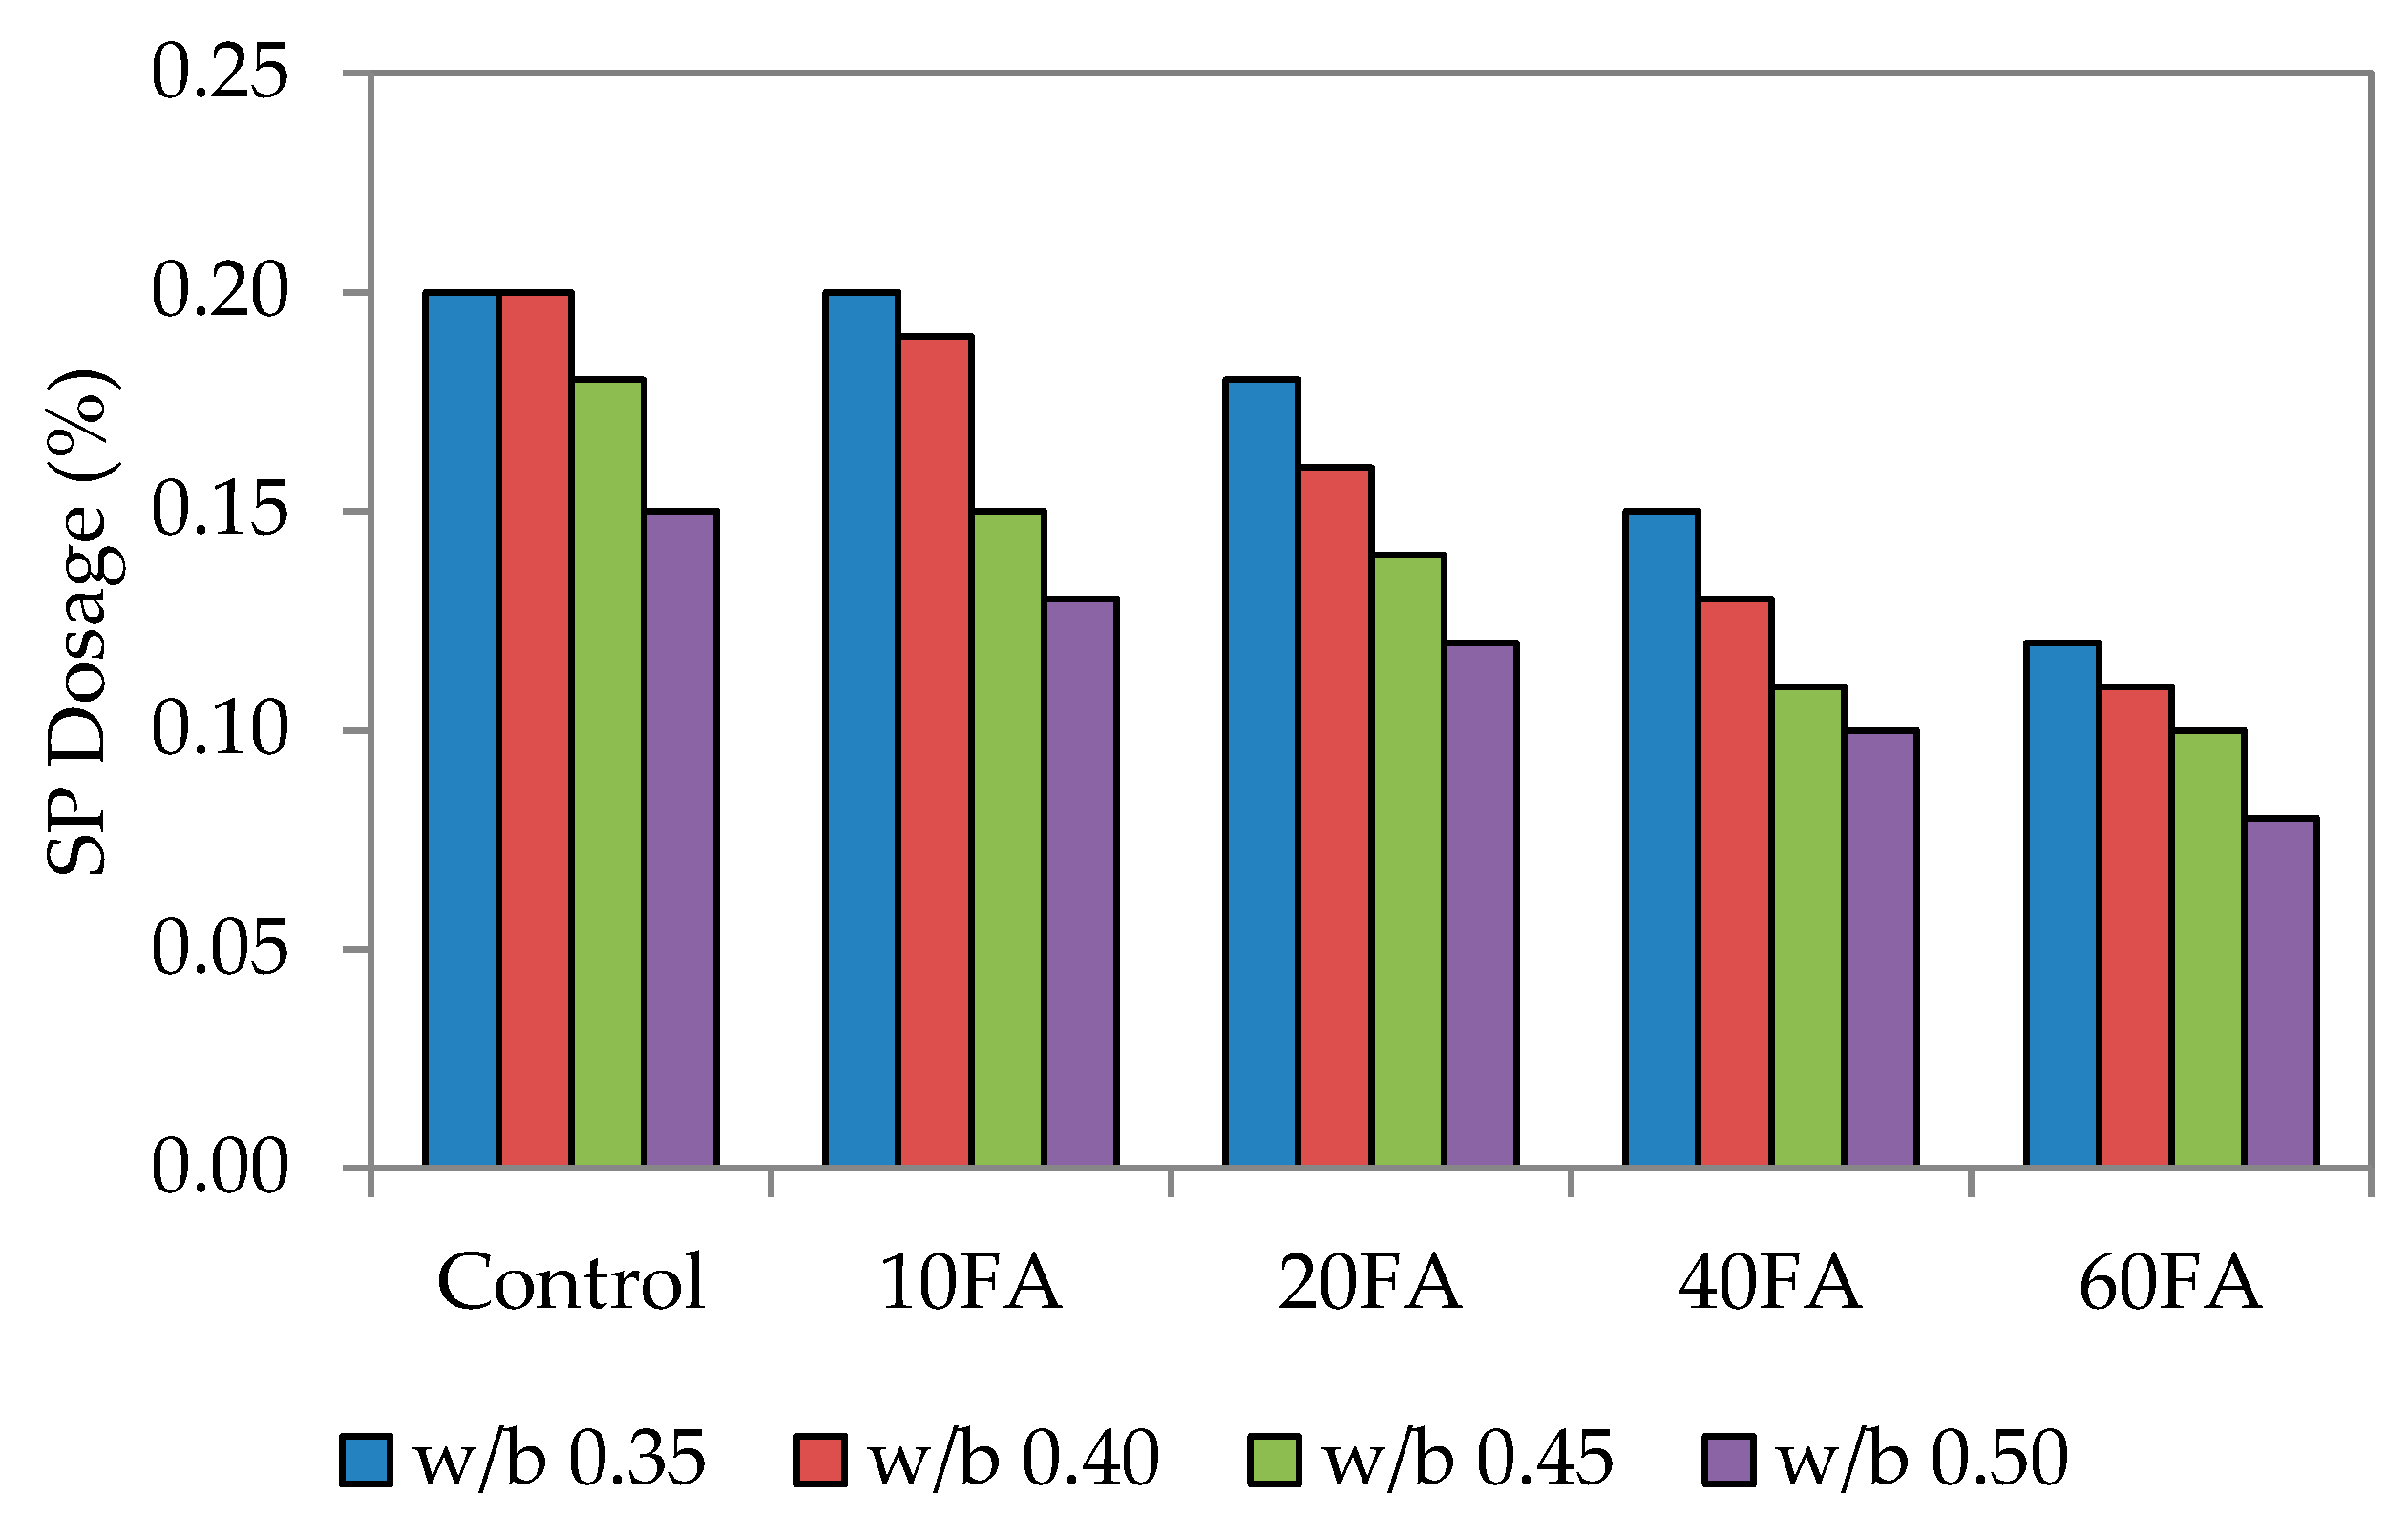
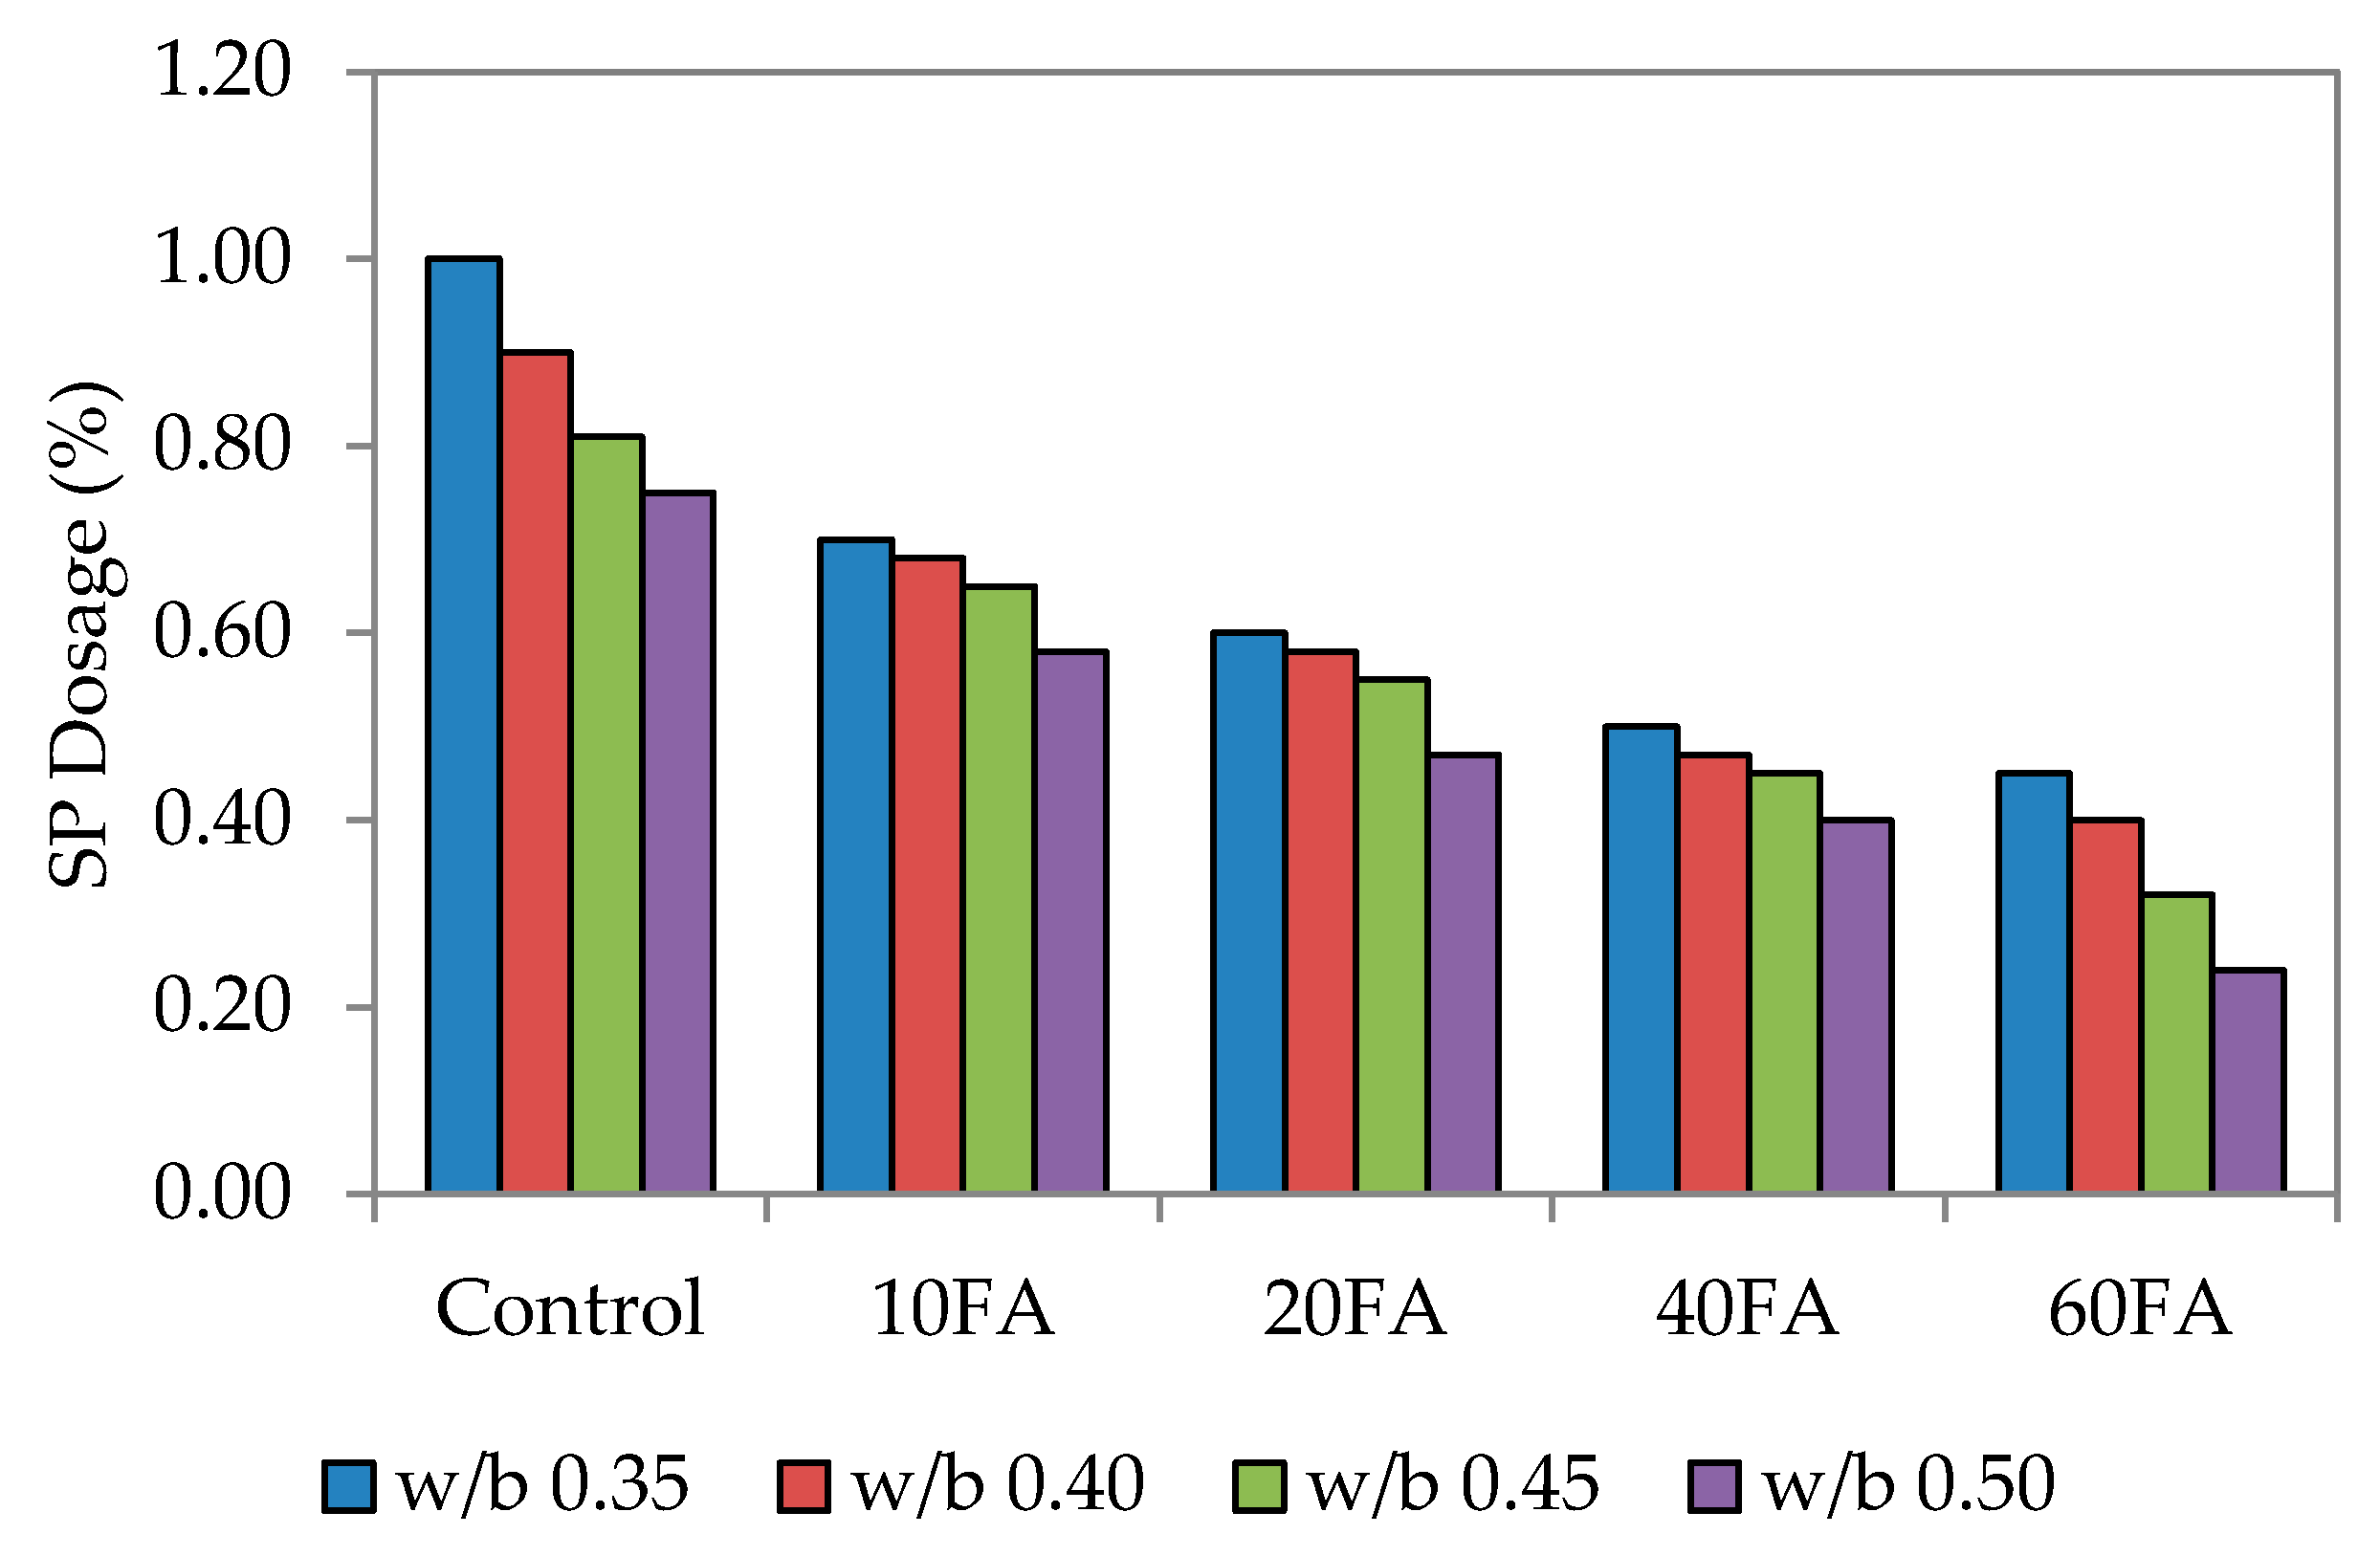
3.1. Slump Flow
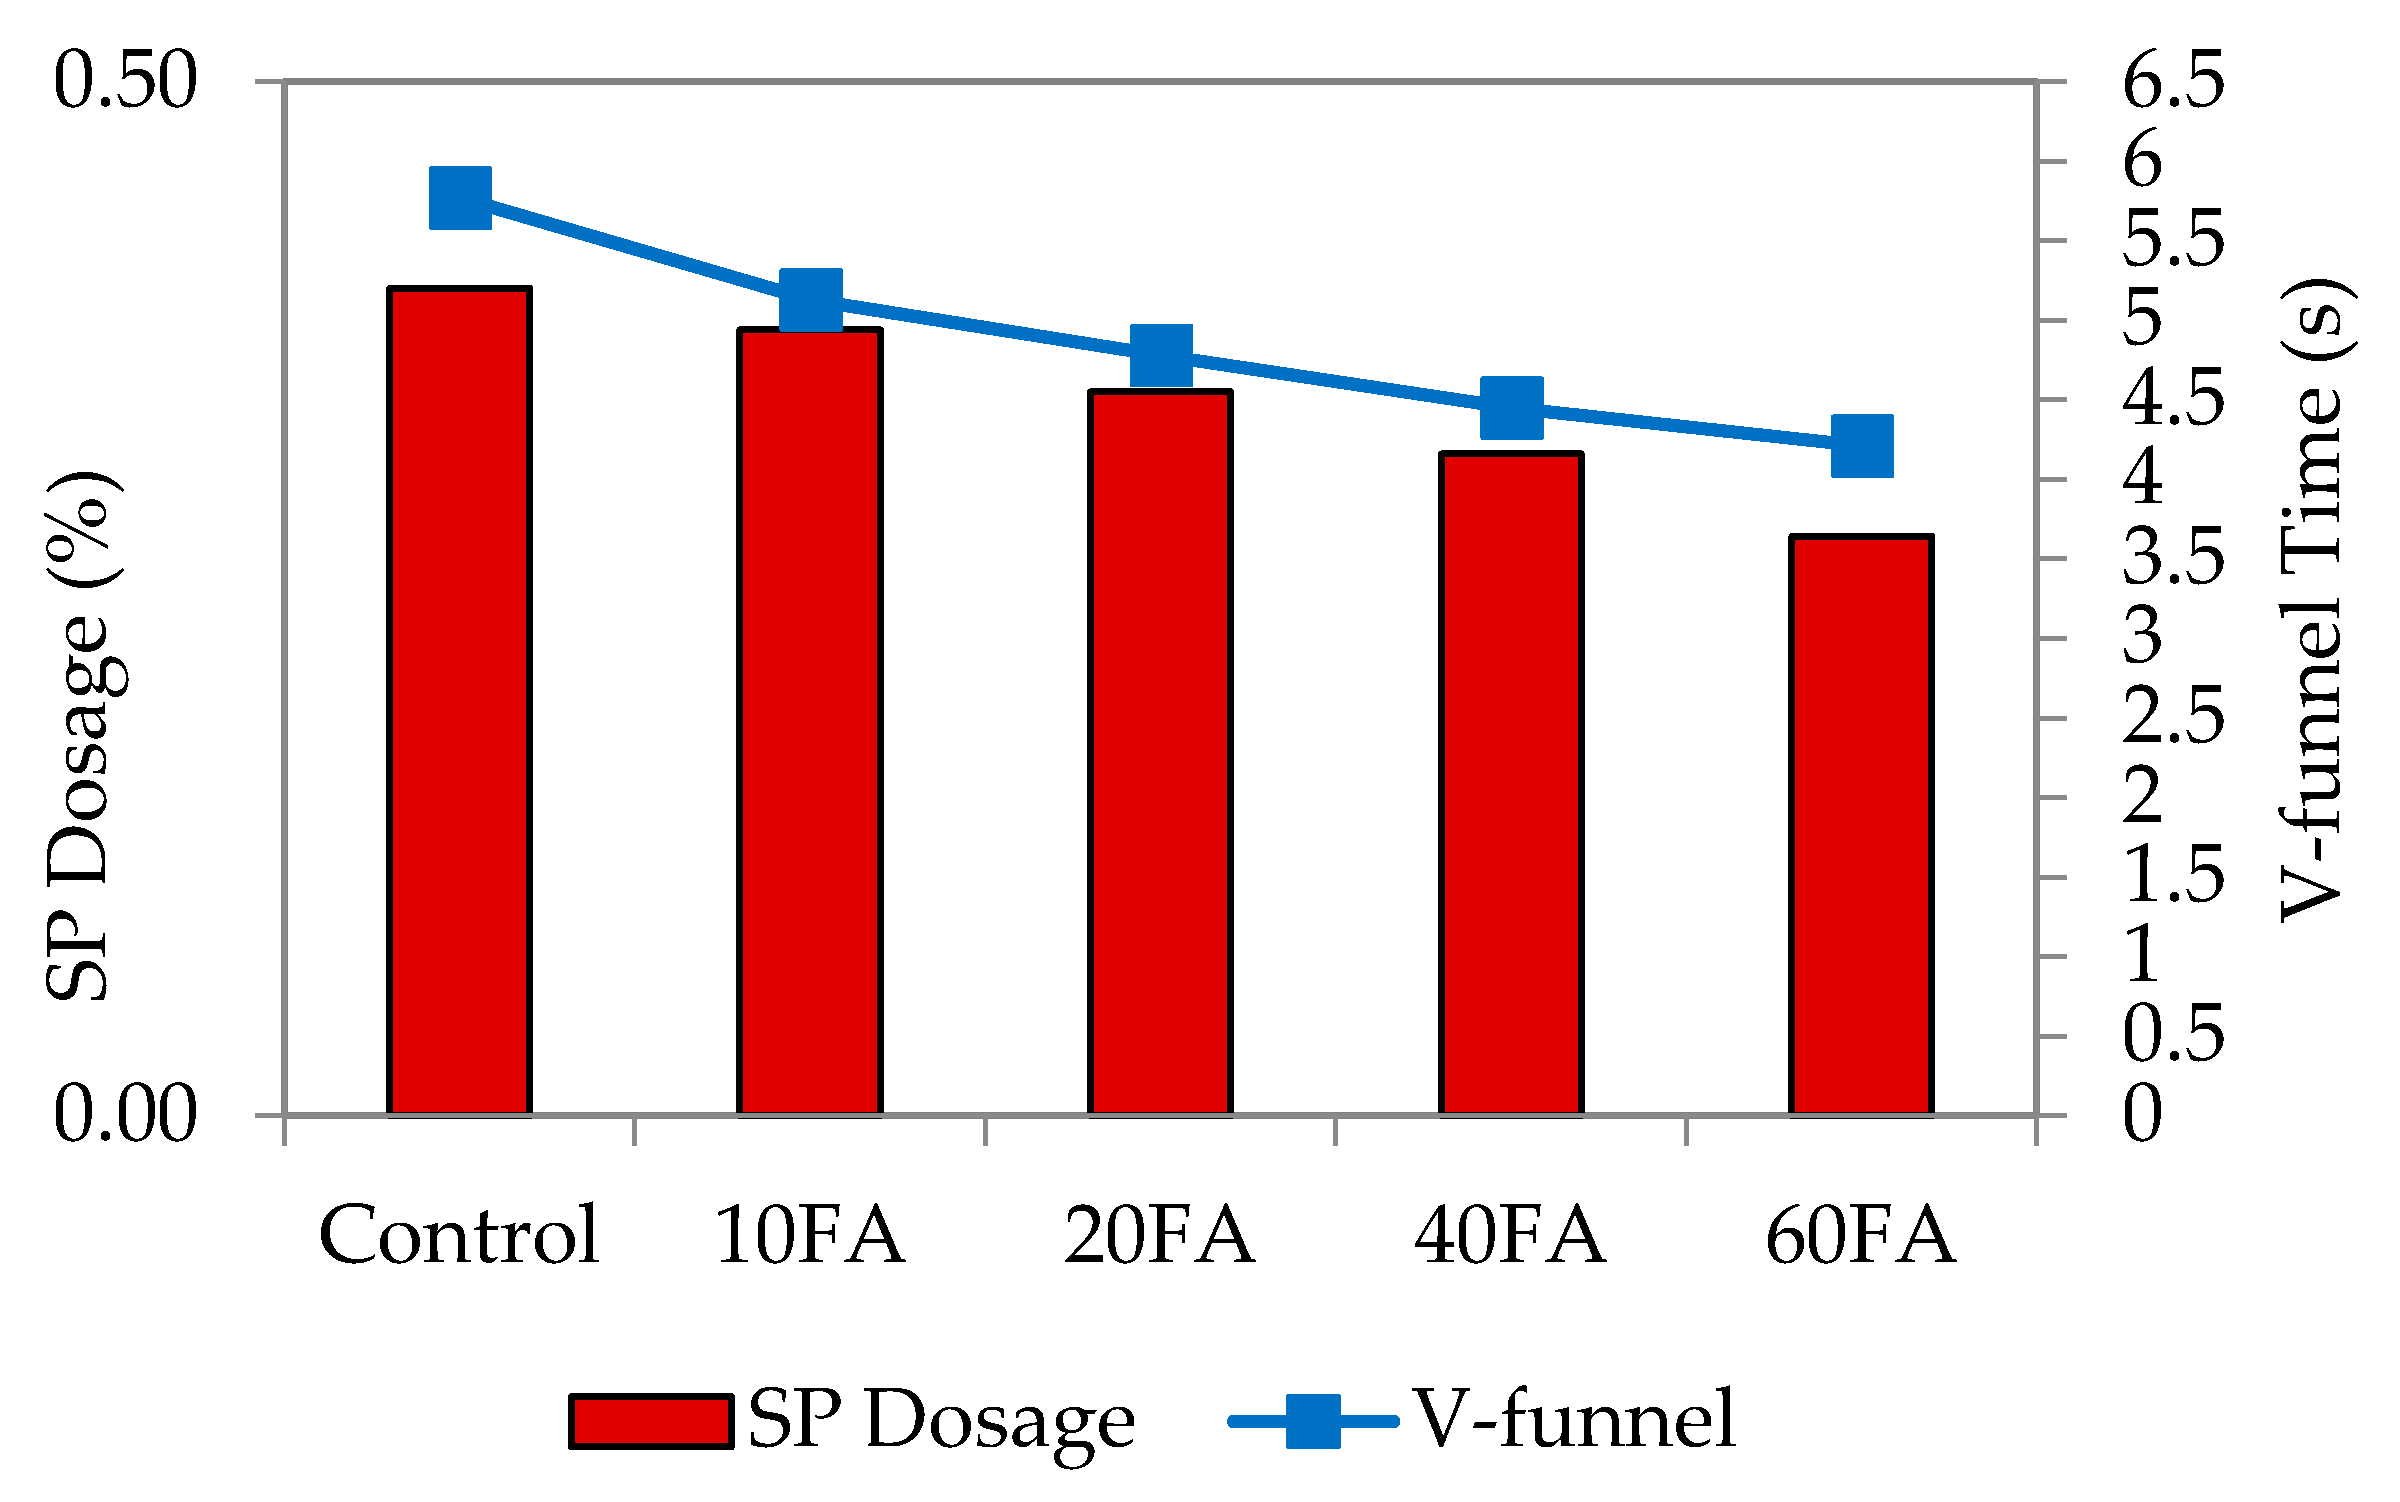
3.2. V-Funnel
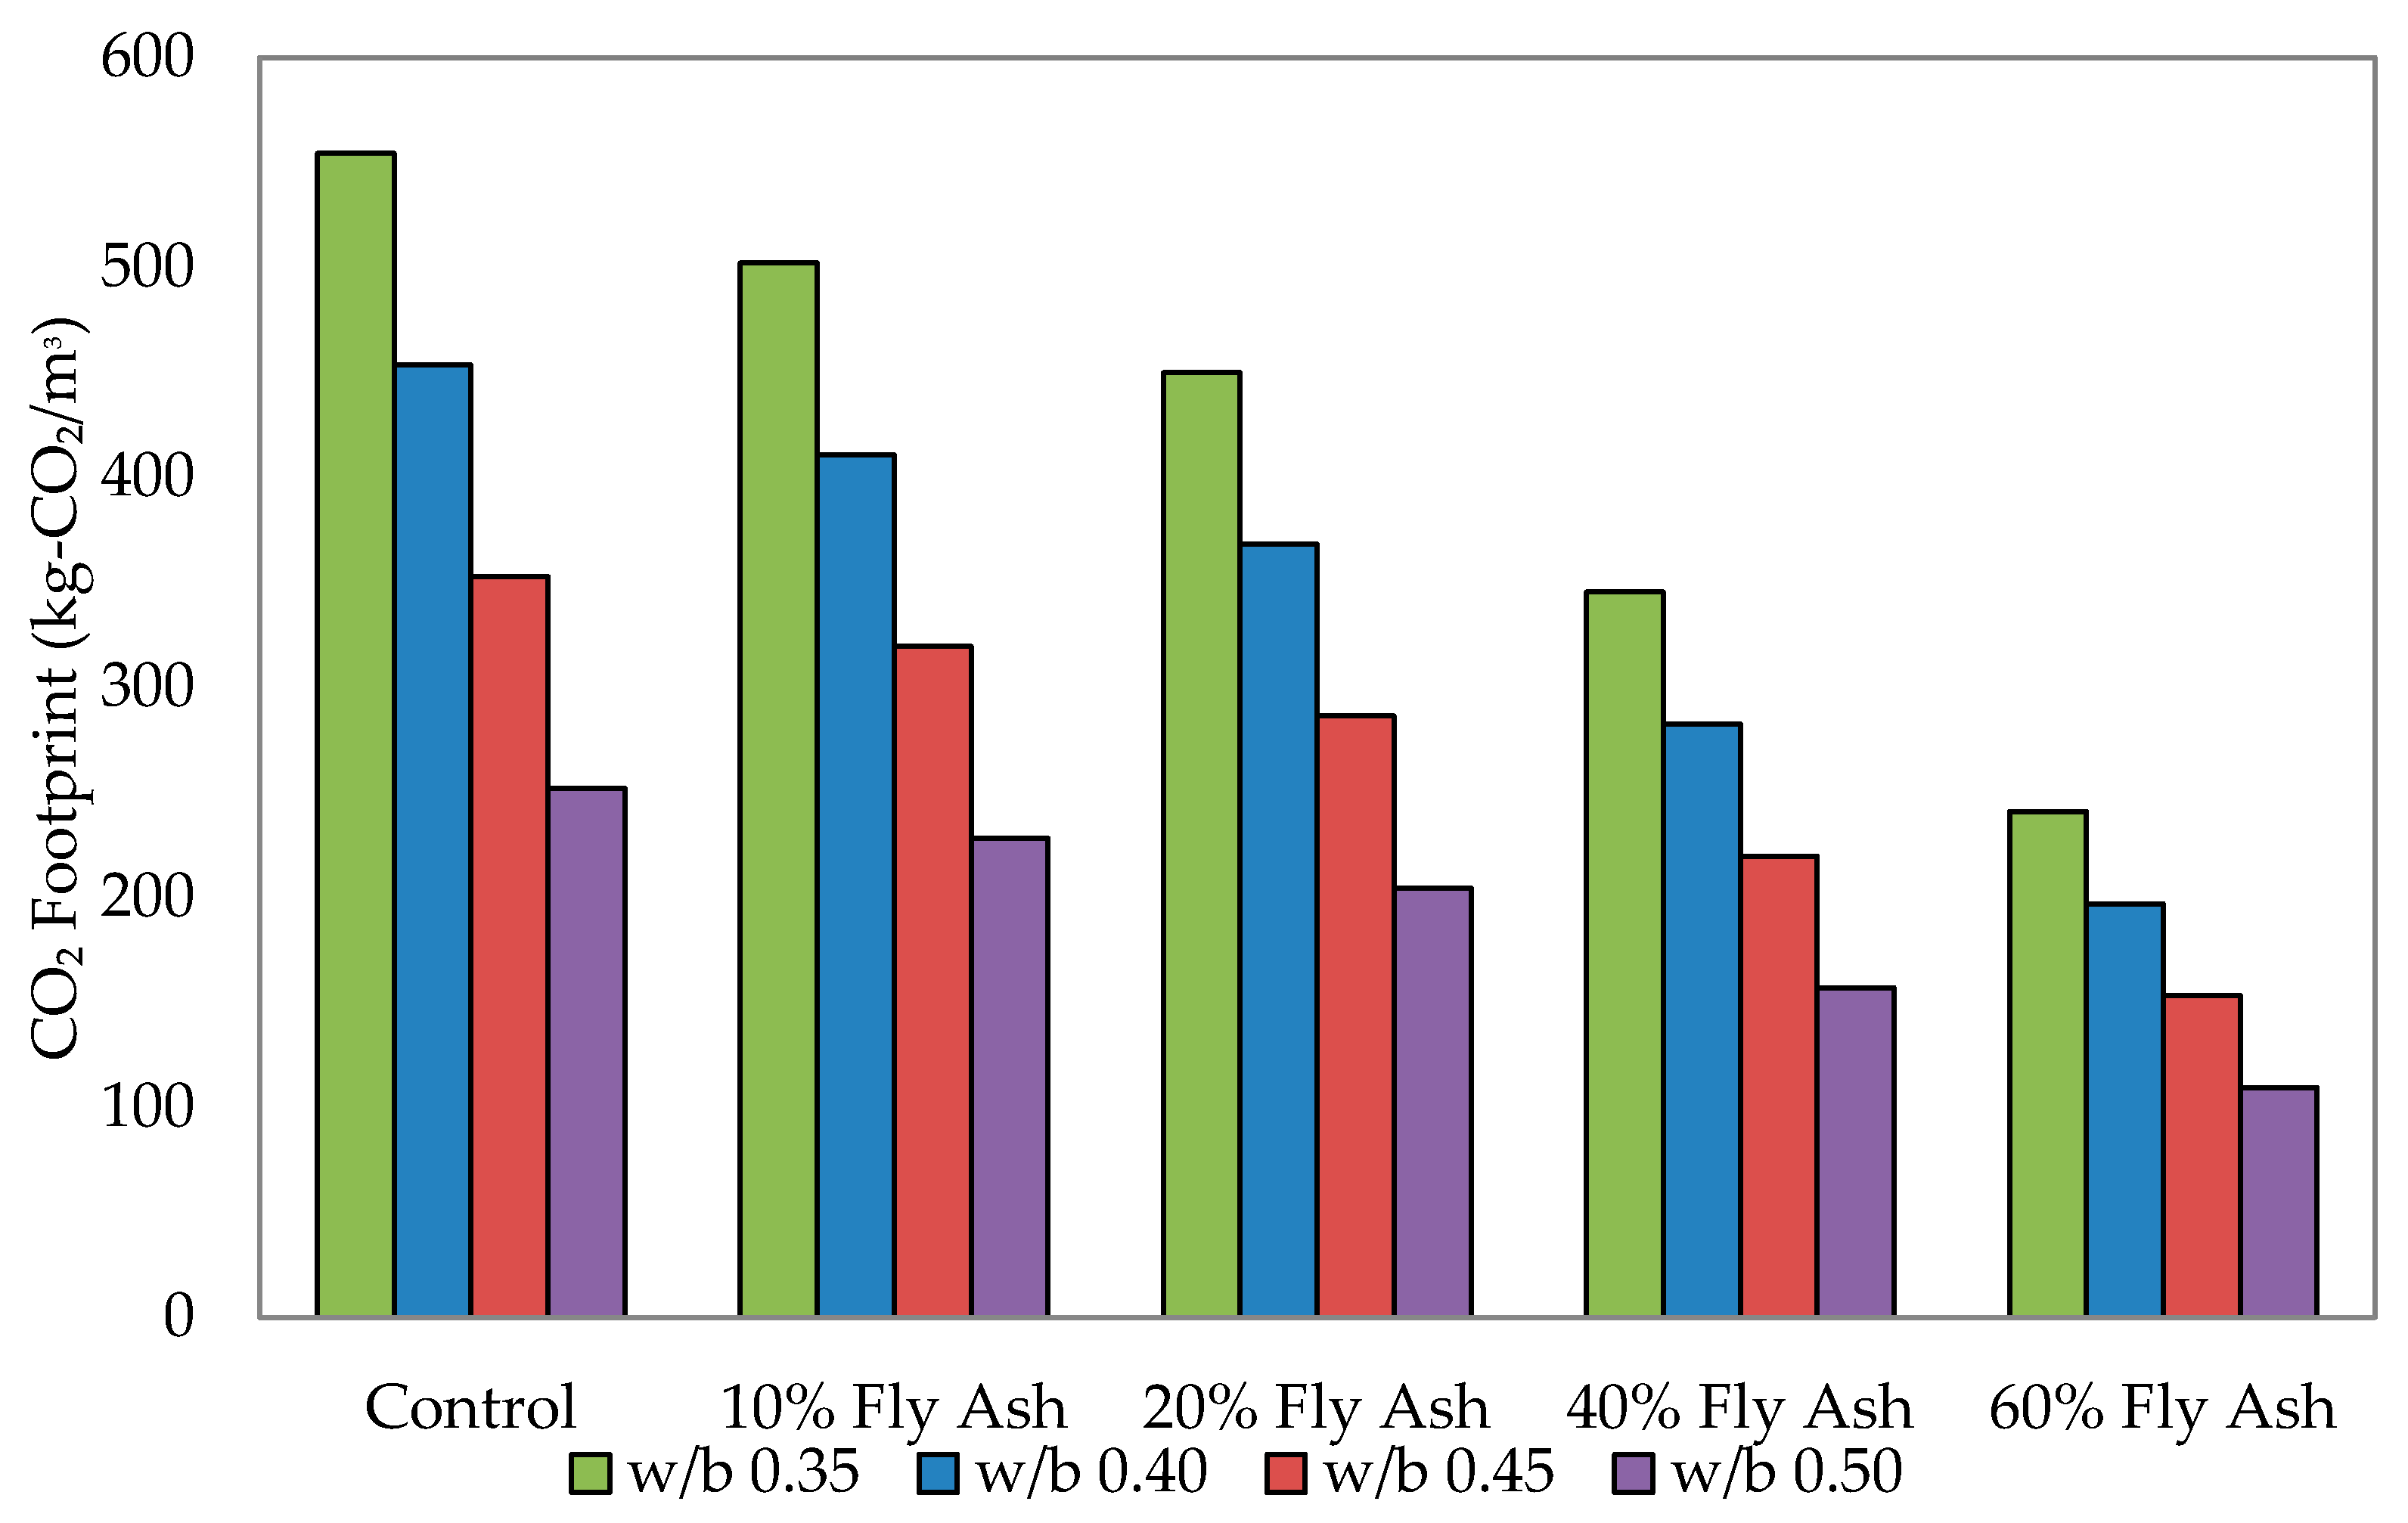
3.3. Environmental Sustainability Performance
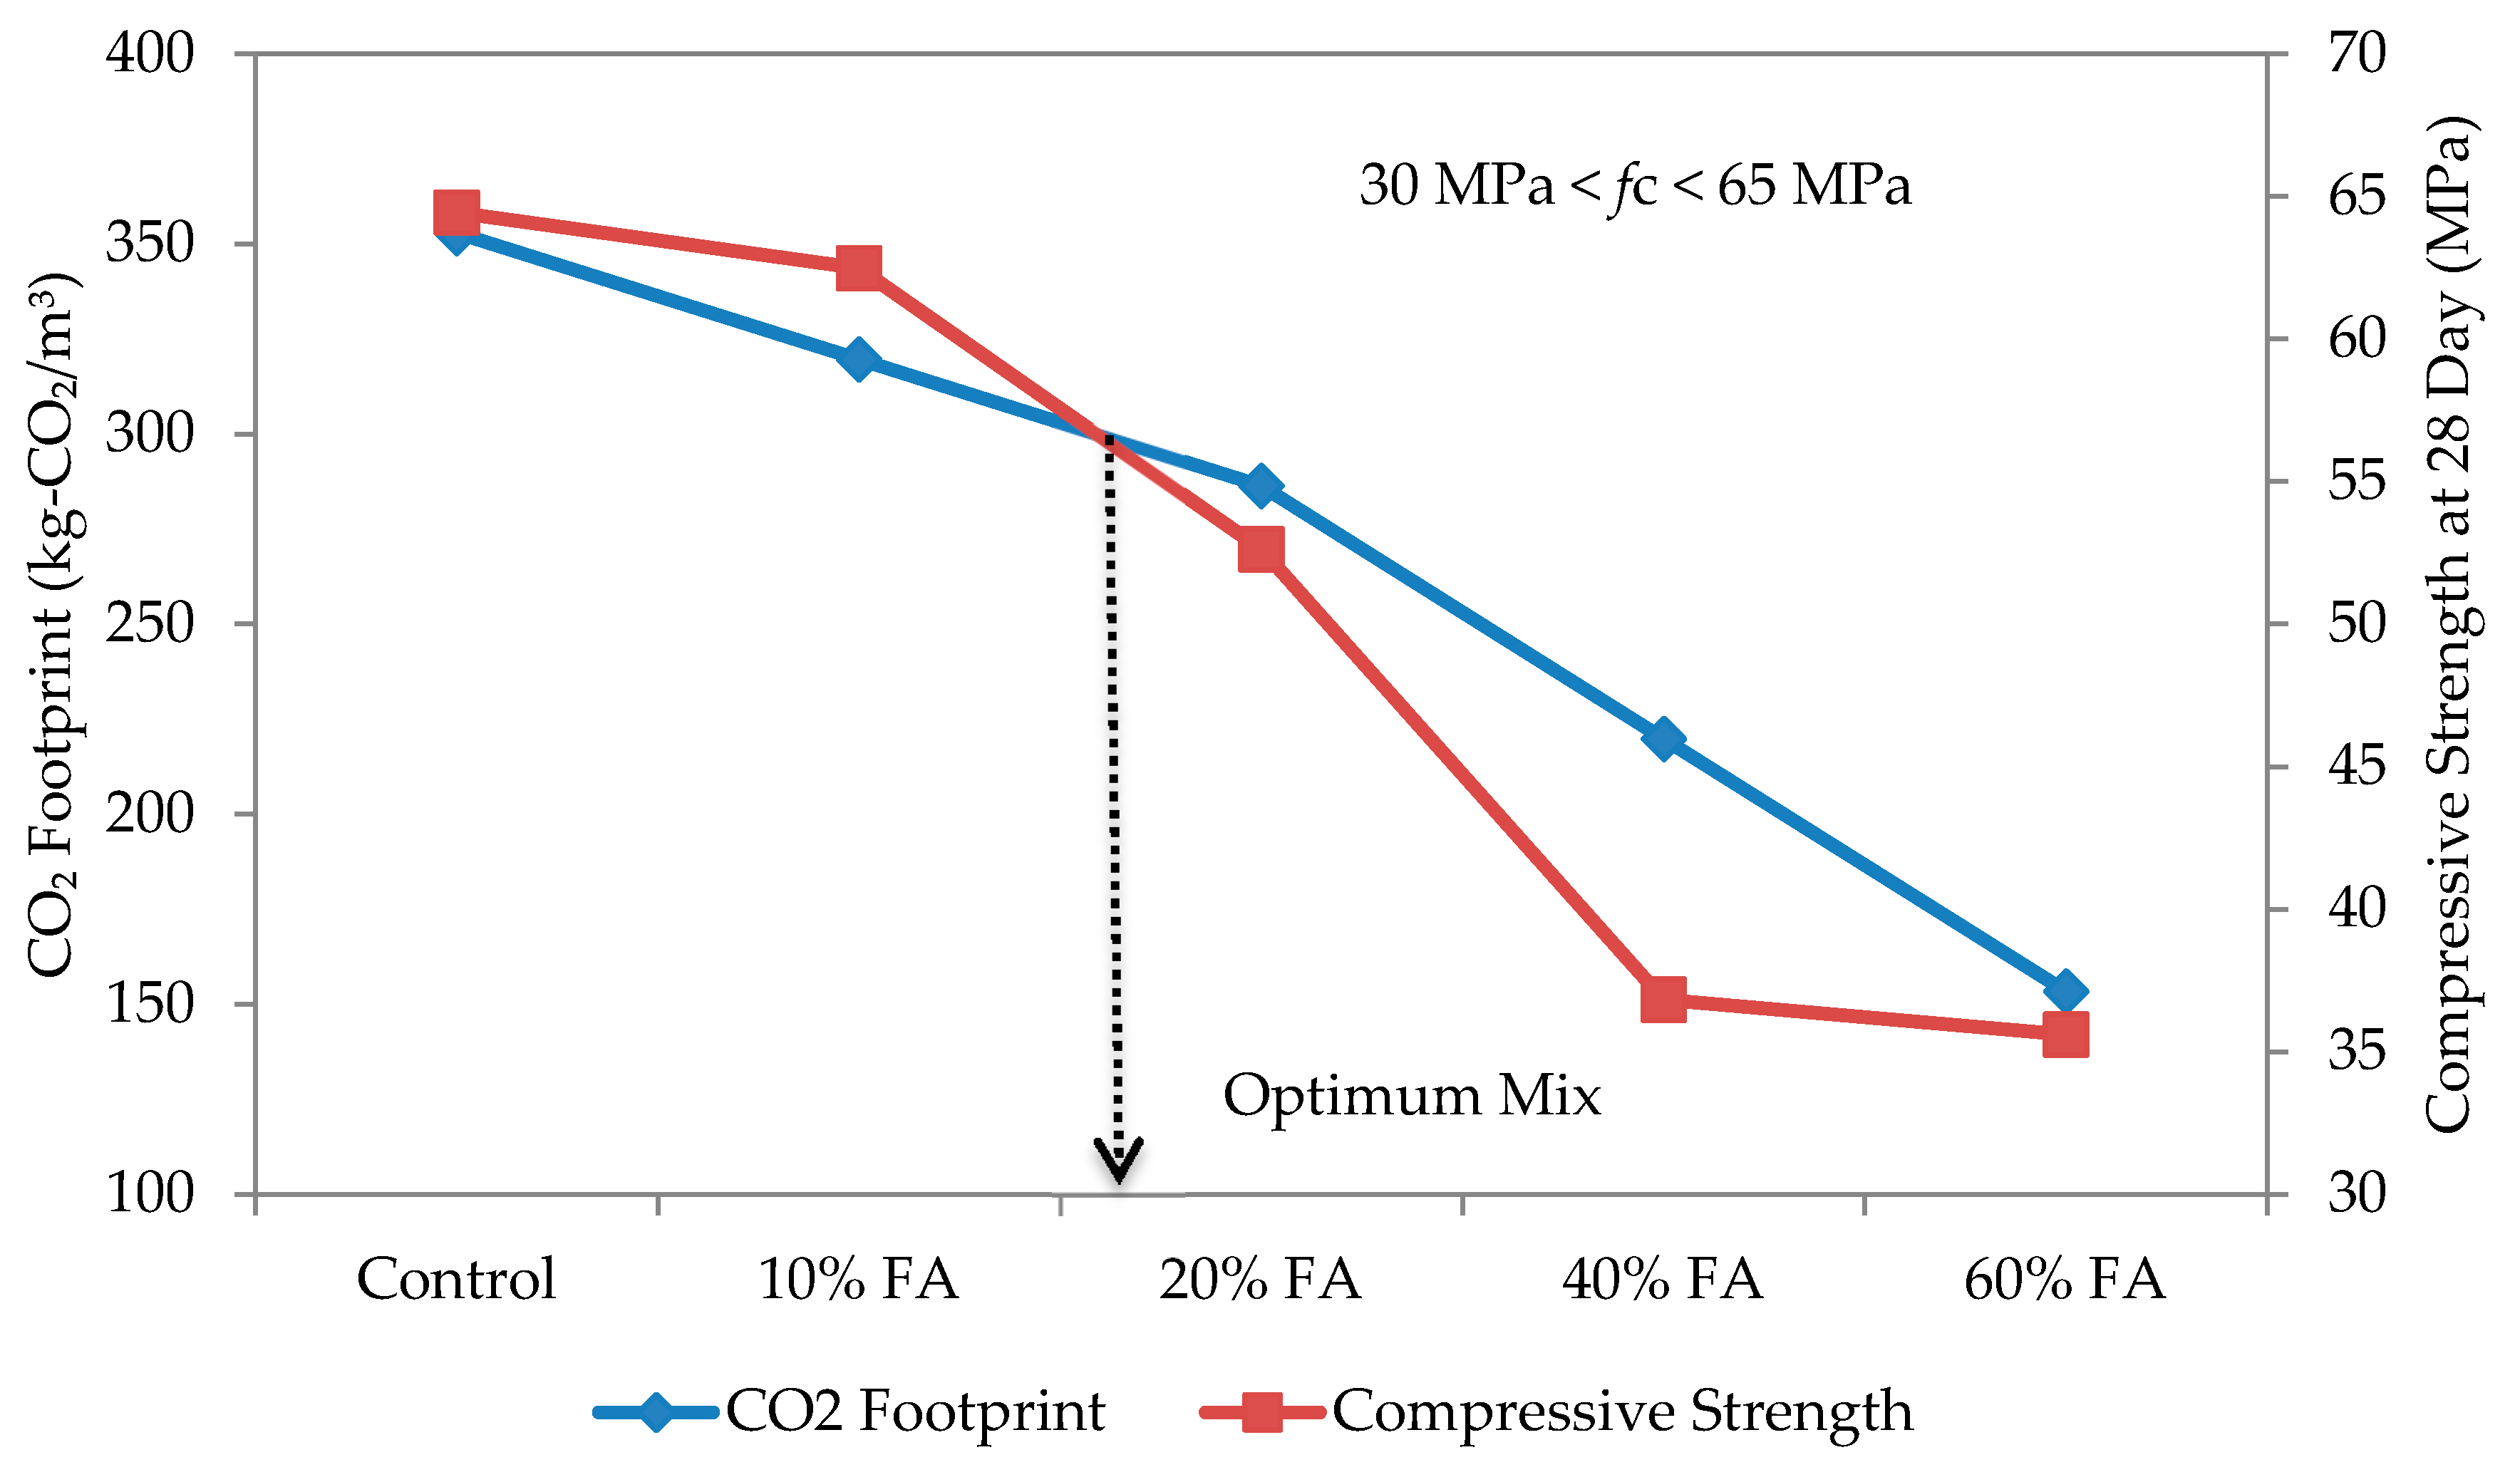
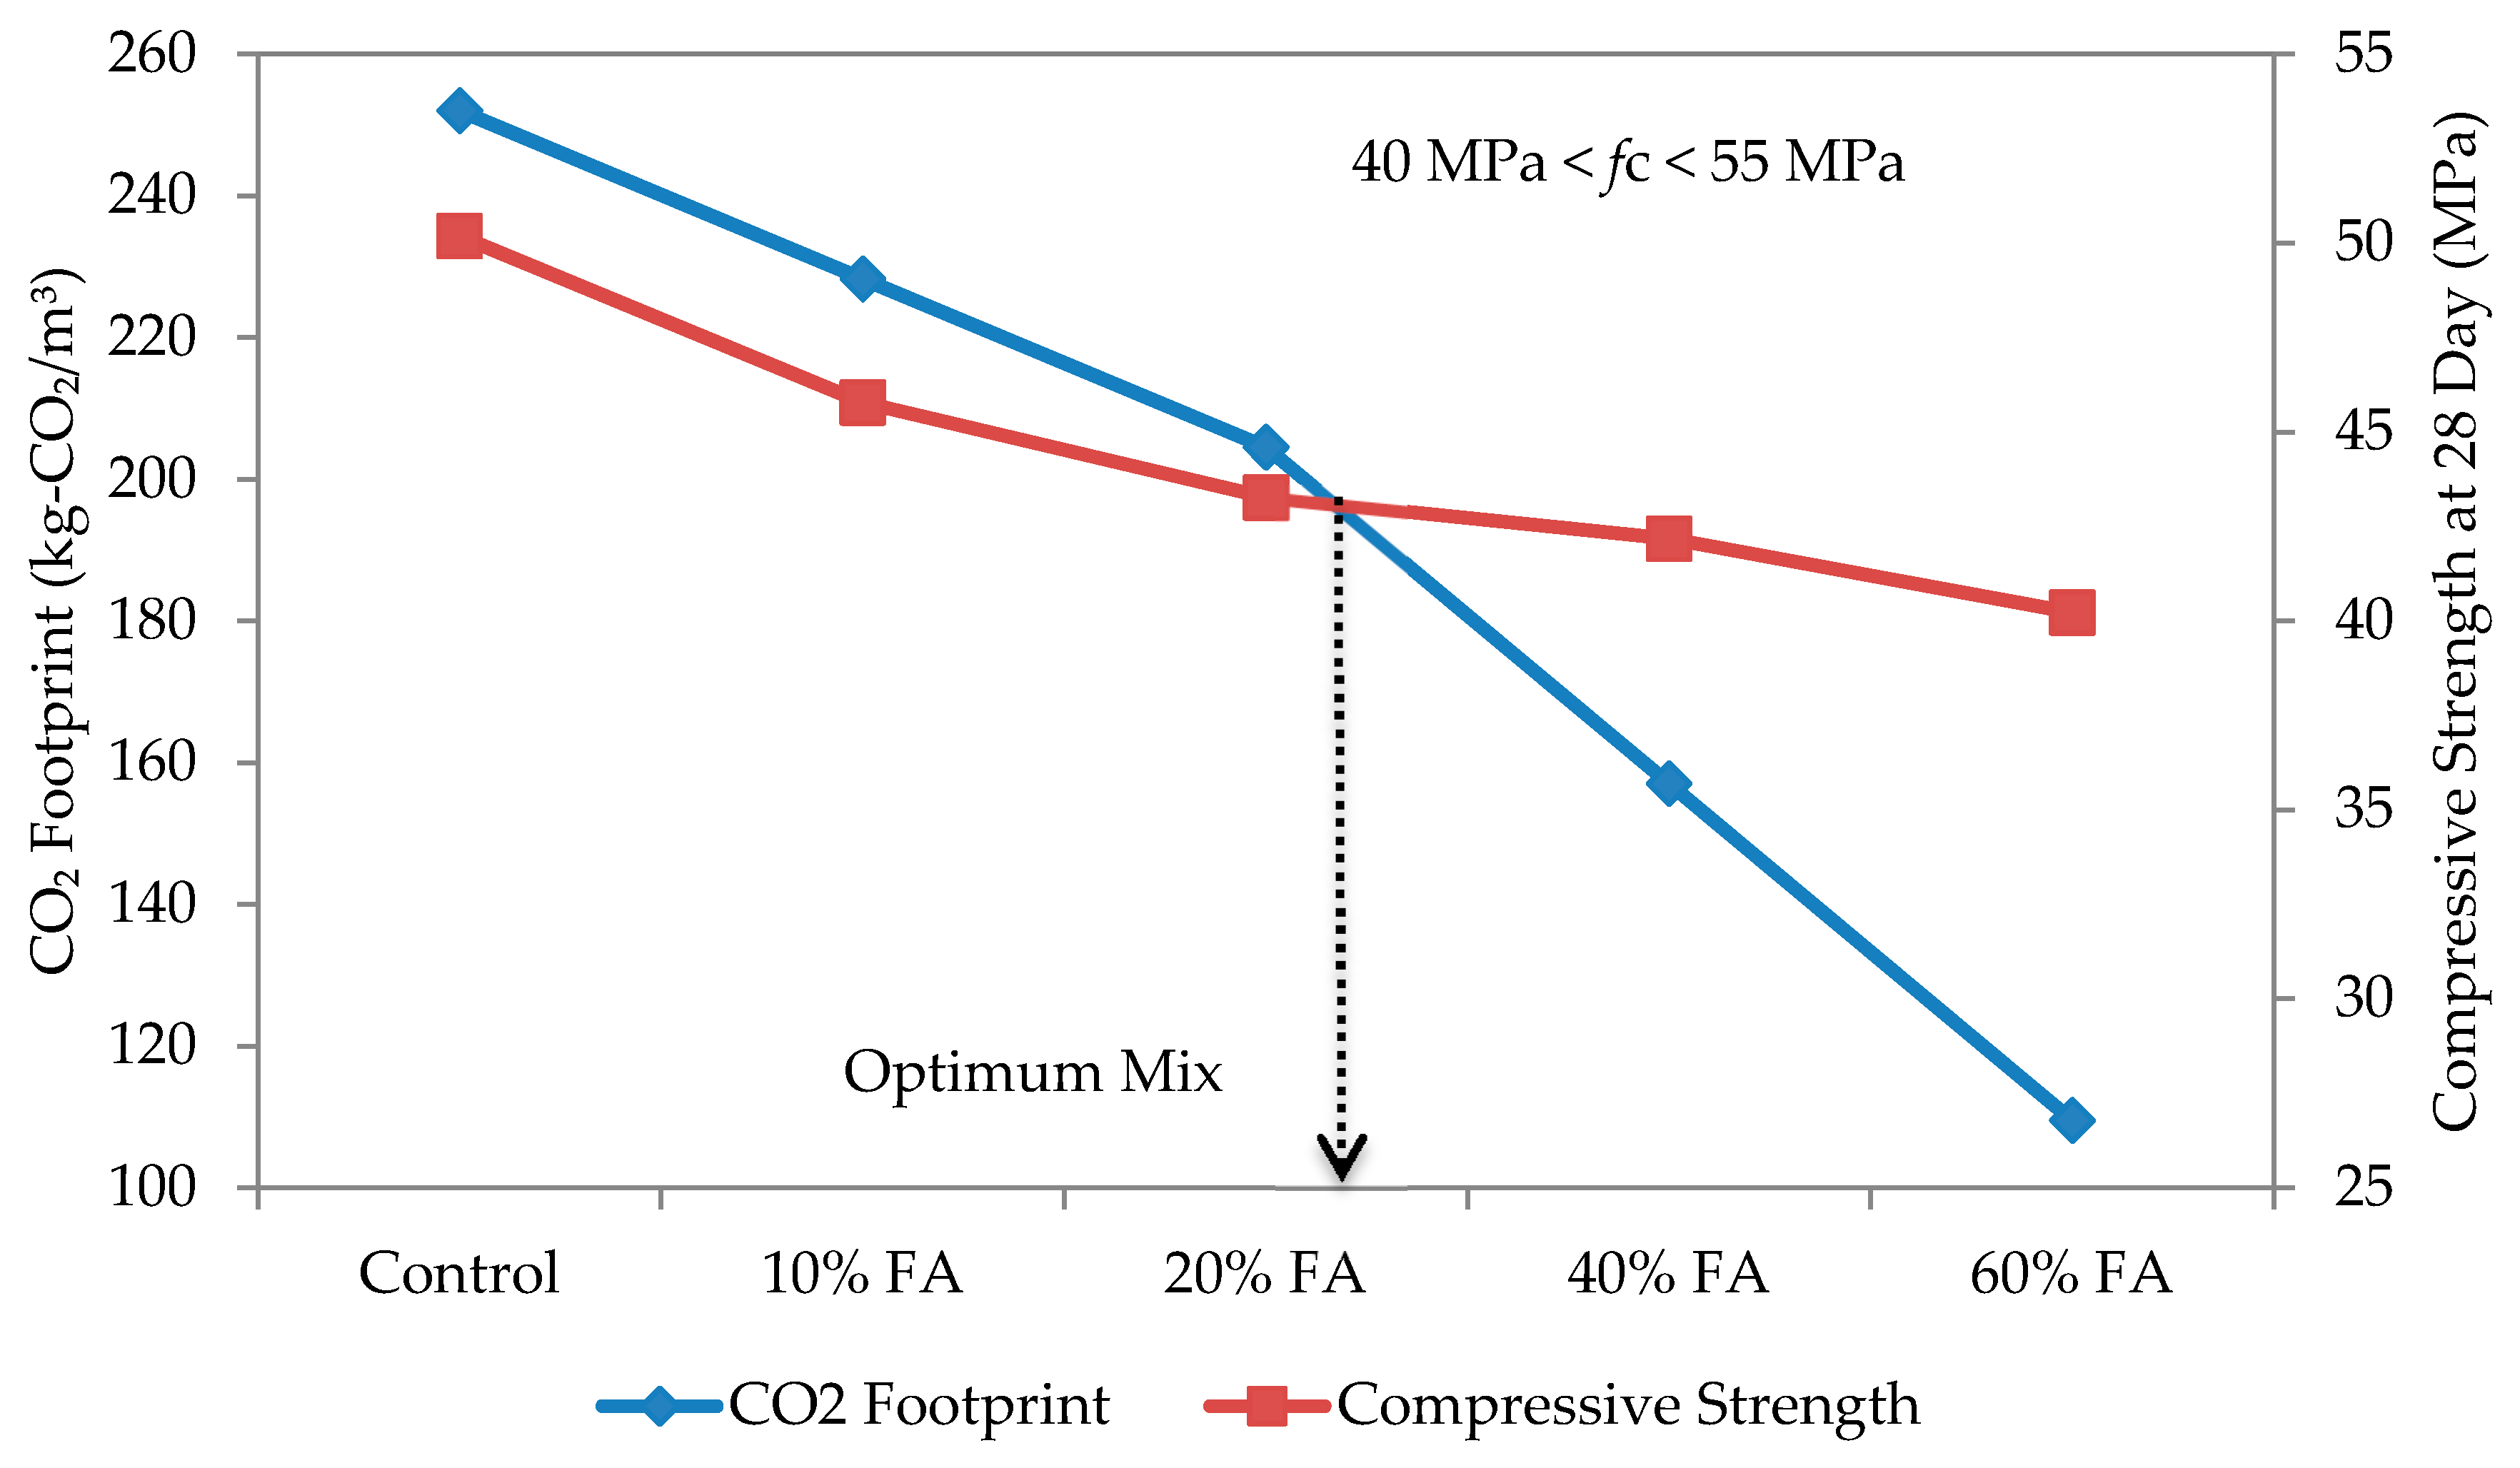
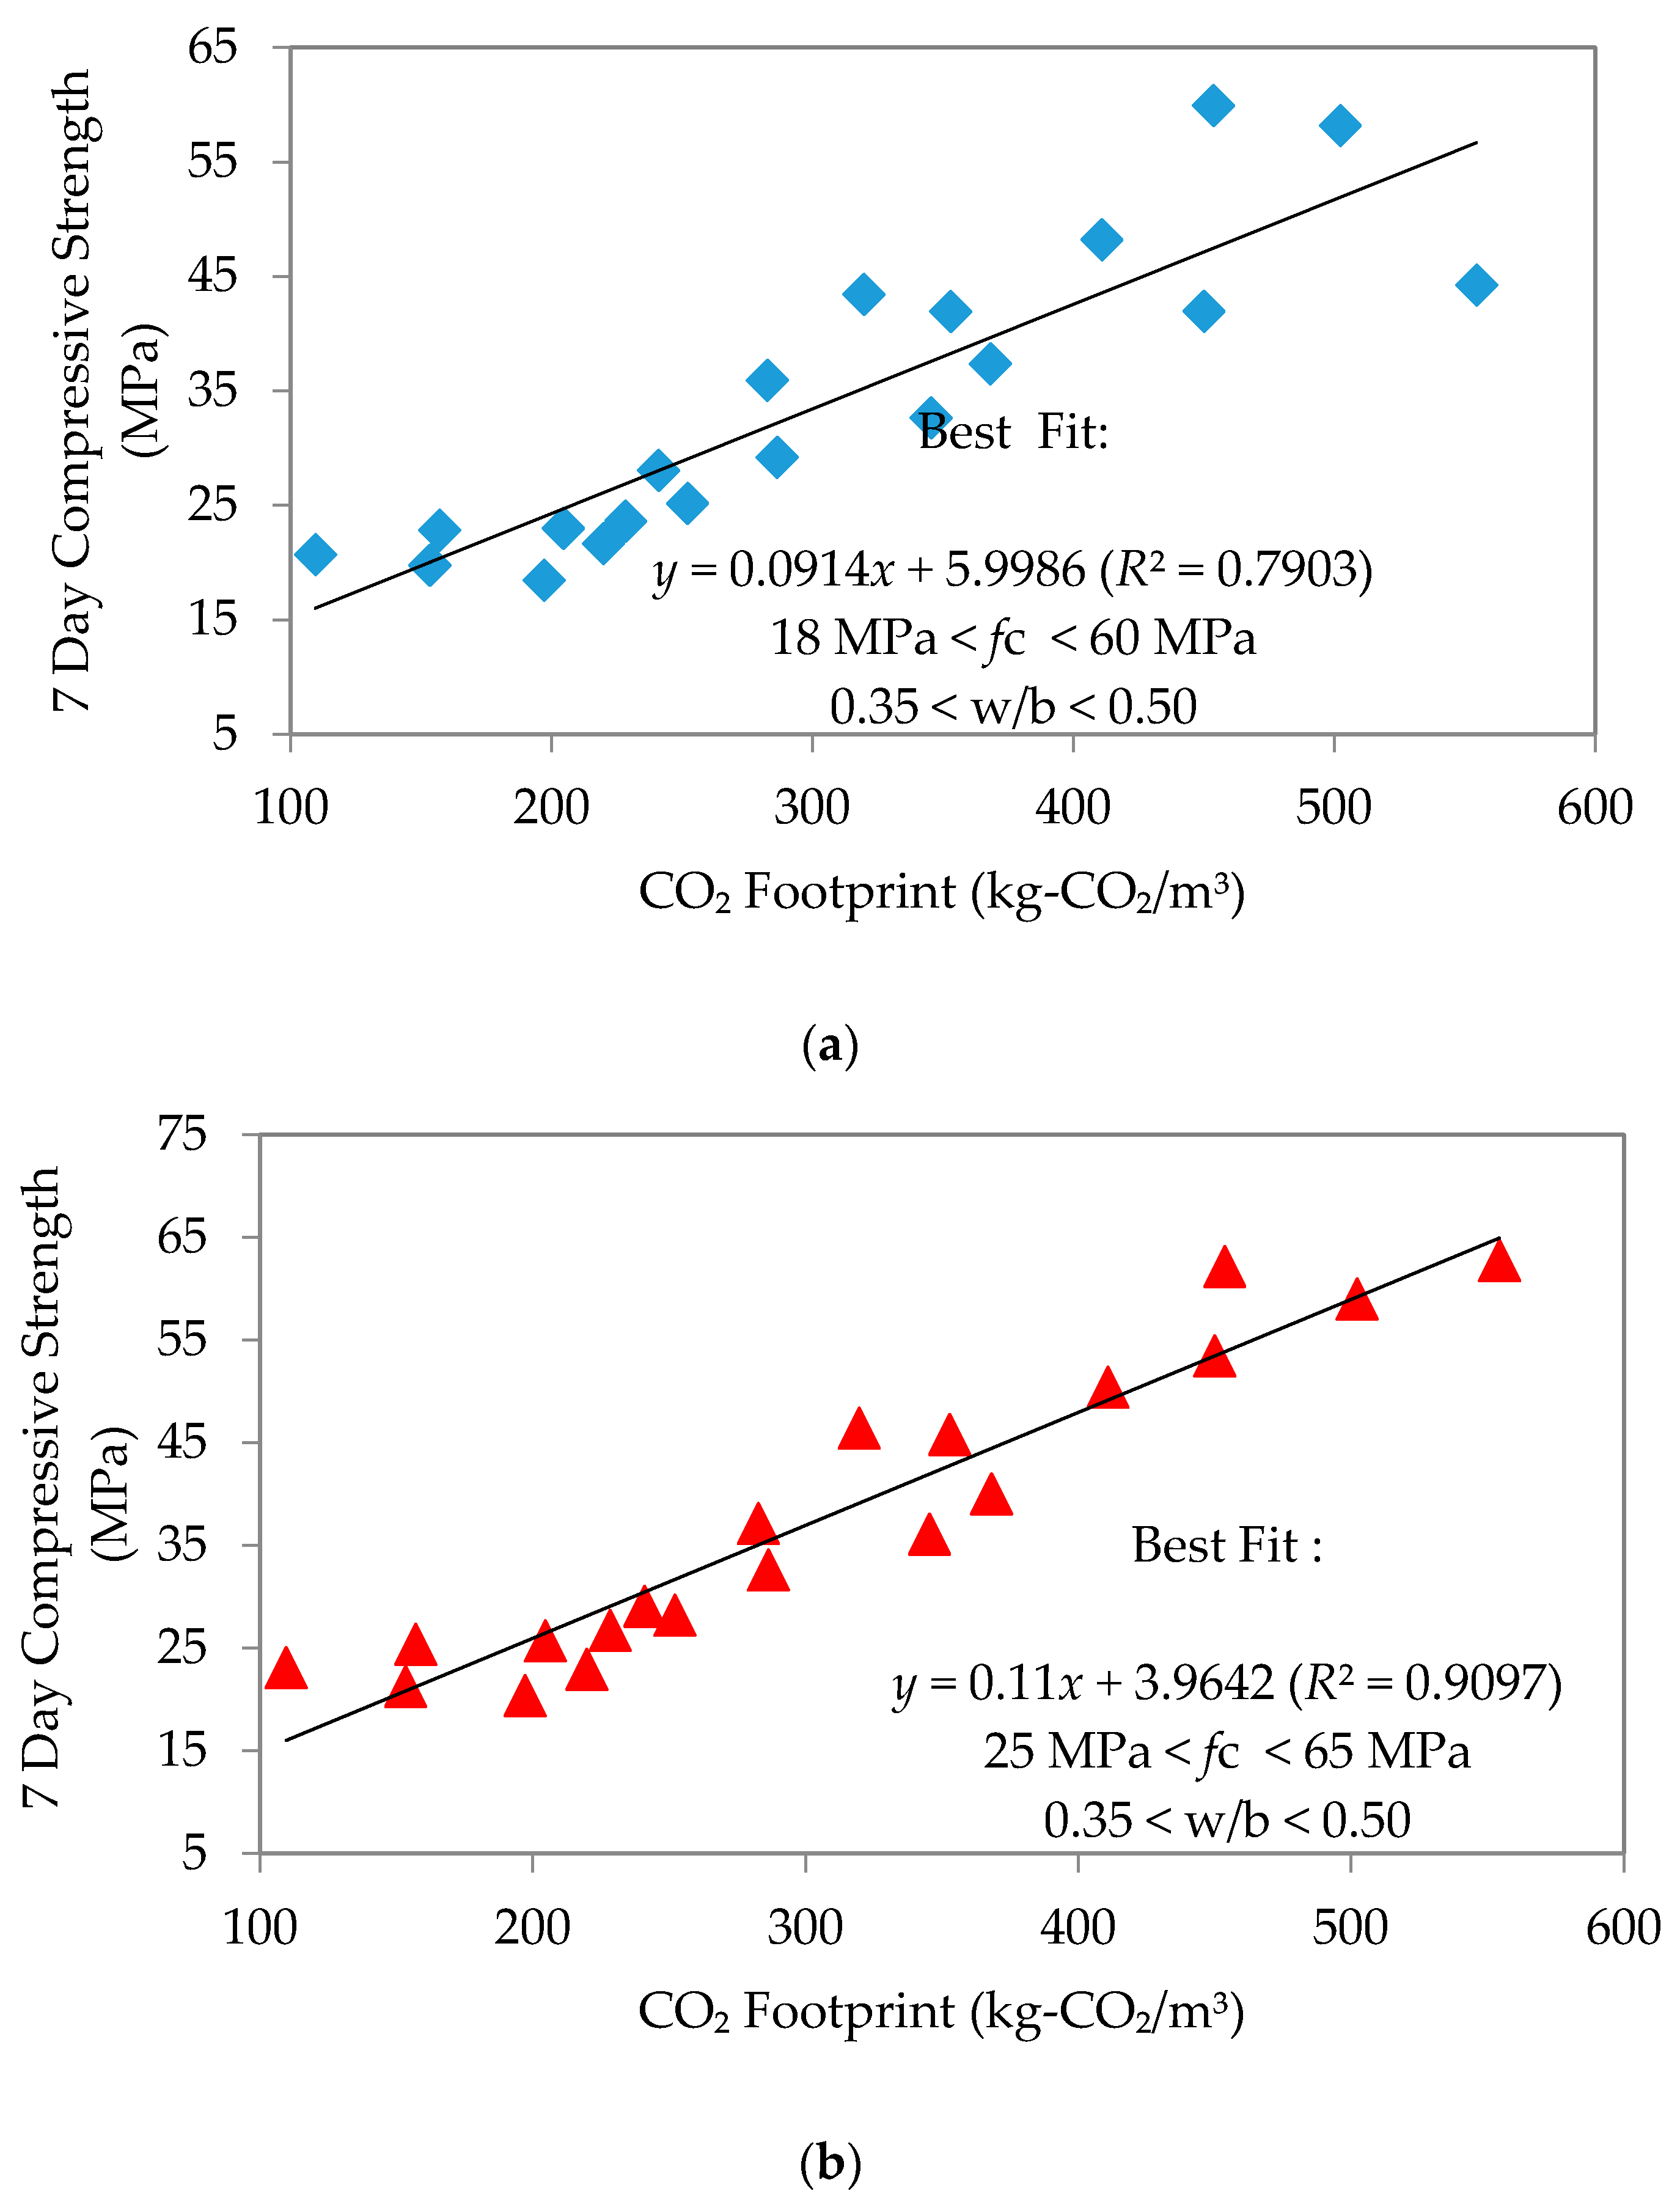
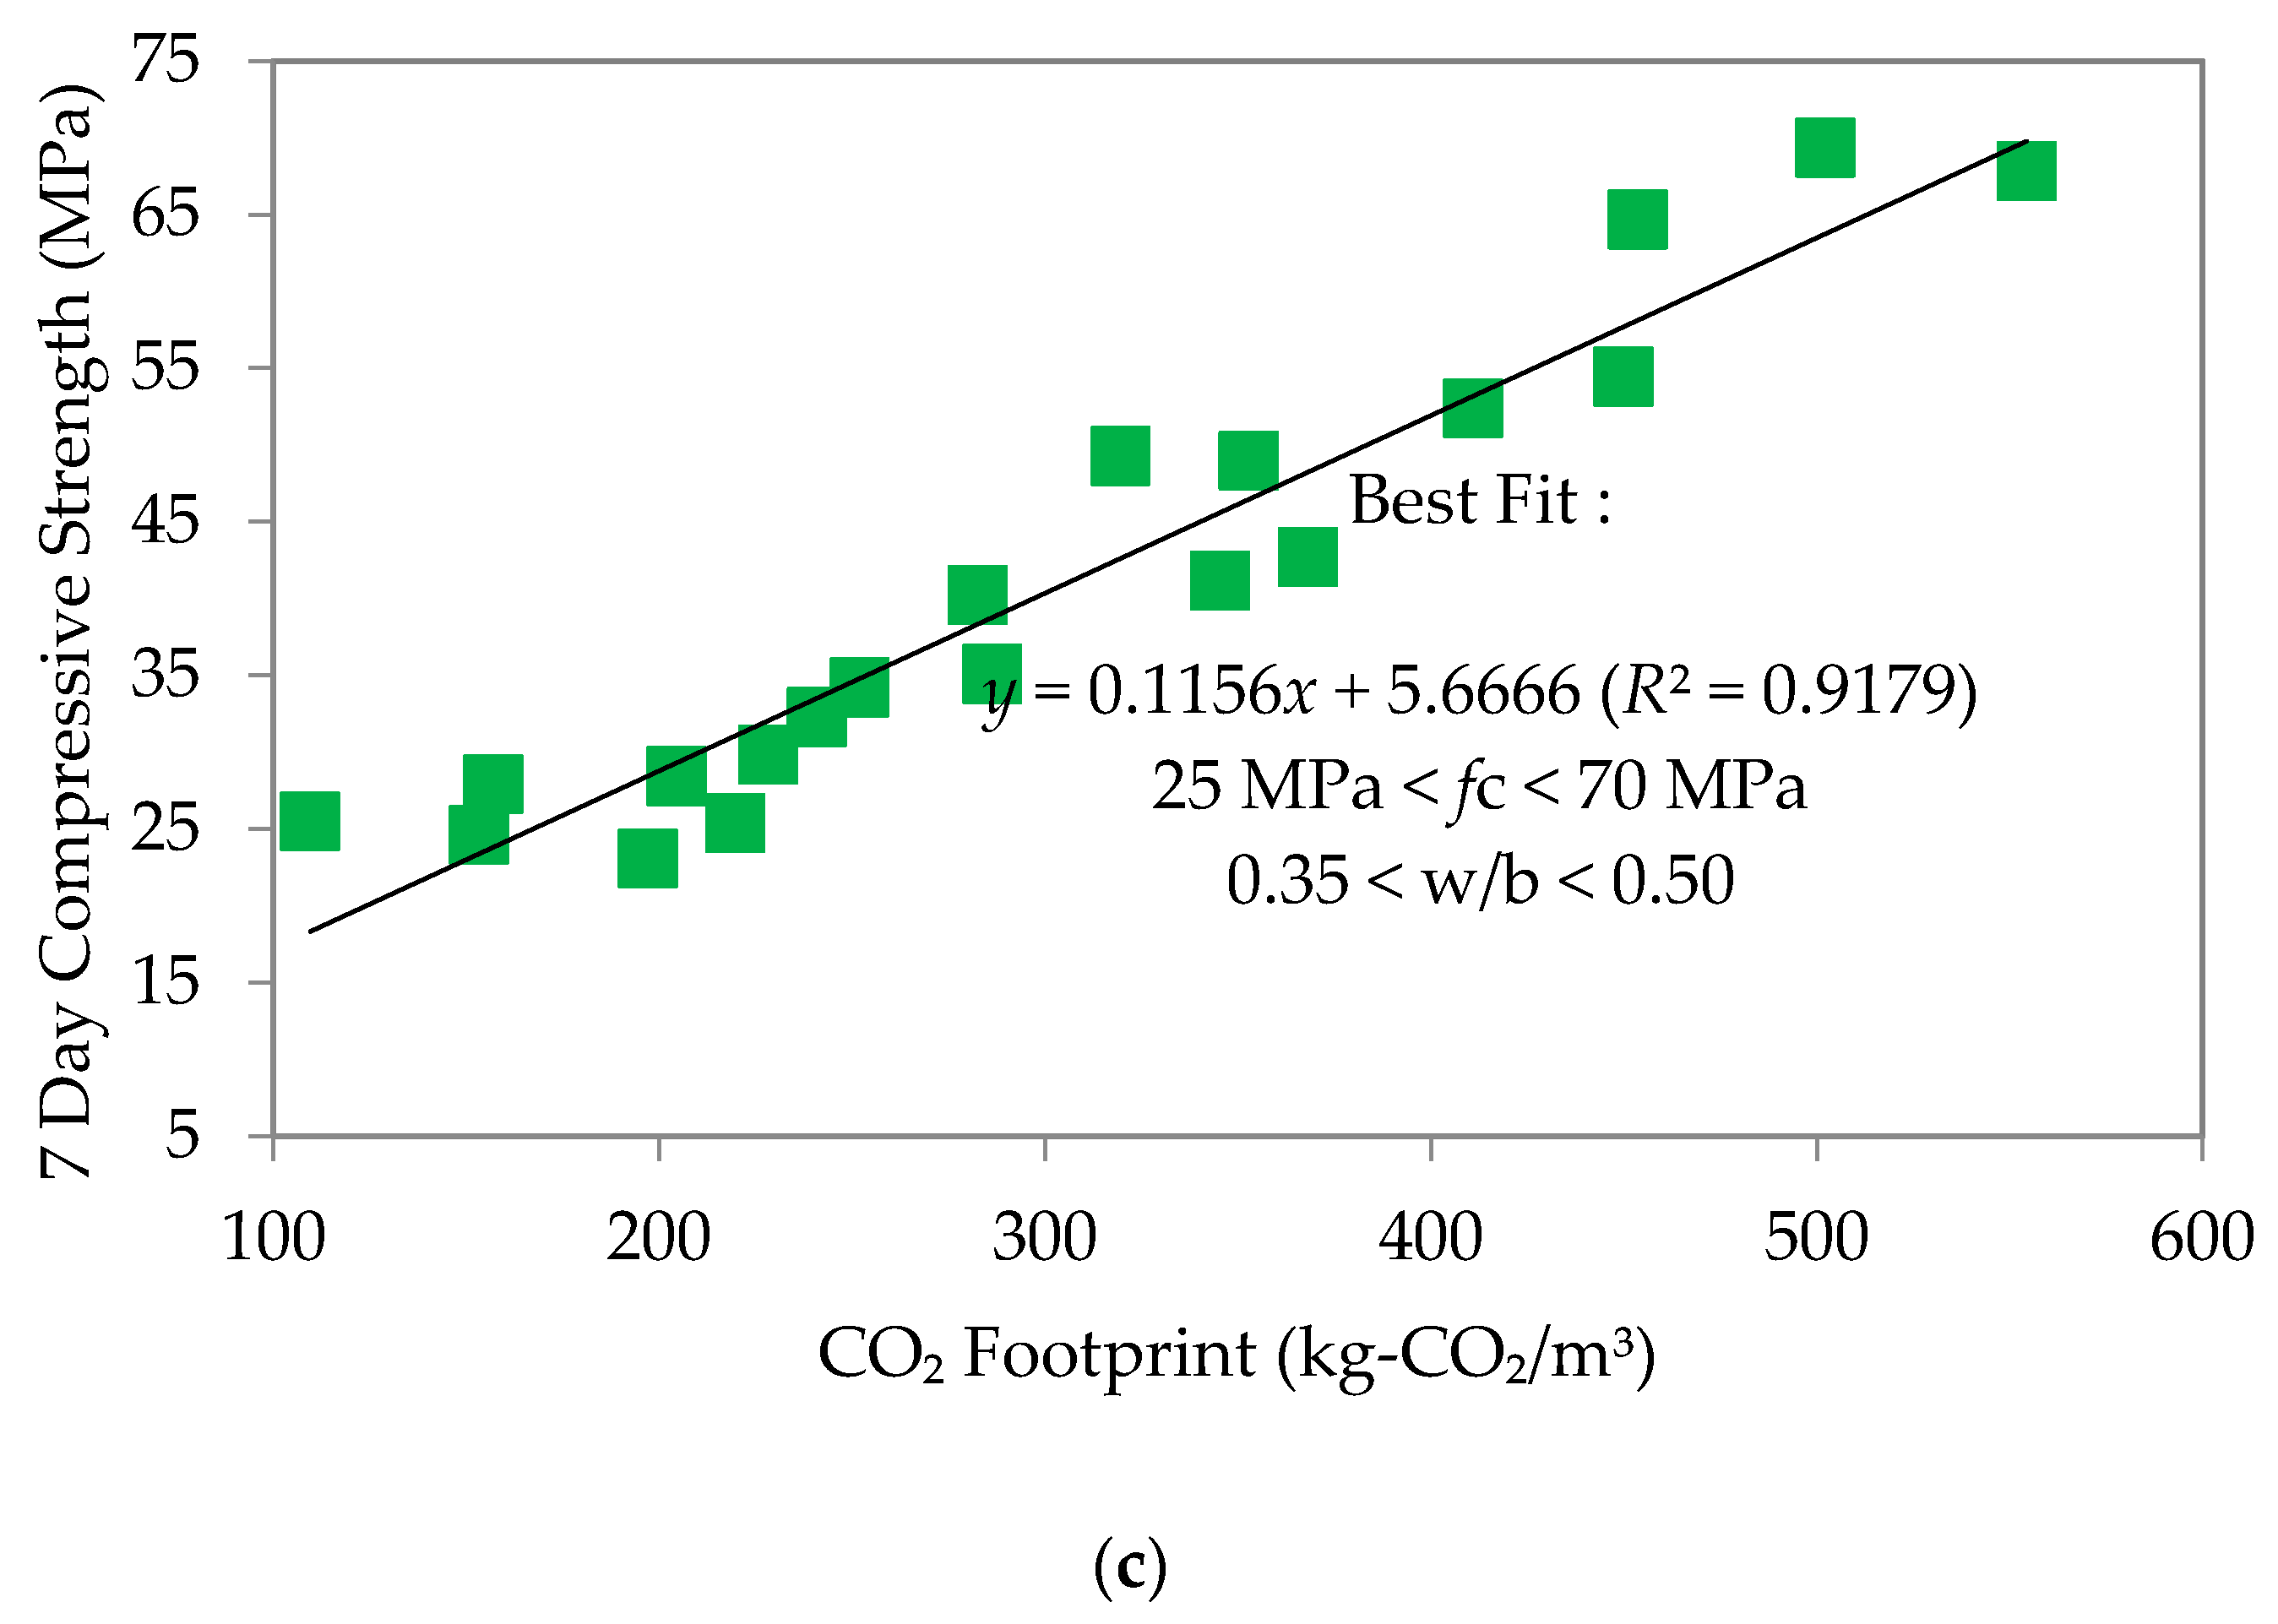
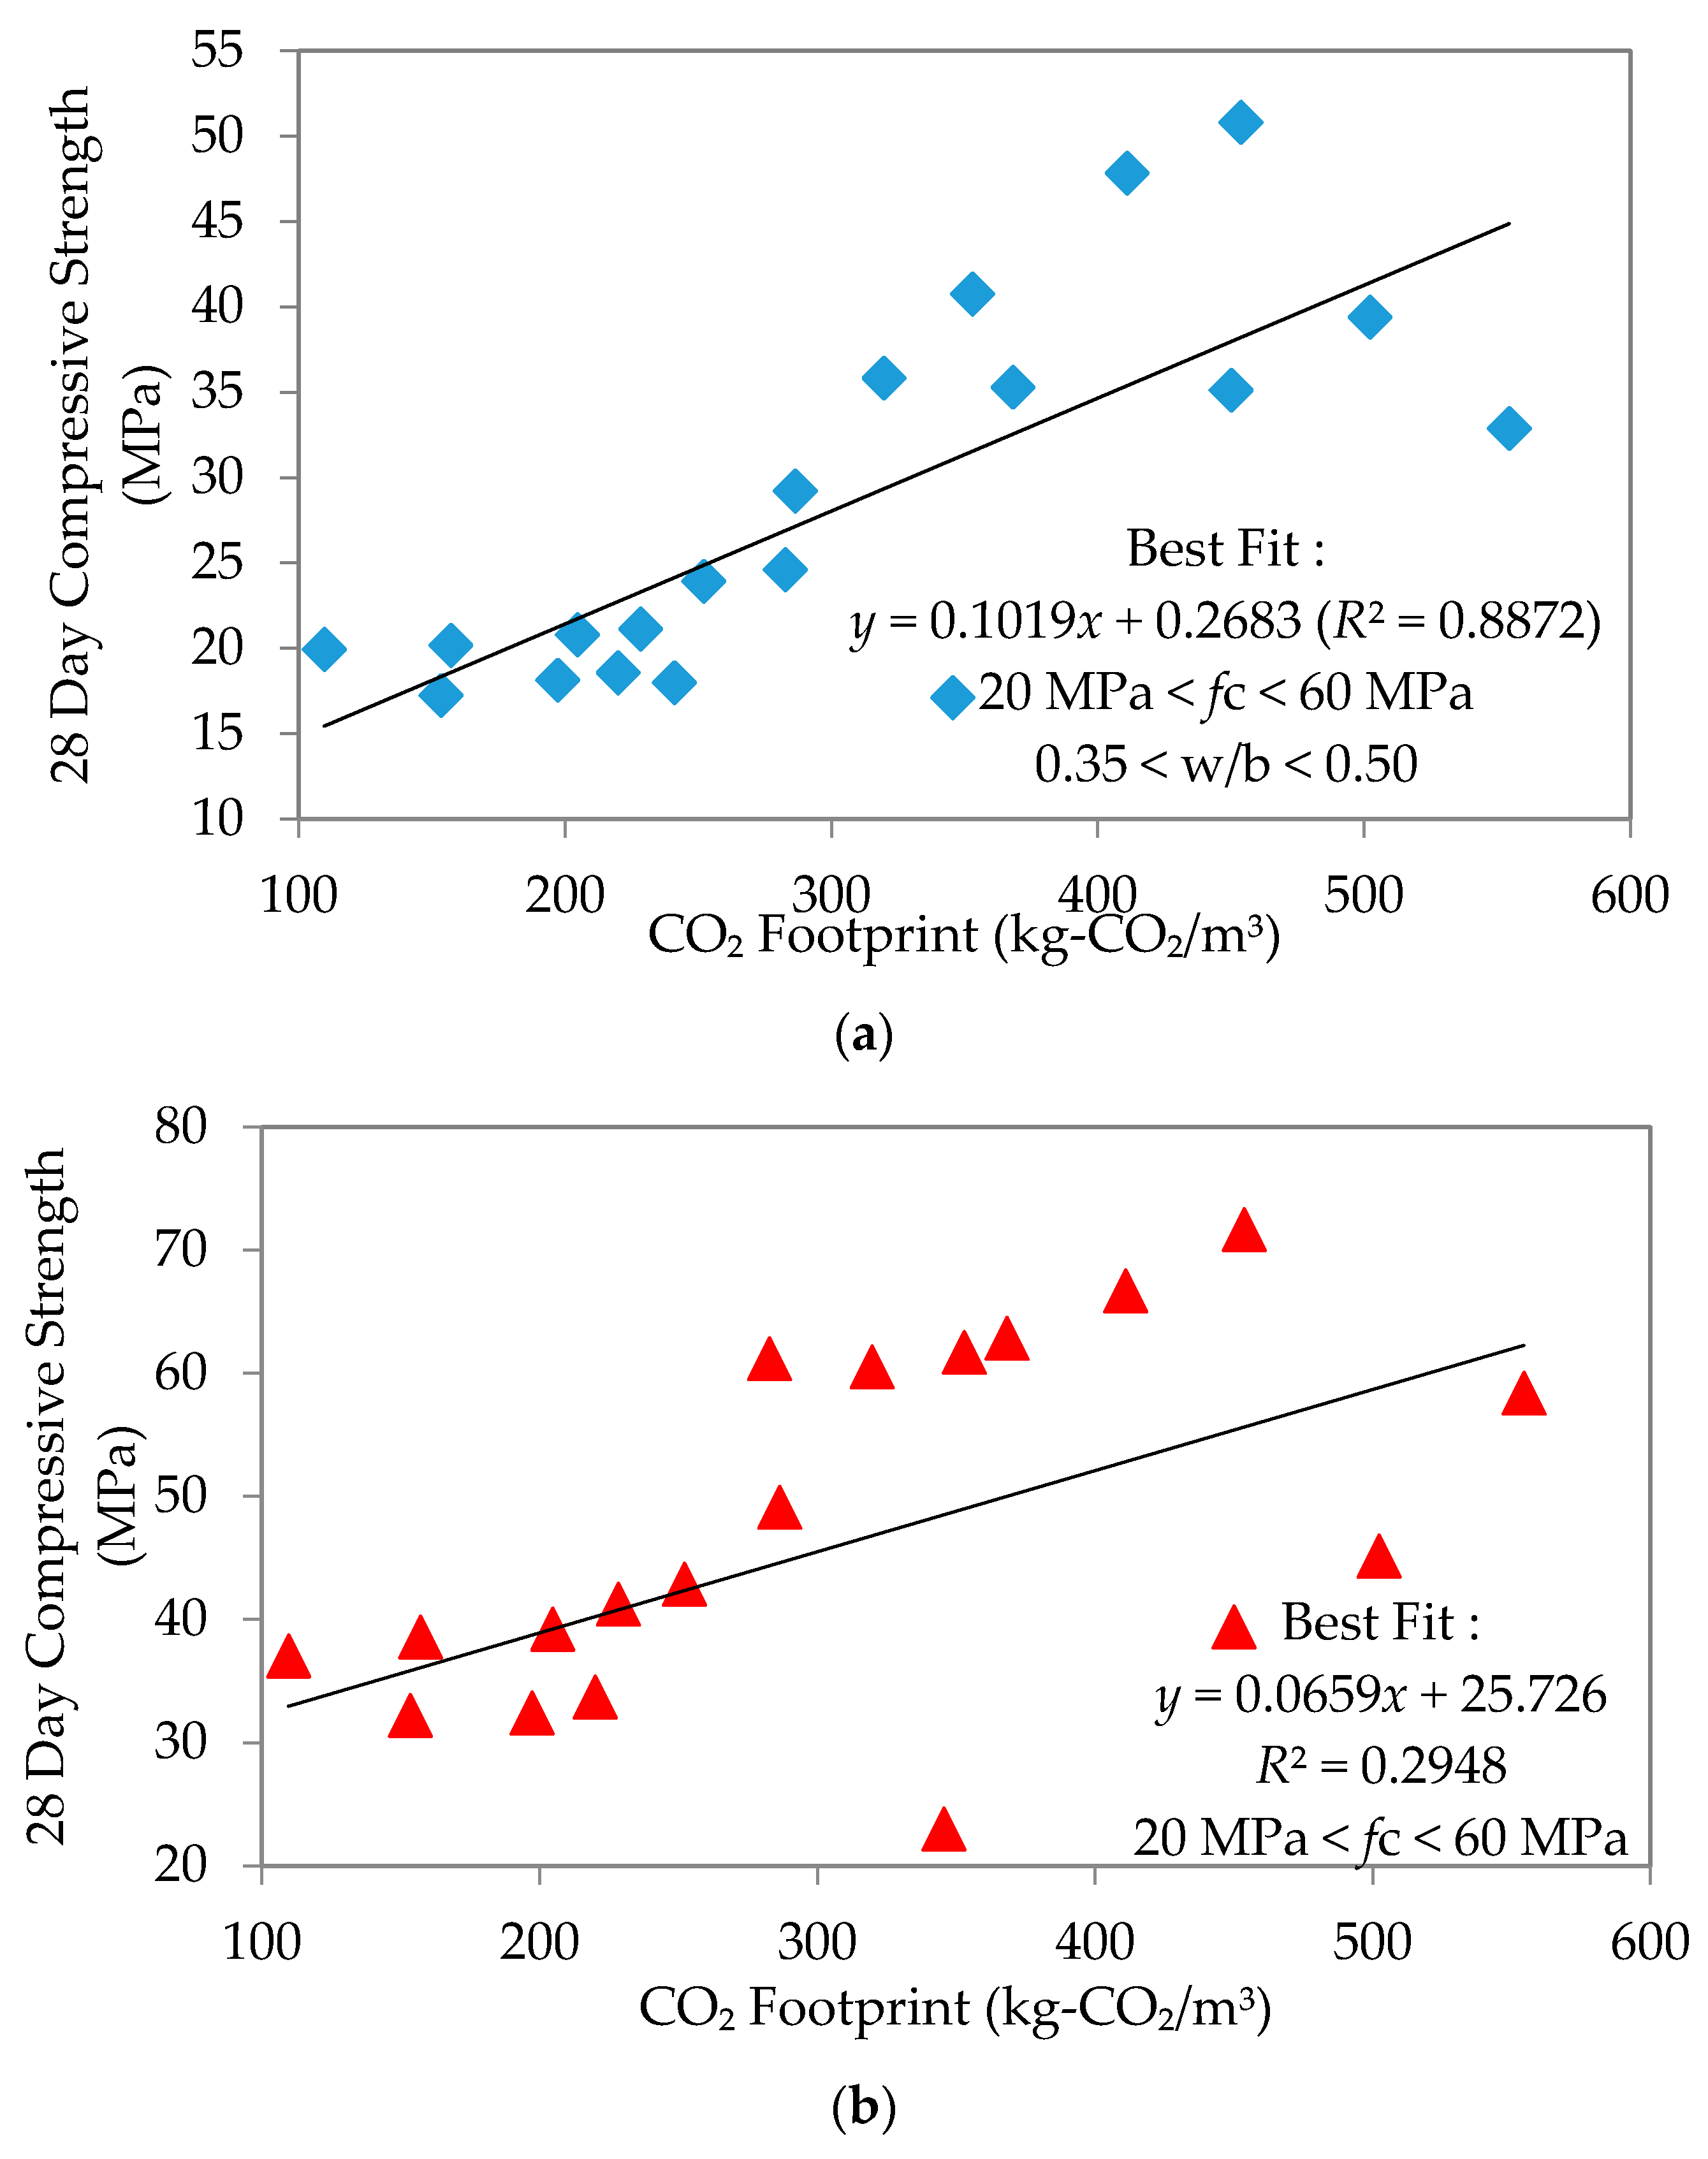
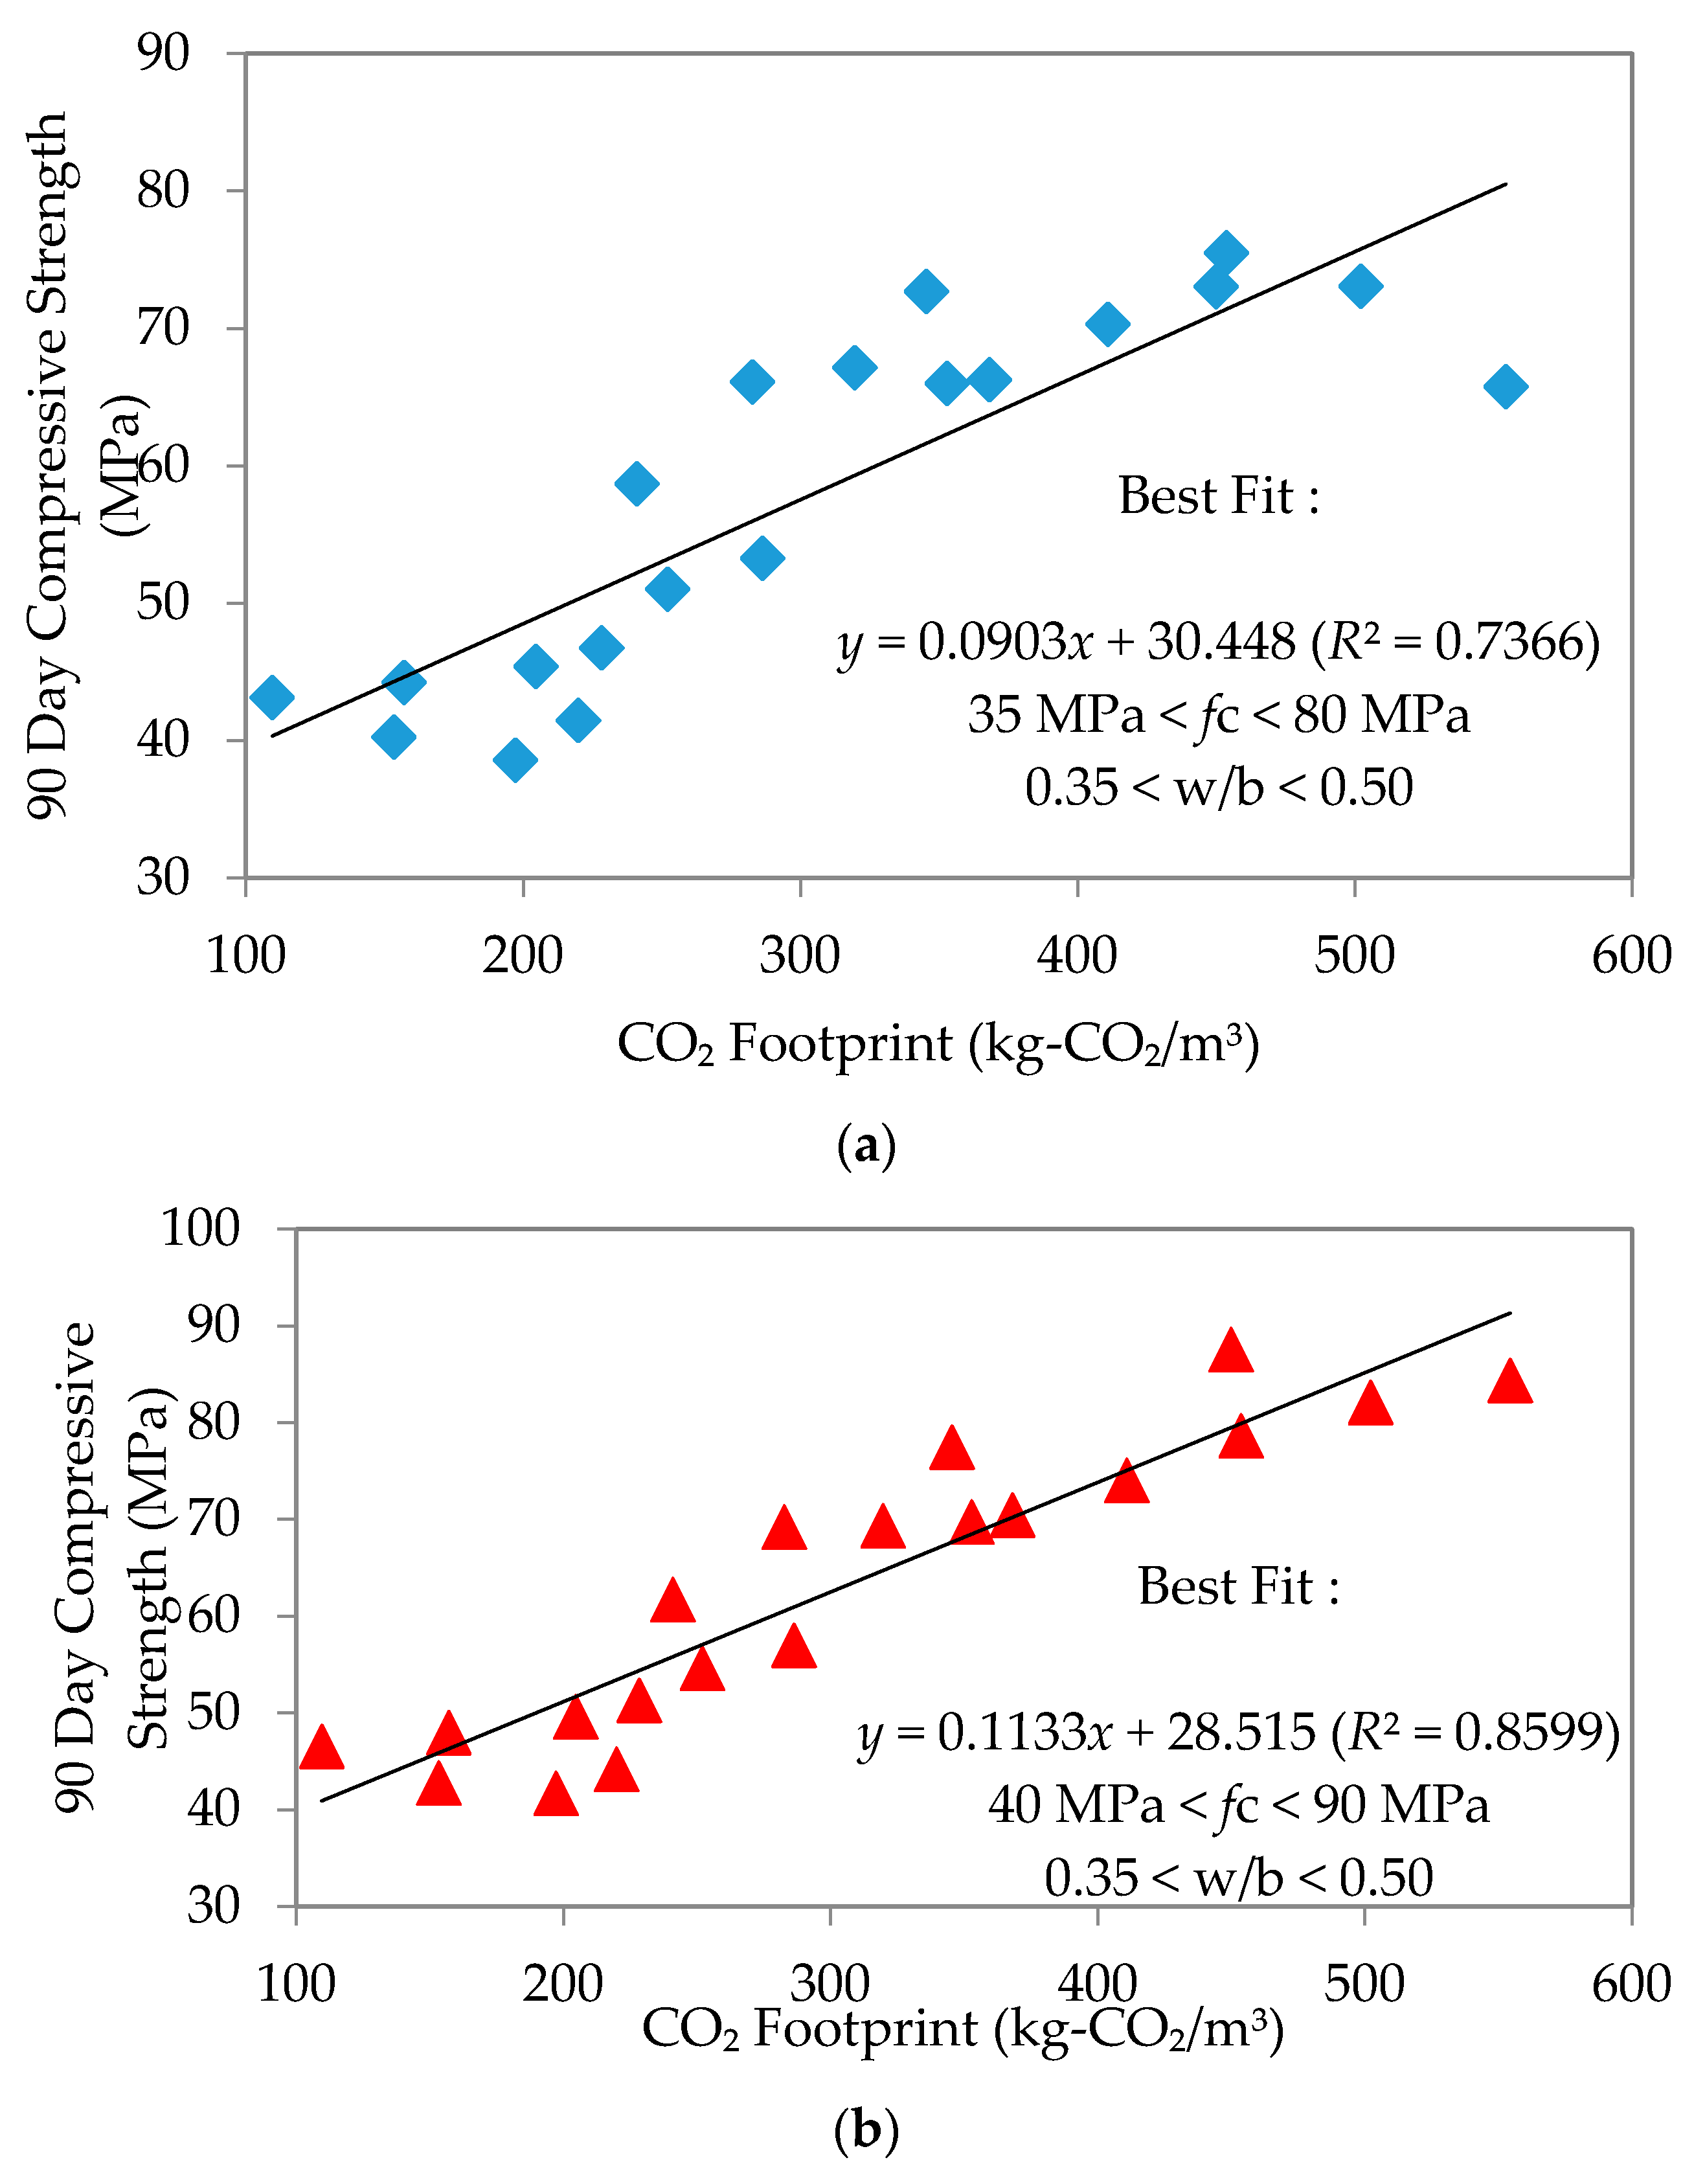
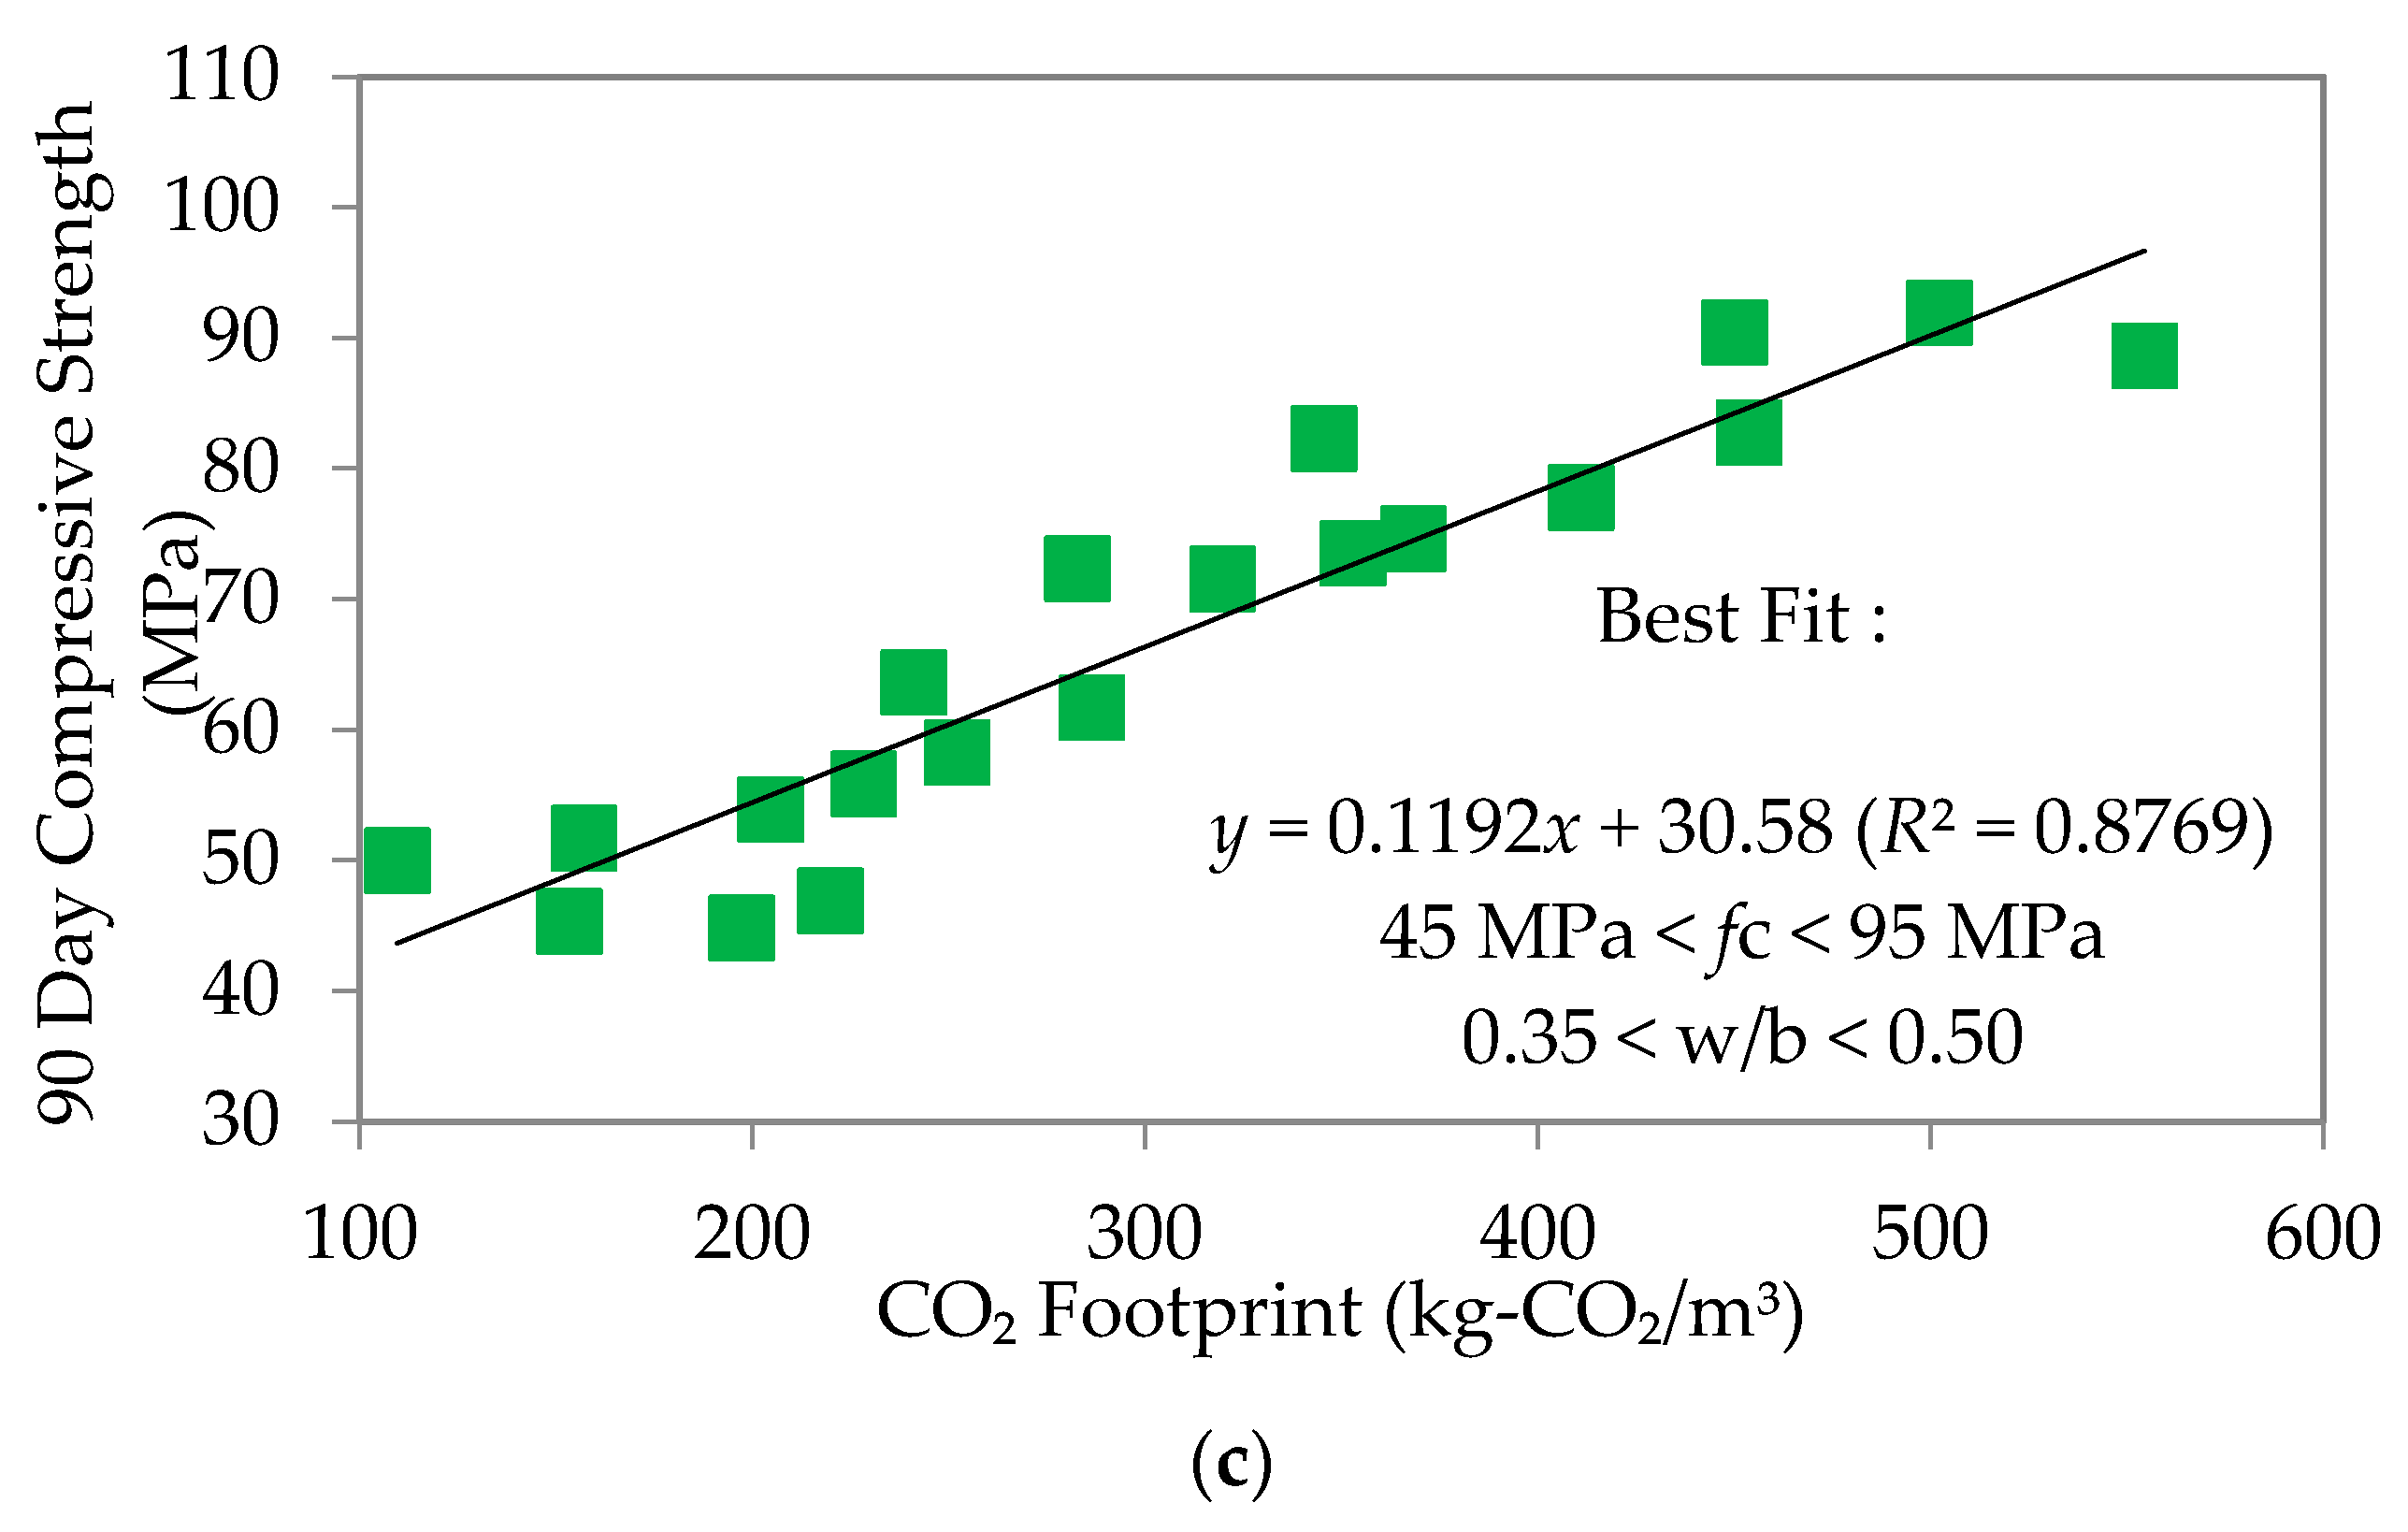
3.4. Compressive Strength versus Environmental Sustainability
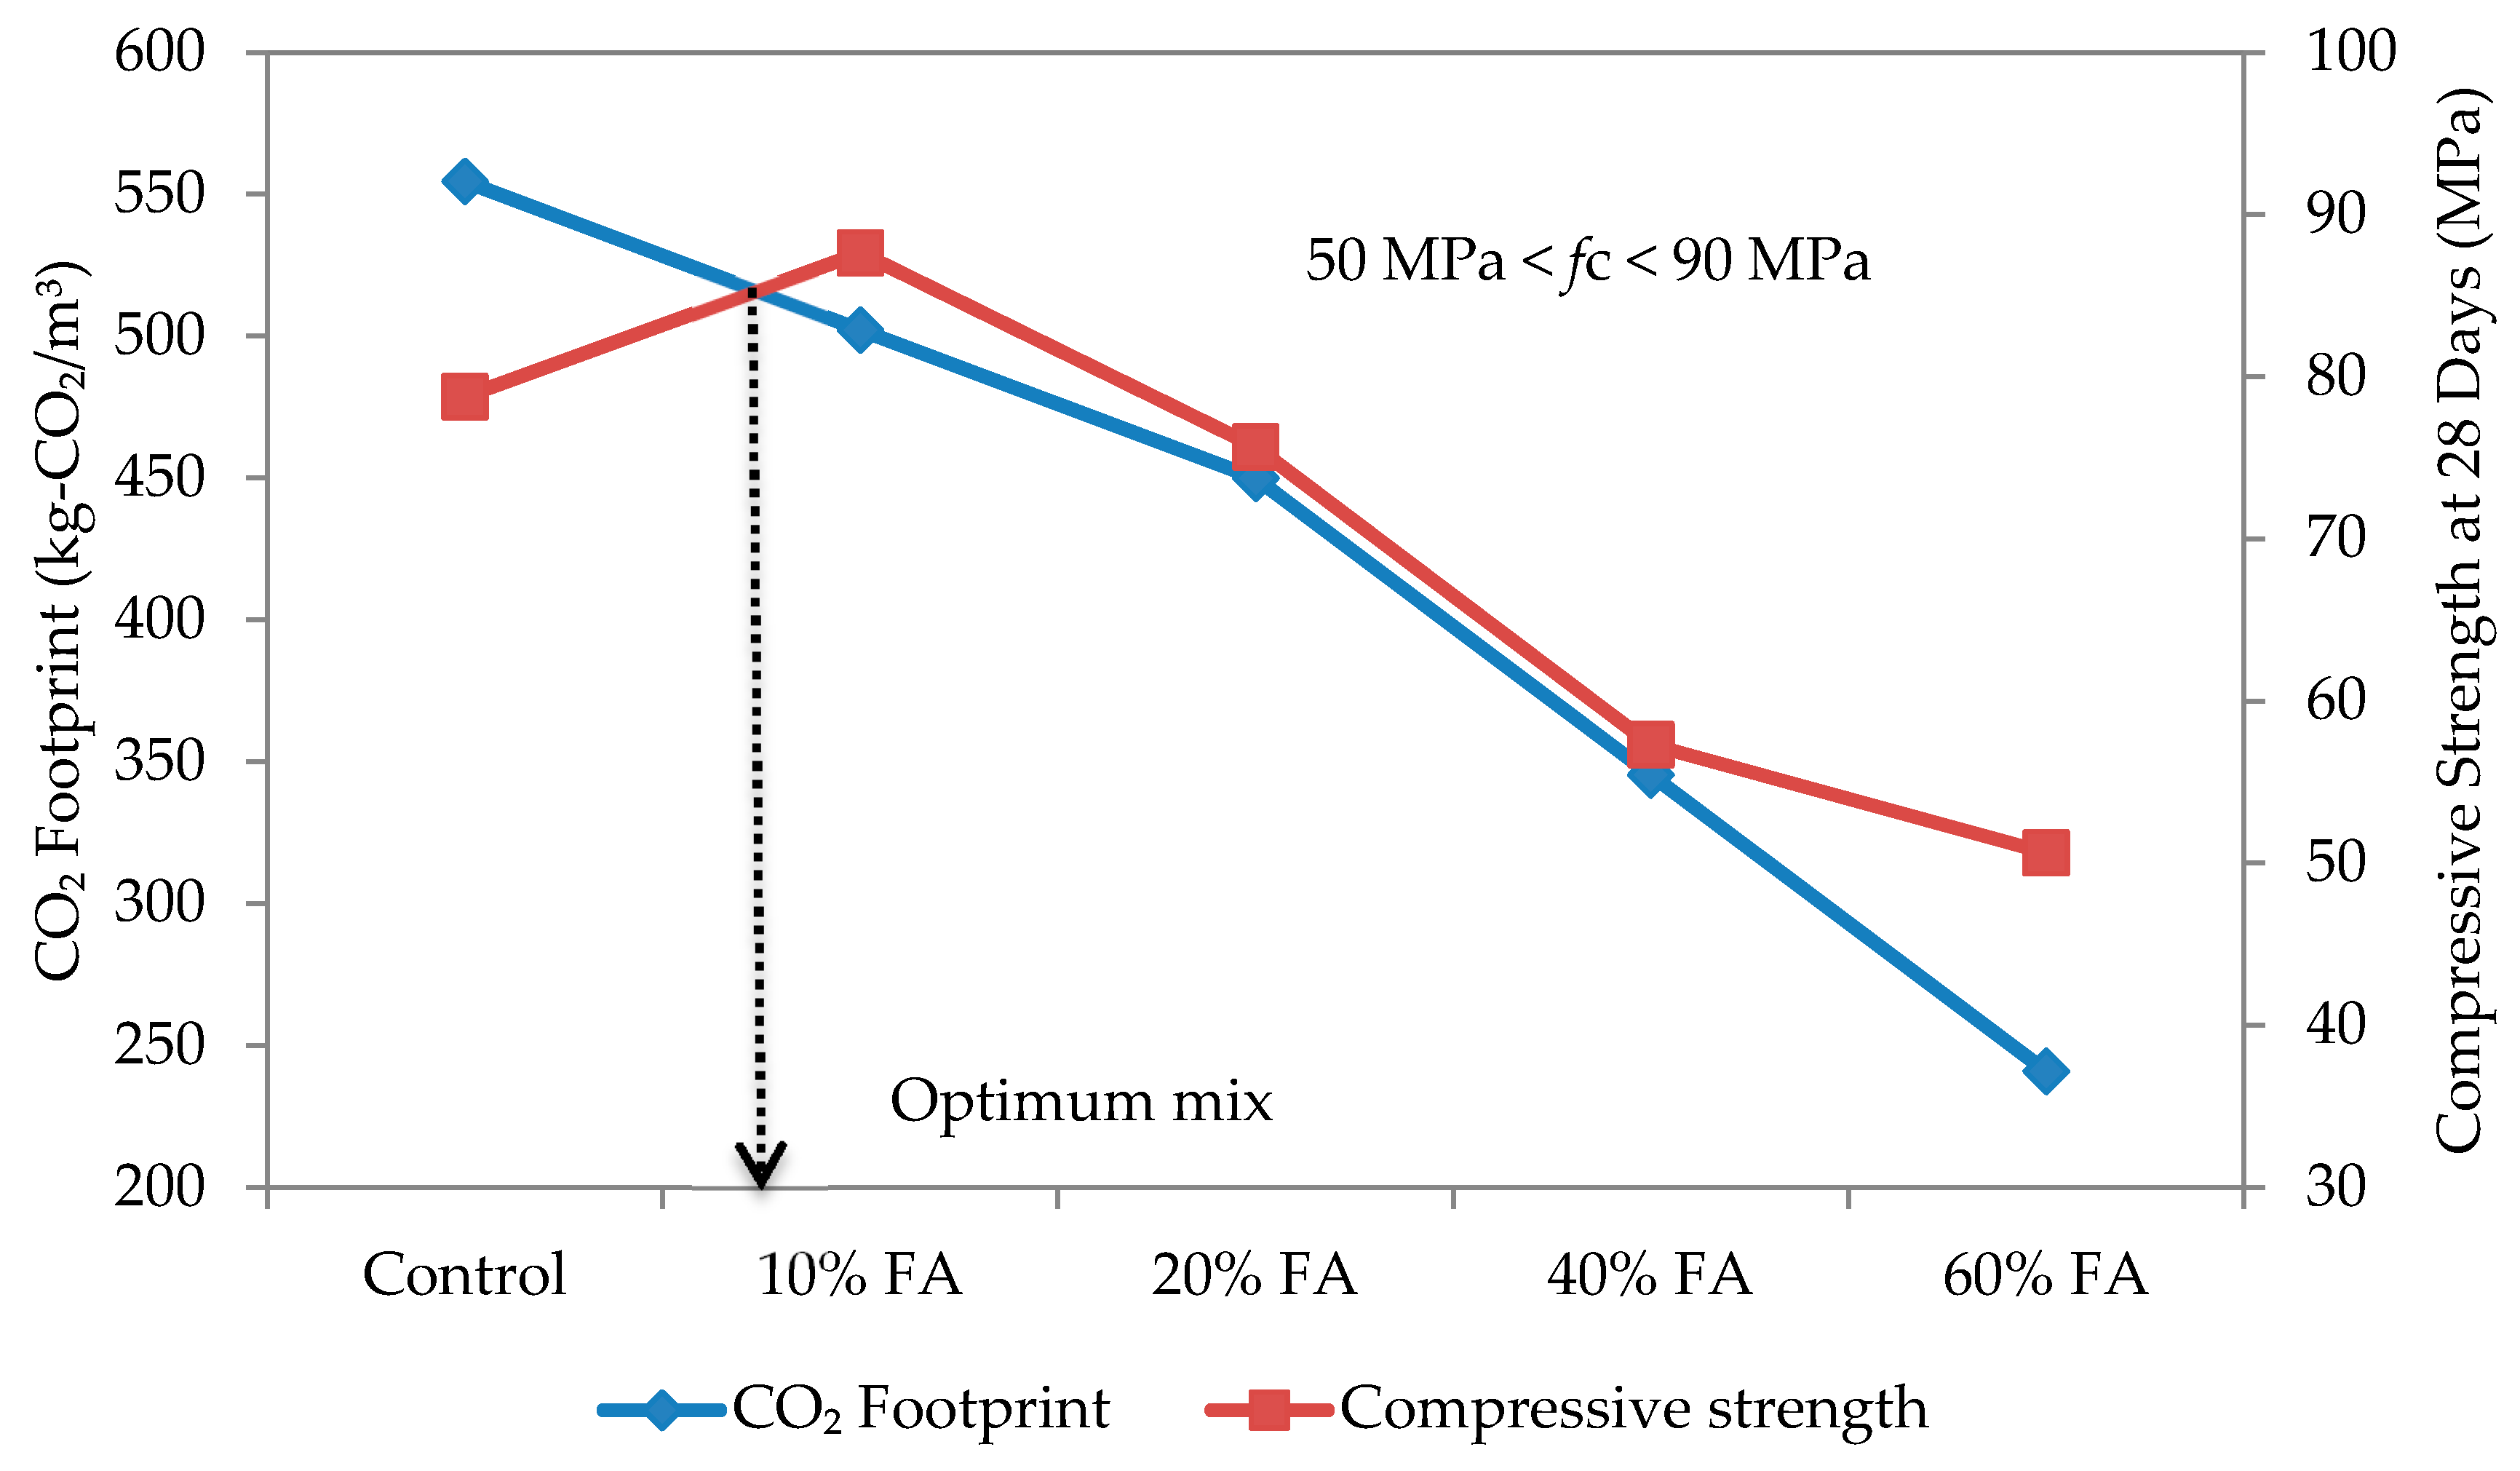
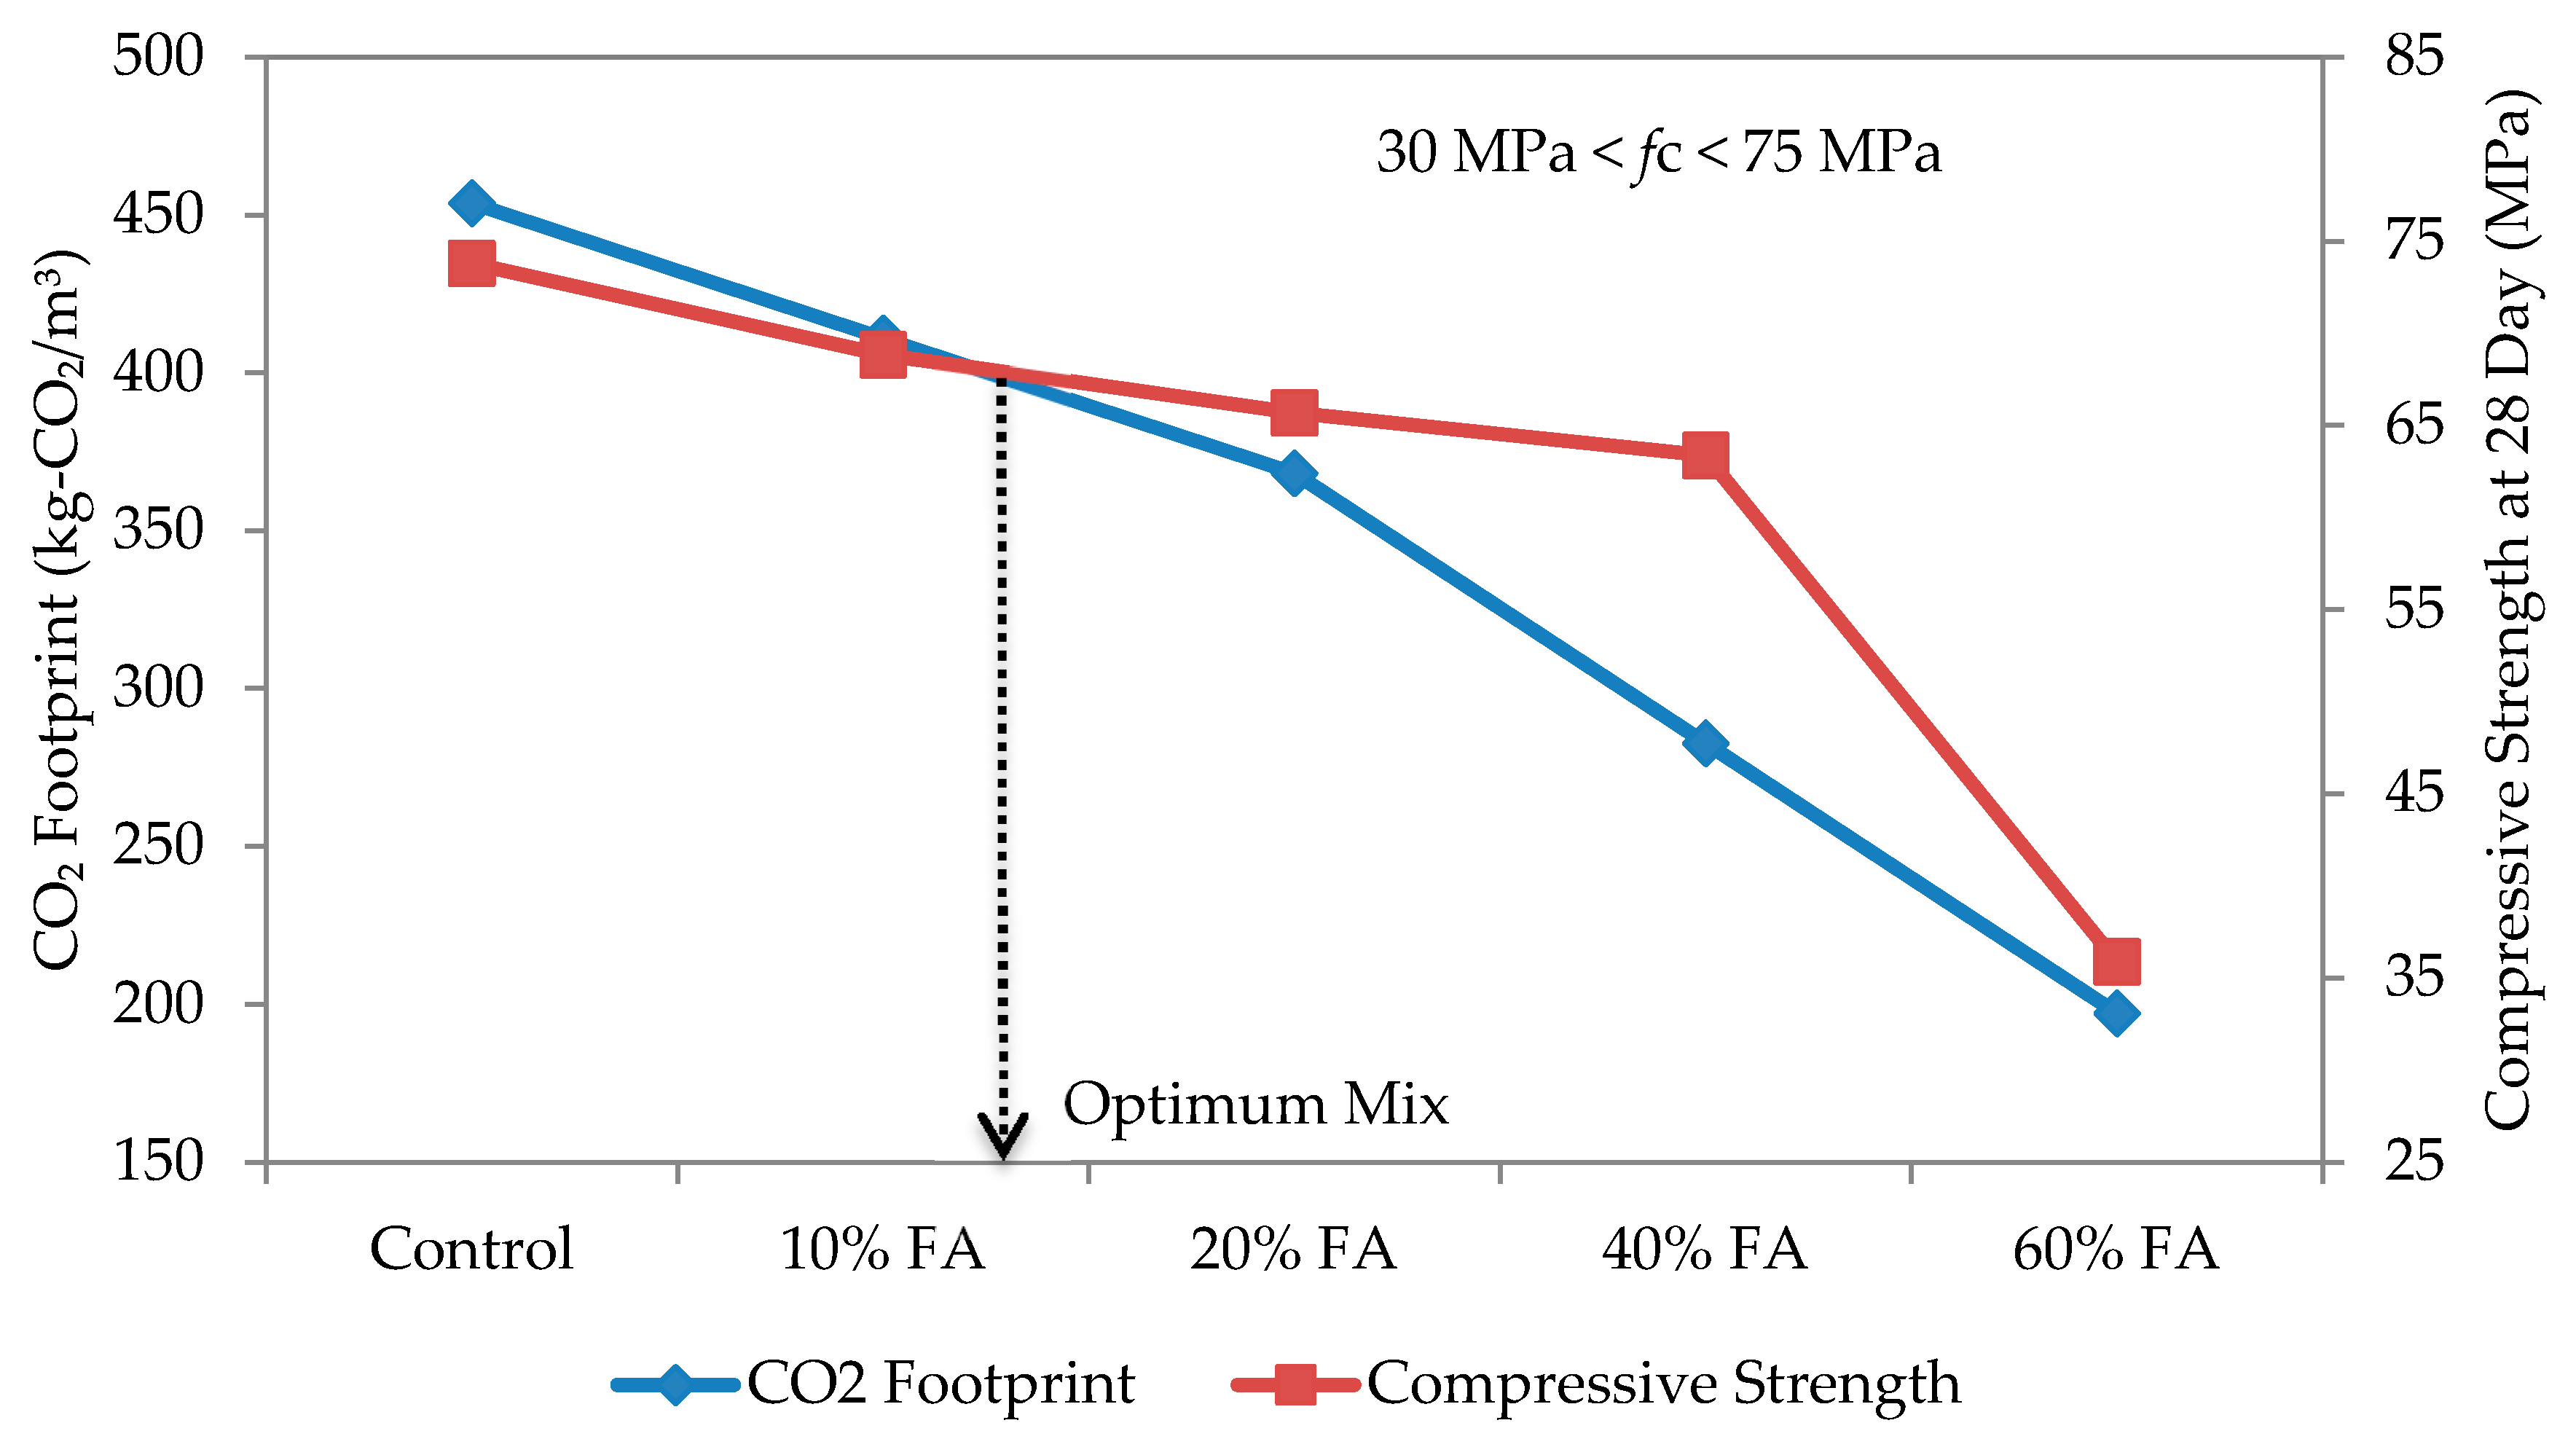
3.5. Determination of Optimum Mixes
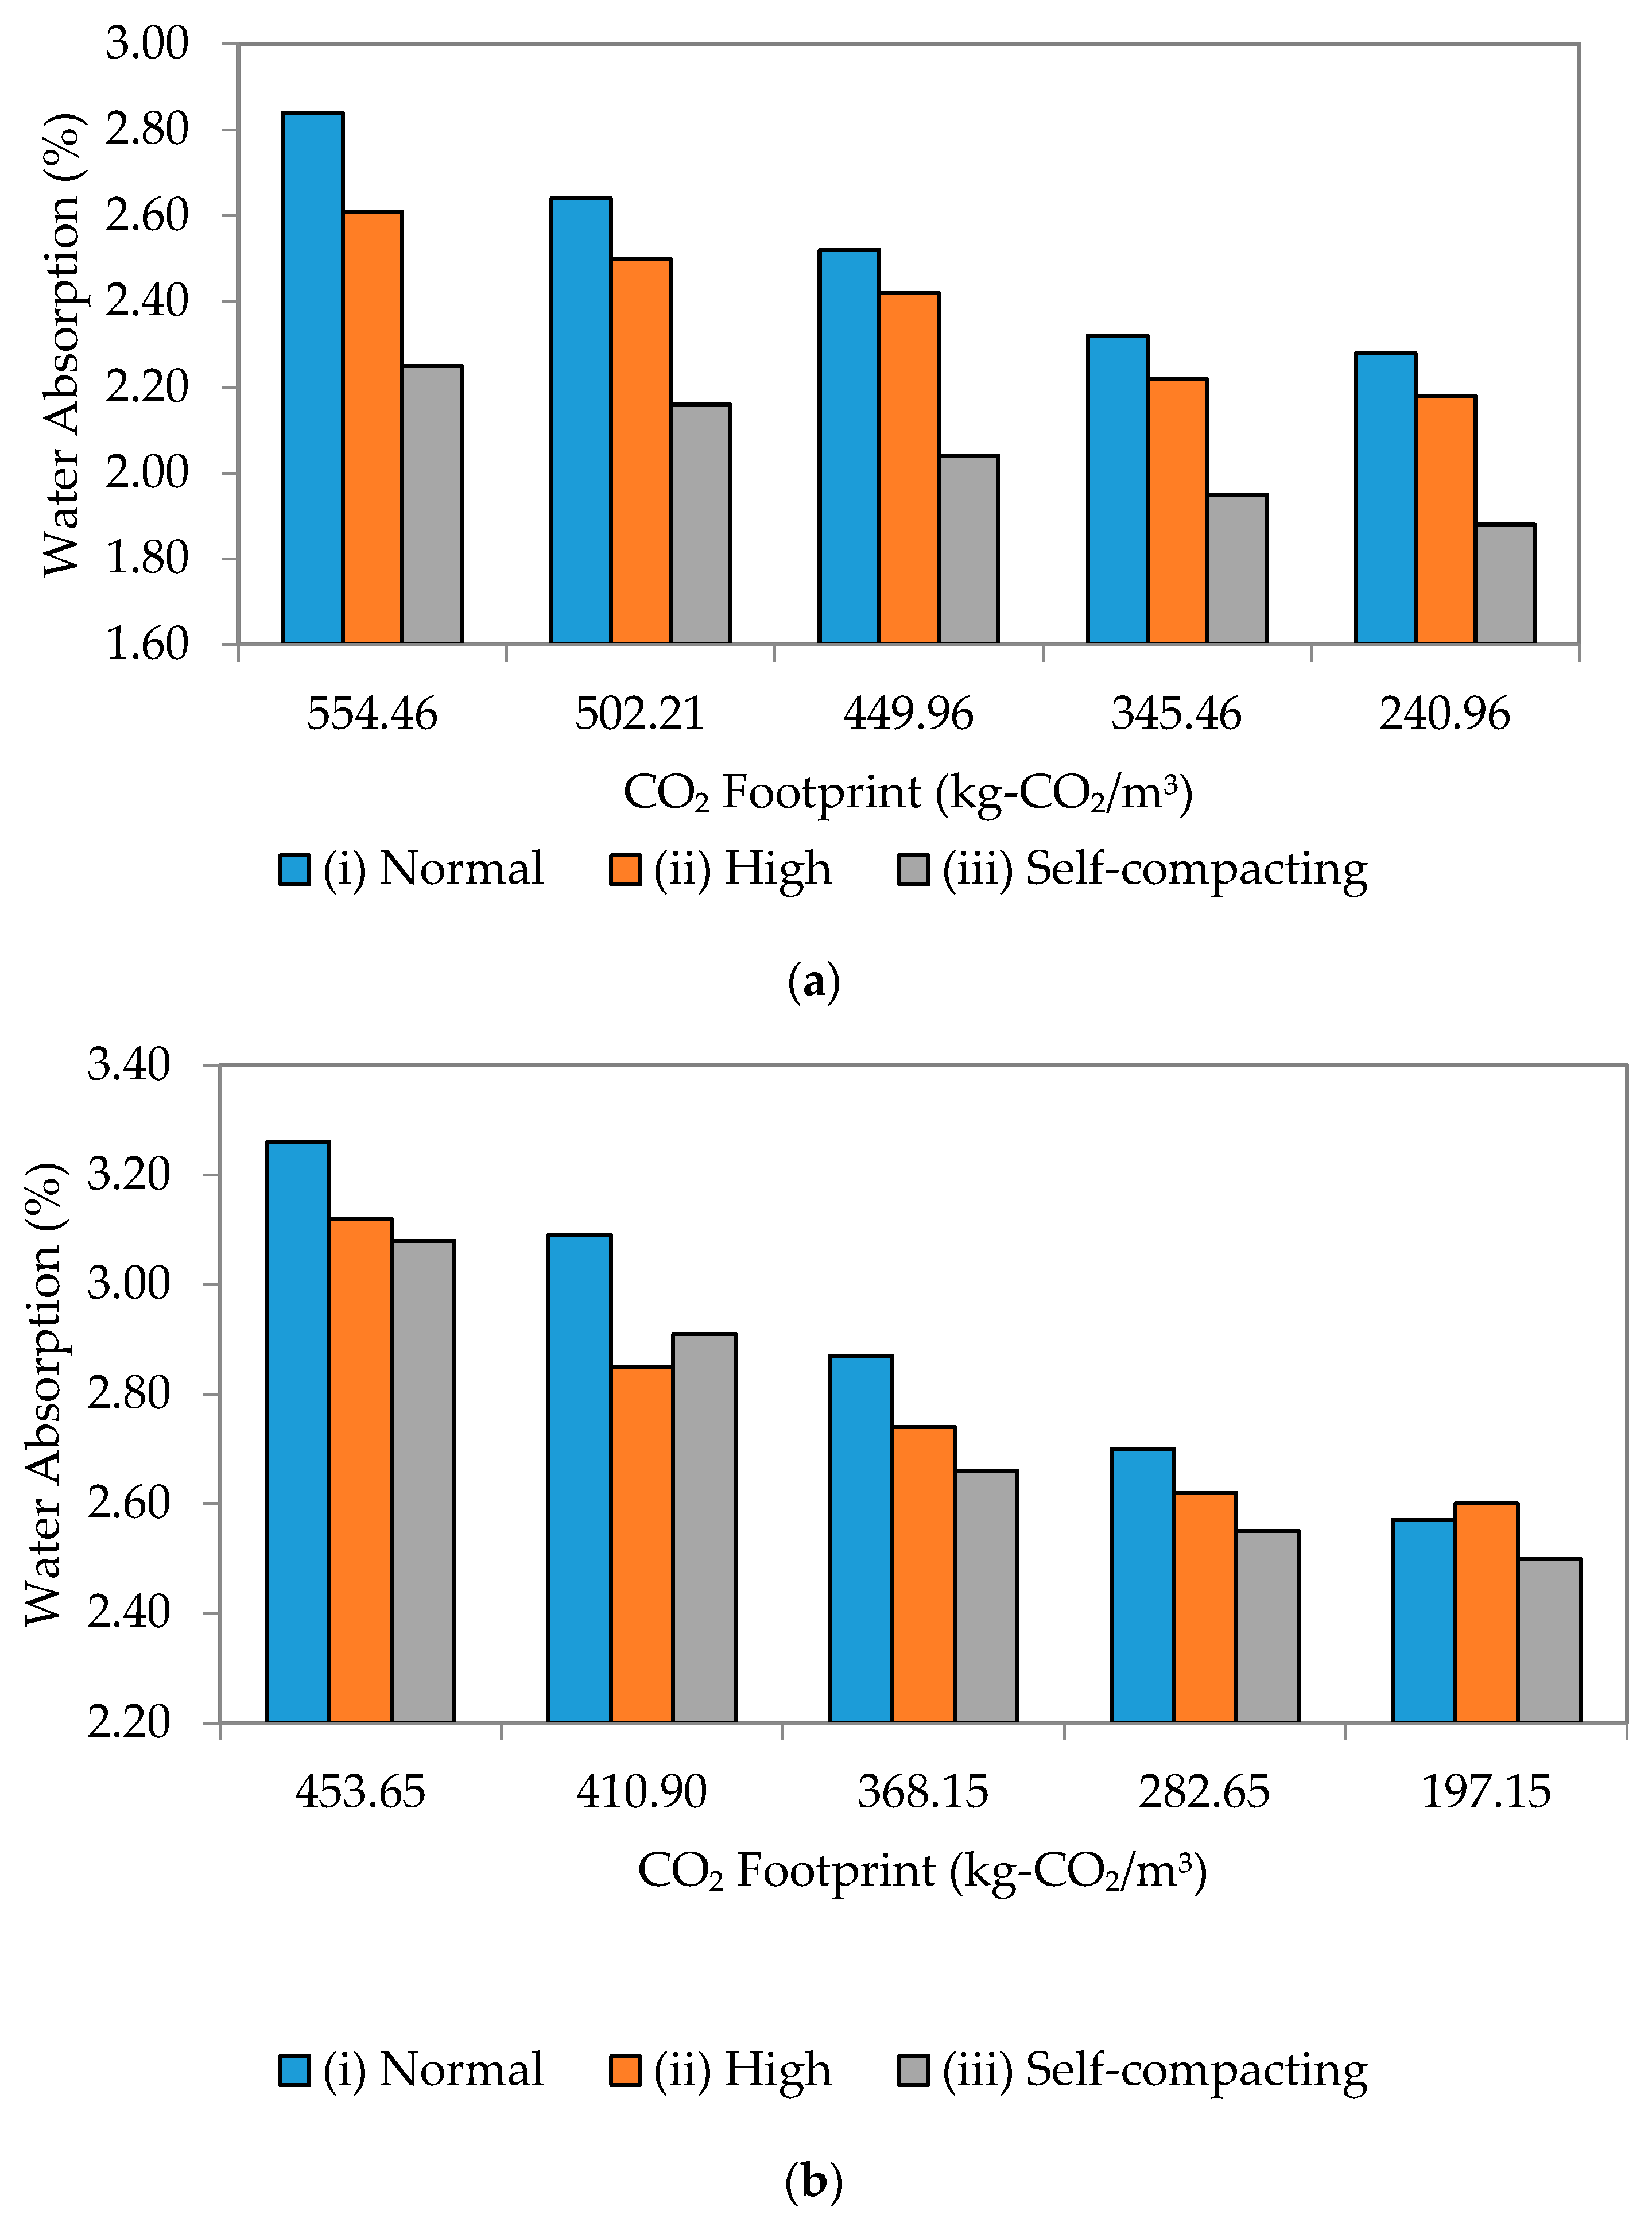
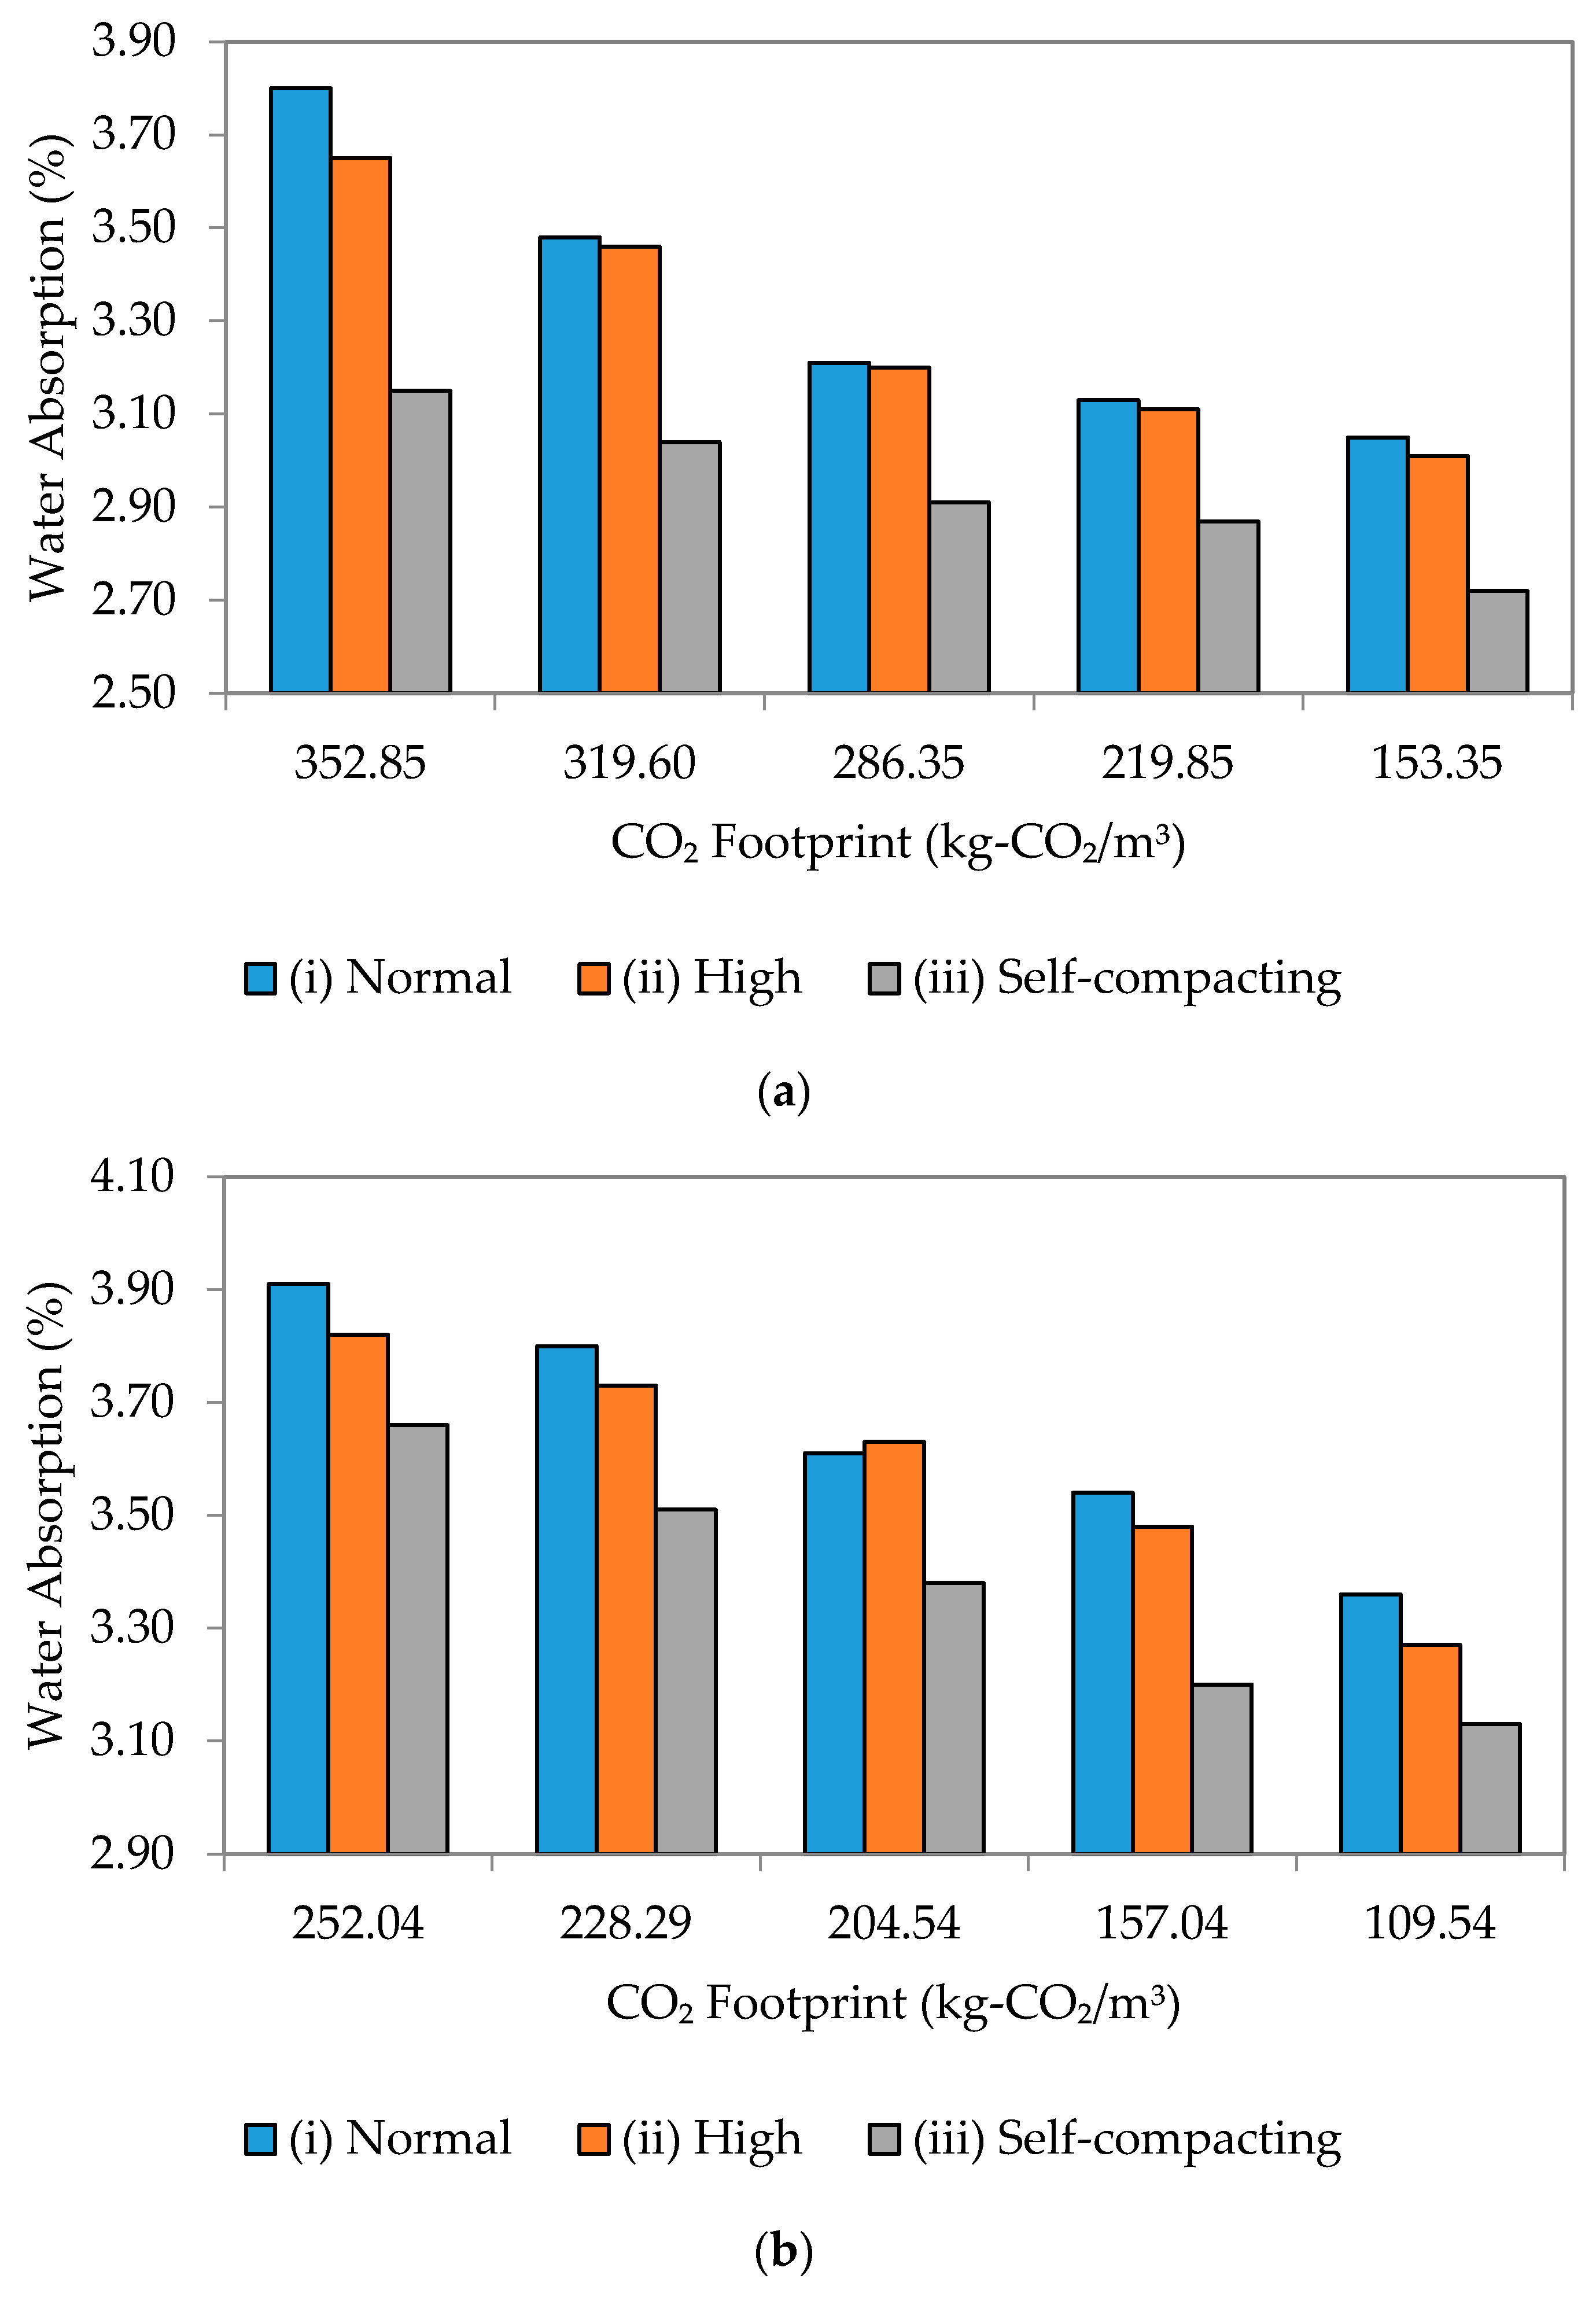
3.6. Durability versus Environmental Sustainability
4. Eco-Points of OPC-Fly Ash Self-Compacting Mortar Mixes
4.1. Fly Ash Landfill
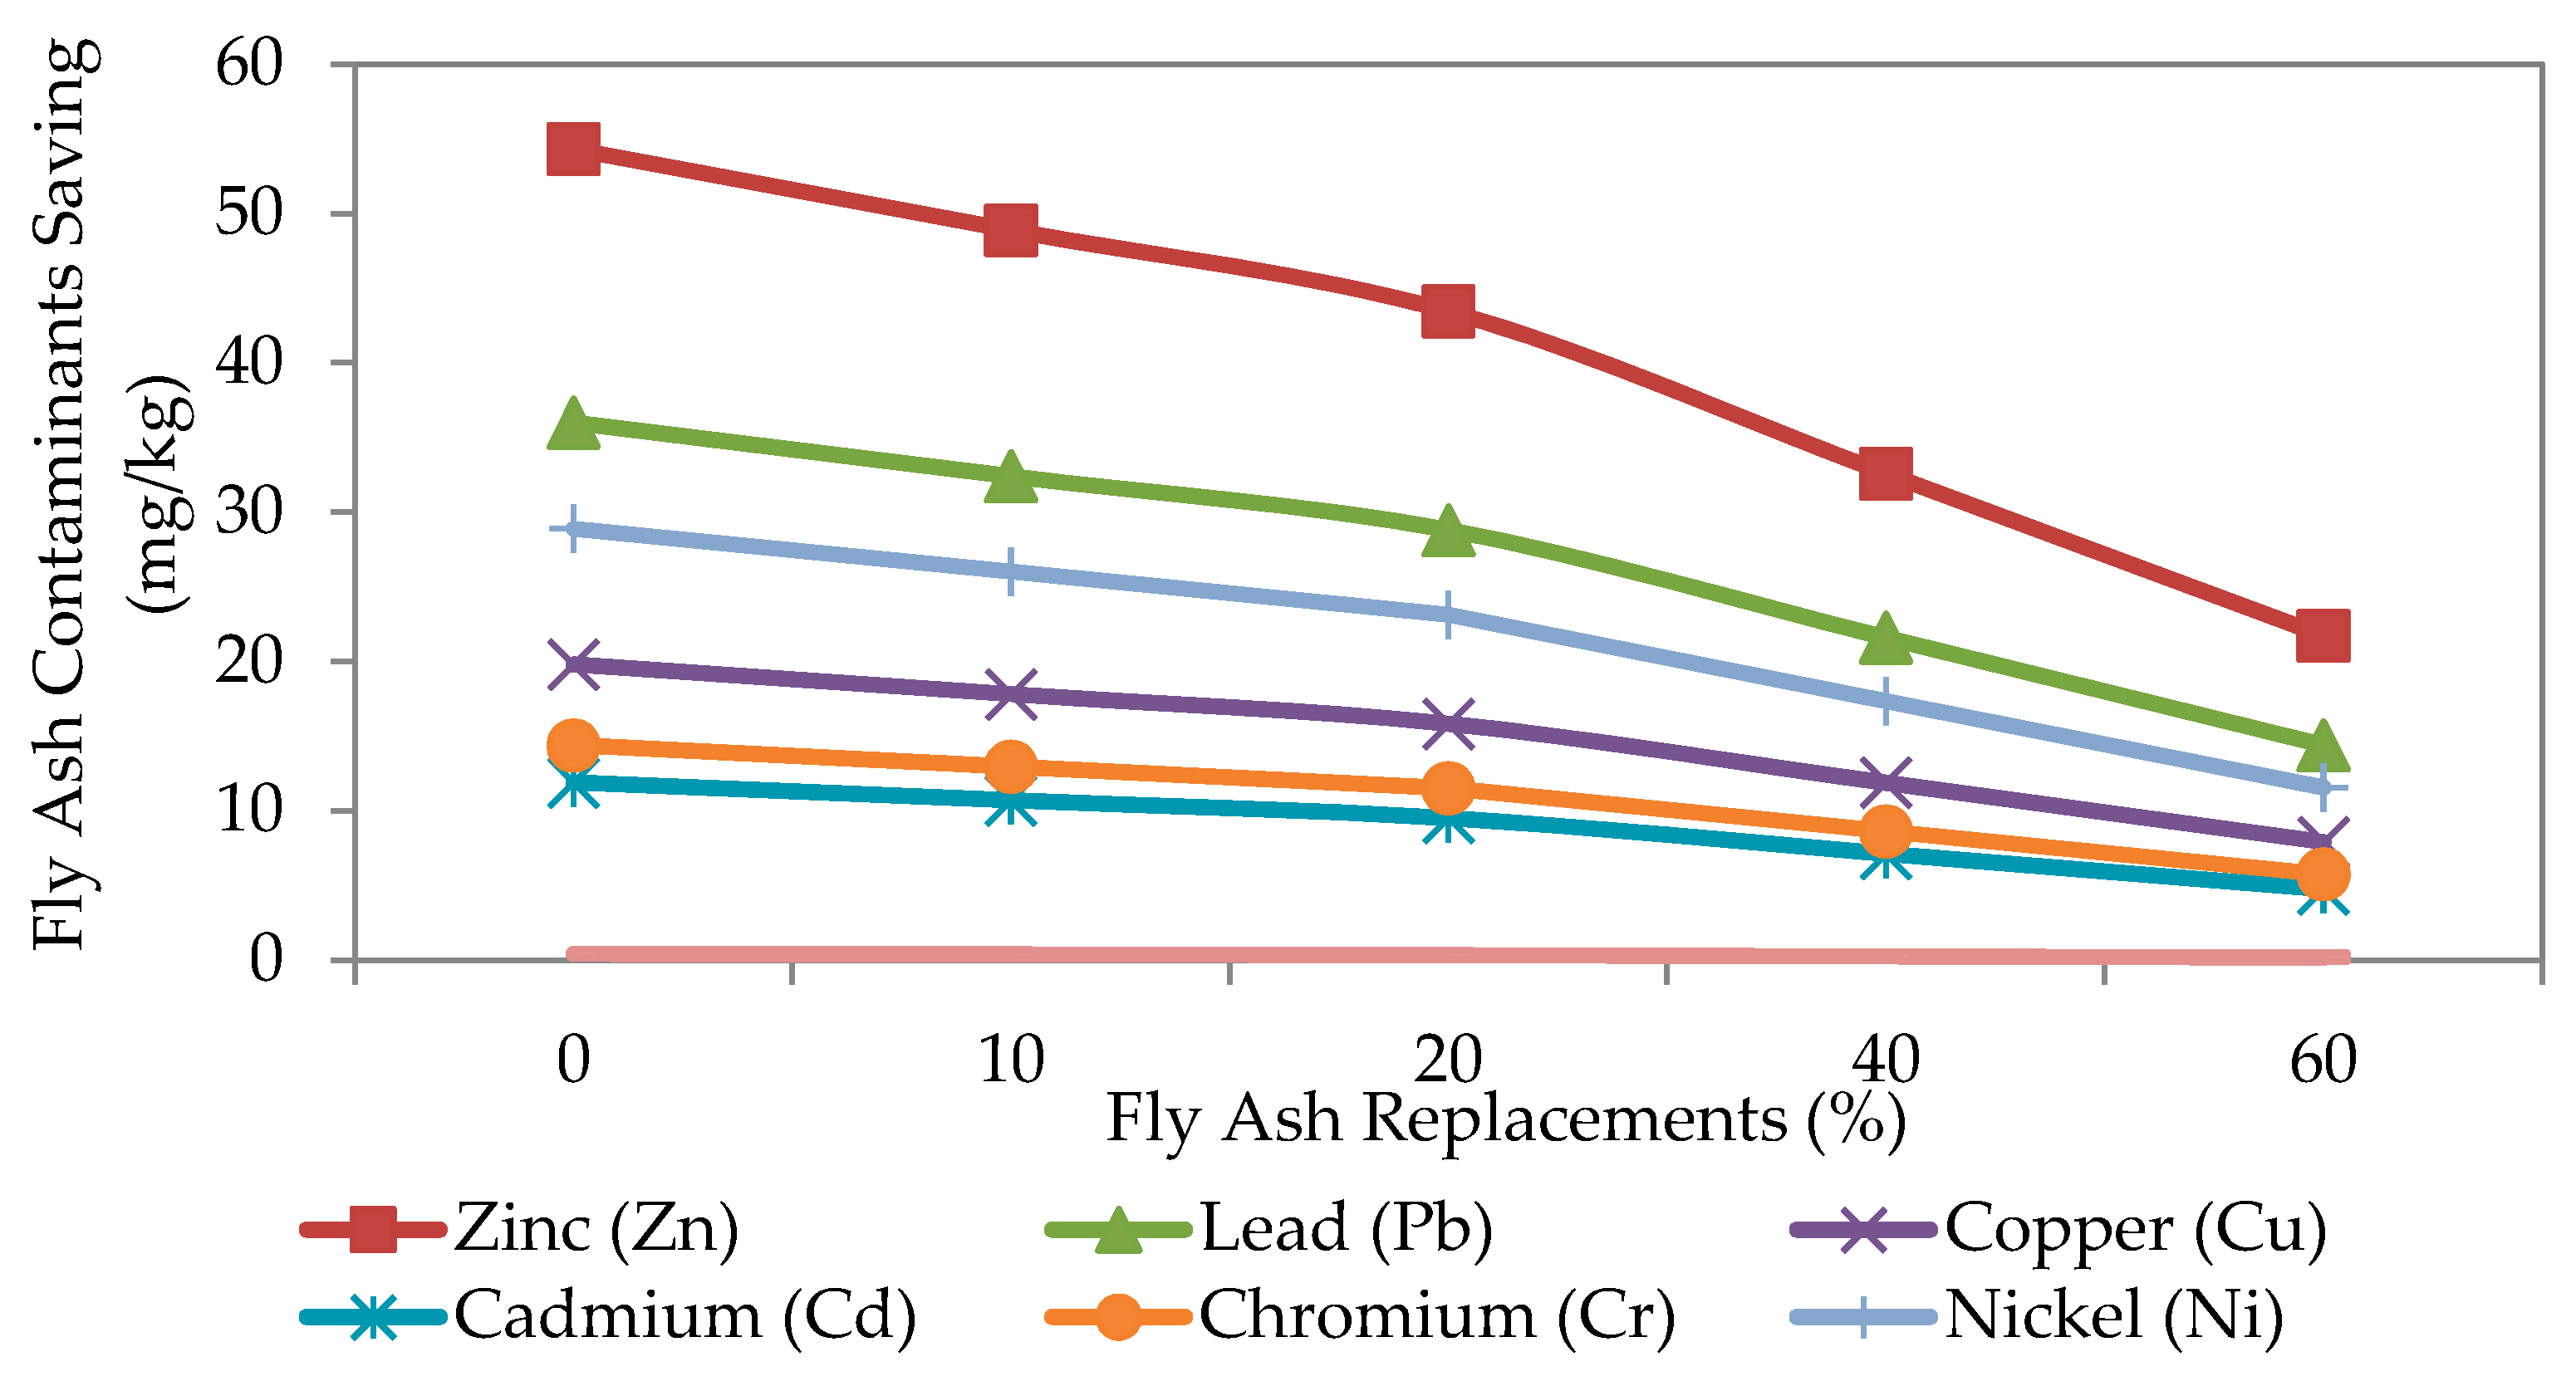
4.2. Fly Ash Contaminant Landfill Savings
5. Conclusions
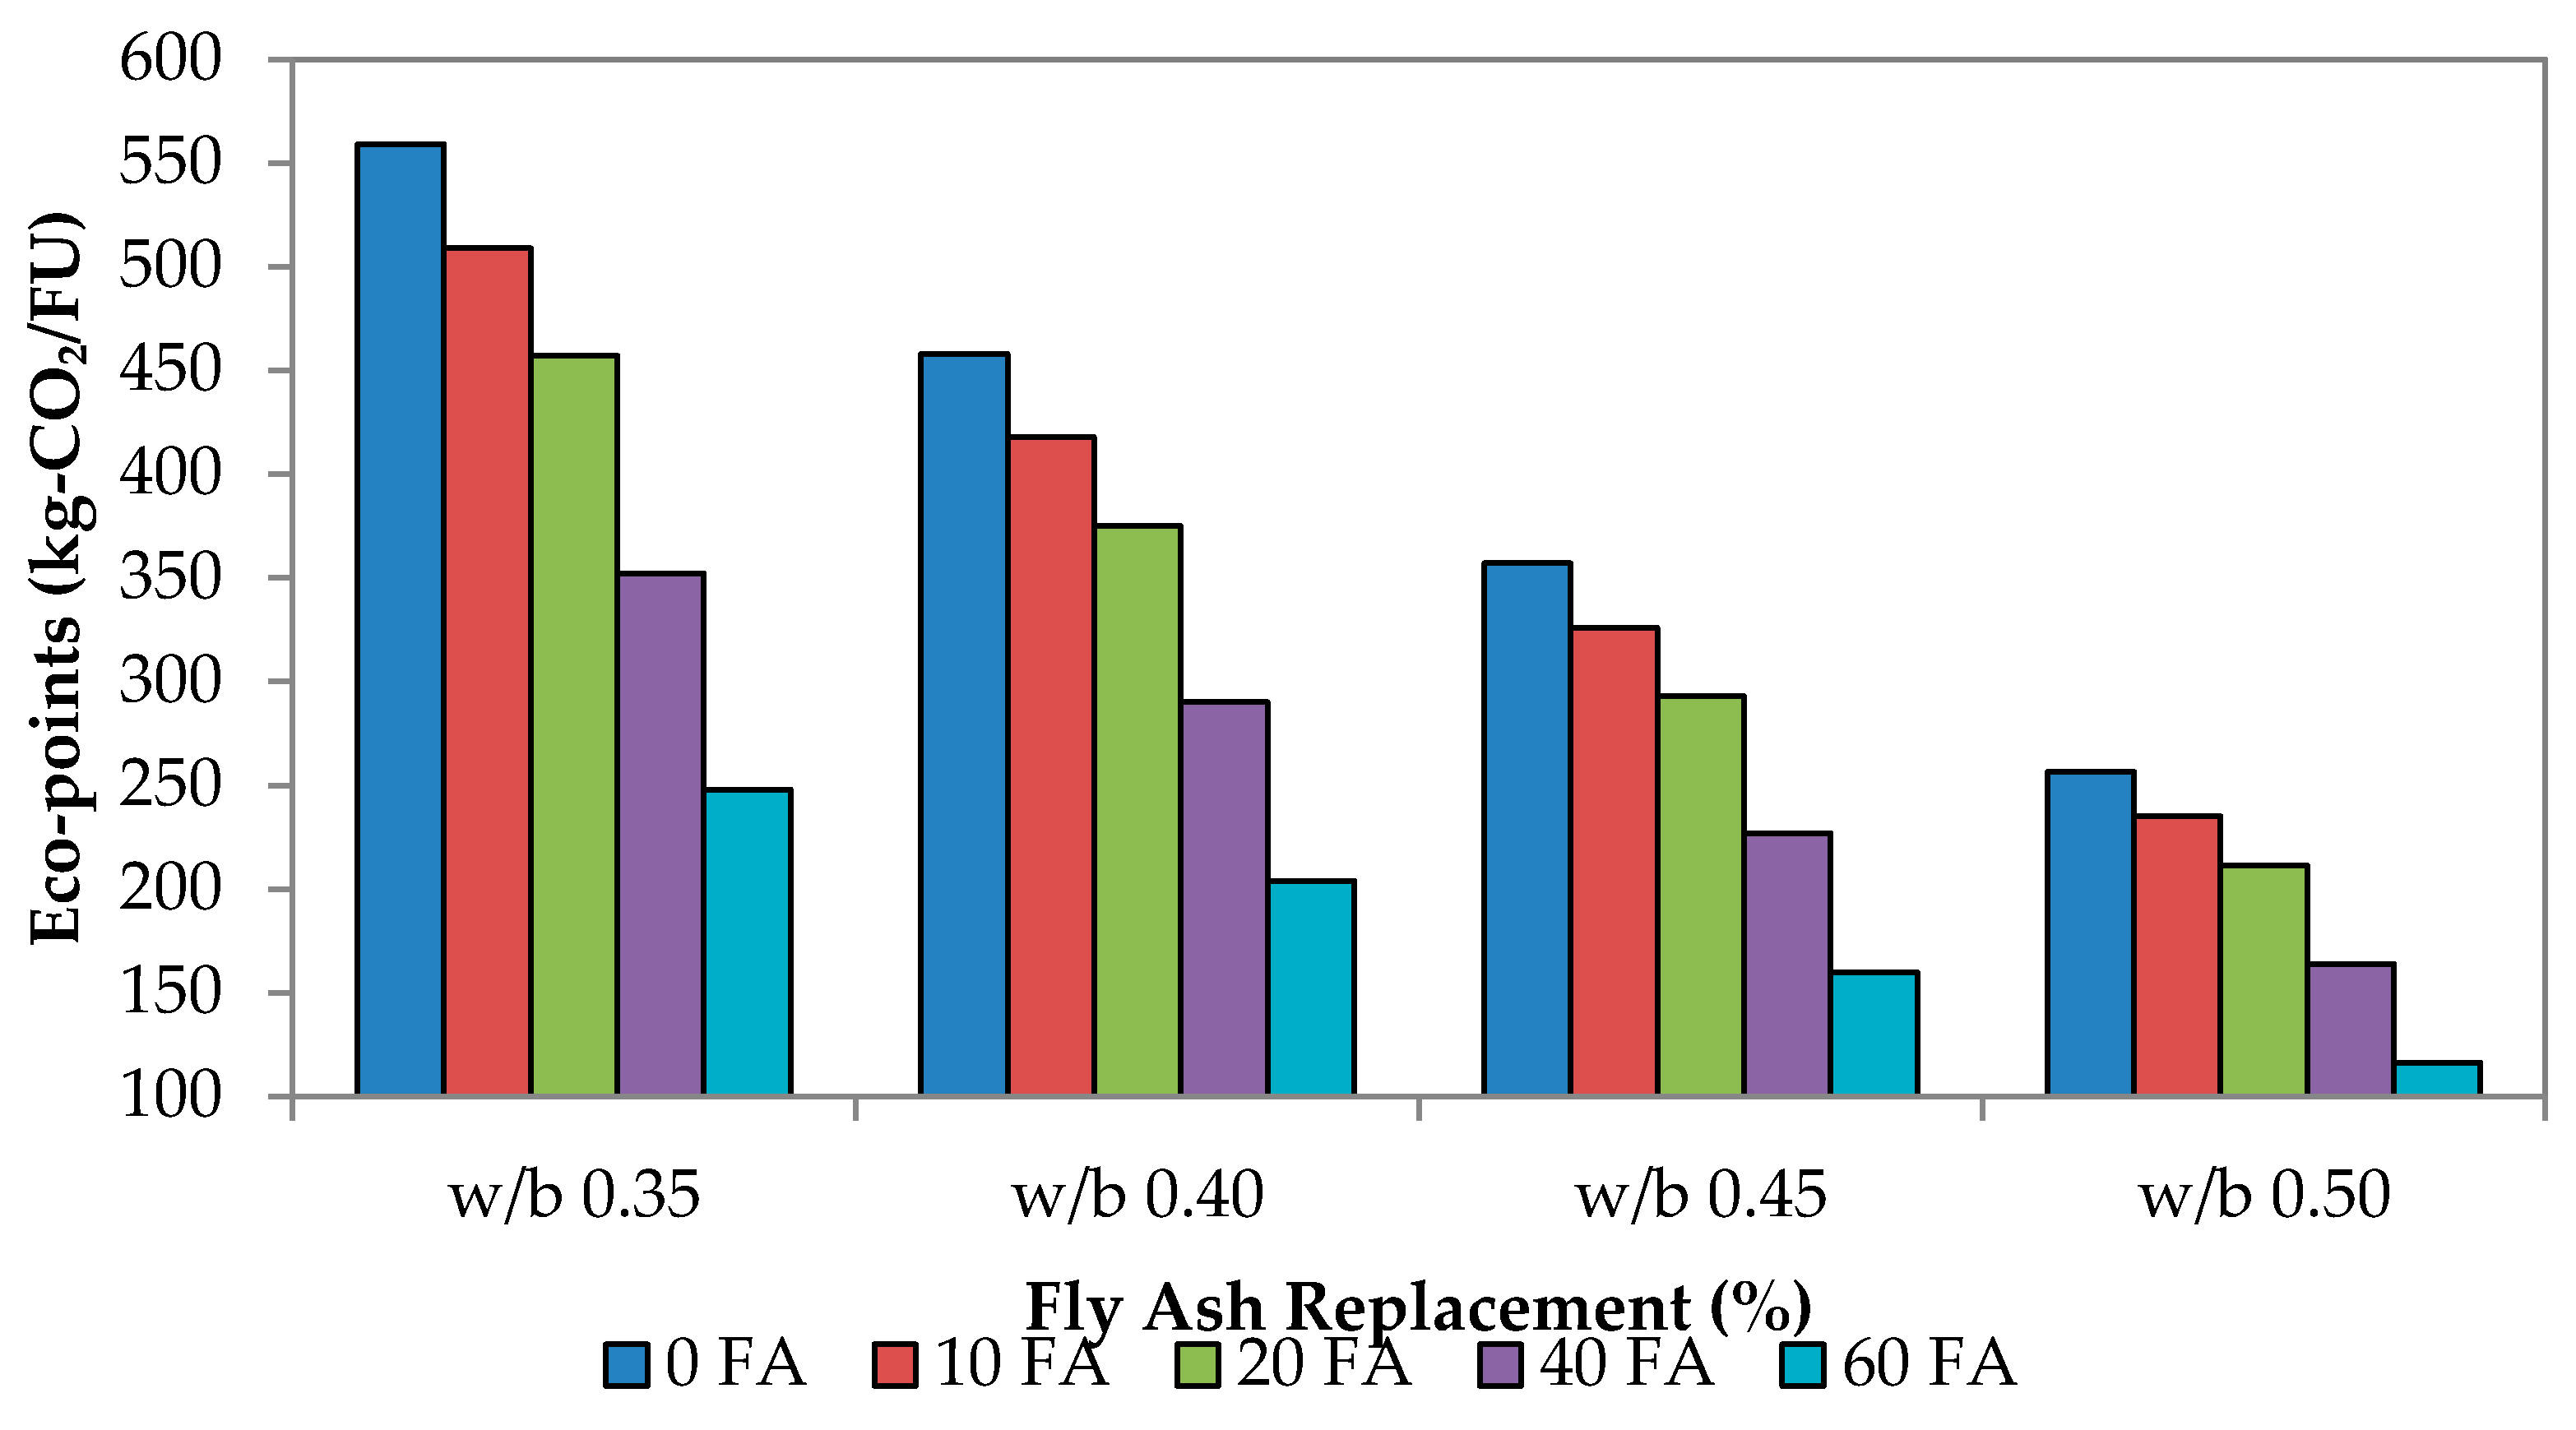
- Considering the strength of mortar and environmental sustainability, the optimum mix for self-compacting mortar is at a 10% replacement rate of cement with fly ash for all mixes.
- From the plots of CO2 footprint against compressive strength at various ages, a 60% replacement of cement with fly ash had decreased more than 50% of the CO2 footprint compared to other mixes.
- The analysis of 28 days’ compressive strength to CO2 footprint showed that, with the increase in strength, a linear relationship had been obtained for both variables.
- The analysis of environmental impact concluded that self-compacting flow gave the lowest water absorption and the lowest CO2 footprint.
- Eco-points of 10% replacement of fly ash were 10.27% higher than 20% fly ash replacement, whilst 22.9% higher than 40% replacement of fly ash.
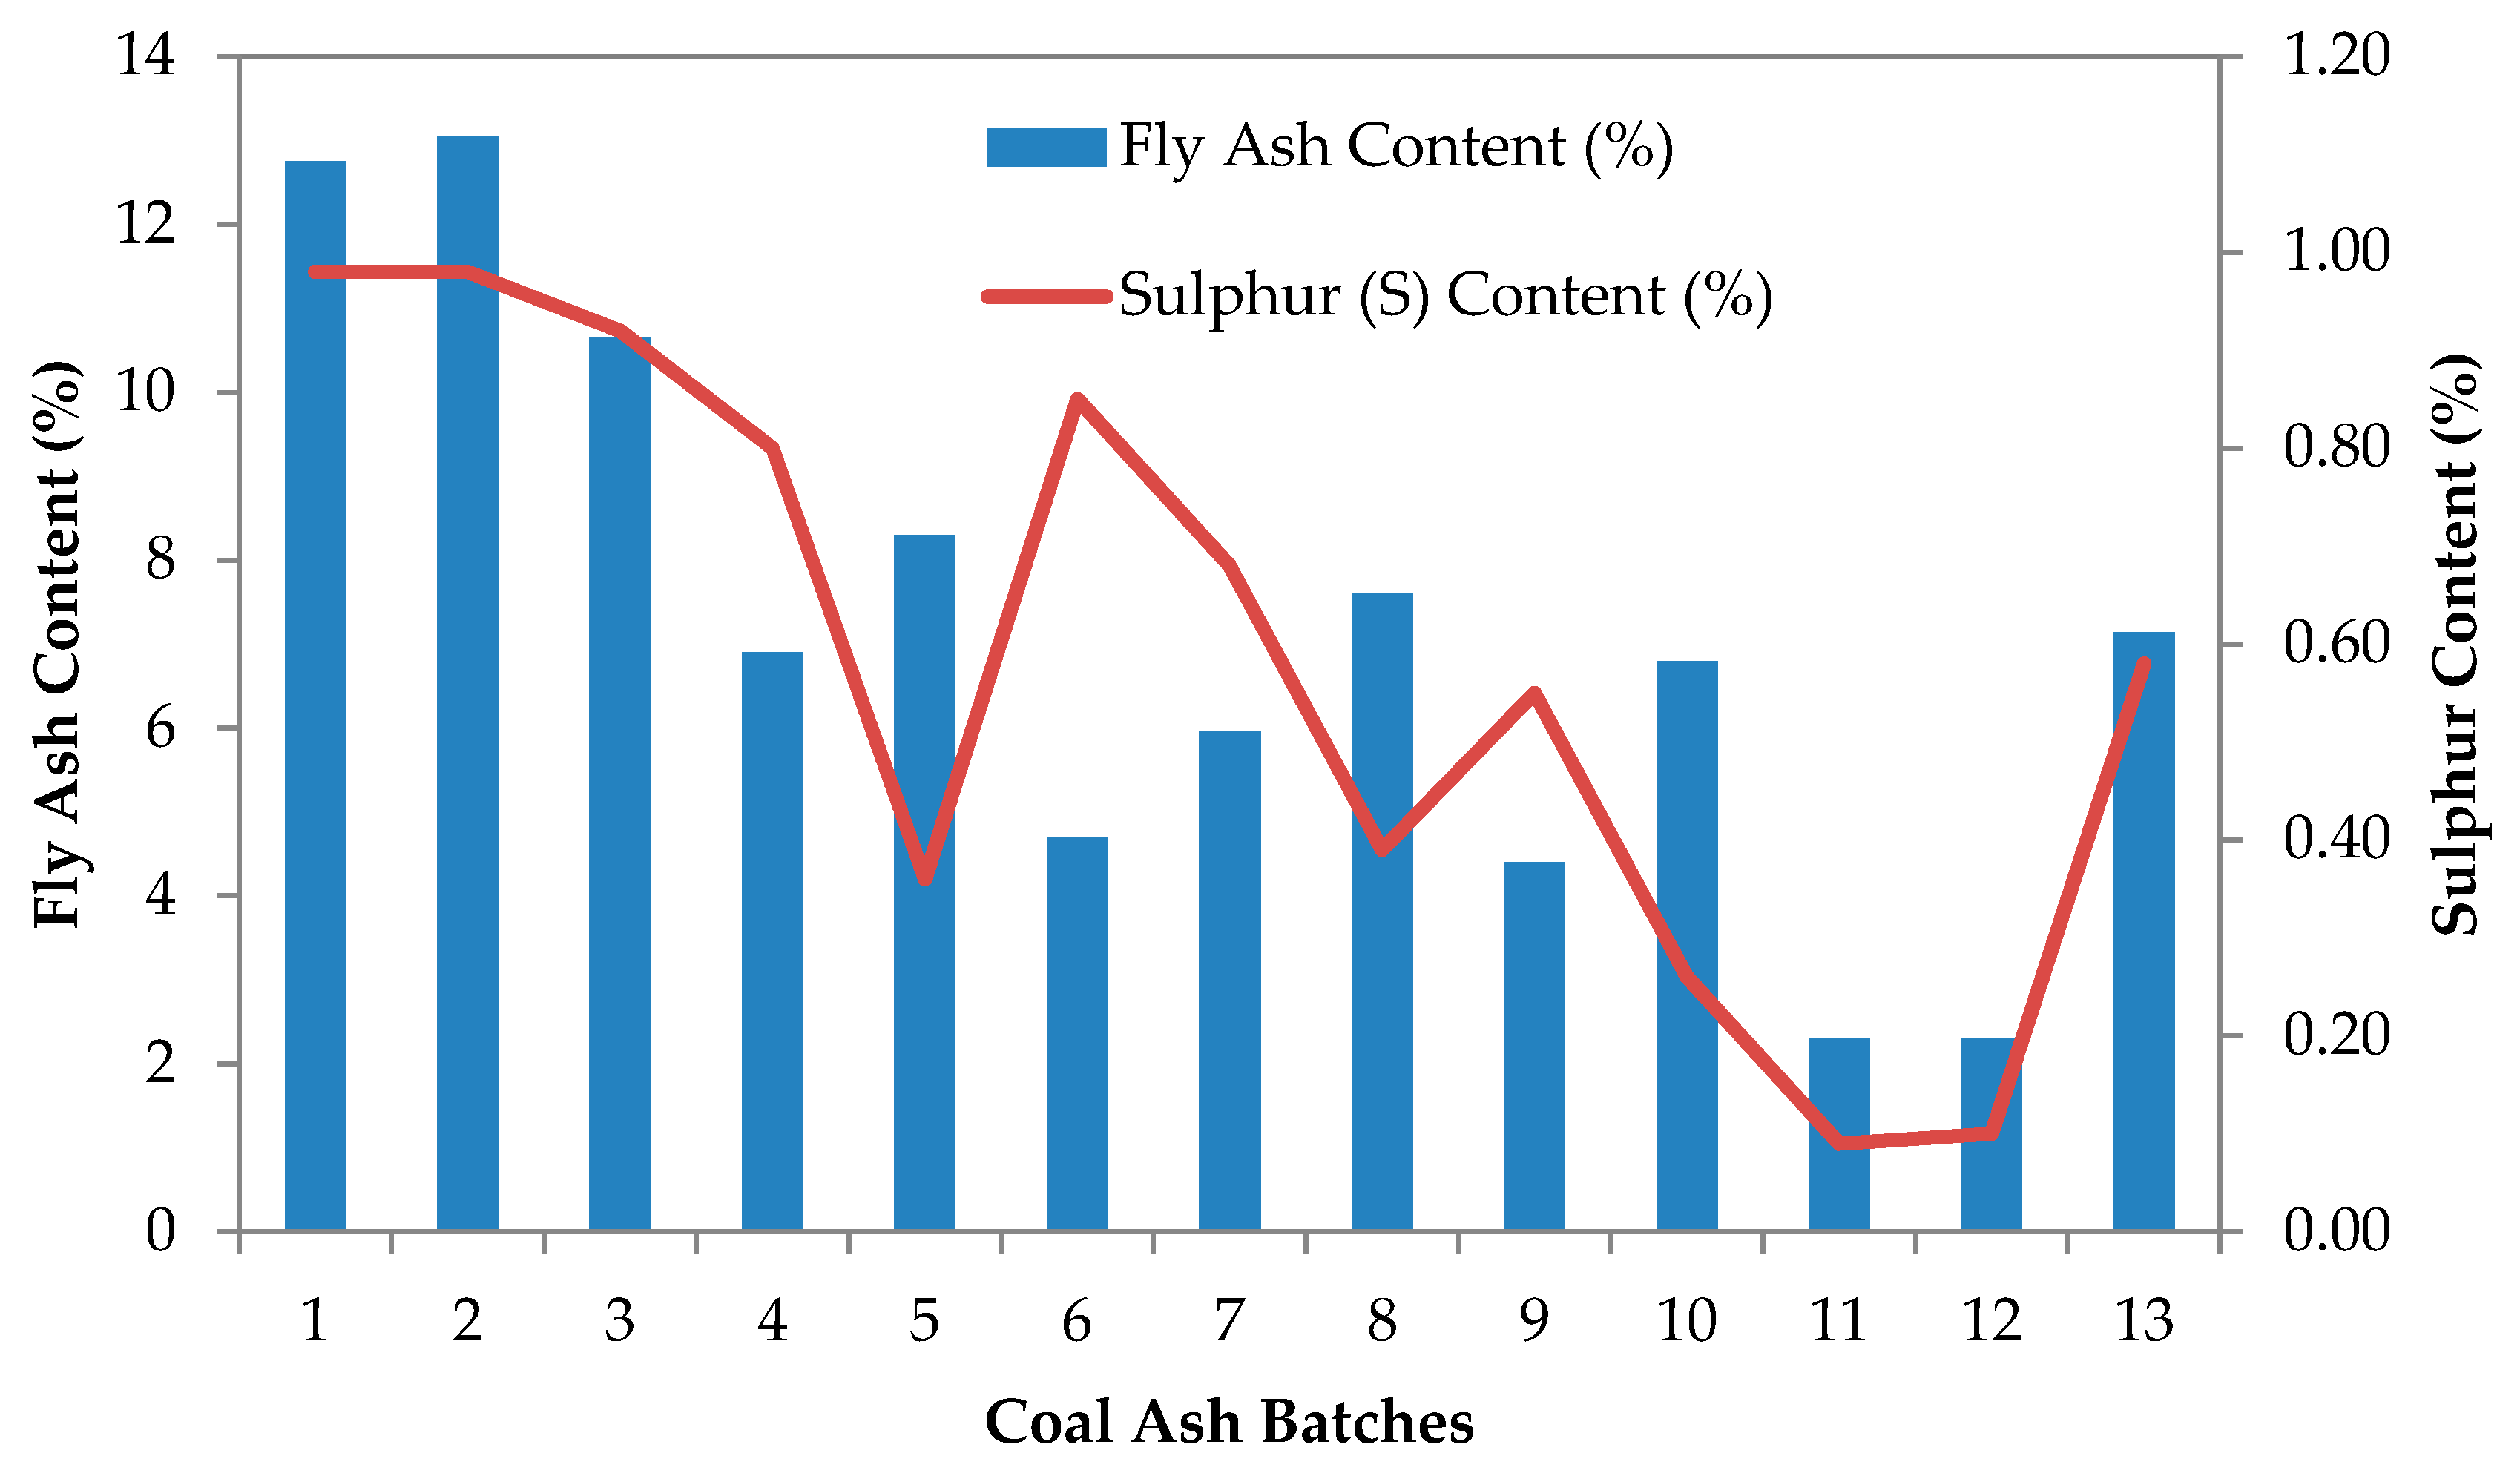
- The utilization of fly ash in concrete or mortar can reduce sulfur content in the soil by 5%–27%.
- The occupied landfill area of fly ash can be reduced by 15%–91% on average.
Acknowledgments
Author Contributions
Conflicts of Interest
Appendix

| Mixture | Compressive Strength (MPa) * | ||||
|---|---|---|---|---|---|
| 3 Days | 7 Days | 14 Days | 28 Days | 90 Days | |
| C-0.35-N | 32.89 1.20 | 44.25 1.36 | 55.70 0.28 | 62.95 0.30 | 65.74 0.13 |
| C-0.35-H | 58.39 0.52 | 62.76 0.19 | 70.05 0.41 | 74.61 0.23 | 84.38 1.94 |
| C-0.35-SCM | 59.06 0.65 | 67.81 0.85 | 74.71 1.34 | 78.77 0.72 | 88.62 0.38 |
| 10FA-0.35-N | 39.41 0.58 | 58.20 0.19 | 65.37 1.94 | 70.13 1.89 | 73.05 1.89 |
| 10FA-0.35-H | 45.16 0.64 | 59.03 0.48 | 67.71 0.45 | 77.88 0.16 | 82.10 0.55 |
| 10FA-0.35-SCM | 54.54 0.11 | 69.33 1.04 | 80.58 0.08 | 87.63 2.80 | 91.92 0.38 |
| 20FA-0.35-N | 35.13 0.94 | 41.96 0.43 | 55.45 0.26 | 60.29 0.18 | 73.04 0.64 |
| 20FA-0.35-H | 39.40 0.68 | 53.45 0.38 | 63.49 0.80 | 72.60 0.24 | 87.56 0.39 |
| 20FA-0.35-SCM | 40.10 1.07 | 54.44 0.24 | 65.16 0.12 | 75.67 0.41 | 90.40 0.30 |
| 40FA-0.35-N | 17.11 0.27 | 32.66 0.18 | 39.52 1.26 | 53.70 0.76 | 72.69 0.94 |
| 40FA-0.35-H | 22.99 0.26 | 36.11 0.65 | 46.48 0.33 | 58.23 0.31 | 77.47 1.04 |
| 40FA-0.35-SCM | 25.66 0.80 | 41.17 0.23 | 52.47 0.36 | 62.31 0.12 | 82.27 0.27 |
| 60FA-0.35-N | 17.99 0.12 | 28.05 0.58 | 33.41 1.15 | 42.51 2.05 | 58.70 0.31 |
| 60FA-0.35-H | 19.01 0.34 | 29.09 0.71 | 38.31 0.60 | 47.26 0.44 | 61.70 1.06 |
| 60FA-0.35-SCM | 22.20 0.18 | 32.28 0.46 | 40.83 1.03 | 50.63 0.60 | 63.62 0.24 |
| Mixture | Compressive Strength (MPa) * | ||||
|---|---|---|---|---|---|
| 3 Days | 7 Days | 14 Days | 28 Days | 90 Days | |
| C-0.40-N | 44.63 1.59 | 59.94 1.79 | 62.87 1.91 | 66.45 0.39 | 75.50 0.87 |
| C-0.40-H | 47.84 0.29 | 62.19 0.13 | 65.23 0.10 | 71.69 0.62 | 78.66 0.21 |
| C-0.40-SCM | 50.82 1.26 | 64.66 1.58 | 67.08 0.77 | 73.80 2.72 | 82.73 1.87 |
| 10FA-0.40-N | 42.02 0.53 | 48.21 0.70 | 52.93 0.40 | 61.24 1.79 | 70.29 0.94 |
| 10FA-0.40-H | 45.58 0.41 | 50.43 0.51 | 57.67 2.10 | 66.72 2.72 | 74.03 0.26 |
| 10FA-0.40-SCM | 47.83 0.39 | 52.36 0.34 | 59.26 1.41 | 68.84 0.14 | 77.77 1.21 |
| 20FA-0.40-N | 29.61 1.07 | 37.37 1.05 | 54.27 0.80 | 57.22 1.91 | 66.27 0.45 |
| 20FA-0.40-H | 32.46 0.13 | 40.04 2.18 | 58.63 1.46 | 62.86 0.81 | 70.45 0.91 |
| 20FA-0.40-SCM | 35.30 0.85 | 42.71 0.45 | 60.06 0.75 | 65.69 0.20 | 74.62 1.18 |
| 40FA-0.40-N | 18.27 0.60 | 35.92 0.58 | 48.48 1.75 | 57.05 0.11 | 66.10 0.43 |
| 40FA-0.40-H | 19.78 0.38 | 37.16 1.14 | 52.34 0.71 | 61.19 1.31 | 69.21 0.69 |
| 40FA-0.40-SCM | 24.62 0.61 | 40.21 0.72 | 55.73 1.12 | 63.38 1.34 | 72.31 1.07 |
| 60FA-0.40-N | 15.67 0.44 | 18.46 0.94 | 24.46 1.17 | 29.52 2.05 | 38.57 0.96 |
| 60FA-0.40-H | 16.82 0.77 | 20.38 0.41 | 26.74 1.18 | 32.42 0.93 | 41.69 1.08 |
| 60FA-0.40-SCM | 18.14 1.24 | 23.07 1.79 | 28.32 0.62 | 35.87 1.41 | 44.80 0.95 |
| Mixture | Compressive Strength (MPa) * | ||||
|---|---|---|---|---|---|
| 3 Days | 7 Days | 14 Days | 28 Days | 90 Days | |
| C-0.45-N | 30.74 0.77 | 41.93 0.67 | 49.17 1.40 | 56.93 0.81 | 65.98 0.92 |
| C-0.45-H | 34.79 0.63 | 45.82 0.89 | 54.43 0.17 | 61.72 1.67 | 69.73 0.42 |
| C-0.45-SCM | 40.76 0.68 | 48.95 0.16 | 57.28 0.81 | 64.43 1.85 | 73.48 1.17 |
| 10FA-0.45-N | 31.77 2.41 | 43.44 0.81 | 50.50 0.40 | 58.08 1.15 | 67.13 0.94 |
| 10FA-0.45-H | 33.68 0.25 | 46.45 1.27 | 53.45 0.20 | 60.51 1.54 | 69.33 1.27 |
| 10FA-0.45-SCM | 35.83 0.95 | 49.26 0.39 | 56.17 0.85 | 62.48 0.67 | 71.53 1.31 |
| 20FA-0.45-N | 21.33 0.16 | 29.21 0.55 | 35.88 0.69 | 43.24 0.10 | 53.29 1.14 |
| 20FA-0.45-H | 23.73 0.47 | 32.64 1.40 | 40.51 0.32 | 49.11 1.37 | 56.98 0.87 |
| 20FA-0.45-SCM | 29.21 0.75 | 35.07 0.29 | 42.77 1.83 | 52.62 0.58 | 61.67 1.24 |
| 40FA-0.45-N | 14.25 0.26 | 21.68 0.34 | 27.11 0.32 | 31.42 1.16 | 41.47 0.83 |
| 40FA-0.45-H | 16.50 0.50 | 22.96 0.31 | 28.96 2.01 | 33.71 0.77 | 44.18 1.23 |
| 40FA-0.45-SCM | 18.56 0.23 | 25.39 1.25 | 30.69 0.37 | 36.83 1.43 | 46.88 0.87 |
| 60FA-0.45-N | 13.18 1.15 | 19.78 0.93 | 26.17 0.82 | 30.87 1.34 | 40.24 0.52 |
| 60FA-0.45-H | 15.65 0.78 | 21.29 0.64 | 27.82 1.04 | 32.19 0.90 | 42.78 0.89 |
| 60FA-0.45-SCM | 17.24 1.39 | 24.61 0.75 | 29.94 0.44 | 35.61 0.32 | 45.31 0.59 |
| Mixture | Compressive Strength (MPa) * | ||||
|---|---|---|---|---|---|
| 3 Days | 7 Days | 14 Days | 28 Days | 90 Days | |
| C-0.50-N | 18.27 0.73 | 25.18 0.25 | 30.47 1.33 | 38.47 0.14 | 51.02 1.07 |
| C-0.50-H | 20.41 0.58 | 28.23 0.92 | 35.73 0.29 | 42.87 1.41 | 54.63 1.12 |
| C-0.50-SCM | 23.92 0.29 | 34.21 0.72 | 41.90 1.41 | 50.19 0.09 | 58.24 1.05 |
| 10FA-0.50-N | 16.87 0.61 | 23.62 0.39 | 28.47 1.33 | 36.71 0.77 | 46.76 1.07 |
| 10FA-0.50-H | 18.29 0.68 | 26.73 0.54 | 31.86 0.93 | 41.25 1.03 | 51.30 1.57 |
| 10FA-0.50-SCM | 21.14 0.09 | 29.84 0.16 | 35.24 0.19 | 45.78 0.15 | 55.83 1.14 |
| 20FA-0.50-N | 15.23 0.67 | 23.02 0.13 | 27.96 0.75 | 35.14 1.12 | 45.39 1.09 |
| 20FA-0.50-H | 18.02 0.32 | 25.72 0.65 | 31.43 0.42 | 39.21 0.67 | 49.59 0.35 |
| 20FA-0.50-SCM | 20.81 0.89 | 28.42 0.43 | 34.89 1.98 | 43.27 0.86 | 53.87 0.64 |
| 40FA-0.50-N | 14.97 0.22 | 22.86 0.56 | 26.74 0.21 | 34.95 0.45 | 44.23 1.69 |
| 40FA-0.50-H | 17.57 0.98 | 25.39 1.78 | 30.33 0.67 | 38.57 1.02 | 47.96 0.93 |
| 40FA-0.50-SCM | 20.17 0.34 | 27.92 1.67 | 33.91 0.39 | 42.18 0.82 | 51.68 0.74 |
| 60FA-0.50-N | 14.12 0.92 | 20.72 0.41 | 26.07 1.21 | 33.87 1.08 | 43.14 0.71 |
| 60FA-0.50-H | 17.03 0.86 | 23.11 0.79 | 29.44 0.29 | 37.05 0.69 | 46.55 1.49 |
| 60FA-0.50-SCM | 19.94 0.26 | 25.49 0.64 | 32.81 0.94 | 40.23 1.09 | 49.95 0.78 |
References
- Skarendahl, Å.; Petersson, Ö. Report 23: Self-Compacting Concrete–State-of-the-Art Report of Rilem Technical Committee 174-SCC; RILEM Publications: Bagneux, France, 2000; Volume 23. [Google Scholar]
- Goodier, C.I. Development of self-compacting concrete. Proc. Inst. Civ. Eng. Struct. Build. 2003, 156, 405–414. [Google Scholar] [CrossRef]
- EFNARC. The European Guidelines for Self-Compacting Concrete. 2005. Available online: http://www.efnarc.org/pdf/SCCGuidelinesMay2005.pdf (accessed on 29 April 2016).
- Benabed, B.; Kadri, E.-H.; Azzouz, L.; Kenai, S. Properties of self-compacting mortar made with various types of sand. Cem. Concr. Compos. 2012, 34, 1167–1173. [Google Scholar] [CrossRef]
- Elsen, J. Microscopy of historic mortars—A review. Cem. Concr. Res. 2006, 36, 1416–1424. [Google Scholar] [CrossRef]
- Safiuddin, M.; West, J.S.; Soudki, K.A. Flowing ability of the mortars formulated from self-compacting concretes incorporating rice husk ash. Constr. Build. Mater. 2011, 25, 973–978. [Google Scholar] [CrossRef]
- Felekoğlu, B.; Tosun, K.; Baradan, B.; Altun, A.; Uyulgan, B. The effect of fly ash and limestone fillers on the viscosity and compressive strength of self-compacting repair mortars. Cem. Concr. Res. 2006, 36, 1719–1726. [Google Scholar] [CrossRef]
- Felekoğlu, B.; Türkel, S.; Altuntaş, Y. Effects of steel fiber reinforcement on surface wear resistance of self-compacting repair mortars. Cem. Concr. Compos. 2007, 29, 391–396. [Google Scholar] [CrossRef]
- Guo, M.-Z.; Ling, T.-C.; Poon, C.-S. Tio2-based self-compacting glass mortar: Comparison of photocatalytic nitrogen oxide removal and bacteria inactivation. Build. Environ. 2012, 53, 1–6. [Google Scholar] [CrossRef]
- Libre, N.A.; Khoshnazar, R.; Shekarchi, M. Relationship between fluidity and stability of self-consolidating mortar incorporating chemical and mineral admixtures. Constr. Build. Mater. 2010, 24, 1262–1271. [Google Scholar] [CrossRef]
- Rizwan, S.A.; Bier, T.A. Blends of limestone powder and fly-ash enhance the response of self-compacting mortars. Constr. Build. Mater. 2012, 27, 398–403. [Google Scholar] [CrossRef]
- Şahmaran, M.; Christianto, H.A.; Yaman, İ.Ö. The effect of chemical admixtures and mineral additives on the properties of self-compacting mortars. Cem. Concr. Compos. 2006, 28, 432–440. [Google Scholar] [CrossRef]
- Uygunoğlu, T.; Topçu, İ.B. The role of scrap rubber particles on the drying shrinkage and mechanical properties of self-consolidating mortars. Constr. Build. Mater. 2010, 24, 1141–1150. [Google Scholar] [CrossRef]
- Akram, T.; Memon, S.A.; Obaid, H. Production of low cost self compacting concrete using bagasse ash. Constr. Build. Mater. 2009, 23, 703–712. [Google Scholar] [CrossRef]
- Bentz, D.P.; Hansen, A.S.; Guynn, J.M. Optimization of cement and fly ash particle sizes to produce sustainable concretes. Cem. Concr. Compos. 2011, 33, 824–831. [Google Scholar] [CrossRef]
- Dehwah, H.A.F. Mechanical properties of self-compacting concrete incorporating quarry dust powder, silica fume or fly ash. Constr. Build. Mater. 2012, 26, 547–551. [Google Scholar] [CrossRef]
- Gesoğlu, M.; Güneyisi, E.; Kocabağ, M.E.; Bayram, V.; Mermerdaş, K. Fresh and hardene d characteristics of self compacting concretes made with combined use of marble powder, limestone filler, and fly ash. Constr. Build. Mater. 2012, 37, 160–170. [Google Scholar] [CrossRef]
- Bouzoubaa, N.; Lachemi, M. Self-compacting concrete incorporating high volumes of class f fly ash: Preliminary results. Cem. Concr. Res. 2001, 31, 413–420. [Google Scholar] [CrossRef]
- Sabet, F.A.; Libre, N.A.; Shekarchi, M. Mechanical and durability properties of self consolidating high performance concrete incorporating natural zeolite, silica fume and fly ash. Constr. Build. Mater. 2013, 44, 175–184. [Google Scholar] [CrossRef]
- Siddique, R. Properties of self-compacting concrete containing class F fly ash. Mater. Des. 2011, 32, 1501–1507. [Google Scholar] [CrossRef]
- Razi, P.Z.; Abdul Razak, H. Environmental sustainability and engineering performance of self-compacting mortar incorporating fly ashes. Appl. Mech. Mater. 2013, 253–255, 559–563. [Google Scholar] [CrossRef]
- Flower, D.J.M.; Sanjayan, J.G. Green house gas emissions due to concrete manufacture. Int. J. Life Cycle Assess. 2007, 12, 282–288. [Google Scholar] [CrossRef]
- Yang, K.-H.; Song, J.-K.; Song, K.-I. Assessment of CO2 reduction of alkali-activated concrete. J. Clean. Prod. 2013, 39, 265–272. [Google Scholar] [CrossRef]
- Cyr, M.; Trinh, M.; Husson, B.; Casaux-Ginestet, G. Design of eco-efficient grouts intended for soil nailing. Constr. Build. Mater. 2013, 41, 857–867. [Google Scholar] [CrossRef]
- Sarabèr, A.J. Co-combustion and its impact on fly ash quality; full-scale experiments. Fuel Process. Technol. 2014, 128, 68–82. [Google Scholar] [CrossRef]
- Garrabrants, A.C.; Kosson, D.S.; DeLapp, R.; van der Sloot, H.A. Effect of coal combustion fly ash use in concrete on the mass transport release of constituents of potential concern. Chemosphere 2014, 103, 131–139. [Google Scholar] [CrossRef] [PubMed]
- Kosson, D.S.; Garrabrants, A.C.; DeLapp, R.; van der Sloot, H.A. Ph-dependent leaching of constituents of potential concern from concrete materials containing coal combustion fly ash. Chemosphere 2014, 103, 140–147. [Google Scholar] [CrossRef] [PubMed]
- Kosior-Kazberuk, M. Surface scaling resistance of concrete with fly ash from co-combustion of coal and biomass. Procedia Eng. 2013, 57, 605–613. [Google Scholar] [CrossRef]
- Faleschini, F.; Zanini, M.A.; Brunelli, K.; Pellegrino, C. Valorization of co-combustion fly ash in concrete production. Mater. Des. 2015, 85, 687–694. [Google Scholar] [CrossRef]
- BSI Standards Publication. Specification for Aggregates from Sources for Concrete (Amendment 1); BS 882:1992; British Standards Institute: London, UK, 1992. [Google Scholar]
- ASTM Standards Publication. Standard Test Method for Slump of Hydraulic-Cement Concrete; ASTM C143/C143M-10a:2012; American Society for Testing Materials: West Conshohocken, PA, USA, 2012. [Google Scholar]
- ASTM Standards Publication. Standard Specification for Mixing Rooms, Moist Cabinets, Moist Rooms and Water Storage Tanks Used in the Testing of Hydraulic Cements and Concretes; ASTM C511:2009; American Society for Testing Materials: West Conshohocken, PA, USA, 2009. [Google Scholar]
- ASTM Standards Publication. Standard Test Method for Compressive Strength of Hydraulic Cement Mortars (Using 2-In. Or [50-Mm] Cube Specimens); ASTM C109/C109M-12:2013; American Society for Testing Materials: West Conshohocken, PA, USA, 2013. [Google Scholar]
- BSI Standards Publication. Method for Determination of Water Absorption; BS 1881-122:2011; Bristish Standard Institute: London, UK, 2011. [Google Scholar]
- Khaleel, O.R.; Abdul Razak, H. The effect of powder type on the setting time and self compactability of mortar. Constr. Build. Mater. 2012, 36, 20–26. [Google Scholar] [CrossRef]
- Turk, K. Viscosity and hardened properties of self-compacting mortars with binary and ternary cementitious blends of fly ash and silica fume. Constr. Build. Mater. 2012, 37, 326–334. [Google Scholar] [CrossRef]
- Henry, M.; Pardo, G.; Nishimura, T.; Kato, Y. Balancing durability and environmental impact in concrete combining low-grade recycled aggregates and mineral admixtures. Resour. Conserv. Recycl. 2011, 55, 1060–1069. [Google Scholar] [CrossRef]
- Fantilli, A.P.; Chiaia, B. Eco-mechanical performances of cement-based materials: An application to self-consolidating concrete. Constr. Build. Mater. 2013, 40, 189–196. [Google Scholar] [CrossRef]
- The Concrete Centre. Concrete Industry Sustainability Performance Report. 2nd Report: 2008 Performance Data and Release of 2012 Performance Targets. Available online: http://www.sustainableconcrete.org.uk/pdf/MB_Performance_Report_Feb2010.pdf (accessed on 30 April 2016).
- Theodosiu, G. Cement and Concrete Institute Concrete Industry Greenhouse Gas Emissions; Cement and Concrete Institute: Midrand, South Africa, 2010. [Google Scholar]
- Khatib, J.M. Performance of self-compacting concrete containing fly ash. Constr. Build. Mater. 2008, 22, 1963–1971. [Google Scholar] [CrossRef]
- Naik, T.R.; Ramme, B.W. High early strength concrete containing large quantities of fly ash. ACI Mater. J 1989, 86, 111–116. [Google Scholar]
- Ranjbar, M.M.; Madandoust, R.; Mousavi, S.Y.; Yosefi, S. Effects of natural zeolite on the fresh and hardened properties of self-compacted concrete. Constr. Build. Mater. 2013, 47, 806–813. [Google Scholar] [CrossRef]
- Dinakar, P.; Babu, K.G.; Santhanam, M. Durability properties of high volume fly ash self compacting concretes. Cem. Concr. Compos. 2008, 30, 880–886. [Google Scholar] [CrossRef]
- Abdelaziz, E.; Saidur, R.; Mekhilef, S. A review on energy saving strategies in industrial sector. Renew. Sustain. Energy Rev. 2011, 15, 150–168. [Google Scholar] [CrossRef]
- Higuchi, T.; Morioka, M.; Yoshioka, I.; Yokozeki, K. Development of a new ecological concrete with CO2 emissions below zero. Constr. Build. Mater. 2014, 67, 338–343. [Google Scholar] [CrossRef]
- Torgal, F.P.; Miraldo, S.; Labrincha, J.; De Brito, J. An overview on concrete carbonation in the context of eco-efficient construction: Evaluation, use of SCMS and/or RAC. Constr. Build. Mater. 2012, 36, 141–150. [Google Scholar] [CrossRef]
- Cheerarot, R.; Jaturapitakkul, C. A study of disposed fly ash from landfill to replace portland cement. Waste Manag. 2004, 24, 701–709. [Google Scholar] [CrossRef] [PubMed]
- Karim, M.R.; Zain, M.F.M.; Jamil, M.; Lai, F.C.; Islam, M.N. Necessity and opportunity of sustainable concrete from malaysia’s waste materials. Austr. J. Basic Appl. Sci. 2011, 5, 998–1006. [Google Scholar]
- Zhang, T.; Gao, P.; Gao, P.; Wei, J.; Yu, Q. Effectiveness of novel and traditional methods to incorporate industrial wastes in cementitious materials—An overview. Resour. Conserv. Recycl. 2013, 74, 134–143. [Google Scholar] [CrossRef]
- Modak, P. Towards a green economy. Available online: http://www.unep.org/greeneconomy/Portals/88/documents/ger/GER_8_Waste.pdf (accessed on 4 May 2016).
- Izquierdo, M.; Querol, X. Leaching behaviour of elements from coal combustion fly ash: An overview. Int. J. Coal Geol. 2012, 94, 54–66. [Google Scholar] [CrossRef]
- Shaheen, S.M.; Hooda, P.S.; Tsadilas, C.D. Opportunities and challenges in the use of coal fly ash for soil improvements—A review. J. Environ. Manag. 2014, 145, 249–267. [Google Scholar] [CrossRef] [PubMed]
- Shende Abha, J.A.S.; Dara, S.S. Use of fly ash in reducing heavy metal toxicity to plants. Resour. Conserv. Recycl. 1994, 12, 221–228. [Google Scholar]
- Adriano, D.; Page, A.; Elseewi, A.; Chang, A.; Straughan, I. Utilization and disposal of fly ash and other coal residues in terrestrial ecosystems: A review. J. Environ. Qual. 1980, 9, 333–344. [Google Scholar] [CrossRef]
- Jabar, A.M.; (Tenaga Nasional Berhad, Manjung, Perak, Malaysia). Personal communication, 2013.
- Bie, R.; Chen, P.; Song, X.; Ji, X. Characteristics of municipal solid waste incineration fly ash with cement solidification treatment. J. Energy Inst. 2015. [Google Scholar] [CrossRef]
- Tsiridis, V.; Petala, M.; Samaras, P.; Kungolos, A.; Sakellaropoulos, G.P. Environmental hazard assessment of coal fly ashes using leaching and ecotoxicity tests. Ecotoxicol. Environ. Saf. 2012, 84, 212–220. [Google Scholar] [CrossRef] [PubMed]
- Jala, S.; Goyal, D. Fly ash as a soil ameliorant for improving crop production—A review. Bioresour. Technol. 2006, 97, 1136–1147. [Google Scholar] [CrossRef] [PubMed]
- Tripathi, R.C.; Masto, R.E.; Ram, L.C. Bulk use of pond ash for cultivation of wheat–maize–eggplant crops in sequence on a fallow land. Resour. Conserv. Recycl. 2009, 54, 134–139. [Google Scholar] [CrossRef]
- Pandey, V.C.; Abhilash, P.C.; Upadhyay, R.N.; Tewari, D.D. Application of fly ash on the growth performance and translocation of toxic heavy metals within Cajanus cajan L.: Implication for safe utilization of fly ash for agricultural production. J. Hazard Mater. 2009, 166, 255–259. [Google Scholar] [PubMed]
- Riehl, A.; Elsass, F.; Duplay, J.; Huber, F.; Trautmann, M. Changes in soil properties in a fluvisol (calcaric) amended with coal fly ash. Geoderma 2010, 155, 67–74. [Google Scholar] [CrossRef]
- Pourrut, B.; Lopareva-Pohu, A.; Pruvot, C.; Garcon, G.; Verdin, A.; Waterlot, C.; Bidar, G.; Shirali, P.; Douay, F. Assessment of fly ash-aided phytostabilisation of highly contaminated soils after an 8-year field trial part 2. Influence on plants. Sci. Total Environ. 2011, 409, 4504–4510. [Google Scholar] [CrossRef] [PubMed]
- Contaminated Land Management and Control Guidelines No.1 Malaysian Recommended Site Screening Levels for Contaminated Land. Available online: http://www.doe.gov.my/portalv1/wp-content/uploads/Contaminated-Land-Management-and-Control-Guidelines-No-1_Malaysian-Recommended-Site-Screening-Levels-for-Contaminated-Land.pdf (accessed on 29 April 2016).


| Mixture | Water: Binder (w/b) | Water (kg/m3) | Cement (kg/m3) | Sand (kg/m3) | Fly Ash (kg/m3) | SP (kg/m3) | Superplasticizer (SP) Dosage (%) | ||
|---|---|---|---|---|---|---|---|---|---|
| Normal | High | Self-Compacting | |||||||
| Mix 1A-C | 0.35 | 192.5 | 550 | 1100 | 0 | 1.10 | 0.20 | - | - |
| Mix 1B-C | 192.5 | 550 | 1100 | 0 | 3.30 | - | 0.60 | - | |
| Mix 1C-C | 192.5 | 550 | 1100 | 0 | 5.50 | - | - | 1.00 | |
| Mix 2A-10%FA | 0.35 | 192.5 | 495 | 1100 | 55 | 0.99 | 0.20 | - | - |
| Mix 2B-10%FA | 192.5 | 495 | 1100 | 55 | 2.23 | - | 0.45 | - | |
| Mix 2C-10% FA | 192.5 | 495 | 1100 | 55 | 3.47 | - | - | 0.70 | |
| Mix 3A-20% FA | 0.35 | 192.5 | 440 | 1100 | 110 | 0.79 | 0.18 | - | - |
| Mix 3B-20% FA | 192.5 | 440 | 1100 | 110 | 1.54 | - | 0.35 | - | |
| Mix 3C-20%FA | 192.5 | 440 | 1100 | 110 | 2.64 | - | - | 0.60 | |
| Mix 4A-40%FA | 0.35 | 192.5 | 330 | 1100 | 220 | 0.53 | 0.16 | - | |
| Mix 4B-40%FA | 192.5 | 330 | 1100 | 220 | 0.99 | - | 0.30 | - | |
| Mix 4C-40%FA | 192.5 | 330 | 1100 | 220 | 1.91 | - | - | 0.58 | |
| Mix5A-60%FA | 0.35 | 192.5 | 220 | 1100 | 330 | 0.31 | 0.14 | - | - |
| Mix 5B-60%FA | 192.5 | 220 | 1100 | 330 | 0.62 | - | 0.28 | - | |
| Mix 5C-60%FA | 192.5 | 220 | 1100 | 330 | 1.14 | - | - | 0.52 | |
| Mix 6A-C | 0.40 | 180 | 450 | 900 | 0 | 0.90 | 0.20 | - | - |
| Mix 6B-C | 180 | 450 | 900 | 0 | 1.35 | - | 0.30 | - | |
| Mix 6C-C | 180 | 450 | 900 | 0 | 2.48 | - | - | 0.55 | |
| Mix 7A-10%FA | 0.40 | 180 | 405 | 900 | 45 | 0.73 | 0.18 | - | - |
| Mix 7B-10%FA | 180 | 405 | 900 | 45 | 1.13 | - | 0.28 | - | |
| Mix 7C-10% FA | 180 | 405 | 900 | 45 | 2.03 | - | - | 0.5 | |
| Mix 8A-20% FA | 0.40 | 180 | 360 | 900 | 90 | 0.61 | 0.17 | - | - |
| Mix 8B-20% FA | 180 | 360 | 900 | 90 | 0.97 | - | 0.27 | - | |
| Mix 8C-20%FA | 180 | 360 | 900 | 90 | 1.76 | - | - | 0.49 | |
| Mix 9A-40%FA | 0.40 | 180 | 270 | 900 | 180 | 0.43 | 0.16 | - | - |
| Mix 9B-40%FA | 180 | 270 | 900 | 180 | 0.68 | - | 0.25 | - | |
| Mix 9C-40%FA | 180 | 270 | 900 | 180 | 1.27 | - | - | 0.47 | |
| Mix 10A-60%FA | 0.40 | 180 | 180 | 900 | 270 | 0.23 | 0.13 | - | - |
| Mix 10B-60%FA | 180 | 180 | 900 | 270 | 0.31 | - | 0.17 | - | |
| Mix 10C-60%FA | 180 | 180 | 900 | 270 | 0.72 | - | - | 0.40 | |
| Mixture | Water: Binder (w/b) | Water (kg/m3) | Cement (kg/m3) | Sand (kg/m3) | Fly Ash (kg/m3) | SP (kg/m3) | Superplasticizer(SP) Dosage (%) | ||
|---|---|---|---|---|---|---|---|---|---|
| Normal | High | Self-Compacting | |||||||
| Mix 11A-C | 0.45 | 157.5 | 350 | 700 | 0 | 0.63 | 0.18 | - | - |
| Mix 11B-C | 157.5 | 350 | 700 | 0 | 1.09 | - | 0.31 | - | |
| Mix 11C-C | 157.5 | 350 | 700 | 0 | 1.51 | - | - | 0.43 | |
| Mix 12A-10%FA | 0.45 | 157.5 | 315 | 700 | 35 | 0.47 | 0.15 | - | - |
| Mix 12B-10%FA | 157.5 | 315 | 700 | 35 | 0.95 | - | 0.30 | - | |
| Mix 12C-10% FA | 157.5 | 315 | 700 | 35 | 1.32 | - | - | 0.42 | |
| Mix 13A-20% FA | 0.45 | 157.5 | 280 | 700 | 70 | 0.39 | 0.14 | - | - |
| Mix 13B-20% FA | 157.5 | 280 | 700 | 70 | 0.56 | - | 0.20 | - | |
| Mix 13C-20%FA | 157.5 | 280 | 700 | 70 | 1.06 | - | - | 0.38 | |
| Mix 14A-40%FA | 0.45 | 157.5 | 210 | 700 | 140 | 0.27 | 0.13 | - | - |
| Mix 14B-40%FA | 157.5 | 210 | 700 | 140 | 0.32 | - | 0.15 | - | |
| Mix 14C-40%FA | 157.5 | 210 | 700 | 140 | 0.67 | - | - | 0.32 | |
| Mix 15A-60%FA | 0.45 | 157.5 | 140 | 700 | 210 | 0.15 | 0.11 | - | - |
| Mix 15B-60%FA | 157.5 | 140 | 700 | 210 | 0.34 | - | 0.24 | - | |
| Mix 15C-60%FA | 157.5 | 140 | 700 | 210 | 0.28 | - | - | 0.20 | |
| Mix 16A-C | 0.50 | 125 | 250 | 500 | 0 | 0.38 | 0.15 | - | - |
| Mix 16B-C | 125 | 250 | 500 | 0 | 0.75 | - | 0.30 | - | |
| Mix 16C-C | 125 | 250 | 500 | 0 | 1.00 | - | - | 0.4 | |
| Mix 17A-10%FA | 0.50 | 125 | 225 | 500 | 25 | 0.29 | 0.13 | - | - |
| Mix 17B-10%FA | 125 | 225 | 500 | 25 | 0.61 | - | 0.27 | - | |
| Mix 17C-10% FA | 125 | 225 | 500 | 25 | 0.86 | - | - | 0.38 | |
| Mix 18A-20% FA | 0.50 | 125 | 200 | 500 | 50 | 0.24 | 0.12 | - | - |
| Mix 18B-20% FA | 125 | 200 | 500 | 50 | 0.48 | - | 0.24 | - | |
| Mix 18C-20%FA | 125 | 200 | 500 | 50 | 0.70 | - | - | 0.35 | |
| Mix 19A-40%FA | 0.50 | 125 | 150 | 500 | 100 | 0.15 | 0.10 | - | - |
| Mix 19B-40%FA | 125 | 150 | 500 | 100 | 0.27 | - | 0.18 | - | |
| Mix 19C-40%FA | 125 | 150 | 500 | 100 | 0.48 | - | - | 0.32 | |
| Mix 20A-60%FA | 0.50 | 125 | 100 | 500 | 150 | 0.08 | 0.08 | - | - |
| Mix 20B-60%FA | 125 | 100 | 500 | 150 | 0.15 | - | 0.15 | - | |
| Mix 20C-60%FA | 125 | 100 | 500 | 150 | 0.28 | - | - | 0.28 | |
| Component (%) | SiO2 | Al2O3 | CaO | Fe2O3 | MgO | SO3 | K2O | TiO2 | CO2 | Specific Gravity | Fineness (m2/kg) |
|---|---|---|---|---|---|---|---|---|---|---|---|
| Cement | 18.47 | 4.27 | 64.09 | 2.06 | 2.08 | 4.25 | 0.28 | 0.11 | 4.2 | 3.11 | 390 |
| Fly Ash | 48.2 | 30.7 | 8.31 | - | - | 0.78 | 1.06 | - | - | 2.27 | 469 |
| Element | Specific Emission (kg-CO2/tonne) |
|---|---|
| Aggregate | 4 |
| Cement CEM I | 1000 |
| Fly Ash | 50 |
| Water | 0.3 |
| Admixtures | 0.2 |
| Concrete Materials | Putri et al. [21] | Henry et al. [37] | Flower et al. [22] | The Concrete Centre [39] | Theodosiu [40] |
|---|---|---|---|---|---|
| Normal Portland cement | 1000 | 767 | 822 | 819 | 818 |
| Aggregate | 4 | 3 | 32 | 4 | 5 |
| Fly Ash | 50 | 20 | 27 | 4 | 2 |
| GGBS | * | 27 | 143 | 52 | 128 |
| Admixture | 0.2 | * | * | 380 | 220 |
| Water | 0.3 | * | * | * | * |
| Unit | Kg-CO2/tonne | Kg-CO2-e/tonne | |||
| Tested Age | Normal Mixes | High Mixes | Self-Compacting Mixes |
|---|---|---|---|
| 7 Days | Y = 0.0914x + 5.9986 (R2 = 0.7903) 18 MPa < fc < 60 Mpa | Y = 0.11x + 3.9642 (R2 = 0.9097) 25 MPa < fc < 65 Mpa | Y = 0.1156x + 5.666 (R2 = 0.9179) 25 MPa < fc < 70 Mpa |
| 28 Days | Y = 0.1005 + 17.525 (R2 = 0.8348) 25 MPa < fc < 75 Mpa | Y = 0.1134x + 18.1666 (R2 = 0.8816) 30 MPa < fc < 75 Mpa | Y = 0.1195x + 20.167 (R2 = 0.8961) 30 MPa < fc < 90 Mpa |
| 90 Days | Y = 0.0903x + 30.448 (R2 = 0.7366) 35 MPa < fc < 80 Mpa | Y = 0.1133x + 28.515 (R2 = 0.8599) 40 MPa < fc < 90 Mpa | Y = 0.1192x + 30.580 (R2 = 0.8769) 45 MPa < fc < 95 Mpa |
| Functional Unit (FU): m3 | Material and Production | Transportation | Energy | Total Emission | |||
|---|---|---|---|---|---|---|---|
| Materials | A (Mix Proportion) | B 1 (CO2 Emission) | A.B (CO2 Footprint) | D 2 | E 2 | F 3 | (A.B).(D.E.F) |
| Unit | (kg/m3) | (kg-CO2/m3) | (kg-CO2) | km | (CO2-kg/kg-km) | (CO2/FU) | (kg-CO2/FU) |
| OPC | 550 | 1000 | 550 | 100 | 5.18 × 10⁻⁵ | 4.392 | 12.51 |
| Fly Ash | 0 | 50 | 0 | 200 | 5.18 × 10⁻⁵ | **- | **- |
| Fine Aggregate | 1100 | 4 | 4.4 | 50 | 5.18 × 10⁻⁵ | **- | **- |
| Water | 192.5 | 0.3 | 0.05775 | - | 6.30 × 10⁻⁵ | **- | **- |
| Admixture | 1 | 0.2 | 0.0002 | 50 | 2.21 × 10⁻⁴ | **- | **- |
| Total Production | 1843.5 | 554.458 | 400 | 4.394 × 10⁻⁵ | 4.392 | 558.87 | |
| Functional Unit (FU): m3 | Material and Production | Transportation | Energy | Total Emission | |||
|---|---|---|---|---|---|---|---|
| Materials | A (Mix Proportion) | B 1 (CO2 Emission) | A.B (CO2 Footprint) | D 2 | E 2 | F 3 | (A.B).(D.E.F) |
| Unit | (kg/m3) | (kg-CO2/m3) | (kg-CO2) | km | (CO2-kg/kg-km) | (CO2/FU) | (kg-CO2/FU) |
| OPC | 495 | 1000 | 495 | 100 | 5.18 × 10⁻⁵ | 4.392 | 11.26 |
| Fly Ash | 55 | 50 | 2.75 | 200 | 5.18 × 10⁻⁵ | 2.196 | 0.0626 |
| Fine Aggregate | 1100 | 4 | 4.4 | 50 | 5.18 × 10⁻⁵ | 0.17568 | 0.0020 |
| Water | 192.5 | 0.3 | 0.05775 | - | 6.30 × 10⁻⁵ | 0.013176 | *- |
| Admixture | 0.7 | 0.2 | 0.00014 | 50 | 2.21 × 10⁻⁴ | 0.008784 | *- |
| Total Production | 1843.2 | 502.208 | 400 | 4.394 × 10⁻⁵ | 6.78564 | 509.01 | |
| Functional Unit (FU): m3 | Material and Production | Transportation | Energy | Total Emission | |||
|---|---|---|---|---|---|---|---|
| Materials | A (Mix Proportion) | B 1 (CO2 Emission) | A.B (CO2 Footprint) | D 2 | E 2 | F 3 | (A.B).D.E.F |
| Unit | (kg/m3) | (kg-CO2/m3) | (kg-CO2) | km | (CO2-kg/kg-km) | (CO2/FU) | (kg-CO2/FU) |
| OPC | 440 | 1000 | 440 | 100 | 5.18 × 10⁻⁵ | 4.392 | 10.01 |
| Fly Ash | 110 | 50 | 5.5 | 200 | 5.18 × 10⁻⁵ | 2.196 | 0.1251 |
| Fine Aggregate | 1100 | 4 | 4.4 | 50 | 5.18 × 10⁻⁵ | 0.17568 | 0.0020 |
| Water | 192.5 | 0.3 | 0.05775 | - | 6.30 × 10⁻⁵ | 0.013176 | *- |
| Admixture | 0.6 | 0.2 | 0.00012 | 50 | 2.21 × 10⁻⁴ | 0.008784 | *- |
| Production | 1843.1 | 1054.5 | 449.958 | 400 | 4.394 × 10⁻⁵ | 6.78564 | 456.76 |
| Functional Unit (FU): m3 | Material and Production | Transportation | Energy | Total Emission | |||
|---|---|---|---|---|---|---|---|
| Materials | A (Mix Proportion) | B 1 (CO2 Emission) | A.B (CO2 Footprint) | D 2 | E 2 | F 3 | (A.B).D.E.F |
| Unit | (kg/m3) | (kg-CO2/m3) | (kg-CO2) | km | (CO2-kg/kg-km) | (CO2/FU) | (kg-CO2/FU) |
| OPC | 330 | 1000 | 330 | 100 | 5.18 × 10⁻⁵ | 4.392 | 7.51 |
| Fly Ash | 220 | 50 | 11 | 200 | 5.18 × 10⁻⁵ | 2.196 | 0.2503 |
| Fine Aggregate | 1100 | 4 | 4.4 | 50 | 5.18 × 10⁻⁵ | 0.17568 | 0.0020 |
| Water | 192.5 | 0.3 | 0.05775 | - | 6.30 × 10⁻⁵ | 0.013176 | *- |
| Admixture | 0.58 | 0.2 | 0.000116 | 50 | 2.21 × 10⁻⁴ | 0.008784 | *- |
| Production | 1843.08 | - | 345.458 | 400 | 4.394 × 10⁻⁵ | 6.78564 | 352.26 |
| Functional Unit (FU): m3 | Material and Production | Transportation | Energy | Total Emission | |||
|---|---|---|---|---|---|---|---|
| Materials | A (Mix Proportion) | B 1 (CO2 Emission) | A.B (CO2 Footprint) | D 2 | E 2 | F 3 | (A.B).D.E.F |
| Unit | (kg/m3) | (kg-CO2/m3) | (kg-CO2) | km | (CO2-kg/kg-km) | (CO2/FU) | (kg-CO2/FU) |
| OPC | 220 | 1000 | 220 | 100 | 5.18 × 10⁻⁵ | 4.392 | 5.01 |
| Fly Ash | 330 | 50 | 16.5 | 200 | 5.18 × 10⁻⁵ | 2.196 | 0.3754 |
| Fine Aggregate | 1100 | 4 | 4.4 | 50 | 5.18 × 10⁻⁵ | 0.17568 | 0.0020 |
| Water | 192.5 | 0.3 | 0.05775 | - | 6.30 × 10⁻⁵ | 0.013176 | *- |
| Admixture | 0.52 | 0.2 | 0.000104 | 50 | 2.21 × 10⁻⁴ | 0.008784 | *- |
| Production | 1843.02 | - | 240.958 | 400 | 4.394 × 10⁻⁵ | 6.78564 | 247.76 |
| Heavy Metals | Standard Measurement of Contaminated Land (Max) [64] | Standard Measurement of Contaminated Land (Min) [64] | Bie et al. [57] | Tsiridis et al. [58] | Jala et al. [59] | Tripathi et al. [60] | Pandey et al. [61] | Riehl et al. [62] | Lopareva et al. [63] |
|---|---|---|---|---|---|---|---|---|---|
| Zinc (Zn) | 54.3 | 6.9 | 29.32 | 0.45 | 79 | 57.7 | 82.3 | 167 | 85 |
| Lead (Pb) | 36 | 0.18 | 9.45 | 0.05 | 35 | 20 | 40.2 | 97 | 39 |
| Copper (Cu) | 19.8 | 4 | 5.23 | 0.23 | 0.002 | 65.8 | 58.4 | 57 | 38 |
| Cadmium (Cd) | 11.9 | 0.09 | 0.31 | 0.005 | 1.9 | 13.4 | 42.5 | 0.03 | - |
| Chromium (Cr) | 14.4 | 0.02 | 1.05 | 4.92 | 330 | 38.2 | 40.3 | 148 | 46 |
| Nickel (Ni) | 28.9 | 0.7 | 0.6 | 0.001 | 13 | 44.2 | 204.8 | 88 | 48 |
| Mercury (Hg) | 0.42 | 0.02 | 0.33 | - | - | - | - | - | 0.4 |
© 2016 by the authors; licensee MDPI, Basel, Switzerland. This article is an open access article distributed under the terms and conditions of the Creative Commons Attribution (CC-BY) license (http://creativecommons.org/licenses/by/4.0/).
Share and Cite
Razi, P.Z.; Abdul Razak, H.; Khalid, N.H.A. Sustainability, Eco-Point and Engineering Performance of Different Workability OPC Fly-Ash Mortar Mixes. Materials 2016, 9, 341. https://doi.org/10.3390/ma9050341
Razi PZ, Abdul Razak H, Khalid NHA. Sustainability, Eco-Point and Engineering Performance of Different Workability OPC Fly-Ash Mortar Mixes. Materials. 2016; 9(5):341. https://doi.org/10.3390/ma9050341
Chicago/Turabian StyleRazi, Putri Zulaiha, Hashim Abdul Razak, and Nur Hafizah A. Khalid. 2016. "Sustainability, Eco-Point and Engineering Performance of Different Workability OPC Fly-Ash Mortar Mixes" Materials 9, no. 5: 341. https://doi.org/10.3390/ma9050341
APA StyleRazi, P. Z., Abdul Razak, H., & Khalid, N. H. A. (2016). Sustainability, Eco-Point and Engineering Performance of Different Workability OPC Fly-Ash Mortar Mixes. Materials, 9(5), 341. https://doi.org/10.3390/ma9050341