
Controlled Photocatalytic Synthesis of Core–Shell SiC/Polyaniline Hybrid Nanostructures


Abstract
:1. Introduction
2. Materials and Methods
2.1. Chemicals
2.2. Nanocomposite Synthesis
2.3. Characterization
3. Results and Discussion
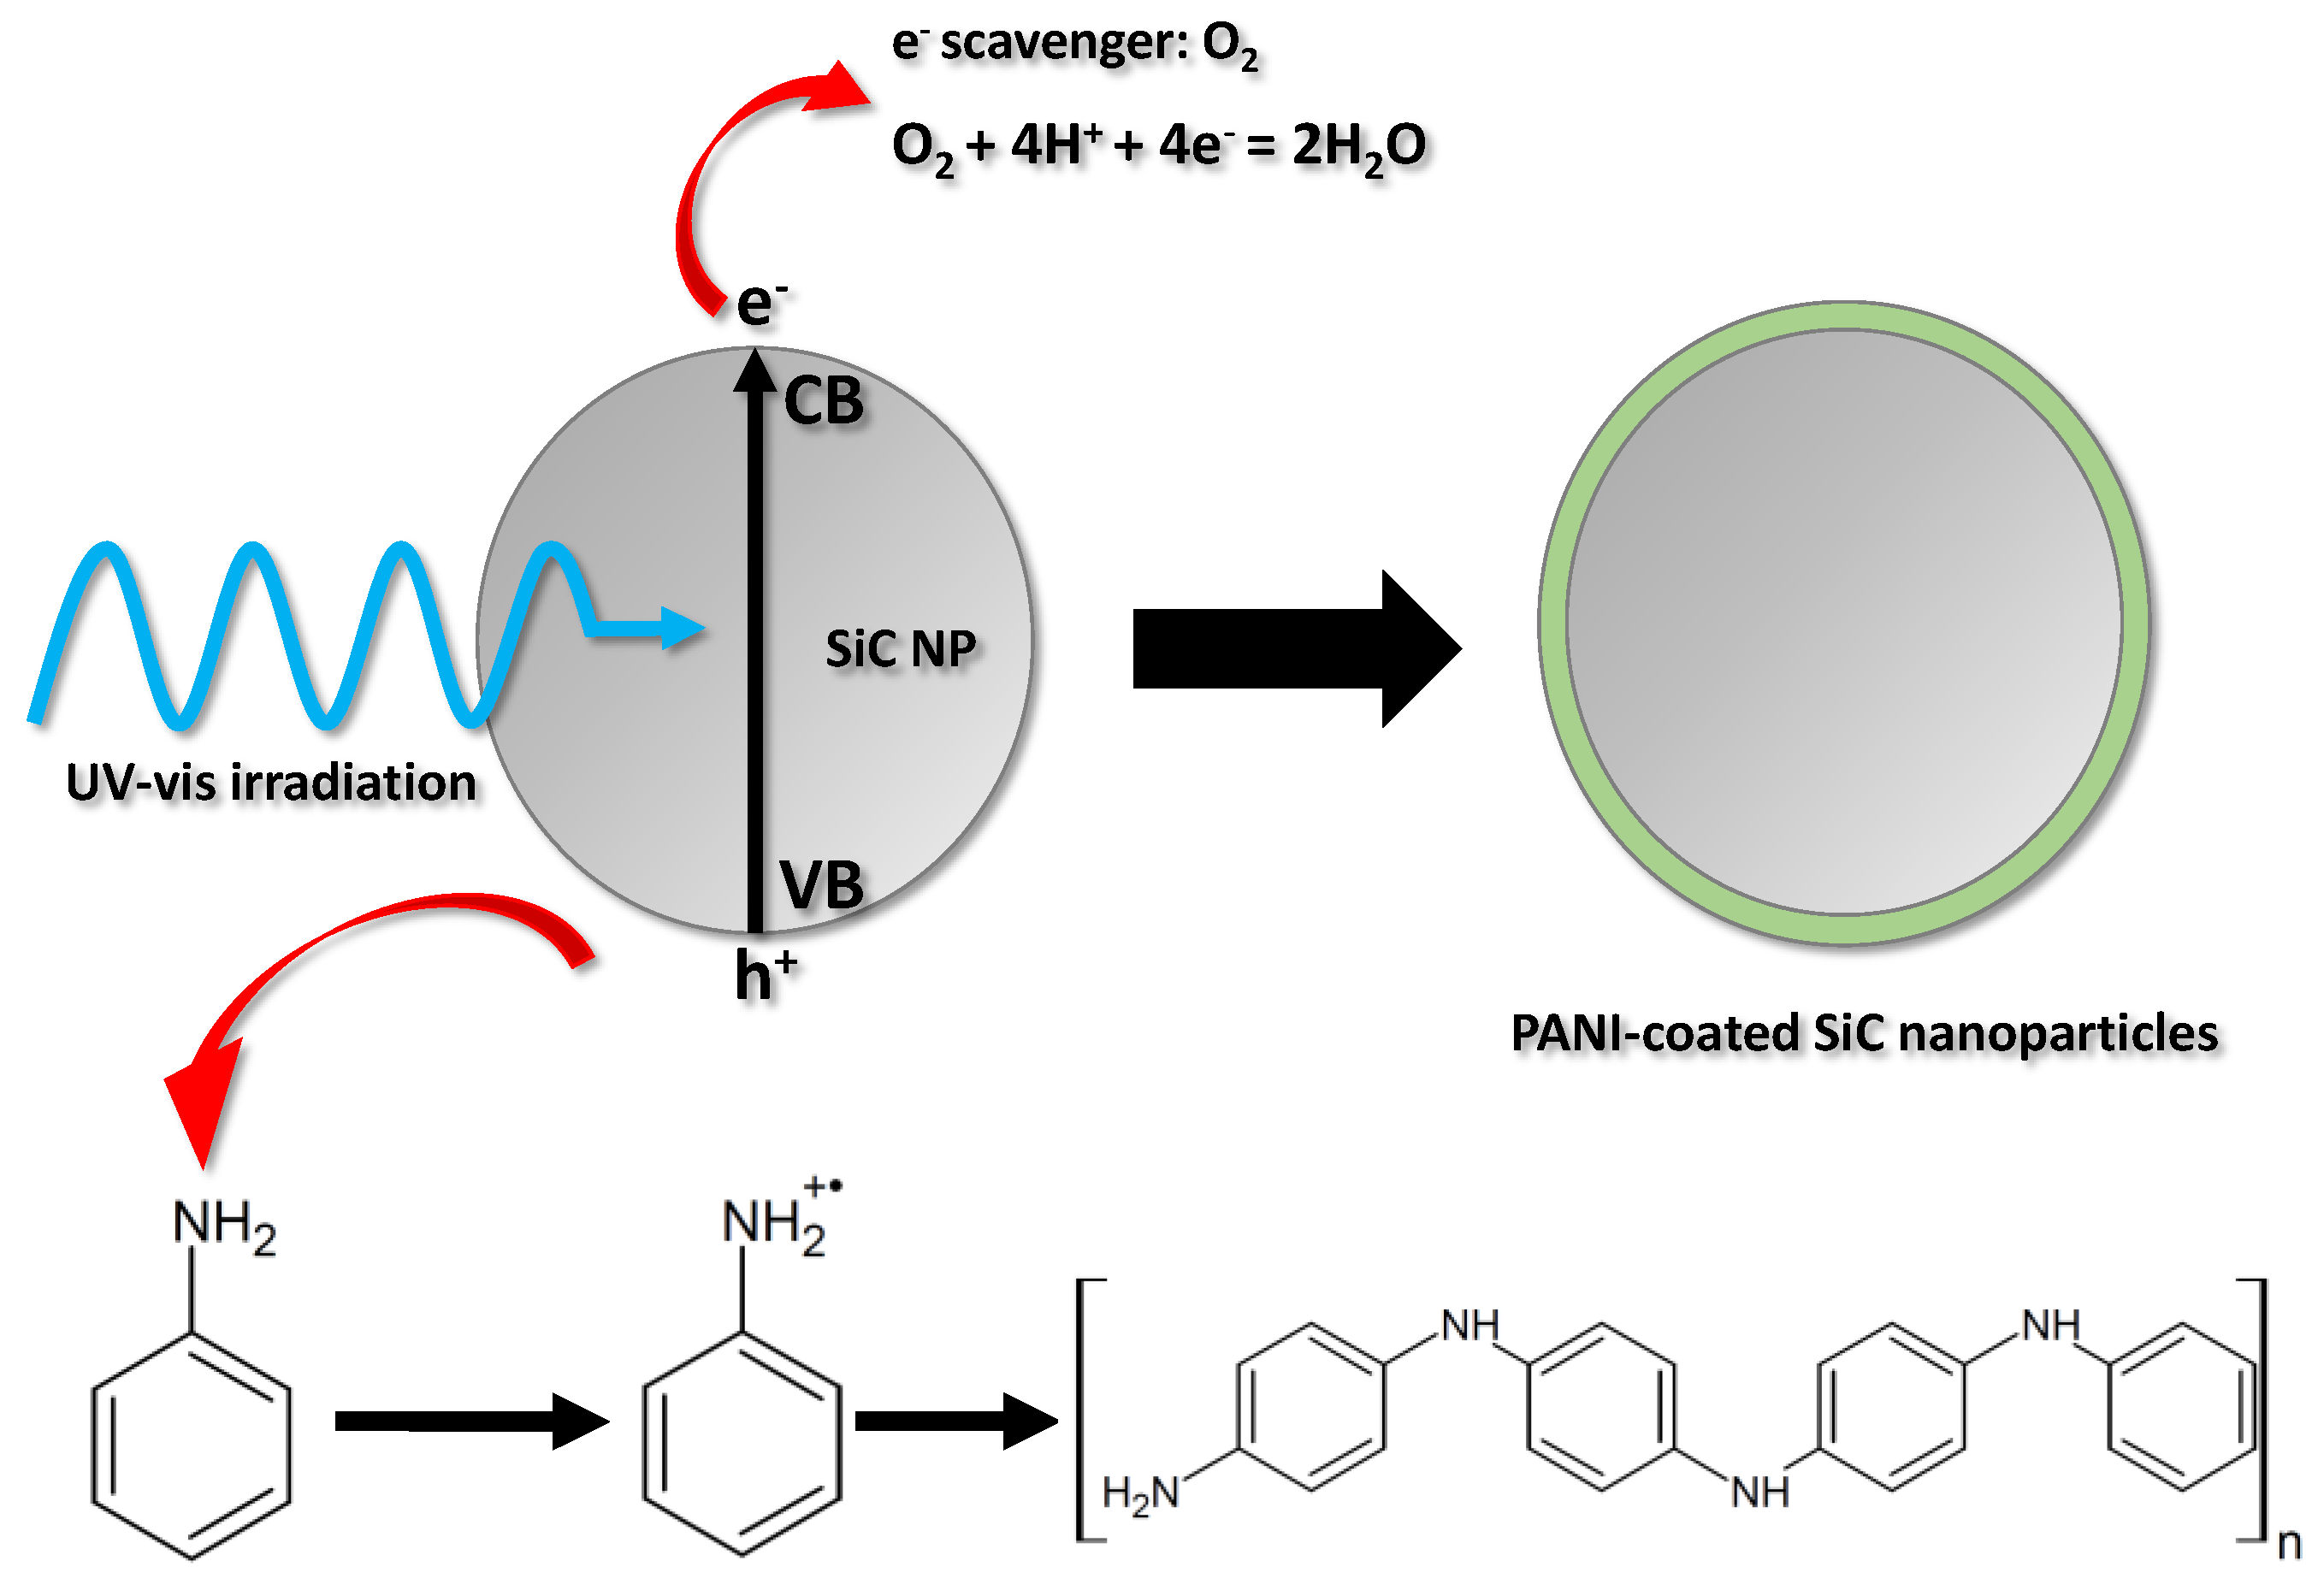
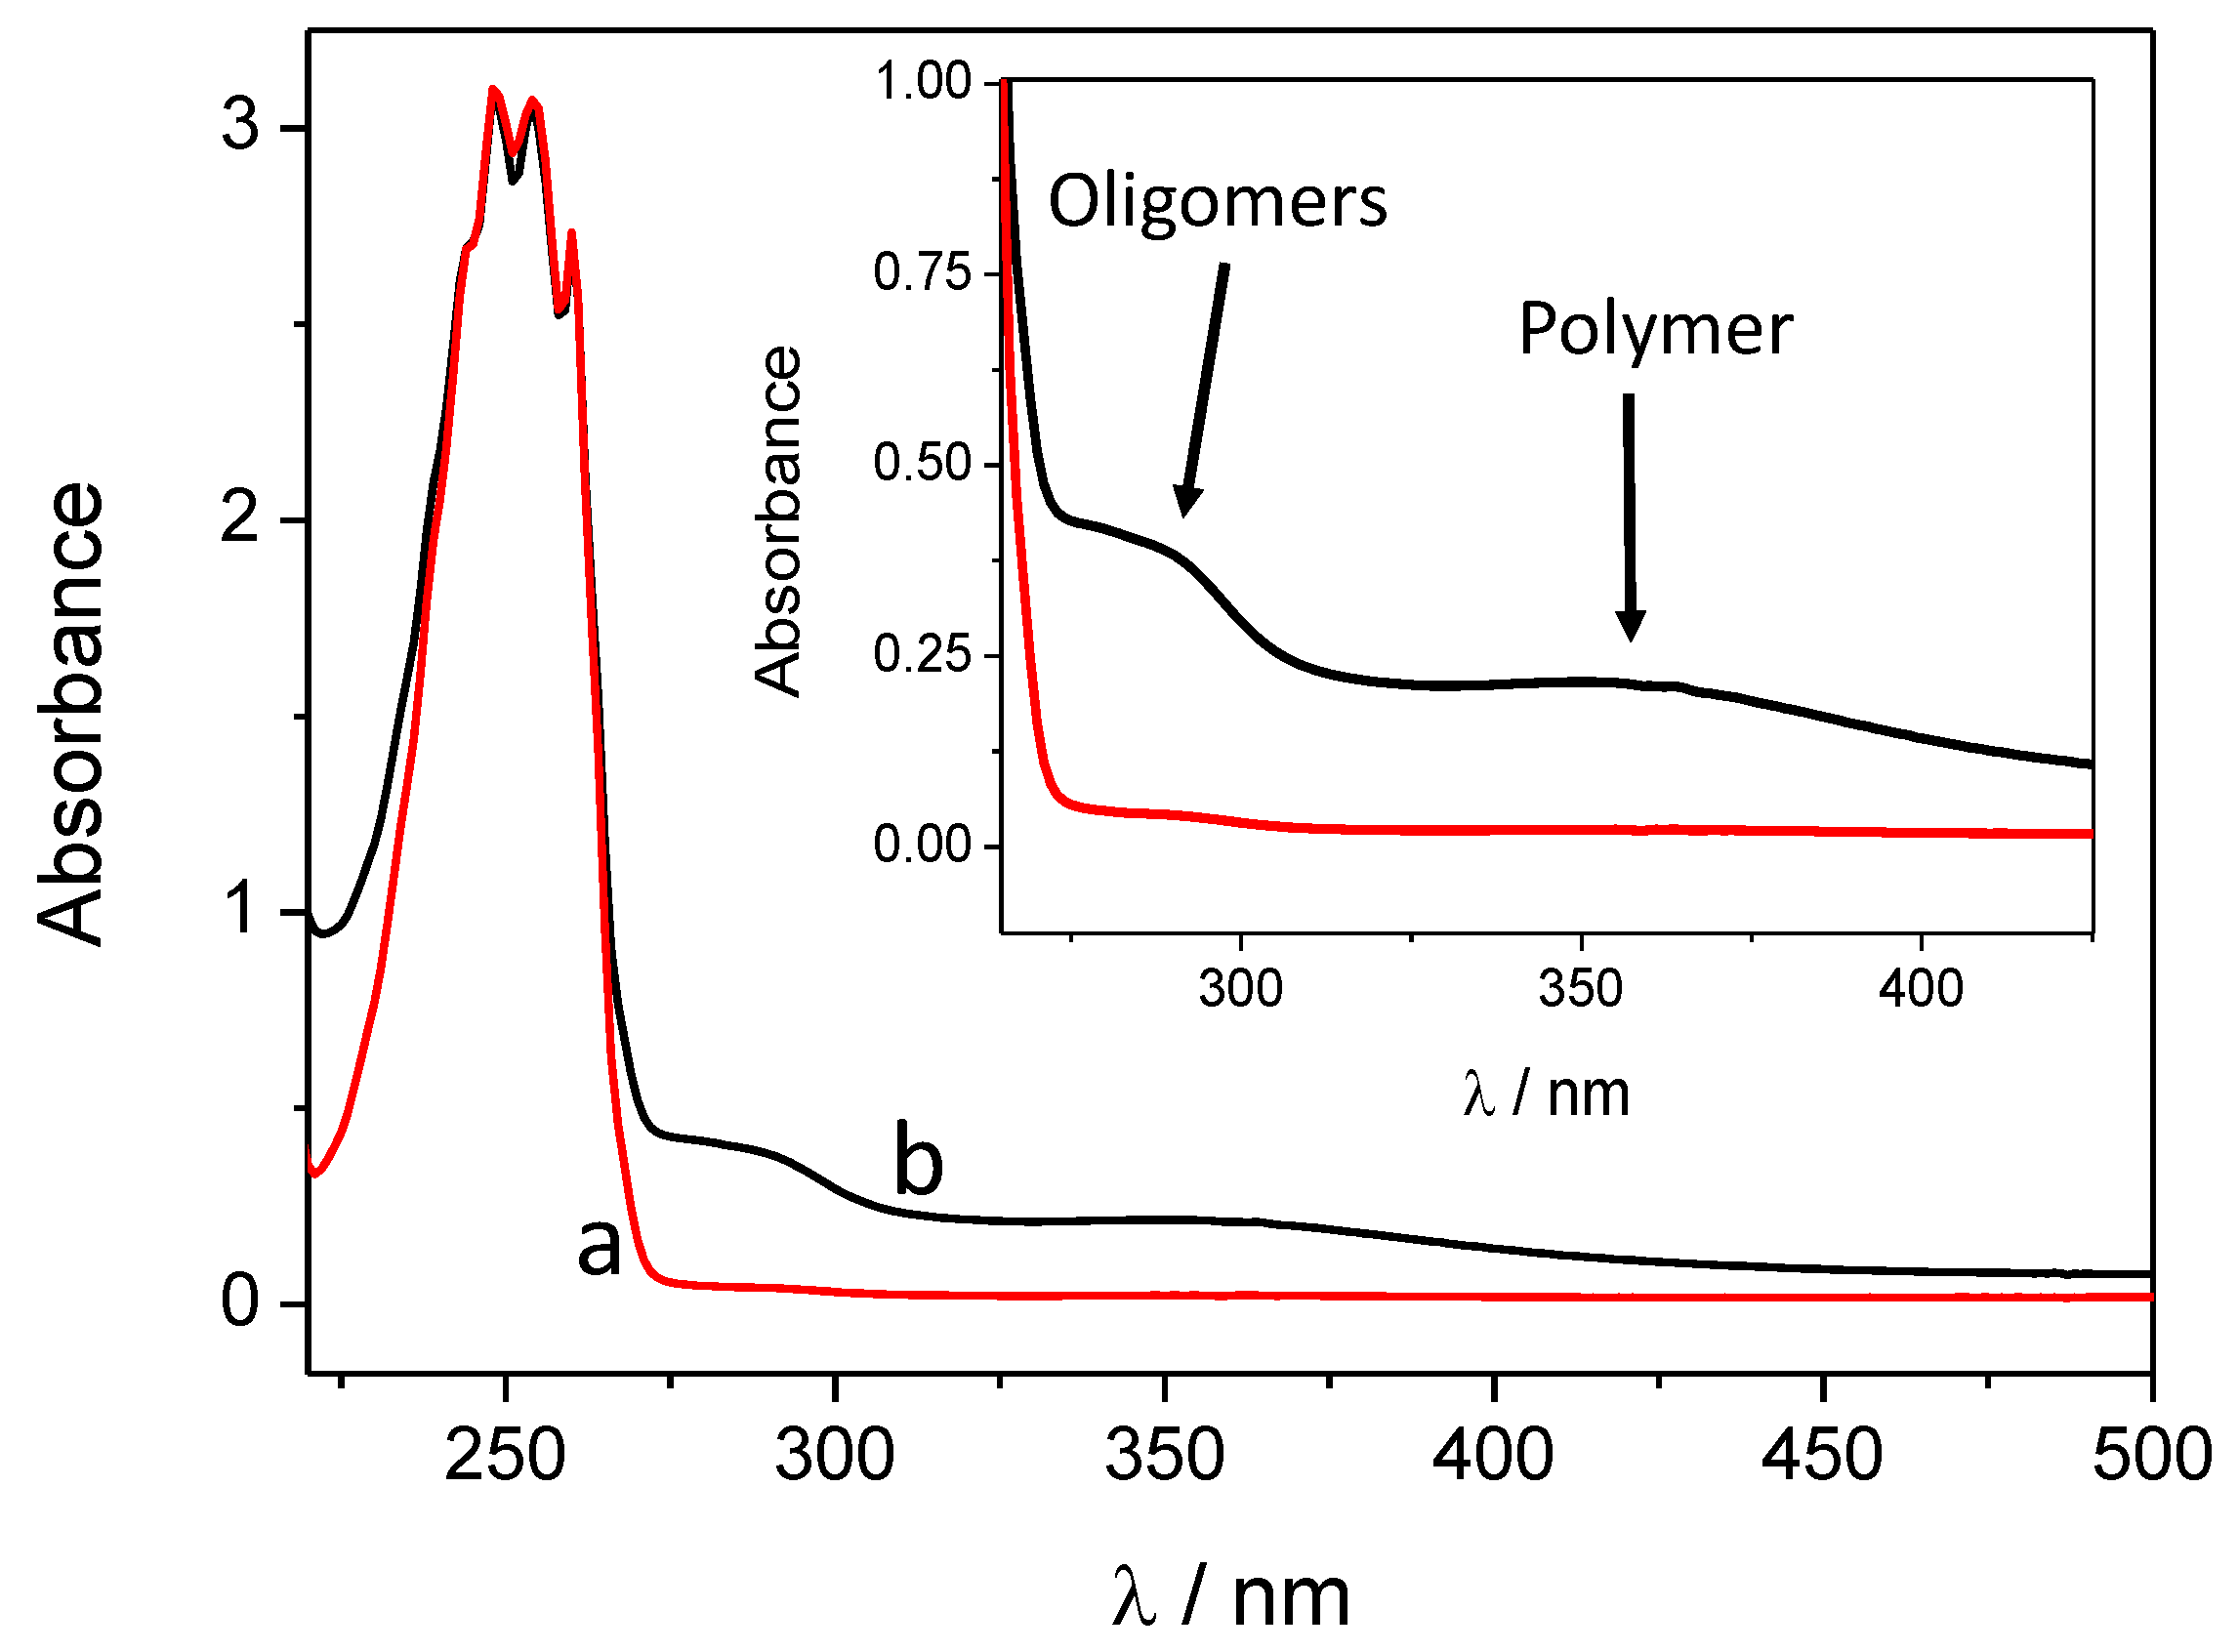
3.1. Synthesis of the Core–Shell Nanocompostites
3.2. Structural Characterization
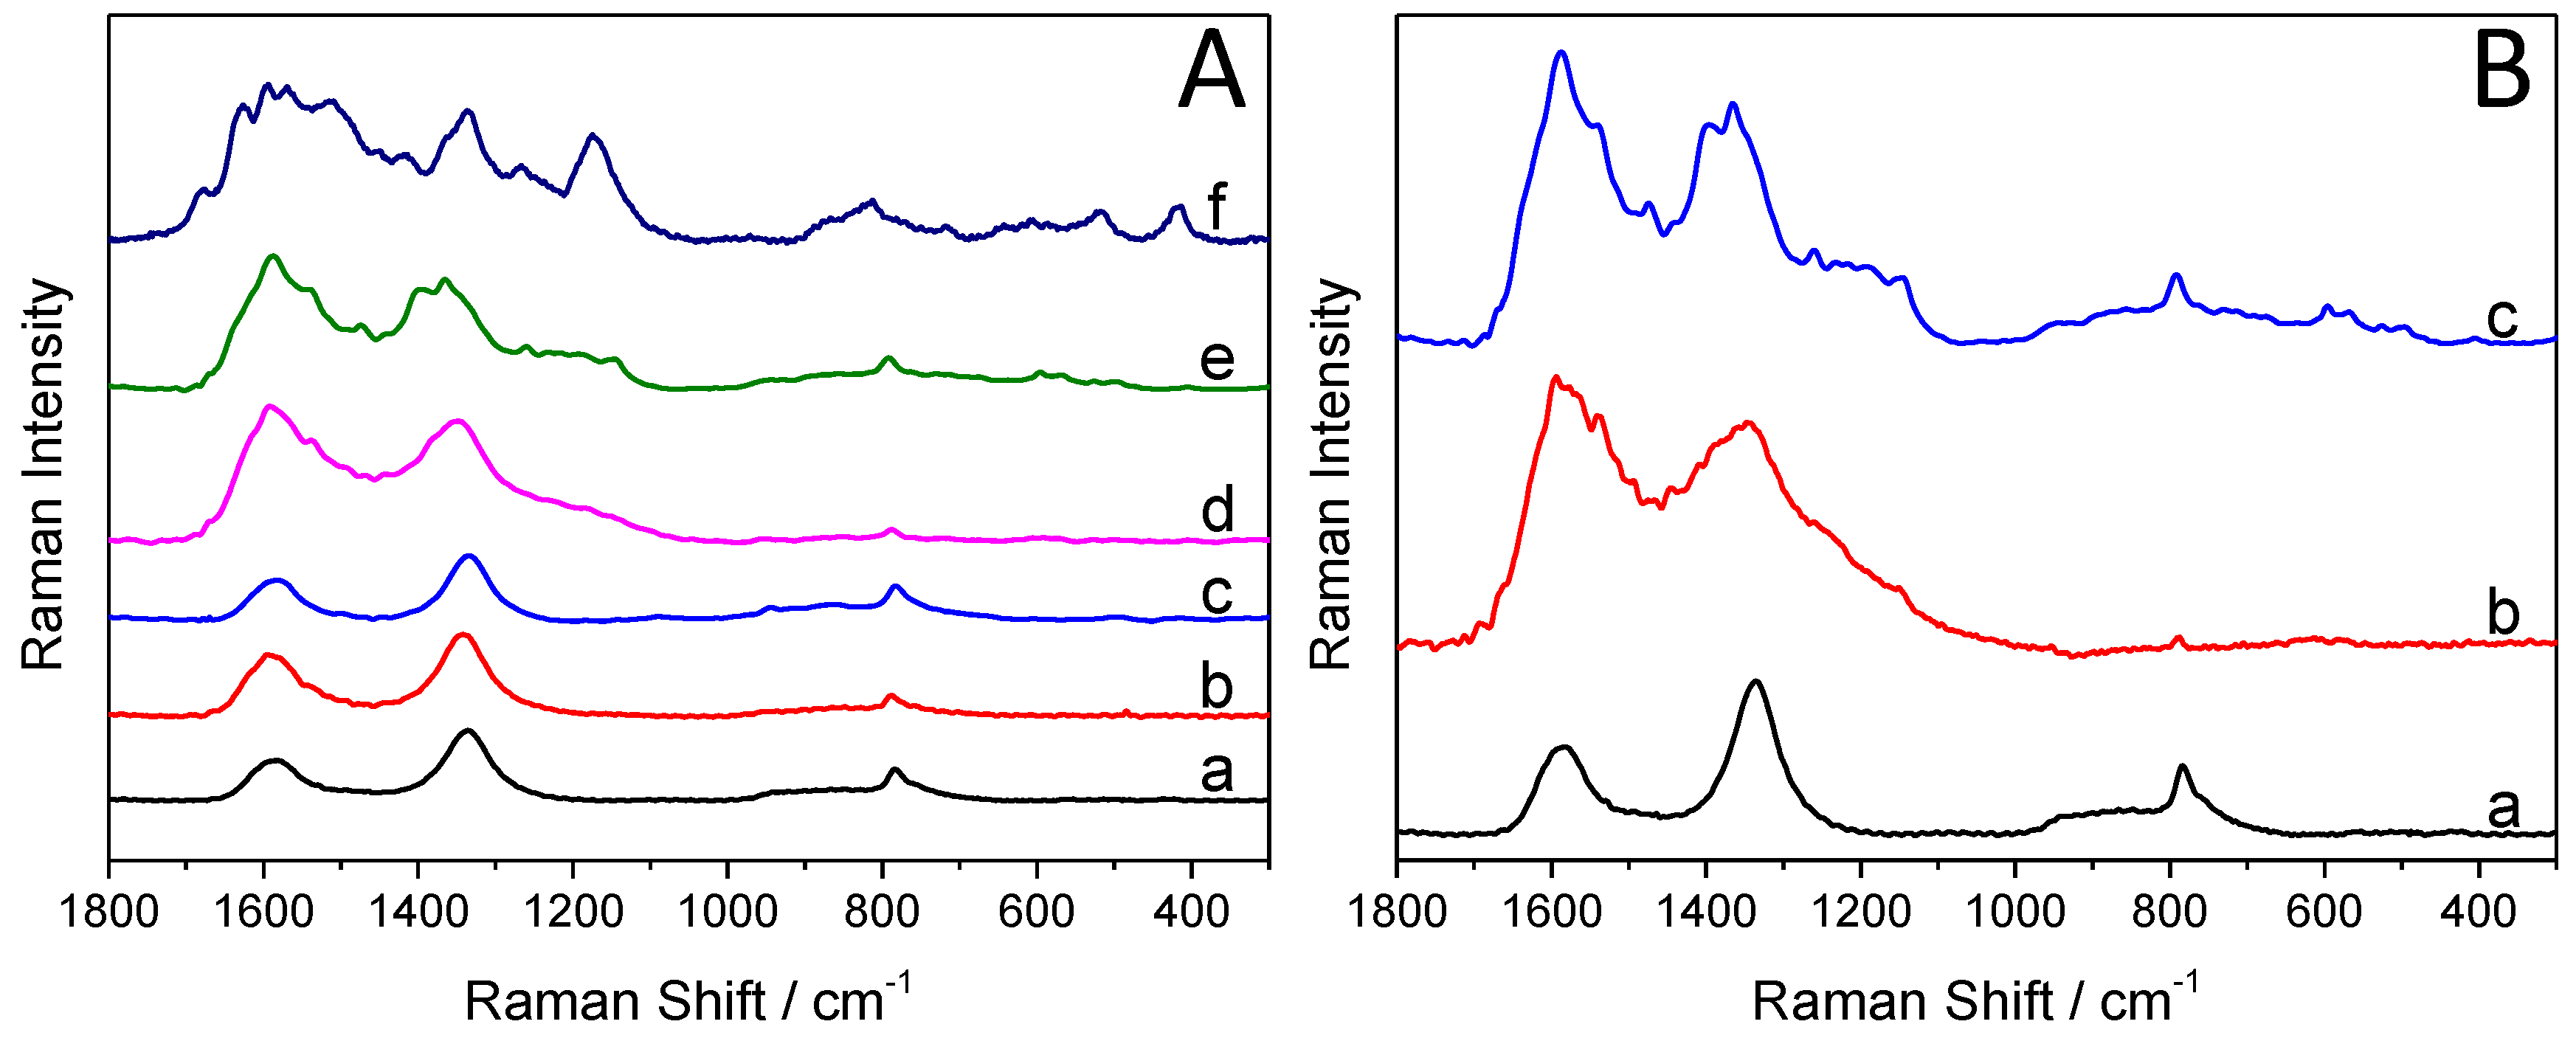
3.2.1. Raman Spectroscopy
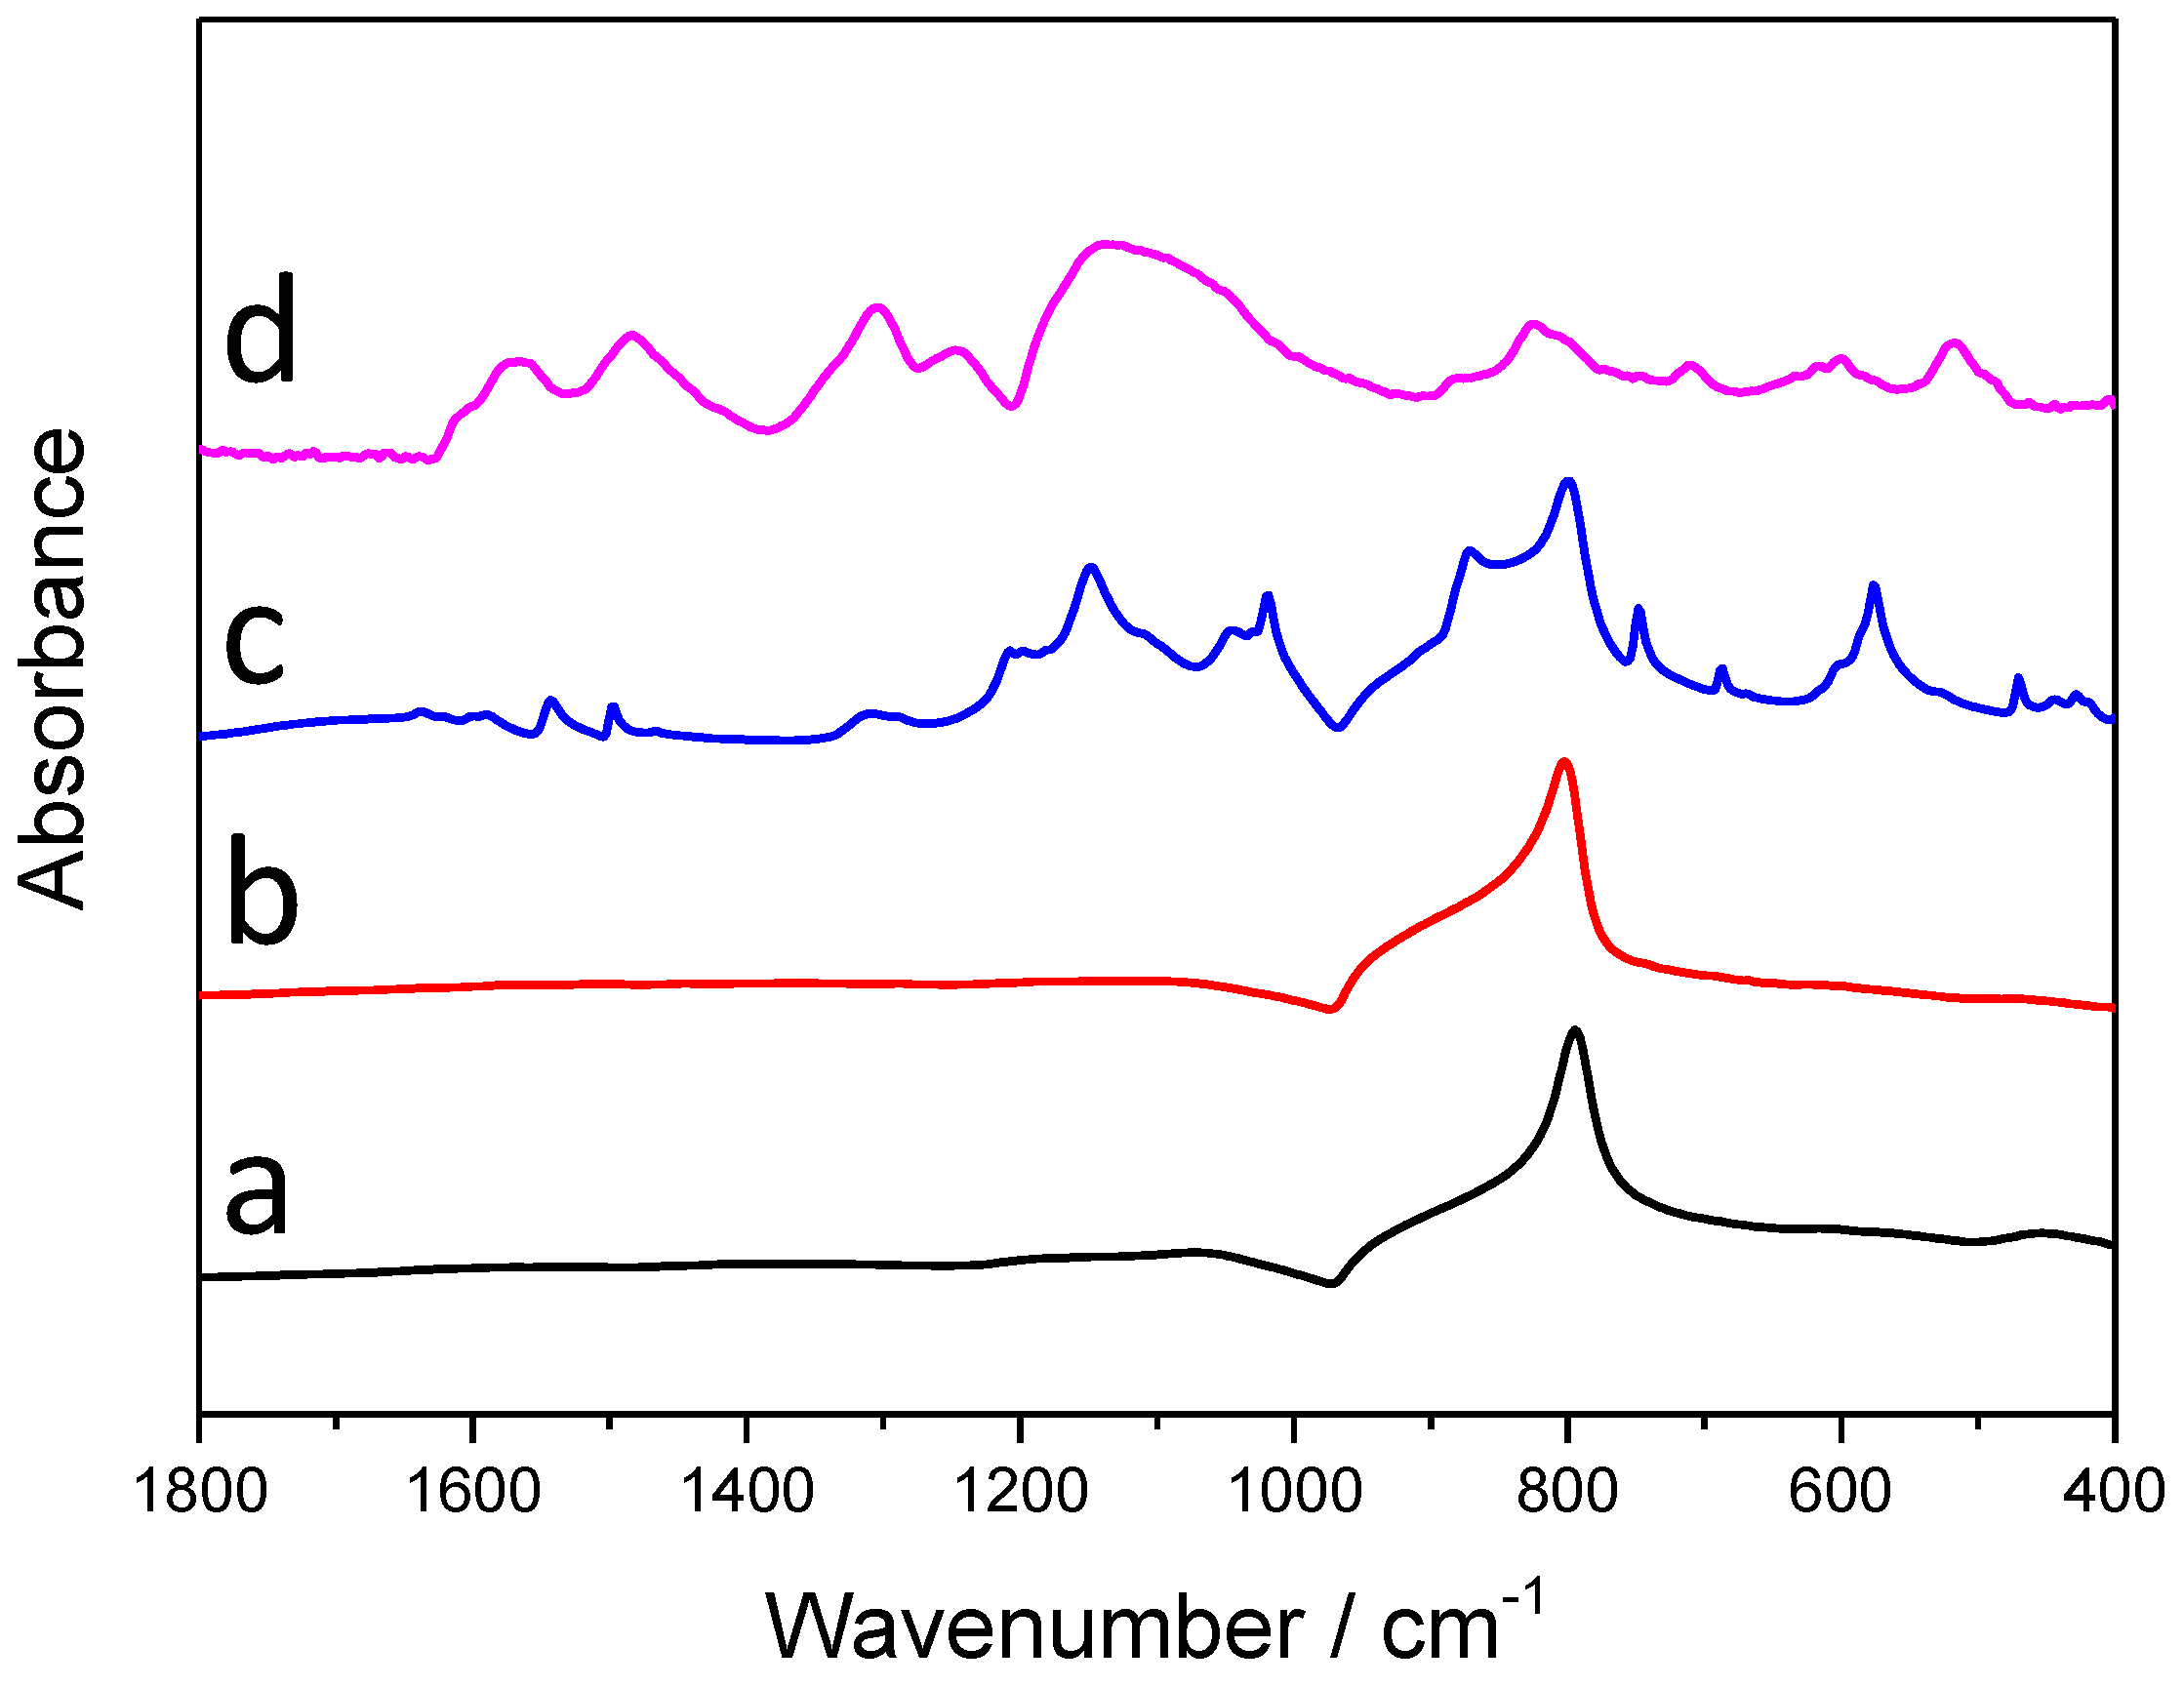
3.2.2. Infrared Spectroscopic Studies
3.3. Morphological Characterization
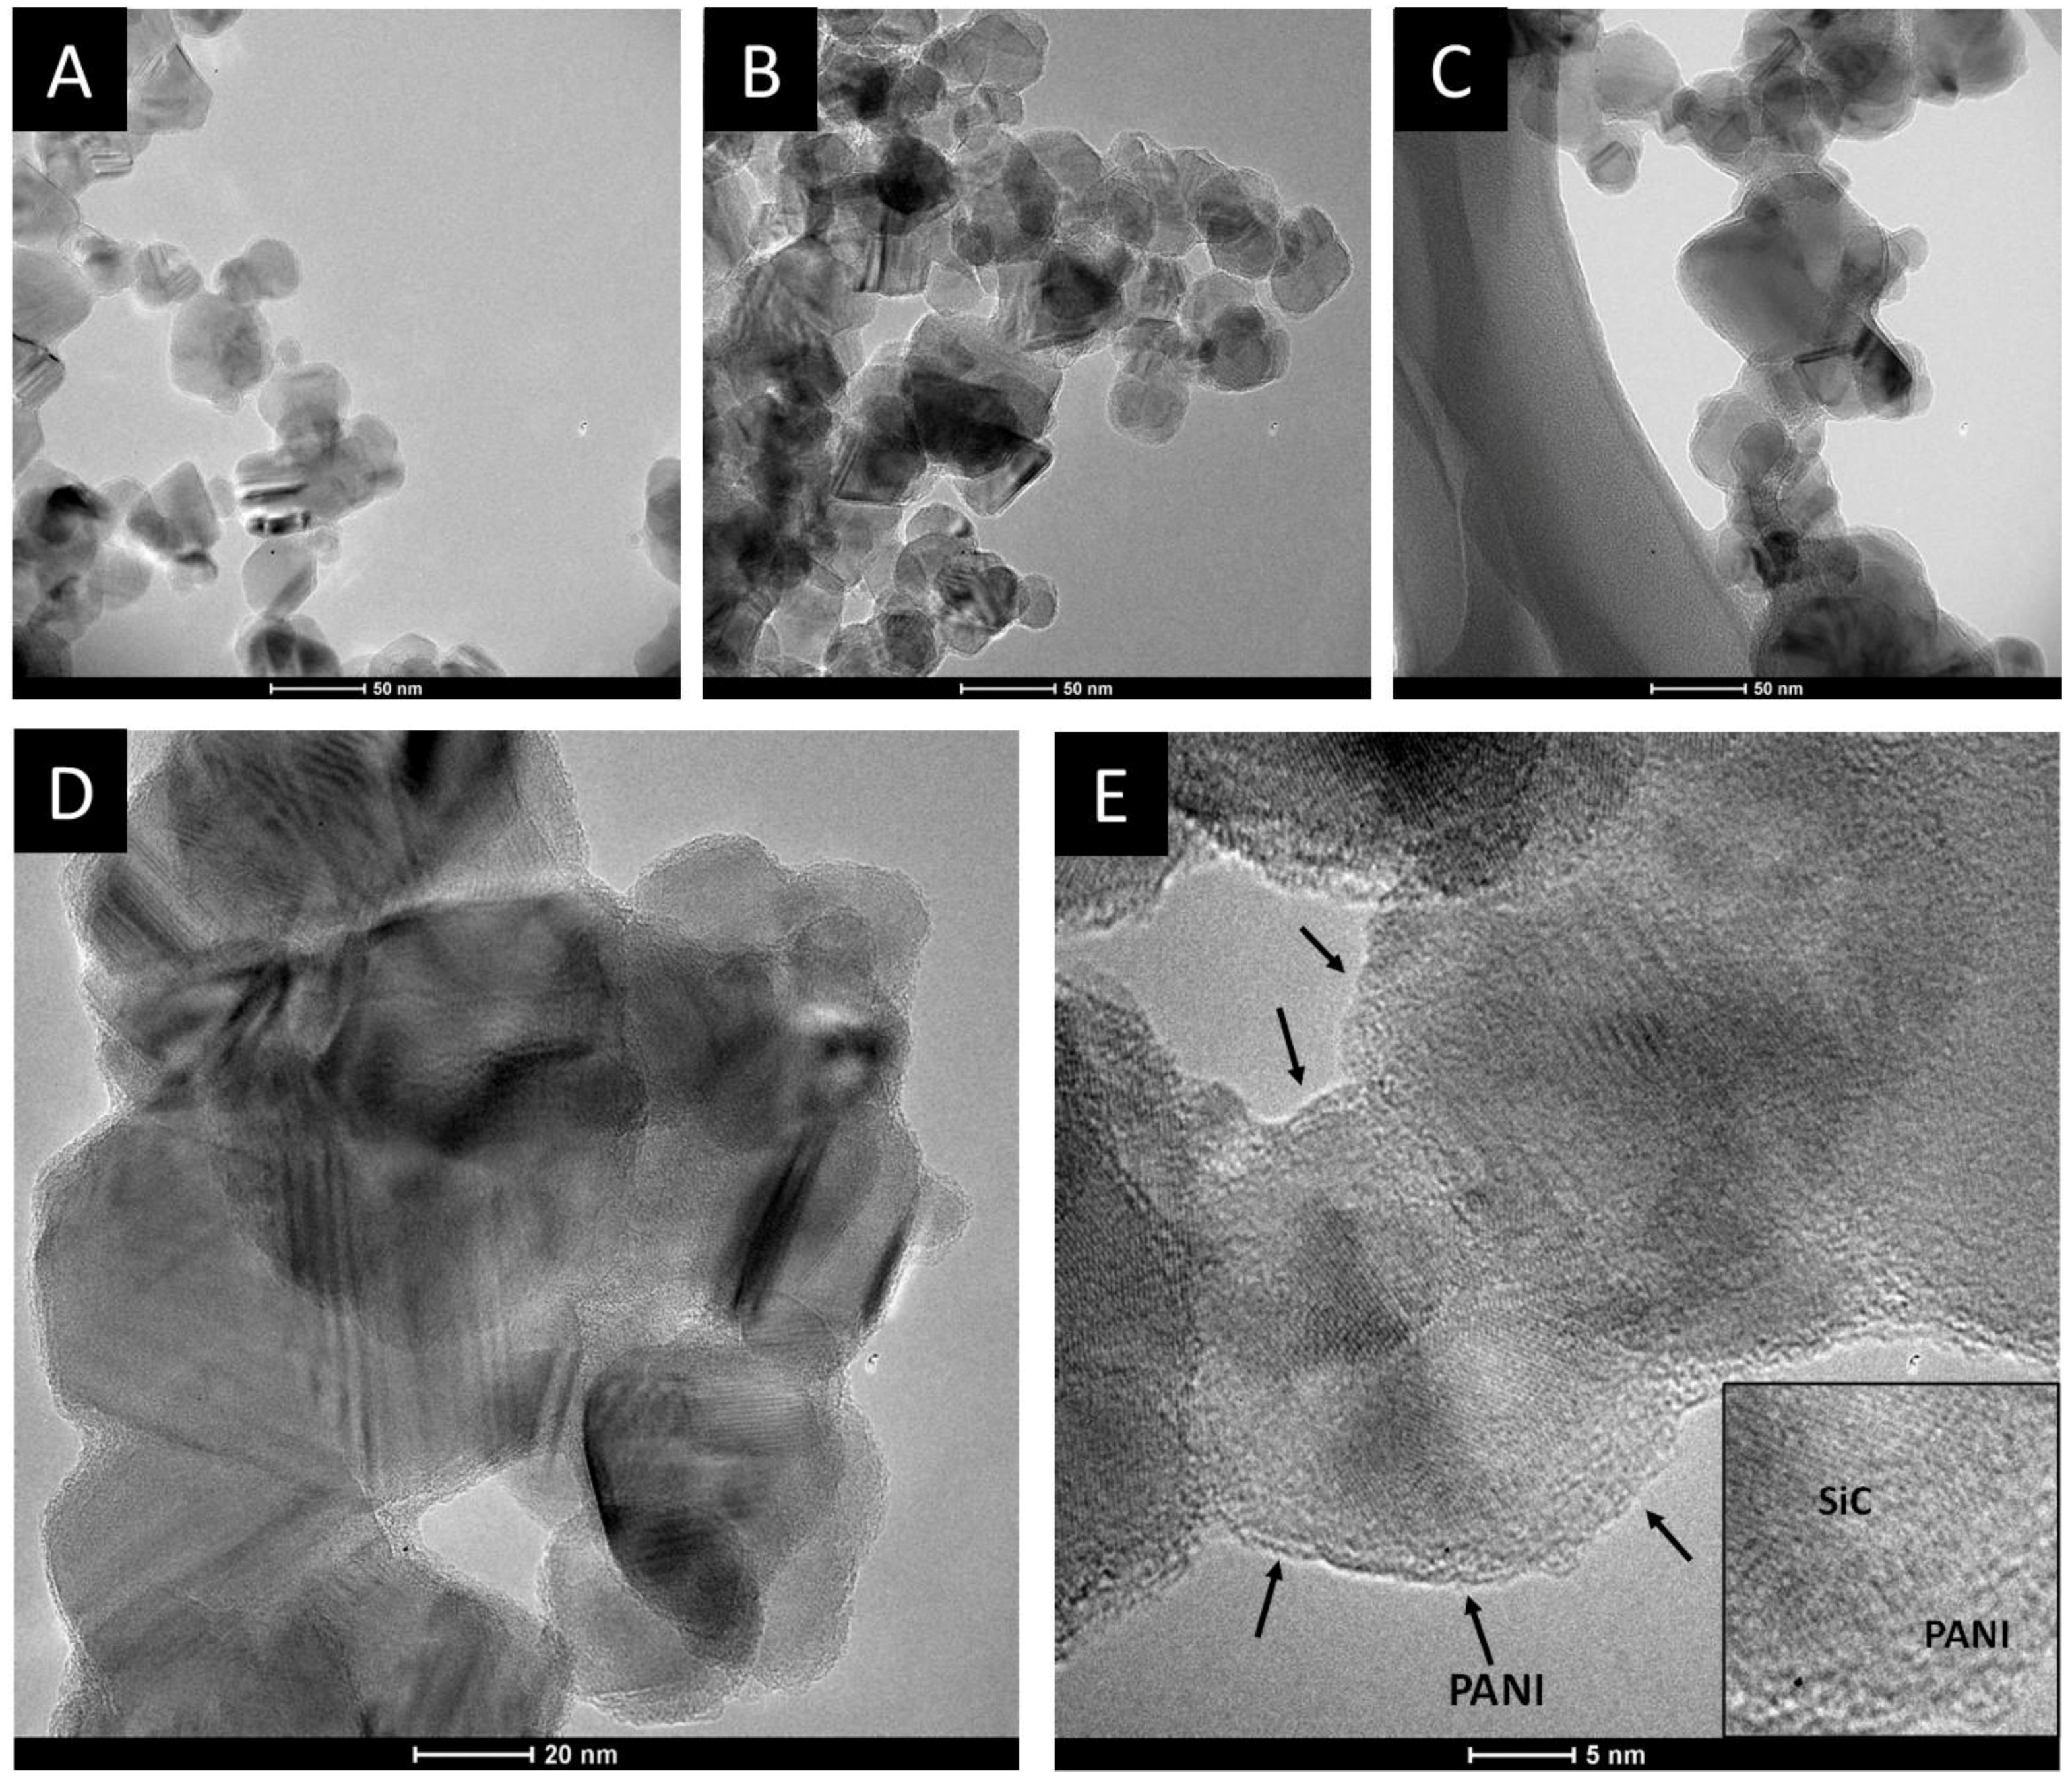
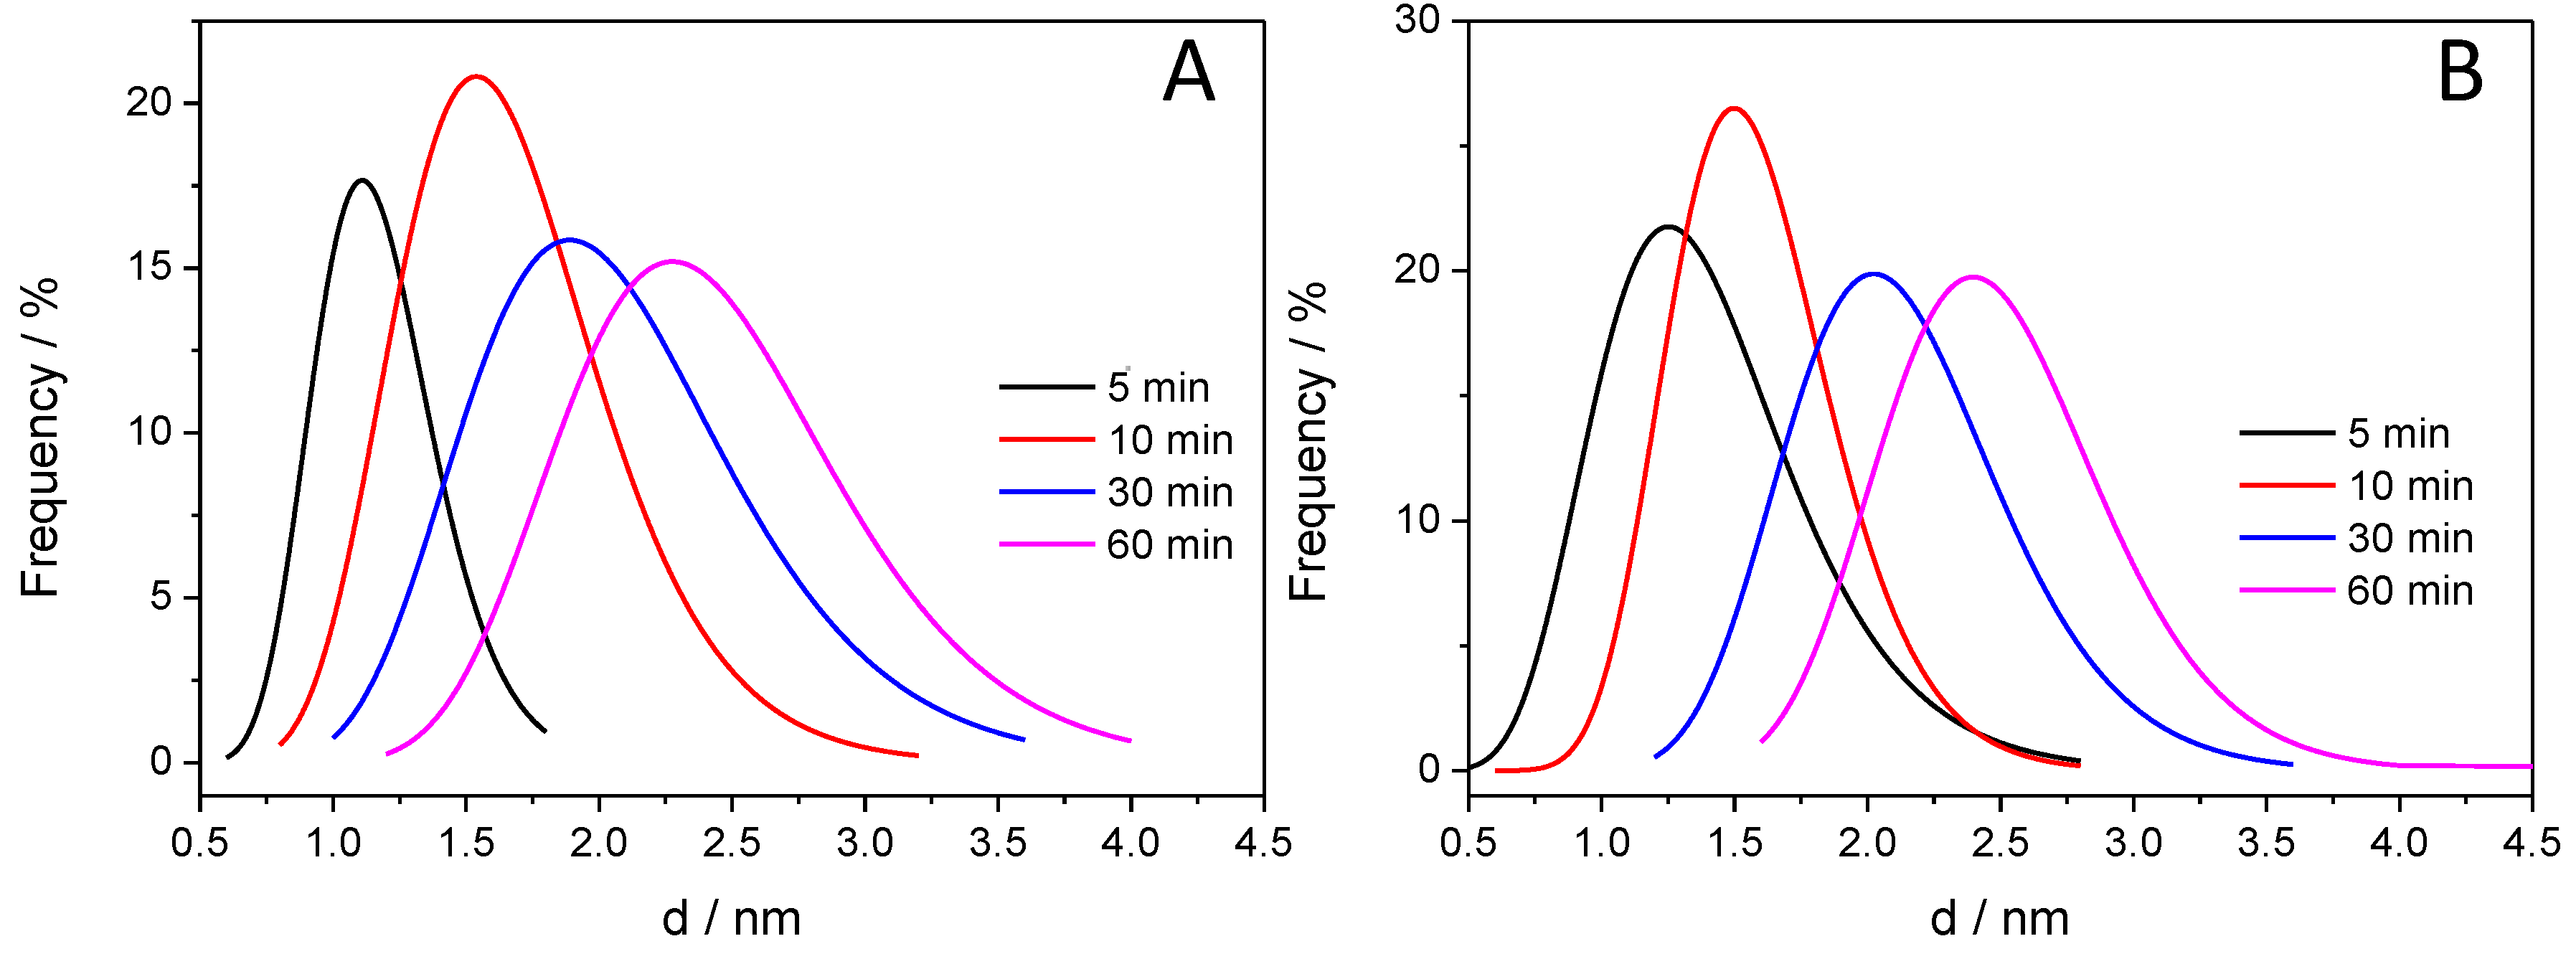
3.3.1. Transmission Electron Microscopic Studies
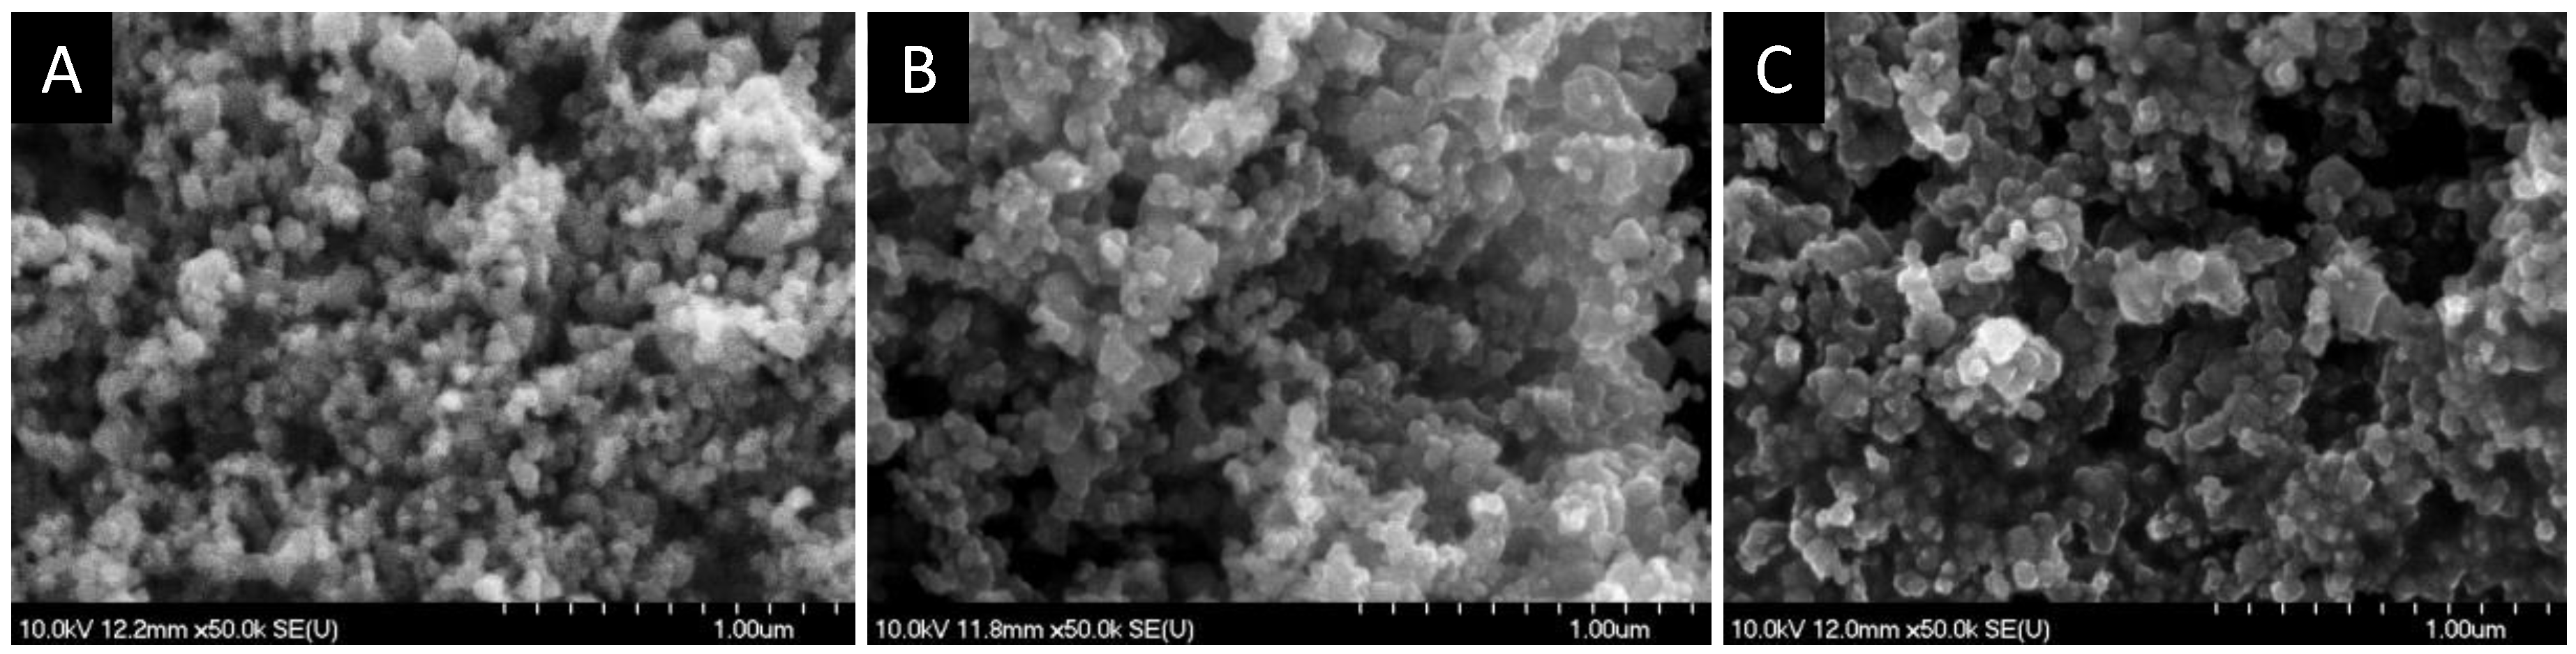
3.3.2. Scanning Electron Microscopic Studies
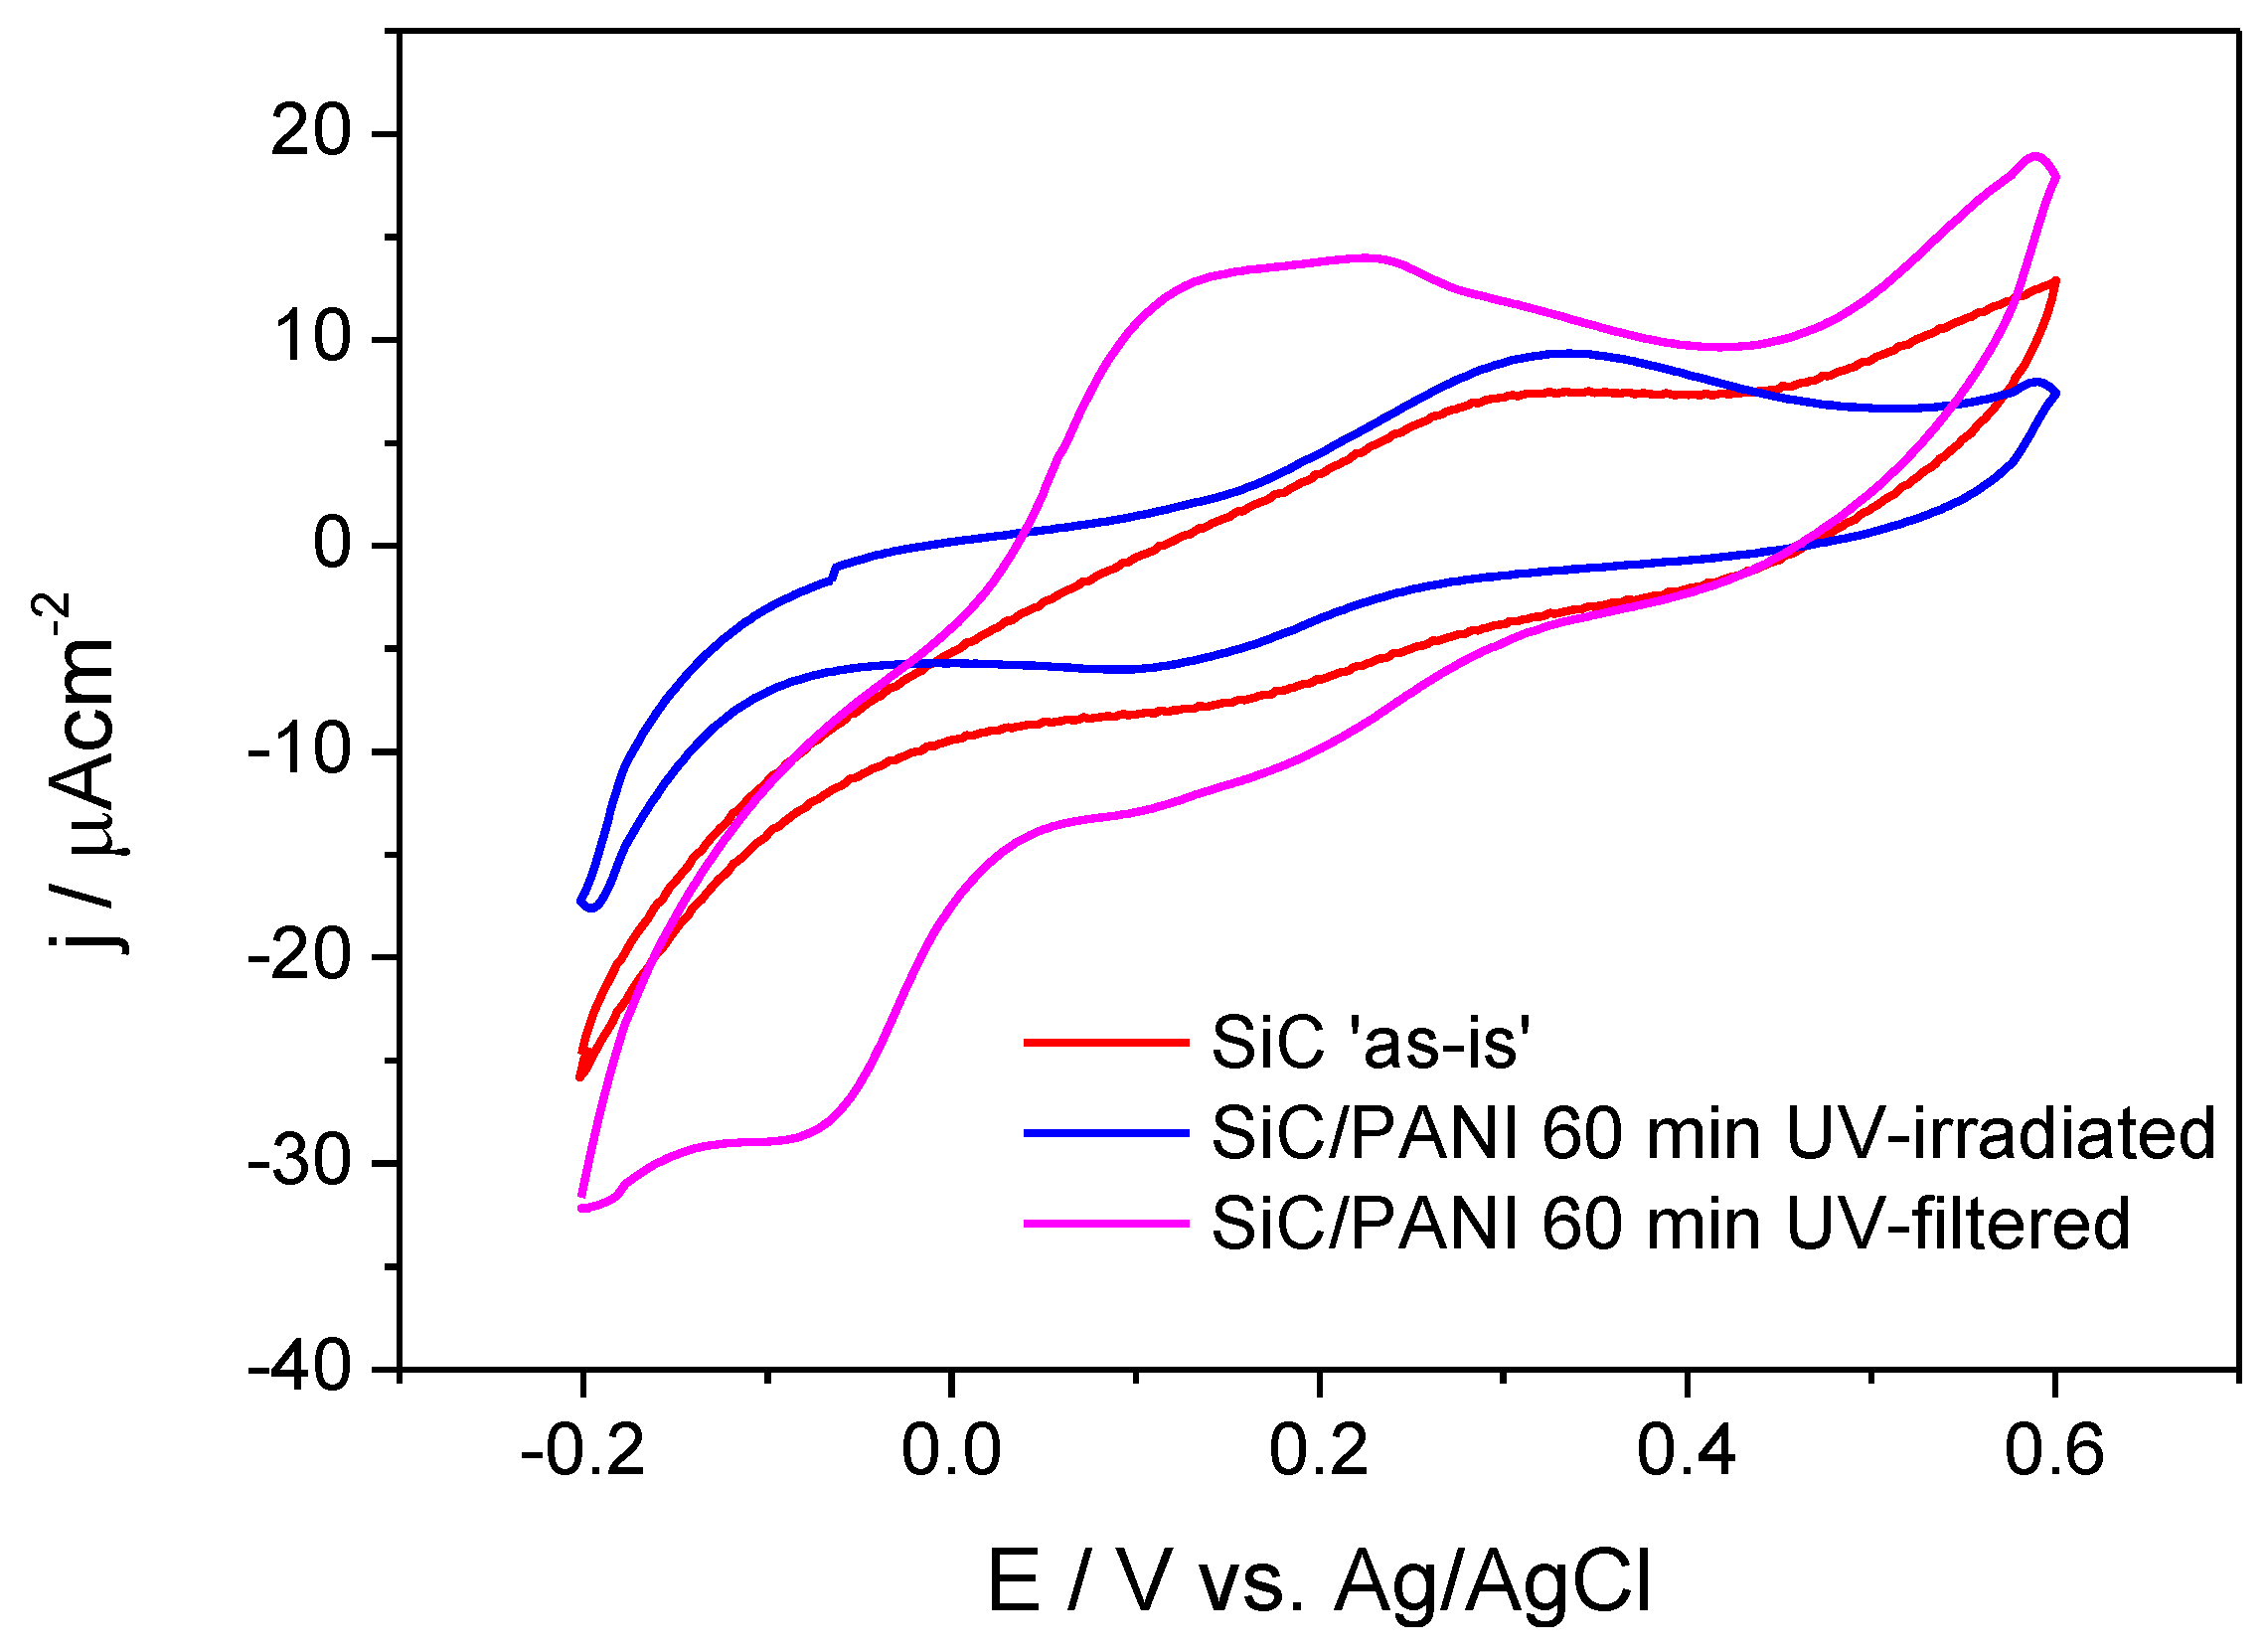
3.4. Cyclic Voltammetric Analysis
4. Conclusions
Acknowledgments
Author Contributions
Conflicts of Interest
Abbreviations
| ATR-FT-IR | Attenuated Total Reflectance Fourier Transformed Infrared Spectroscopy |
| CP | Conducting Polymer |
| HR-TEM | High Resolution Transmission Electron Microscopy |
| NP | Nanoparticle |
| PANI | Polyaniline |
| PPy | Polypyrrole |
| SC | Semiconductor |
| SEM | Scanning Electron Microscopy |
| TEM | Transmission Electron Microscopy |
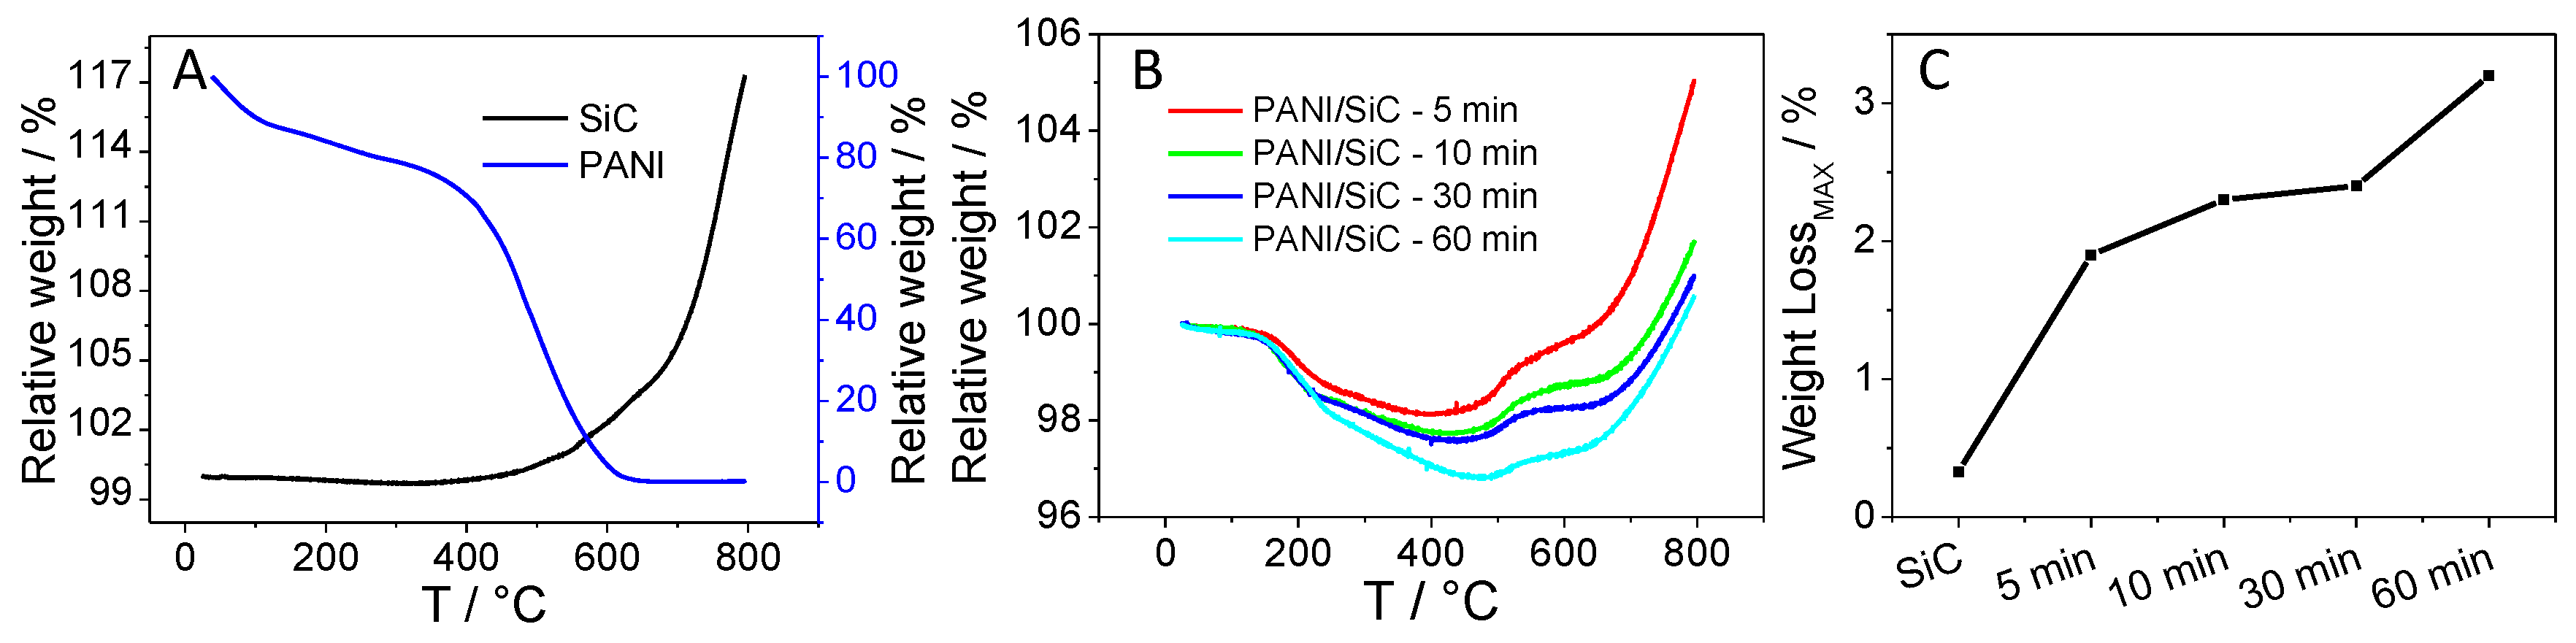
| TGA | Thermogravimetric Analysis |
| TO | Transverse Optical |
| UV-vis | Ultraviolet-visible |
References
- Inzelt, G. Rise and rise of conducting polymers. J. Solid State Electrochem. 2011, 15, 1711–1718. [Google Scholar] [CrossRef]
- Li, C.; Bai, H.; Shi, G. Conducting polymer nanomaterials: Electrosynthesis and applications. Chem. Soc. Rev. 2009, 38, 2397–2409. [Google Scholar] [CrossRef] [PubMed]
- Endrődi, B.; Kormányos, A.; Janáky, C.; Berkesi, O.; Visy, C. Fixation of laccase enzyme into polypyrrole, assisted by chemical interaction with modified magnetite nanoparticles: A facile route to synthesize stable electroactive bionanocomposite catalysts. Electrochim. Acta. 2014, 122, 282–288. [Google Scholar] [CrossRef]
- Lemos, H.G.; Santos, S.F.; Venancio, E.C. Polyaniline-Pt and polypyrrole-Pt nanocomposites: Effect of supporting type and morphology on the nanoparticles size and distribution. Synth. Met. 2015, 203, 22–30. [Google Scholar] [CrossRef]
- Kassiba, A.; Bednarski, W.; Pud, A.; Errien, N.; Makowska-Janusik, M.; Laskowski, L.; Tabellout, M.; Kodjikian, S.; Fatyeyeva, K.; Ogurtsov, N.; et al. Hybrid core-shell nanocomposites based on silicon carbide nanoparticles functionalized by conducting polyaniline: Electron paramagnetic resonance investigations. J. Phys. Chem. C 2007, 111, 11544–11551. [Google Scholar] [CrossRef]
- Oueiny, C.; Berlioz, S.; Perrin, F.-X. Carbon nanotube–polyaniline composites. Prog. Polym. Sci. 2014, 39, 707–748. [Google Scholar] [CrossRef]
- Wu, Q.; Xu, Y.; Yao, Z.; Liu, A.; Shi, G. Supercapacitors based on flexible graphene/polyaniline nanofiber composite films. ACS Nano 2010, 4, 1963–1970. [Google Scholar] [CrossRef] [PubMed]
- Janáky, C.; Visy, C. Conducting polymer-based hybrid assemblies for electrochemical sensing: A materials science perspective. Anal. Bioanal. Chem. 2013, 405, 3489–3511. [Google Scholar] [CrossRef] [PubMed]
- Janáky, C.; Rajeshwar, K. The role of (photo)electrochemistry in the rational design of hybrid conducting polymer/semiconductor assemblies: From fundamental concepts to practical applications. Prog. Polym. Sci. 2015, 43, 96–135. [Google Scholar] [CrossRef]
- Lauermann, I. Electrochemical properties of silicon carbide. J. Electrochem. Soc. 1997, 144, 73–80. [Google Scholar] [CrossRef]
- Hao, J.-Y.; Wang, Y.-Y.; Tong, X.-L.; Jin, G.-Q.; Guo, X.-Y. Photocatalytic hydrogen production over modified SiC nanowires under visible light irradiation. Int. J. Hydrogen Energy 2012, 37, 15038–15044. [Google Scholar] [CrossRef]
- He, C.; Wu, X.; Shen, J.; Chu, P.K. High-efficiency electrochemical hydrogen evolution based on surface autocatalytic effect of ultrathin 3C-SiC nanocrystals. Nano Lett. 2012, 12, 1545–1548. [Google Scholar] [CrossRef] [PubMed]
- Zhuang, H.; Yang, N.; Zhang, L.; Fuchs, R.; Jiang, X. Electrochemical properties and applications of nanocrystalline, microcrystalline, and epitaxial cubic silicon carbide films. ACS Appl. Mater. Interfaces 2015, 7, 10886–10895. [Google Scholar] [CrossRef] [PubMed]
- Mwania, M.; Janáky, C.; Rajeshwar, K.; Kroll, P. Fabrication of β-SiC quantum dots by photo-assisted electrochemical corrosion of bulk powders. Electrochem. Commun. 2013, 37, 1–4. [Google Scholar] [CrossRef]
- Wu, R.; Zhou, K.; Yue, C.Y.; Wei, J.; Pan, Y. Recent progress in synthesis, properties and potential applications of SiC nanomaterials. Prog. Mater. Sci. 2015, 72, 1–60. [Google Scholar] [CrossRef]
- Harris, G.L. Properties of Silicon Carbide; EMIS datareviews series; IEE: London, 1995. [Google Scholar]
- Palmour, J.W.; Edmond, J.A.; Kong, H.S.; Carter, C.H. 6H-silicon carbide devices and applications. Phys. B Condens. Matter. 1993, 185, 461–465. [Google Scholar] [CrossRef]
- Koehl, W.F.; Buckley, B.B.; Heremans, F.J.; Calusine, G.; Awschalom, D.D. Room temperature coherent control of defect spin qubits in silicon carbide. Nature 2011, 479, 84–87. [Google Scholar] [CrossRef] [PubMed]
- Zhou, W.; Yan, L.; Wang, Y.; Zhang, Y. SiC nanowires: A photocatalytic nanomaterial. Appl. Phys. Lett. 2006, 89, 013105–1–013105–3. [Google Scholar] [CrossRef]
- Inoue, T.; Fujishima, A.; Konishi, S.; Honda, K. Photoelectrocatalytic reduction of carbon dioxide in aqueous suspensions of semiconductor powders. Nature 1979, 277, 637–638. [Google Scholar] [CrossRef]
- Mavinakuli, P.; Wei, S.; Wang, Q.; Karki, A.B.; Dhage, S.; Wang, Z.; Young, D.P.; Guo, Z. Polypyrrole/silicon carbide nanocomposites with tunable electrical conductivity. J. Phys. Chem. C 2010, 114, 3874–3882. [Google Scholar] [CrossRef]
- Omastová, M.; Boukerma, K.; Chehimi, M.M.; Trchová, M. Novel silicon carbide/polypyrrole composites; preparation and physicochemical properties. Mater. Res. Bull. 2005, 40, 749–765. [Google Scholar] [CrossRef]
- Pud, A.A.; Noskov, Y.V.; Kassiba, A.; Fatyeyeva, K.Y.; Ogurtsov, N.A.; Makowska-Janusik, M.; Bednarski, W.; Tabellout, M.; Shapoval, G.S. New aspects of the low-concentrated aniline polymerization in the solution and in SiC nanocrystals dispersion. J. Phys. Chem. B 2007, 111, 2174–2180. [Google Scholar] [CrossRef] [PubMed]
- Peled, A.; Lellouche, J.P. Preparation of a novel functional SiC@polythiophene nanocomposite of a core – shell morphology. J. Mater. Chem. 2012, 22, 2069–2073. [Google Scholar] [CrossRef]
- Kang, E.; Neoh, K.; Tan, K. Polyaniline: A polymer with many interesting intrinsic redox states. Prog. Polym. Sci. 1998, 23, 277–324. [Google Scholar] [CrossRef]
- Janaky, C.; de Tacconi, N.R.; Chanmanee, W.; Rajeshwar, K. Electrodeposited polyaniline in a nanoporous WO3 matrix: An organic/inorganic hybrid exhibiting both p-and n-type photoelectrochemical activity. J. Phys. Chem. C 2012, 116, 4234–4242. [Google Scholar] [CrossRef]
- Samu, G.F.; Pencz, K.; Janáky, C.; Rajeshwar, K. On the electrochemical synthesis and charge storage properties of WO3/polyaniline hybrid nanostructures. J. Solid State Electrochem. 2015, 19, 2741–2751. [Google Scholar] [CrossRef]
- Rajeshwar, K.; Thomas, A.; Janáky, C. Photocatalytic Activity of Inorganic Semiconductor Surfaces: Myths, Hype, and Reality. J. Phys. Chem. Lett. 2015, 6, 139–147. [Google Scholar] [CrossRef] [PubMed]
- Colmenares, J.C.; Luque, R. Heterogeneous photocatalytic nanomaterials: Transformations of biomass-derived compounds. Chem. Soc. Rev. 2014, 43, 765–778. [Google Scholar] [CrossRef] [PubMed]
- Janáky, C.; de Tacconi, N.R.; Chanmanee, W.; Rajeshwar, K. Bringing conjugated polymers and oxide nanoarchitectures into intimate contact: Light-induced electrodeposition of polypyrrole and polyaniline on nanoporous WO3 or TiO2 nanotube array. J. Phys. Chem. C 2012, 116, 19145–19155. [Google Scholar] [CrossRef]
- Yildiz, A.; Sobczynski, A.; Bard, A.J.; Campion, A.; Fox, M.A.; Mallouk, T.E.; Webber, S.E.; White, J.M. Sensitized polypyrrole-coated semiconducting powders as materials in photosystems for hydrogen generation. Langmuir 1989, 5, 148–149. [Google Scholar] [CrossRef]
- Fox, M.A.; Worthen, K.L. Comparison of the physical properties of polypyrrole produced by anodic oxidation and by photoelectrochemical activation of TiO2. Chem. Mater. 1991, 3, 253–257. [Google Scholar] [CrossRef]
- Jarkov, A.; Bereznev, S.; Volobujeva, O.; Traksmaa, R.; Tverjanovich, A.; Öpik, A.; Mellikov, E. Photo-assisted electrodeposition of polypyrrole back contact to CdS/CdTe solar cell structures. Thin Solid Films 2013, 535, 198–201. [Google Scholar] [CrossRef]
- Ramanavicius, A.; Karabanovas, V.; Ramanaviciene, A.; Rotomskis, R. Stabilization of (CdSe)ZnS quantum dots with polypyrrole formed by UV/vis irradiation initiated polymerization. J. Nanosci. Nanotechnol. 2009, 9, 1909–1915. [Google Scholar] [CrossRef] [PubMed]
- Goubard, F.; Aubert, P.-H.; Boukerma, K.; Pauthe, E.; Chevrot, C. Elaboration of nanohybrid materials by photopolymerisation of 3,4-ethylenedioxythiophene on TiO2. Chem. Commun. 2008, 3139–3141. [Google Scholar] [CrossRef] [PubMed]
- Weng, Z.; Ni, X. Oxidative polymerization of pyrrole photocatalyzed by TiO2 nanoparticles and interactions in the composites. J. Appl. Polym. Sci. 2008, 110, 109–116. [Google Scholar] [CrossRef]
- Janáky, C.; Chanmanee, W.; Rajeshwar, K. Mechanistic aspects of photoelectrochemical polymerization of polypyrrole on a TiO2 nanotube array. Electrochim. Acta 2014, 122, 303–309. [Google Scholar] [CrossRef]
- Varga, A.; Endrődi, B.; Hornok, V.; Visy, C.; Janáky, C. Controlled photocatalytic deposition of CdS nanoparticles on poly(3-hexylthiophene) nanofibers: A versatile approach to obtain organic/inorganic hybrid semiconductor assemblies. J. Phys. Chem. C 2015, 119, 28020–28027. [Google Scholar] [CrossRef]
- Zhang, W.J.; Feng, J.; MacDiarmid, A.G.; Epstein, A.J. Synthesis of oligomeric anilines. Synth. Met. 1997, 84, 119–120. [Google Scholar] [CrossRef]
- Wang, S.X.; Tan, Z.C.; Li, Y.S.; Sun, L.X.; Li, Y. A kinetic analysis of thermal decomposition of polyaniline/ZrO2 composite. J. Therm. Anal. Calorim. 2008, 92, 483–487. [Google Scholar] [CrossRef]
- Kim, K.J.; Lee, S.; Lee, J.H.; Roh, M.H.; Lim, K.Y.; Kim, Y.W. Structural and optical characteristics of crystalline silicon carbide nanoparticles synthesized by carbothermal reduction. J. Am. Ceram. Soc. 2009, 92, 424–428. [Google Scholar] [CrossRef]
- Kassiba, A.; Makowska-Janusik, M.; Bouclé, J.; Bardeau, J.F.; Bulou, A.; Herlin-Boime, N. Photoluminescence features on the Raman spectra of quasistoichiometric SiC nanoparticles: Experimental and numerical simulations. Phys. Rev. B 2002, 66, 155317:1–155317:7. [Google Scholar] [CrossRef]
- Louarn, G.; Lapkowski, M.; Quillard, S.; Pron, A.; Buisson, J.P.; Lefrant, S. Vibrational properties of polyaniline-isotope effects. J. Phys. Chem. 1996, 100, 6998–7006. [Google Scholar] [CrossRef]
- Mažeikienė, R.; Tomkutė, V.; Kuodis, Z.; Niaura, G.; Malinauskas, A. Raman spectroelectrochemical study of polyaniline and sulfonated polyaniline in solutions of different pH. Vib. Spectrosc. 2007, 44, 201–208. [Google Scholar] [CrossRef]
- Quillard, S.; Berrada, K.; Louam, G.; et al. Polyanilines and substituted polyanilines: A comparative study of the Raman spectra of leucoemeraldine, emeraldine and pernigraniline. In Proceedings of the IEEE International Conference on Science and Technology of Synthetic Metals, Seoul, Korea, 24–29 July 1994; pp. 201–204.
- Zeng, X.R.; Ko, T.M. Structures and properties of chemically reduced polyanilines. Polymer 1998, 39, 1187–1195. [Google Scholar] [CrossRef]
- Neugebauer, H. In situ vibrational spectroscopy of conducting polymer electrodes. Macromol. Symp. 1995, 94, 61–73. [Google Scholar] [CrossRef]


| Wavenumber (cm−1) | Assignment [43,44,45] |
|---|---|
| 517 | Amine in-plane deformation |
| 610 | Ring deformation |
| 720 | Imine deformation |
| 818 | Amine deformation (C-N-C bending) |
| 868 | Ring deformation |
| 1180 | C-H bending in leucoemeraldine |
| 1418 | C-C stretching in quinoid-type ring |
| 1595 | C-C stretching in quinoid-type ring |
| 1625 | C-C stretching in benzene-type ring |
| Wavenumber (cm−1) | Assignment [46,47] |
|---|---|
| 515 | Aromatic ring deformation |
| 828 | C-H out-of-plane bending benzenoid-type ring |
| 882 | C-H out-of-plane bending |
| 1070 | NH2 rocking, ring deformation |
| 1146 | C-H in-plane-bending, ring deformation |
| 1246 | C-N stretching |
| 1304 | C-N stretching |
| 1485 | Benzenoid-type ring stretching |
| 1568 | Quinoid-type ring stretching |
| 1610 | N-H bending |
© 2016 by the authors; licensee MDPI, Basel, Switzerland. This article is an open access article distributed under the terms and conditions of the Creative Commons by Attribution (CC-BY) license (http://creativecommons.org/licenses/by/4.0/).
Share and Cite
Kormányos, A.; Endrődi, B.; Ondok, R.; Sápi, A.; Janáky, C. Controlled Photocatalytic Synthesis of Core–Shell SiC/Polyaniline Hybrid Nanostructures. Materials 2016, 9, 201. https://doi.org/10.3390/ma9030201
Kormányos A, Endrődi B, Ondok R, Sápi A, Janáky C. Controlled Photocatalytic Synthesis of Core–Shell SiC/Polyaniline Hybrid Nanostructures. Materials. 2016; 9(3):201. https://doi.org/10.3390/ma9030201
Chicago/Turabian StyleKormányos, Attila, Balázs Endrődi, Róbert Ondok, András Sápi, and Csaba Janáky. 2016. "Controlled Photocatalytic Synthesis of Core–Shell SiC/Polyaniline Hybrid Nanostructures" Materials 9, no. 3: 201. https://doi.org/10.3390/ma9030201
APA StyleKormányos, A., Endrődi, B., Ondok, R., Sápi, A., & Janáky, C. (2016). Controlled Photocatalytic Synthesis of Core–Shell SiC/Polyaniline Hybrid Nanostructures. Materials, 9(3), 201. https://doi.org/10.3390/ma9030201