Article

Effects of Ca Content on Formation and Photoluminescence Properties of CaAlSiN3:Eu2+ Phosphor by Combustion Synthesis

1
Department of Chemical Engineering, National Cheng Kung University, Tainan 70101, Taiwan
2
Advanced Optoelectronic Technology Center, National Cheng Kung University, Tainan 70101, Taiwan
*
Author to whom correspondence should be addressed.
Materials 2016, 9(3), 178; https://doi.org/10.3390/ma9030178
Submission received: 5 November 2015 / Revised: 28 February 2016 / Accepted: 29 February 2016 / Published: 8 March 2016
(This article belongs to the Special Issue Selected Papers from ICBEI2015)

Abstract

:
Effects of Ca content (in the reactant mixture) on the formation and the photoluminescence properties of CaAlSiN3:Eu2+ phosphor (CASIN) were investigated by a combustion synthesis method. Ca, Al, Si, Eu2O3, NaN3, NH4Cl and Si3N4 powders were used as the starting materials and they were mixed and pressed into a compact which was then wrapped up with an igniting agent (i.e., Mg + Fe3O4). The compact was ignited by electrical heating under a N2 pressure of ≤1.0 MPa. By keeping the molar ratios of Al and Si (including the Si powder and the Si in Si3N4 powder) both at 1.00 and that of Eu2O3 at 0.02, XRD (X-ray diffraction) coupled with TEM-EDS (transmission electron microscope equipped with an energy-dispersive X-ray spectroscope) and SAED (selected area electron diffraction) measurements show that AlN:Eu2+ and Ca-α-SiAlON:Eu2+ are formed as the major phosphor products when the Ca molar ratio (denoted by Y) is equal to 0.25 and AlN:Eu2+ and Ca-α-SiAlON:Eu2+ could not be detected at Y ≥ 0.75 and ≥1.00, respectively. CASIN (i.e., CaAlSiN3:Eu2+) becomes the only phosphor product as Y is increased to 1.00 and higher. The extent of formation of CASIN increases with increasing Y up to 1.50 and begins to decrease as Y is further increased to 1.68. While the excitation wavelength regions are similar at various Y, the emission wavelength regions vary significantly as Y is increased from 0.25 to 1.00 due to different combinations of phosphor phases formed at different Y. The emission intensity of CASIN was found to vary with Y in a similar trend to its extent of formation. The Ca and Eu contents (expressed as molar ratios) in the synthesized products were found to increase roughly with increasing Y but were both lower than the respective Ca and Eu contents in the reactant mixtures.

1. Introduction

White light LED lighting is expected to become the major lighting technique in the next generation due to its advantages such as energy efficiency, long lifetime, compactness, environment friendliness and designable features [1,2]. Currently, white LED lighting devices are mostly fabricated based on the combination of an InGaN-based blue-LED chip and a yellow-emitting phosphor, i.e., YAG:Ce3+[3,4]. Among several problems which have been found with this type of LED lighting devices, the ones related directly to the phosphor are mainly the need for improvement of thermal stability, quantum efficiency and color rendering index (due to deficiency of red light) [4].
In the past decade, a new class of phosphors (i.e., rare-earth doped nitridosilicates) has been discovered and shown to be ideal for application in LED lighting due to their superior properties such as high quantum efficiency, red light emission and high thermal and chemical stability [5]. Two major types of nitridosilicate have been developed as the host lattices for the nitridosilicate phosphors, namely alkaline-earth silicon nitrides (M2Si5N8, M = Ca, Sr and Ba, often referred to as 2-5-8 phosphors) and alkaline-earth aluminum silicon nitrides (MAlSiN3, M = Mg, Ca and Sr, often referred to as 1-1-1-3 phosphors). Many methods have been developed for the synthesis of nitridosilicate phosphors including solid state reaction (SSR) [6], carbothermal reduction and nitridation (CRN) [7], gas pressure sintering [8], and combustion synthesis (SHS) [9]. However, many of these methods utilize costly and oxygen or moisture sensitive chemicals as the starting materials, and most of the methods are carried out under severe synthesis conditions (e.g., high temperatures, high pressures and long reaction time).
In our previous study [10], a combustion synthesis method was developed for the synthesis of Eu2+-doped CaAlSiN3 phosphor: Ca, Al, Si and Eu2O3 powders were used as the Ca, Al, Si and Eu sources and NaN3, NH4Cl and Si3N4 were added to enhance the product yield. The synthesis reaction was triggered by the combustion of an igniting agent wrapping up the reactant compact. A product yield of ~71% was obtained under a N2 pressure of 0.7 MPa. In addition to easy handling of the reactants and a low N2 pressure required (~0.7 MPa), the method developed possesses many other advantages including simple and inexpensive equipment required, relatively low cost of the reactants, fast reaction and short processing time, potential capability for mass production and possibly low production costs.
It is known that Eu2+ doped CaAlSiN3 phosphor (simply referred to as CASIN hereafter), Eu2+ is incorporated into the host lattice at the Ca2+ sites (i.e., by substituting for Ca2+) [1,2]. Suehiro et al. [11] reported that the molar ratios of the metals (i.e., Ca) in their synthesized CASIN were all below the stoichiometric values. An interesting problem thus arises that how the metal molar ratios affect the photoluminescence properties, crystallinity and morphology of CASIN. However, this problem has been rarely studied [11,12] especially for the effects of the molar ratio of Ca2+.
Our research has been aimed at studying the effects of the molar ratio of Ca2+ on the photoluminescence properties of CASIN by employing the combustion synthesis method developed in our previous study [10] for the synthesis of CASIN. Since the molar ratio of Ca2+ in CASIN is very difficult to be controlled and measured precisely, it is simply adjusted by varying the content of Ca powder in the reactant mixture. In this work, we report an experimental study on the effects of Ca content (in the reactant mixture) on the formation and the photoluminescence properties of CASIN.

2. Results and Discussion

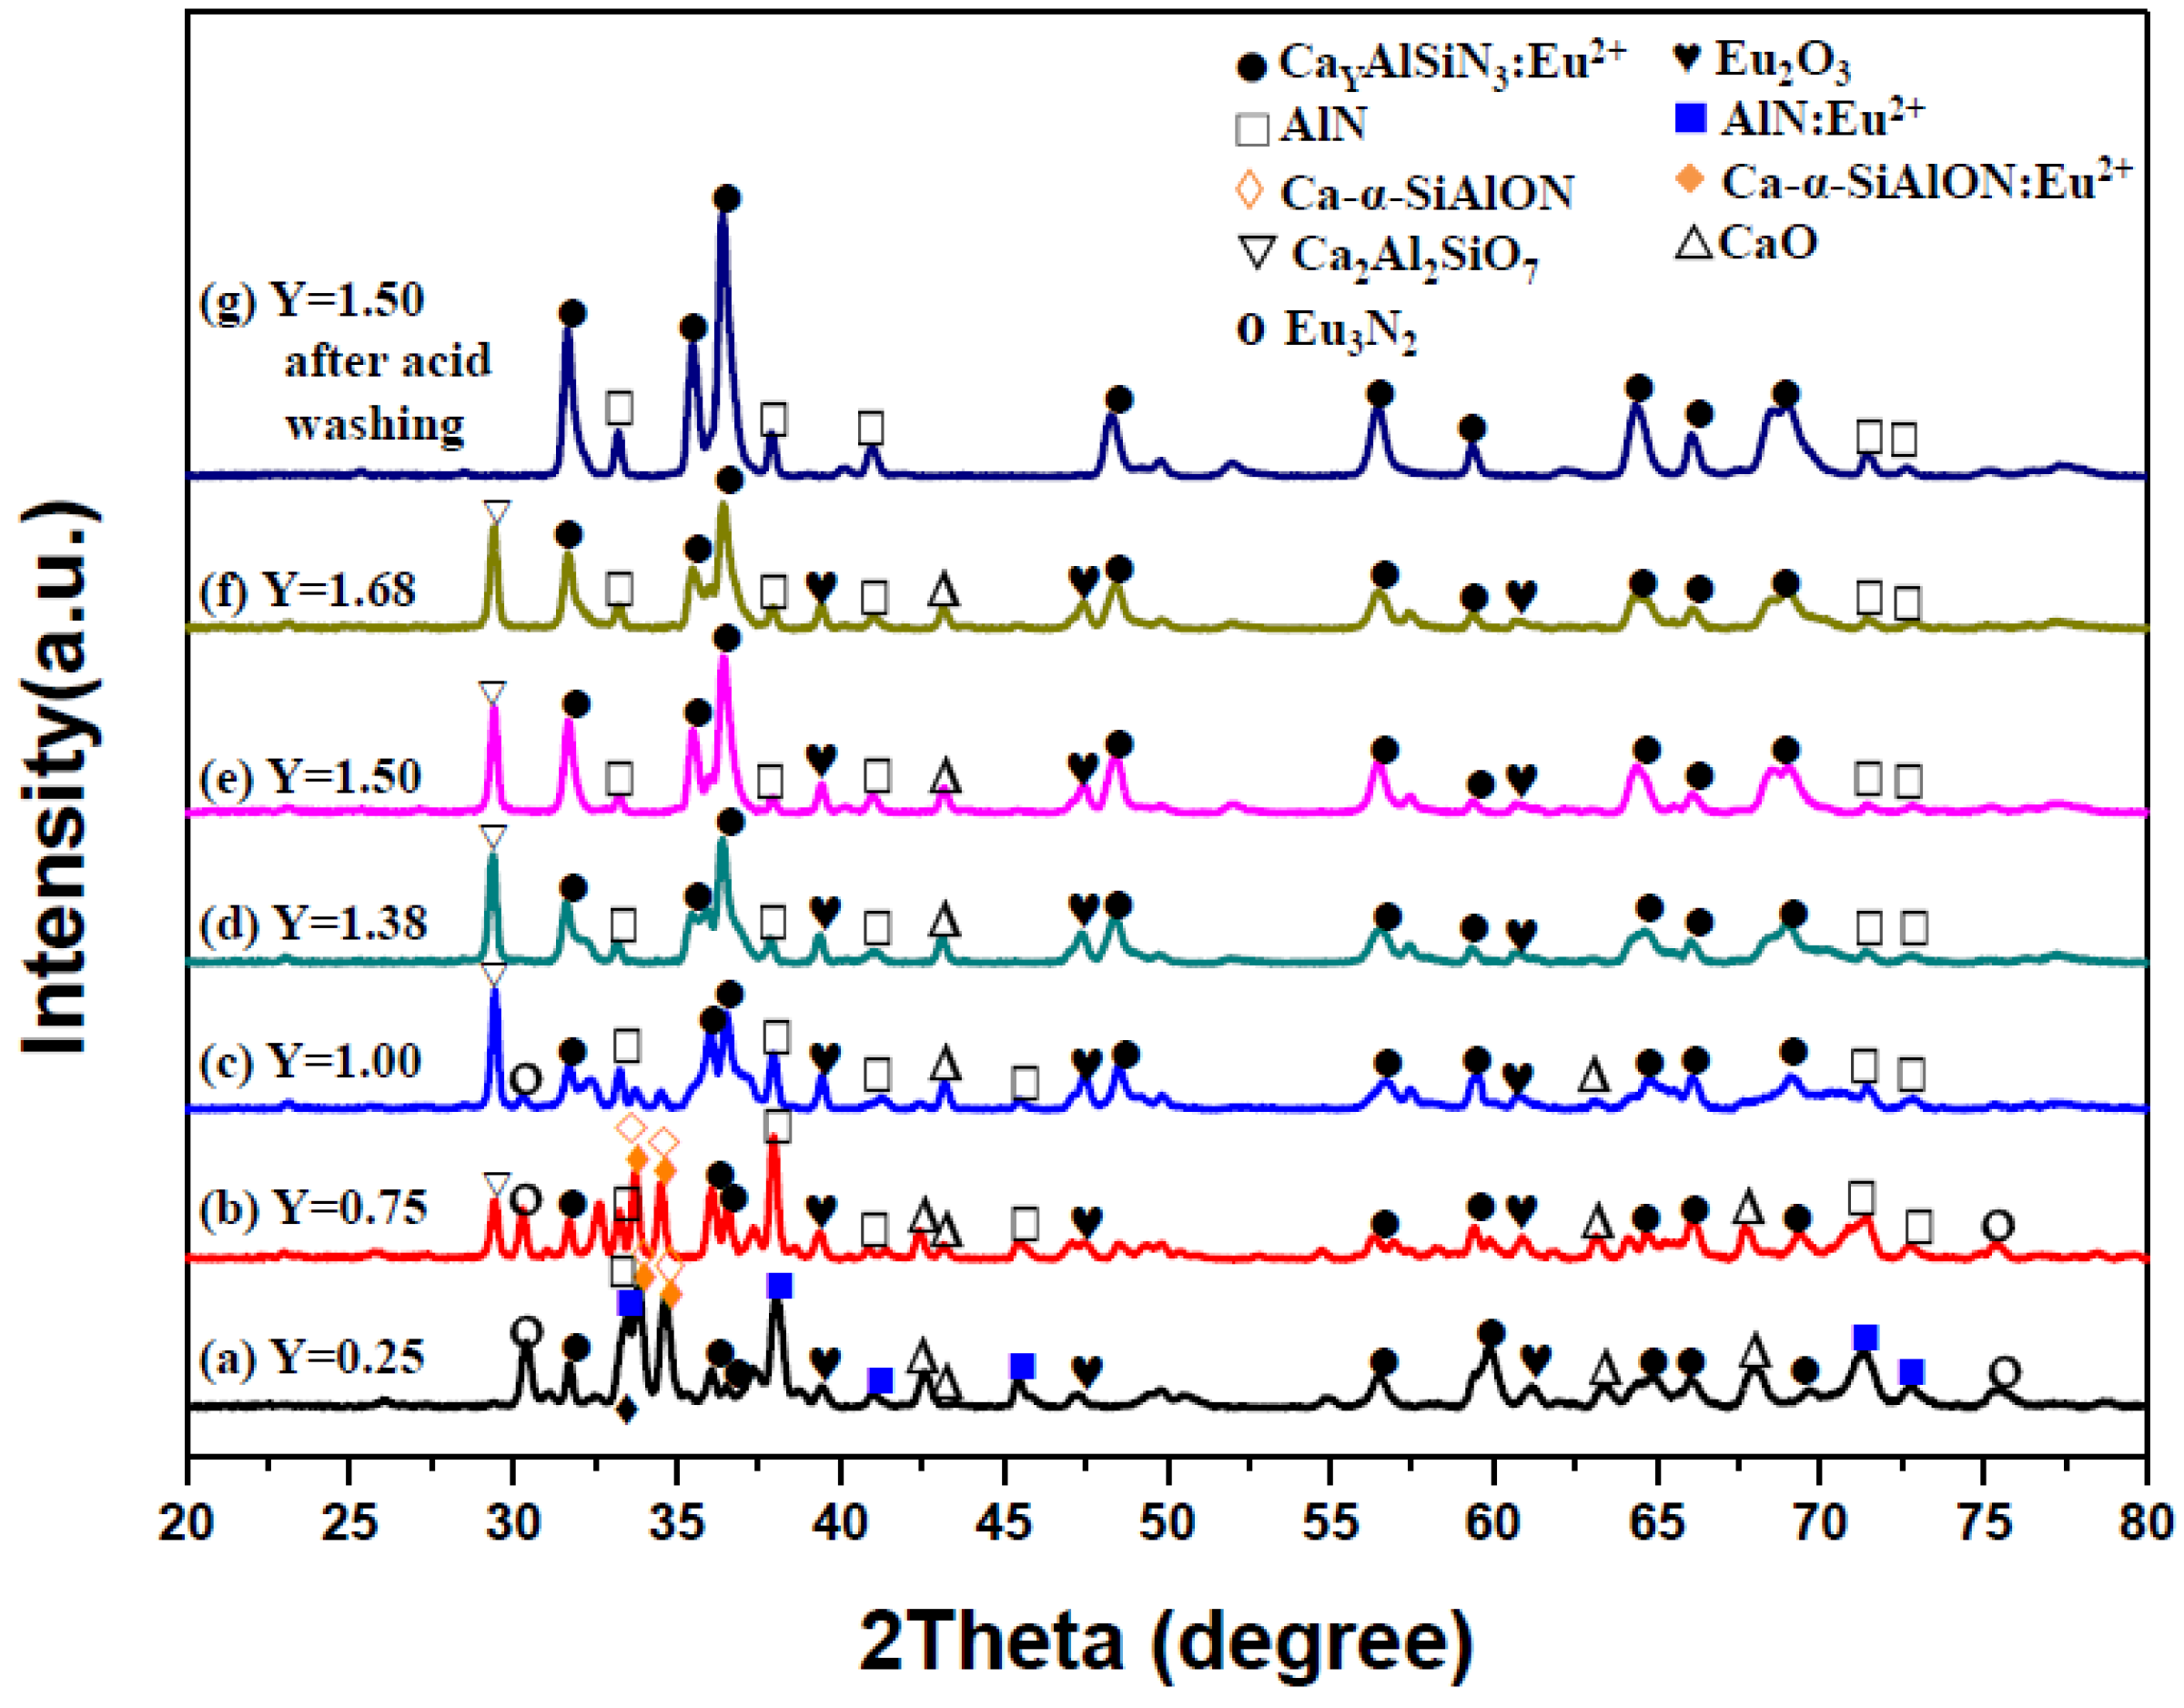
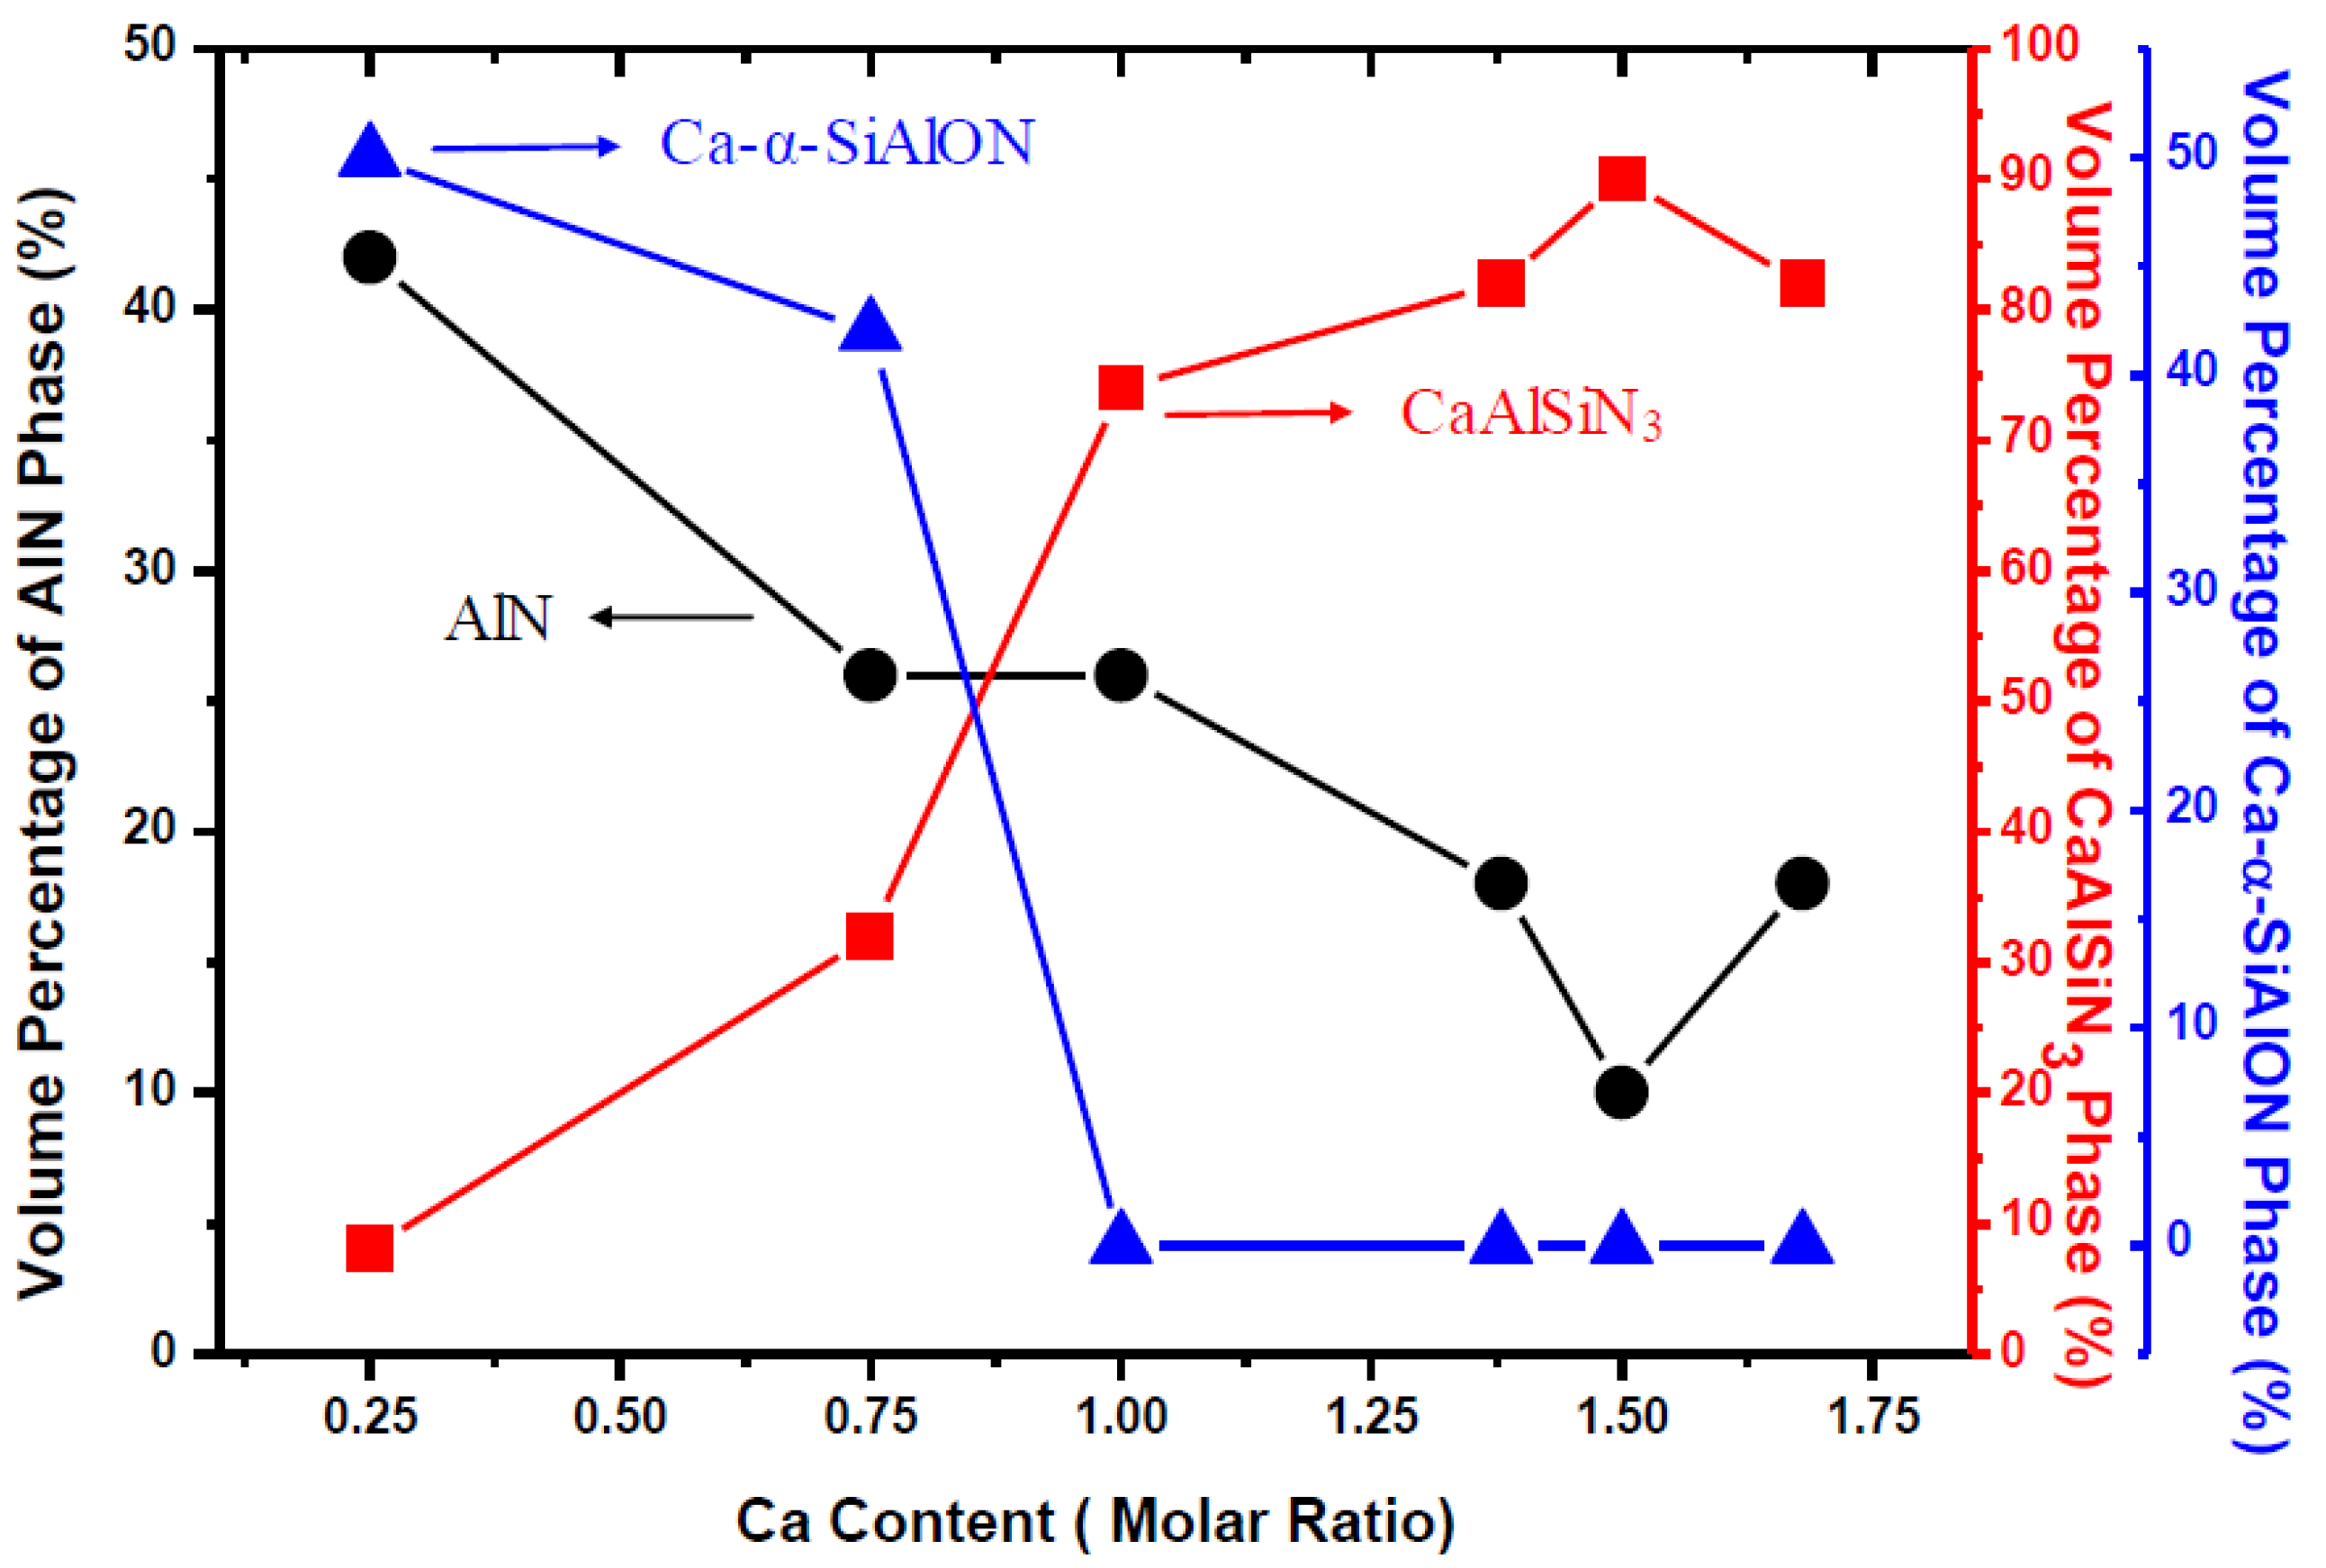
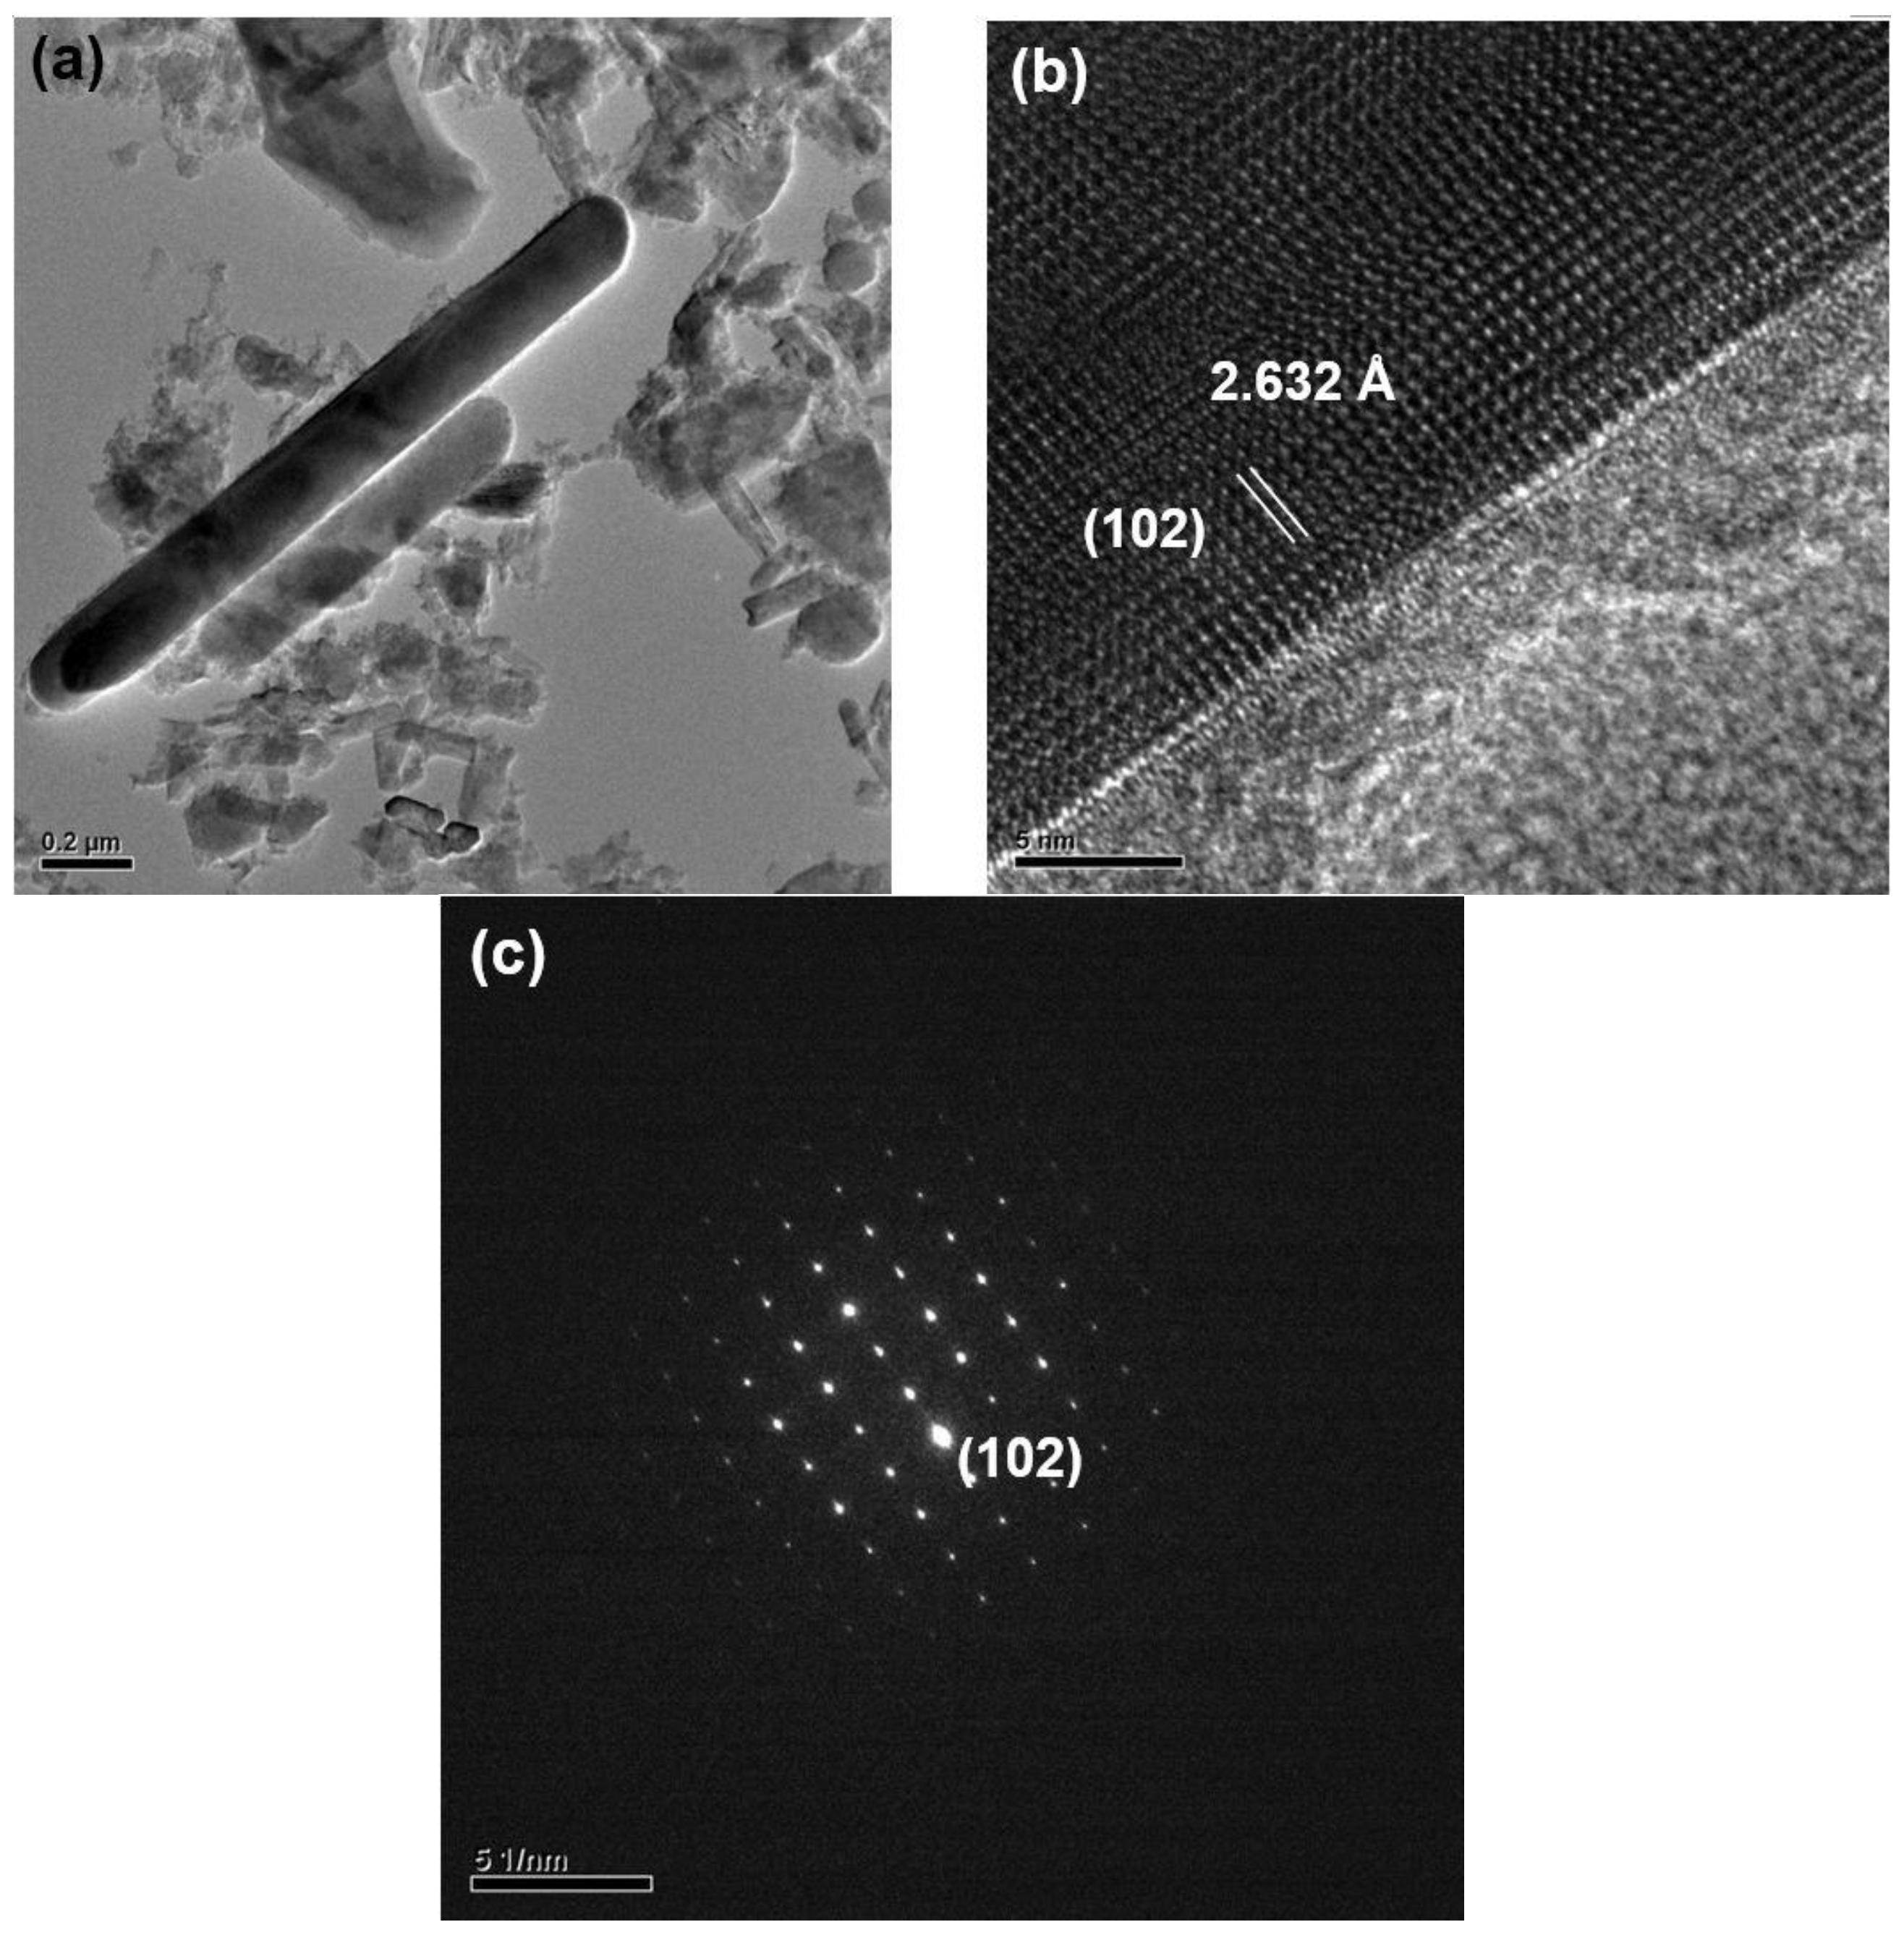
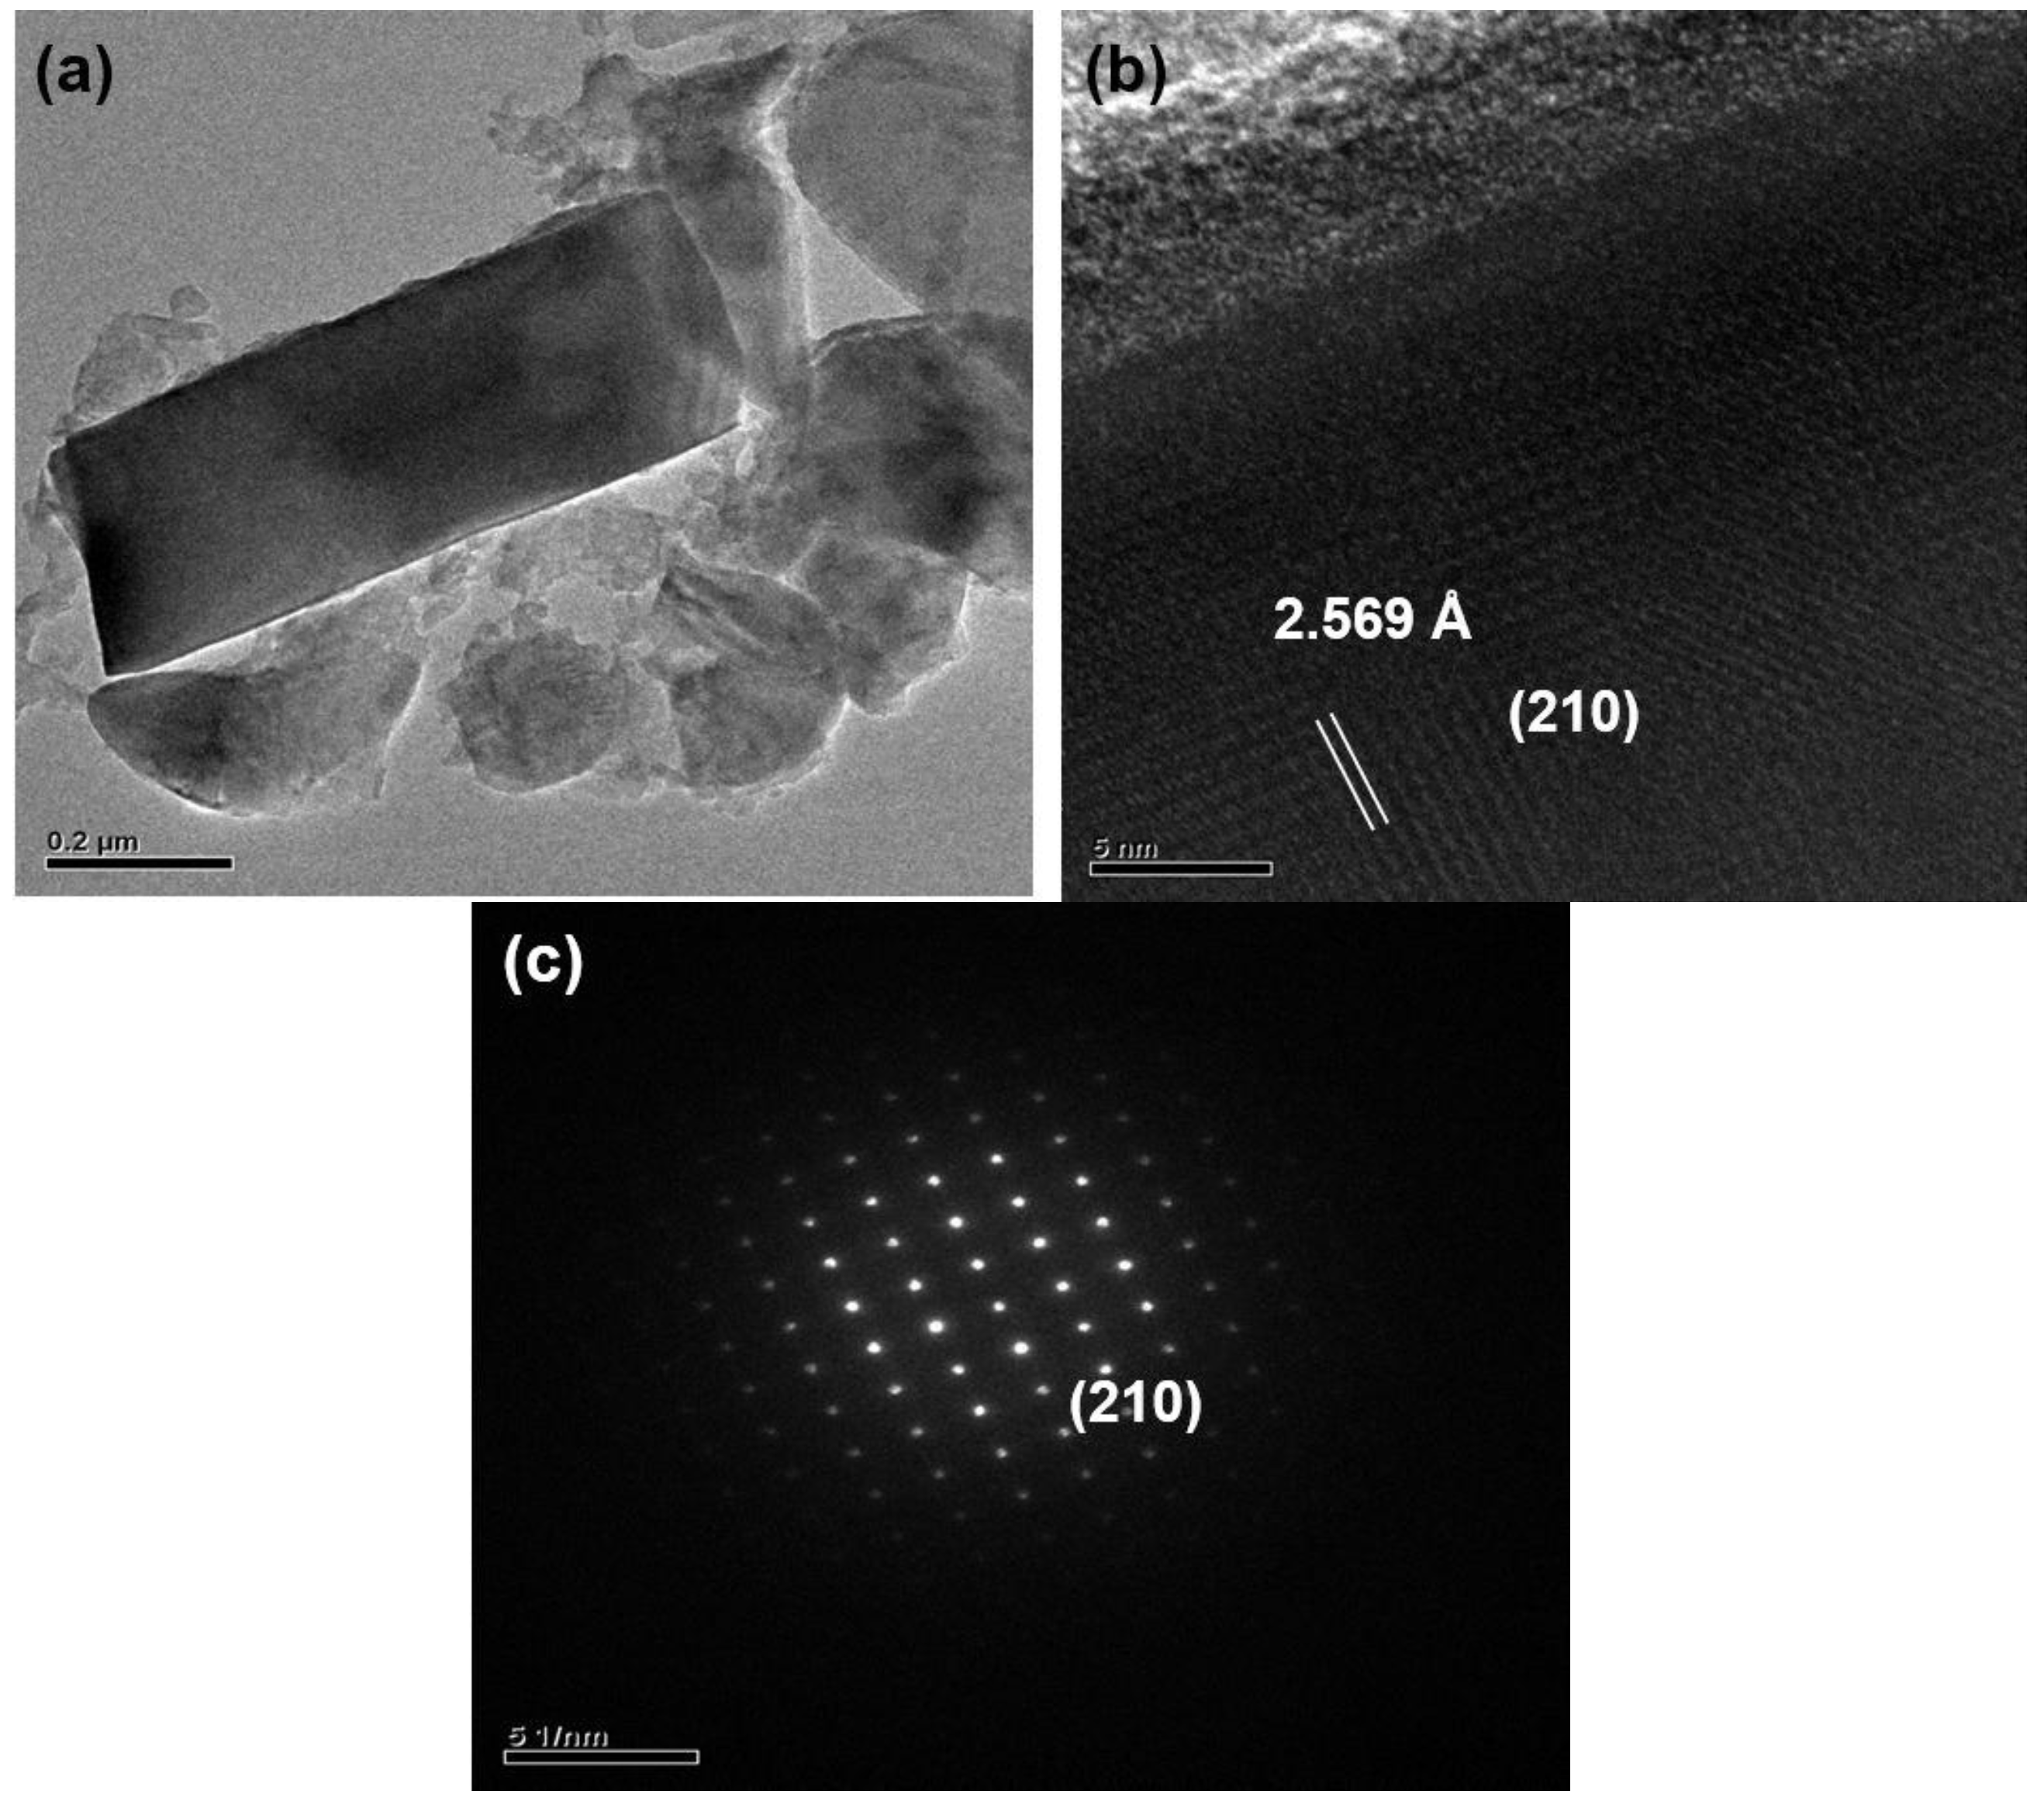
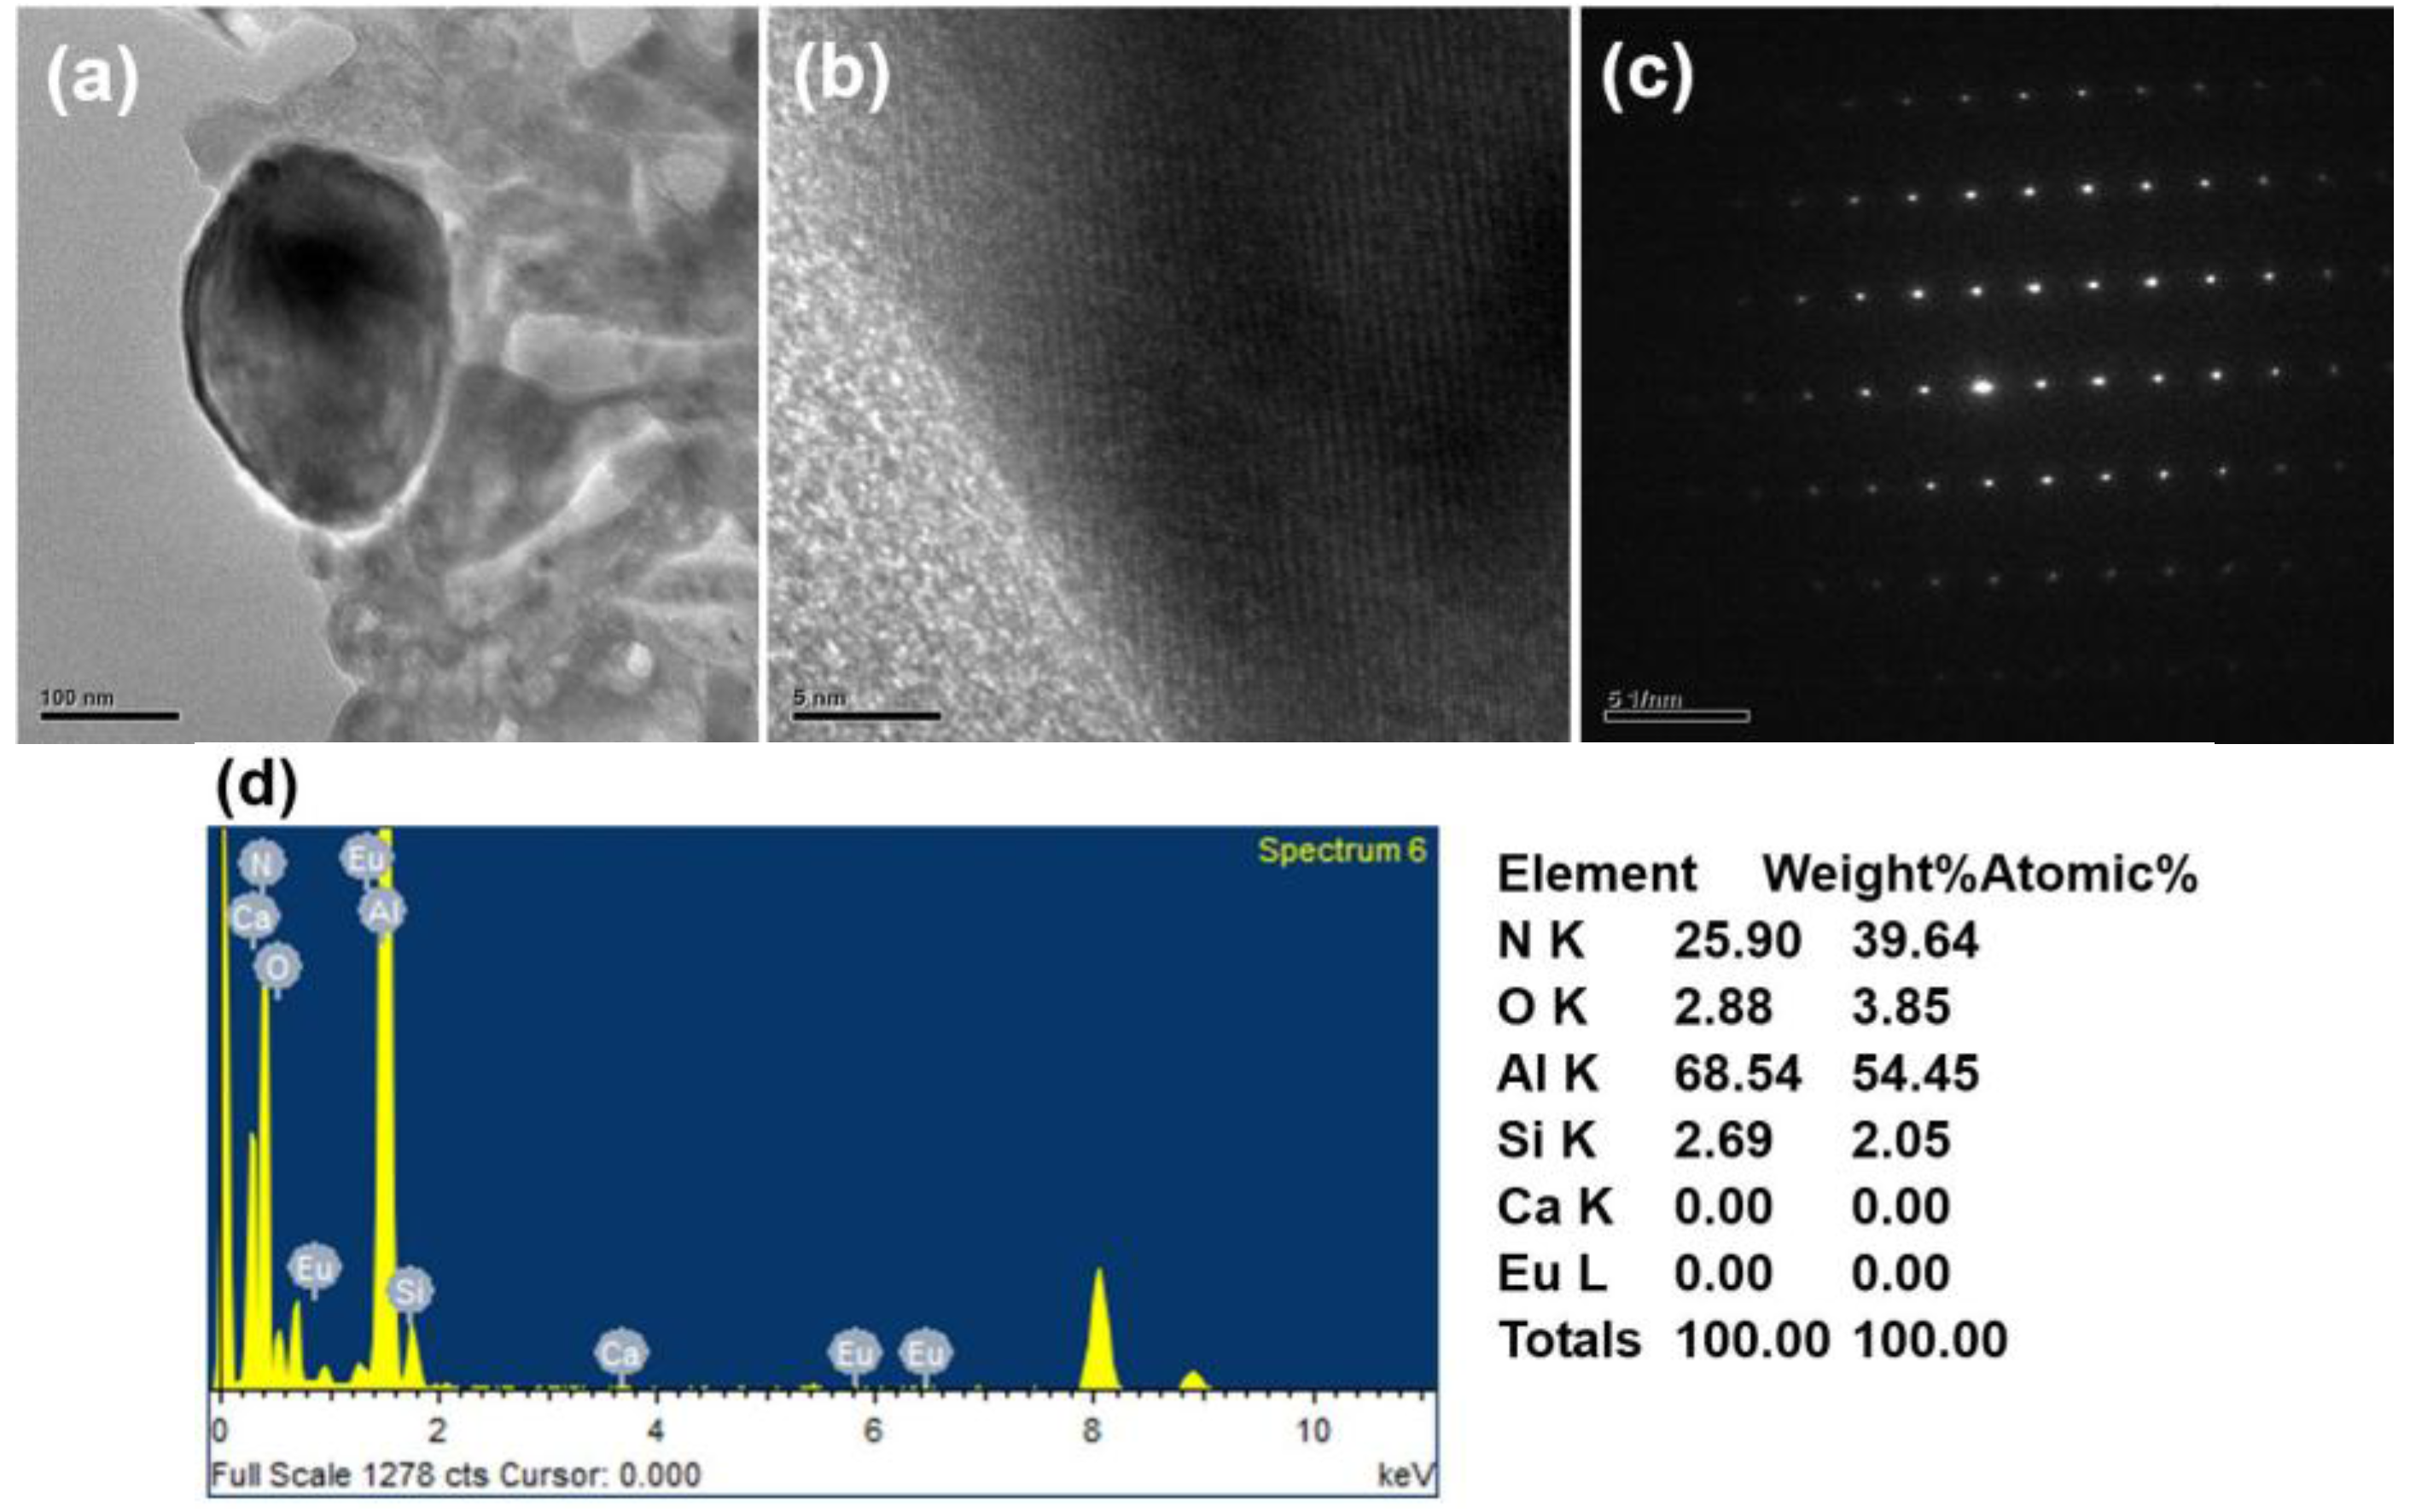
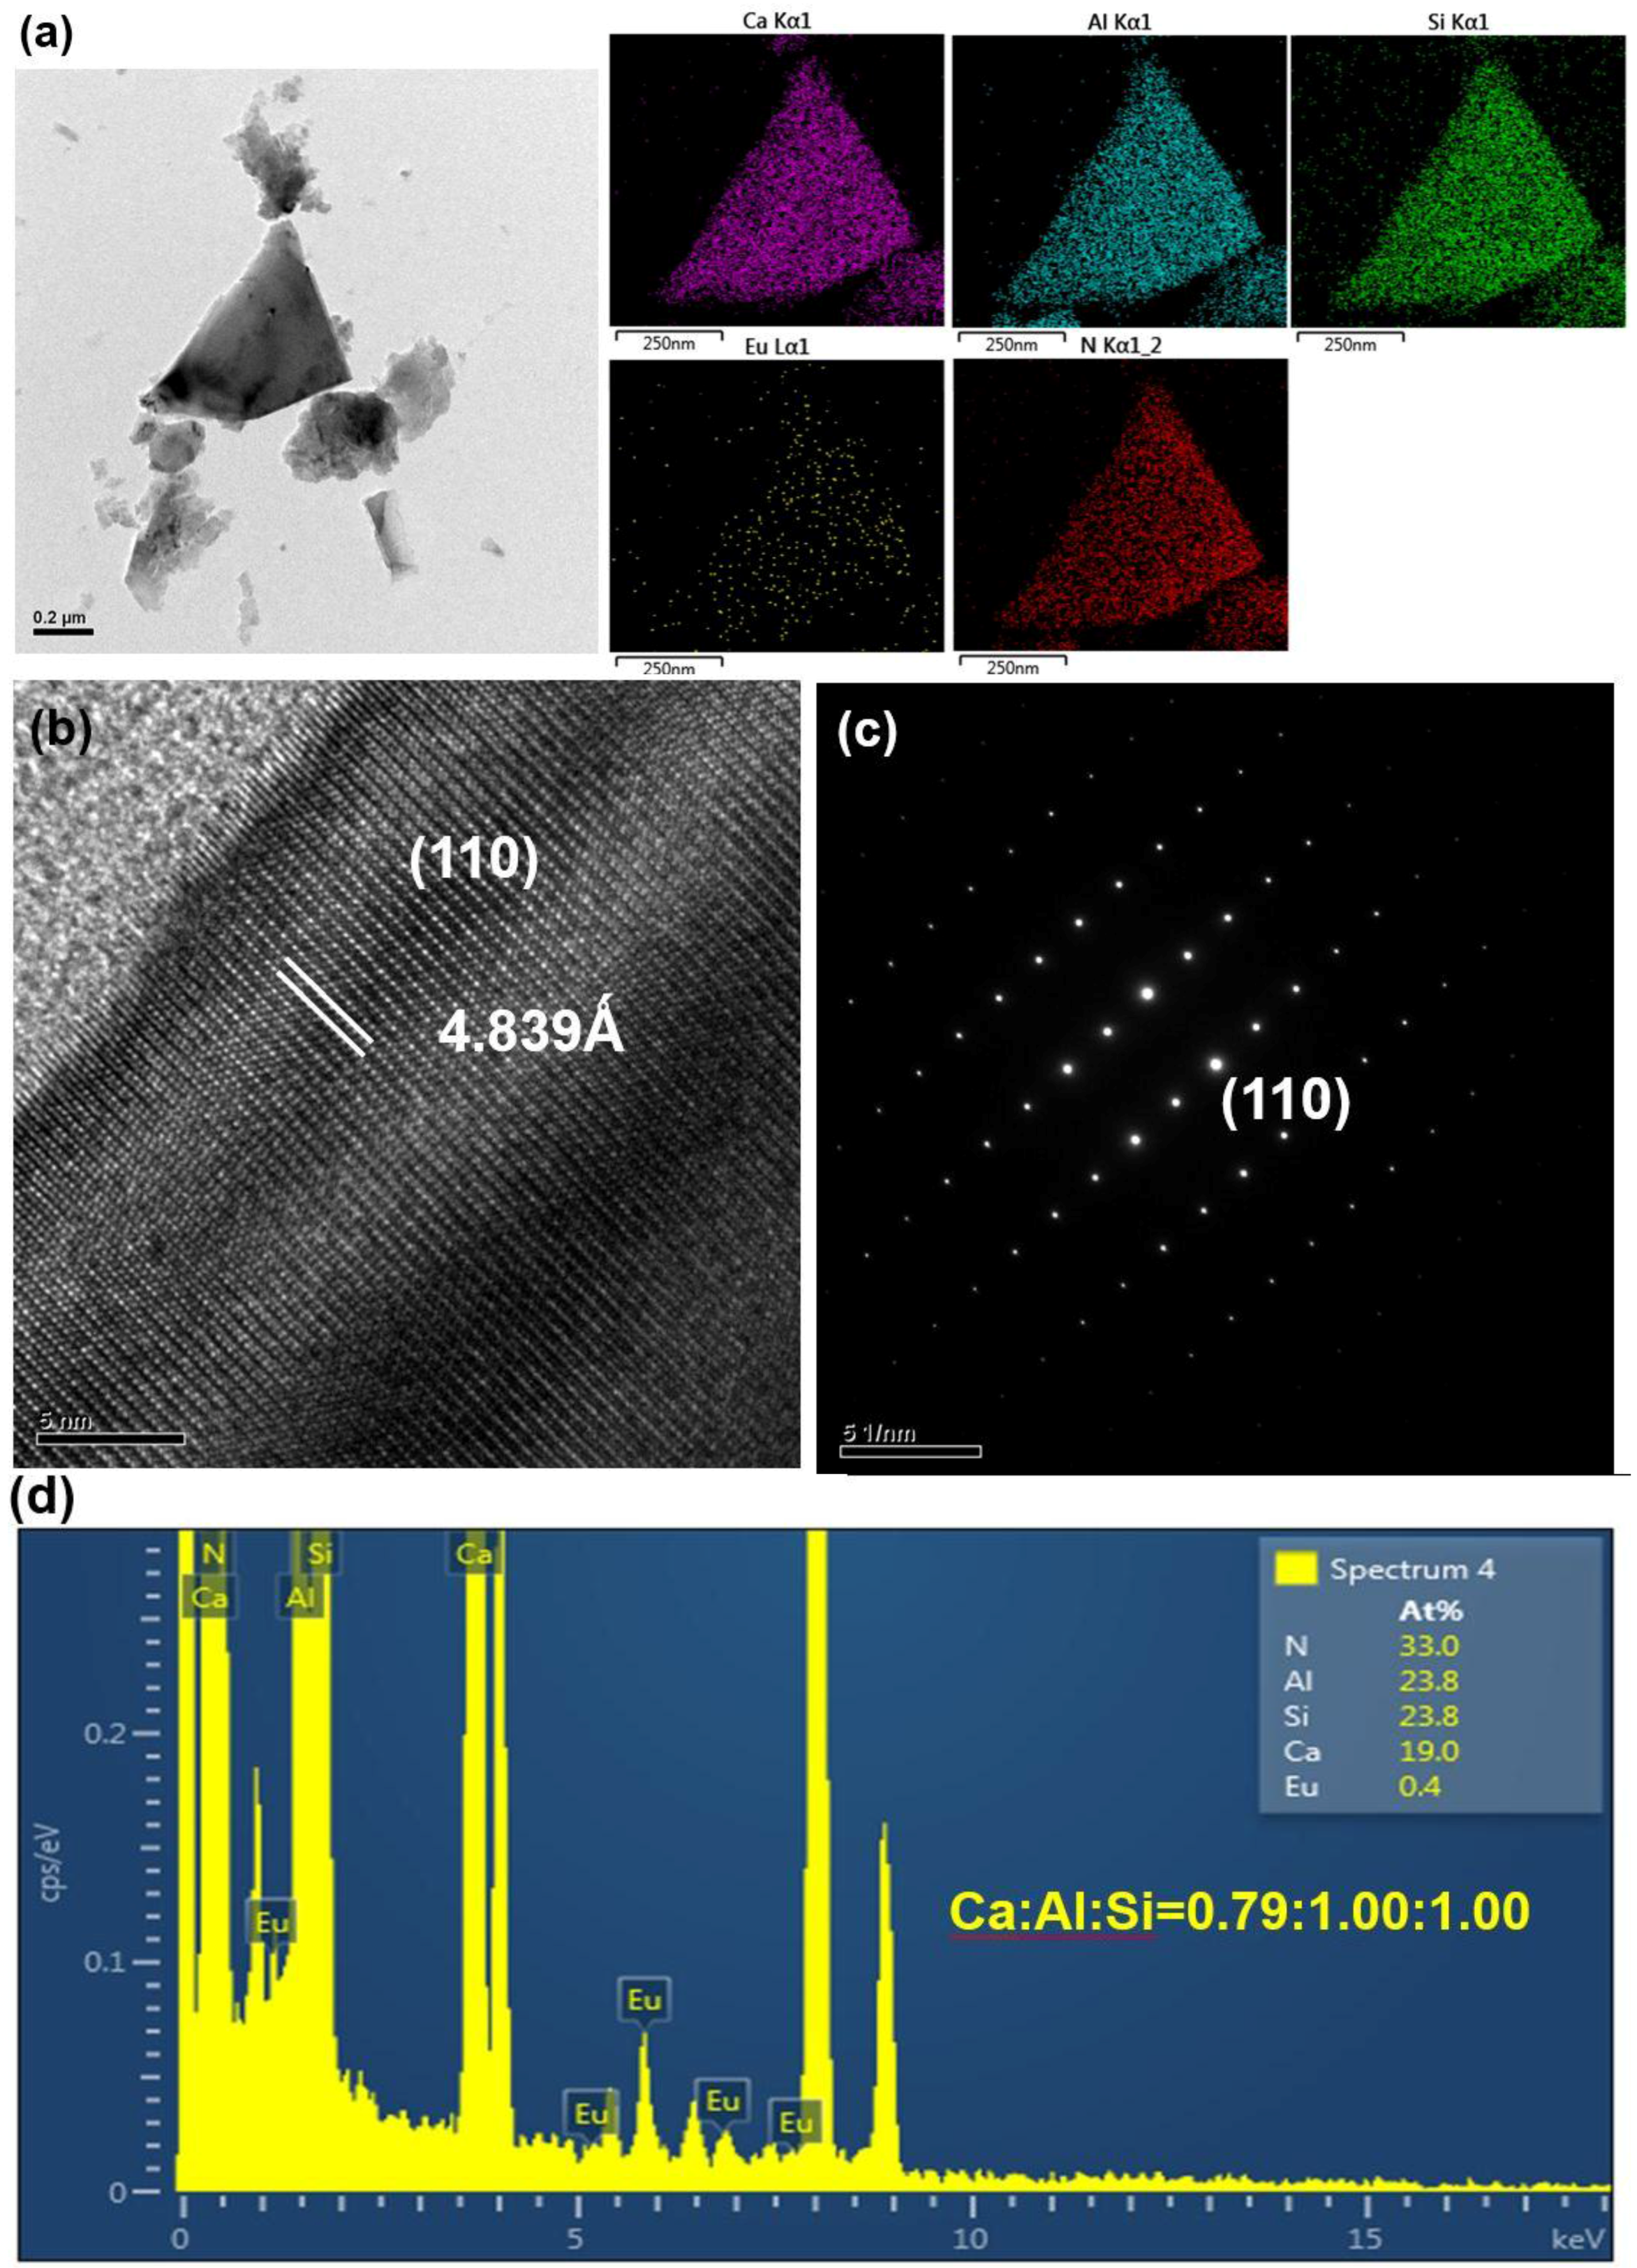
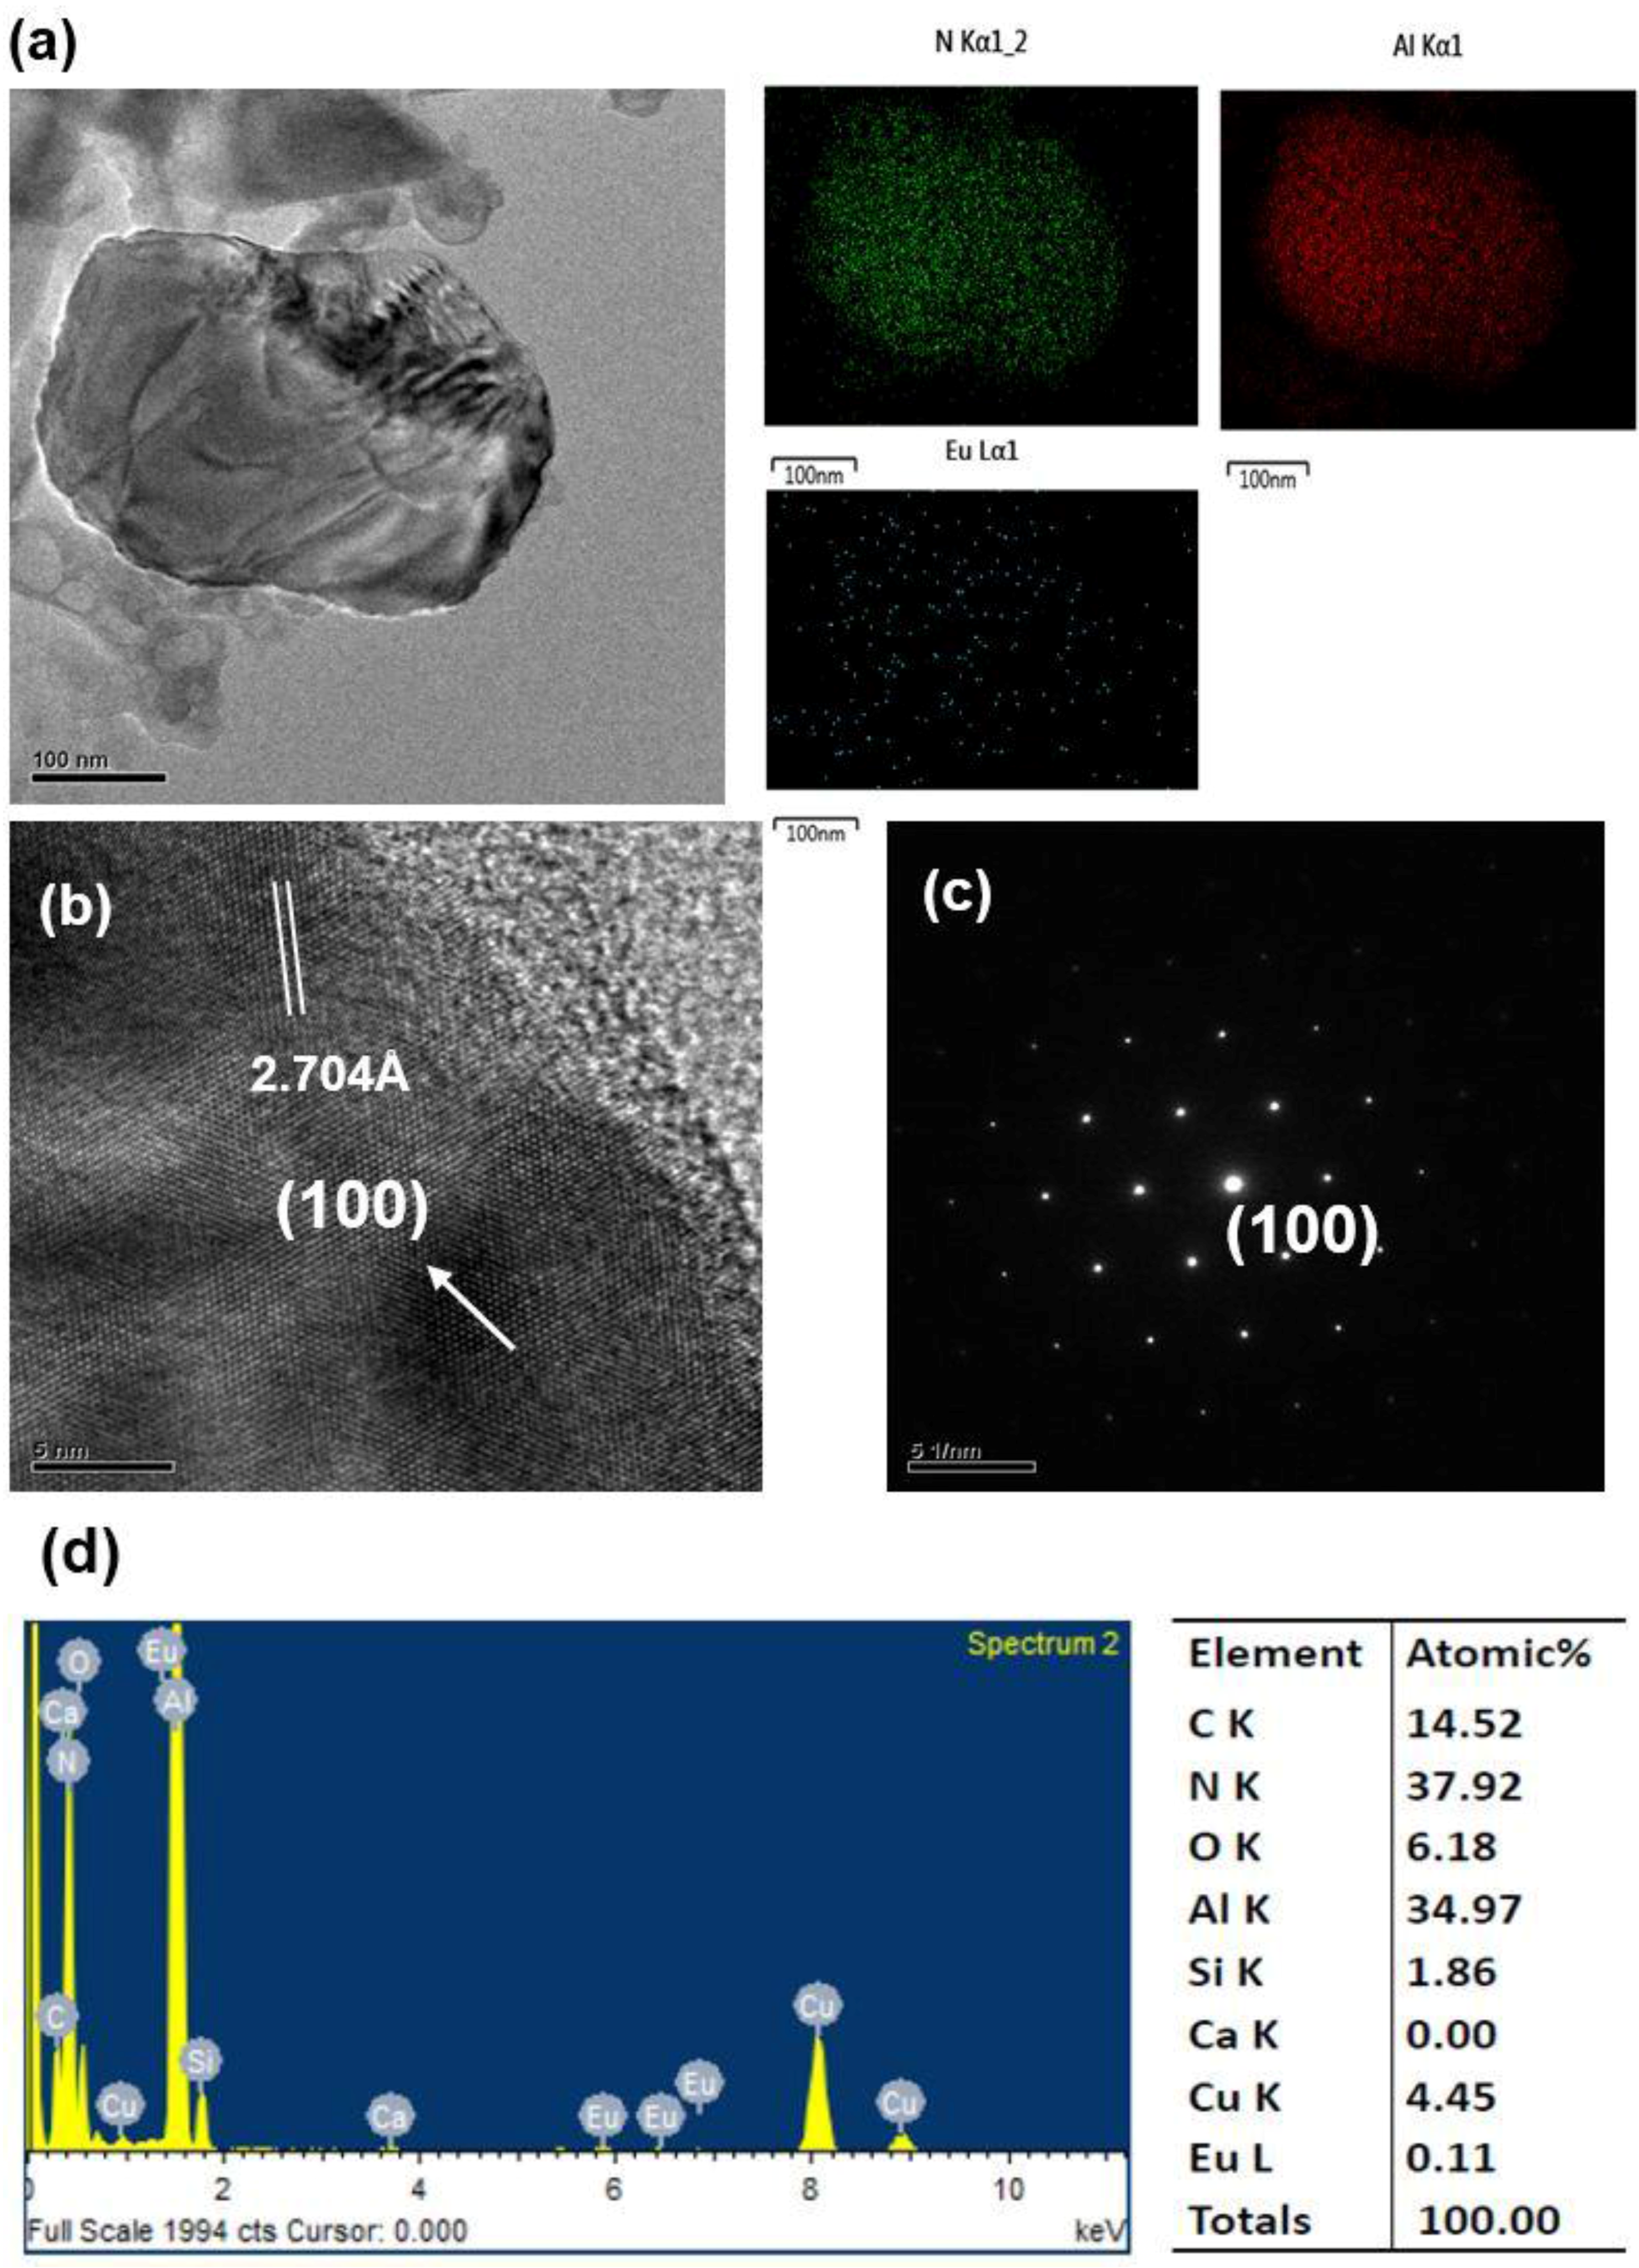
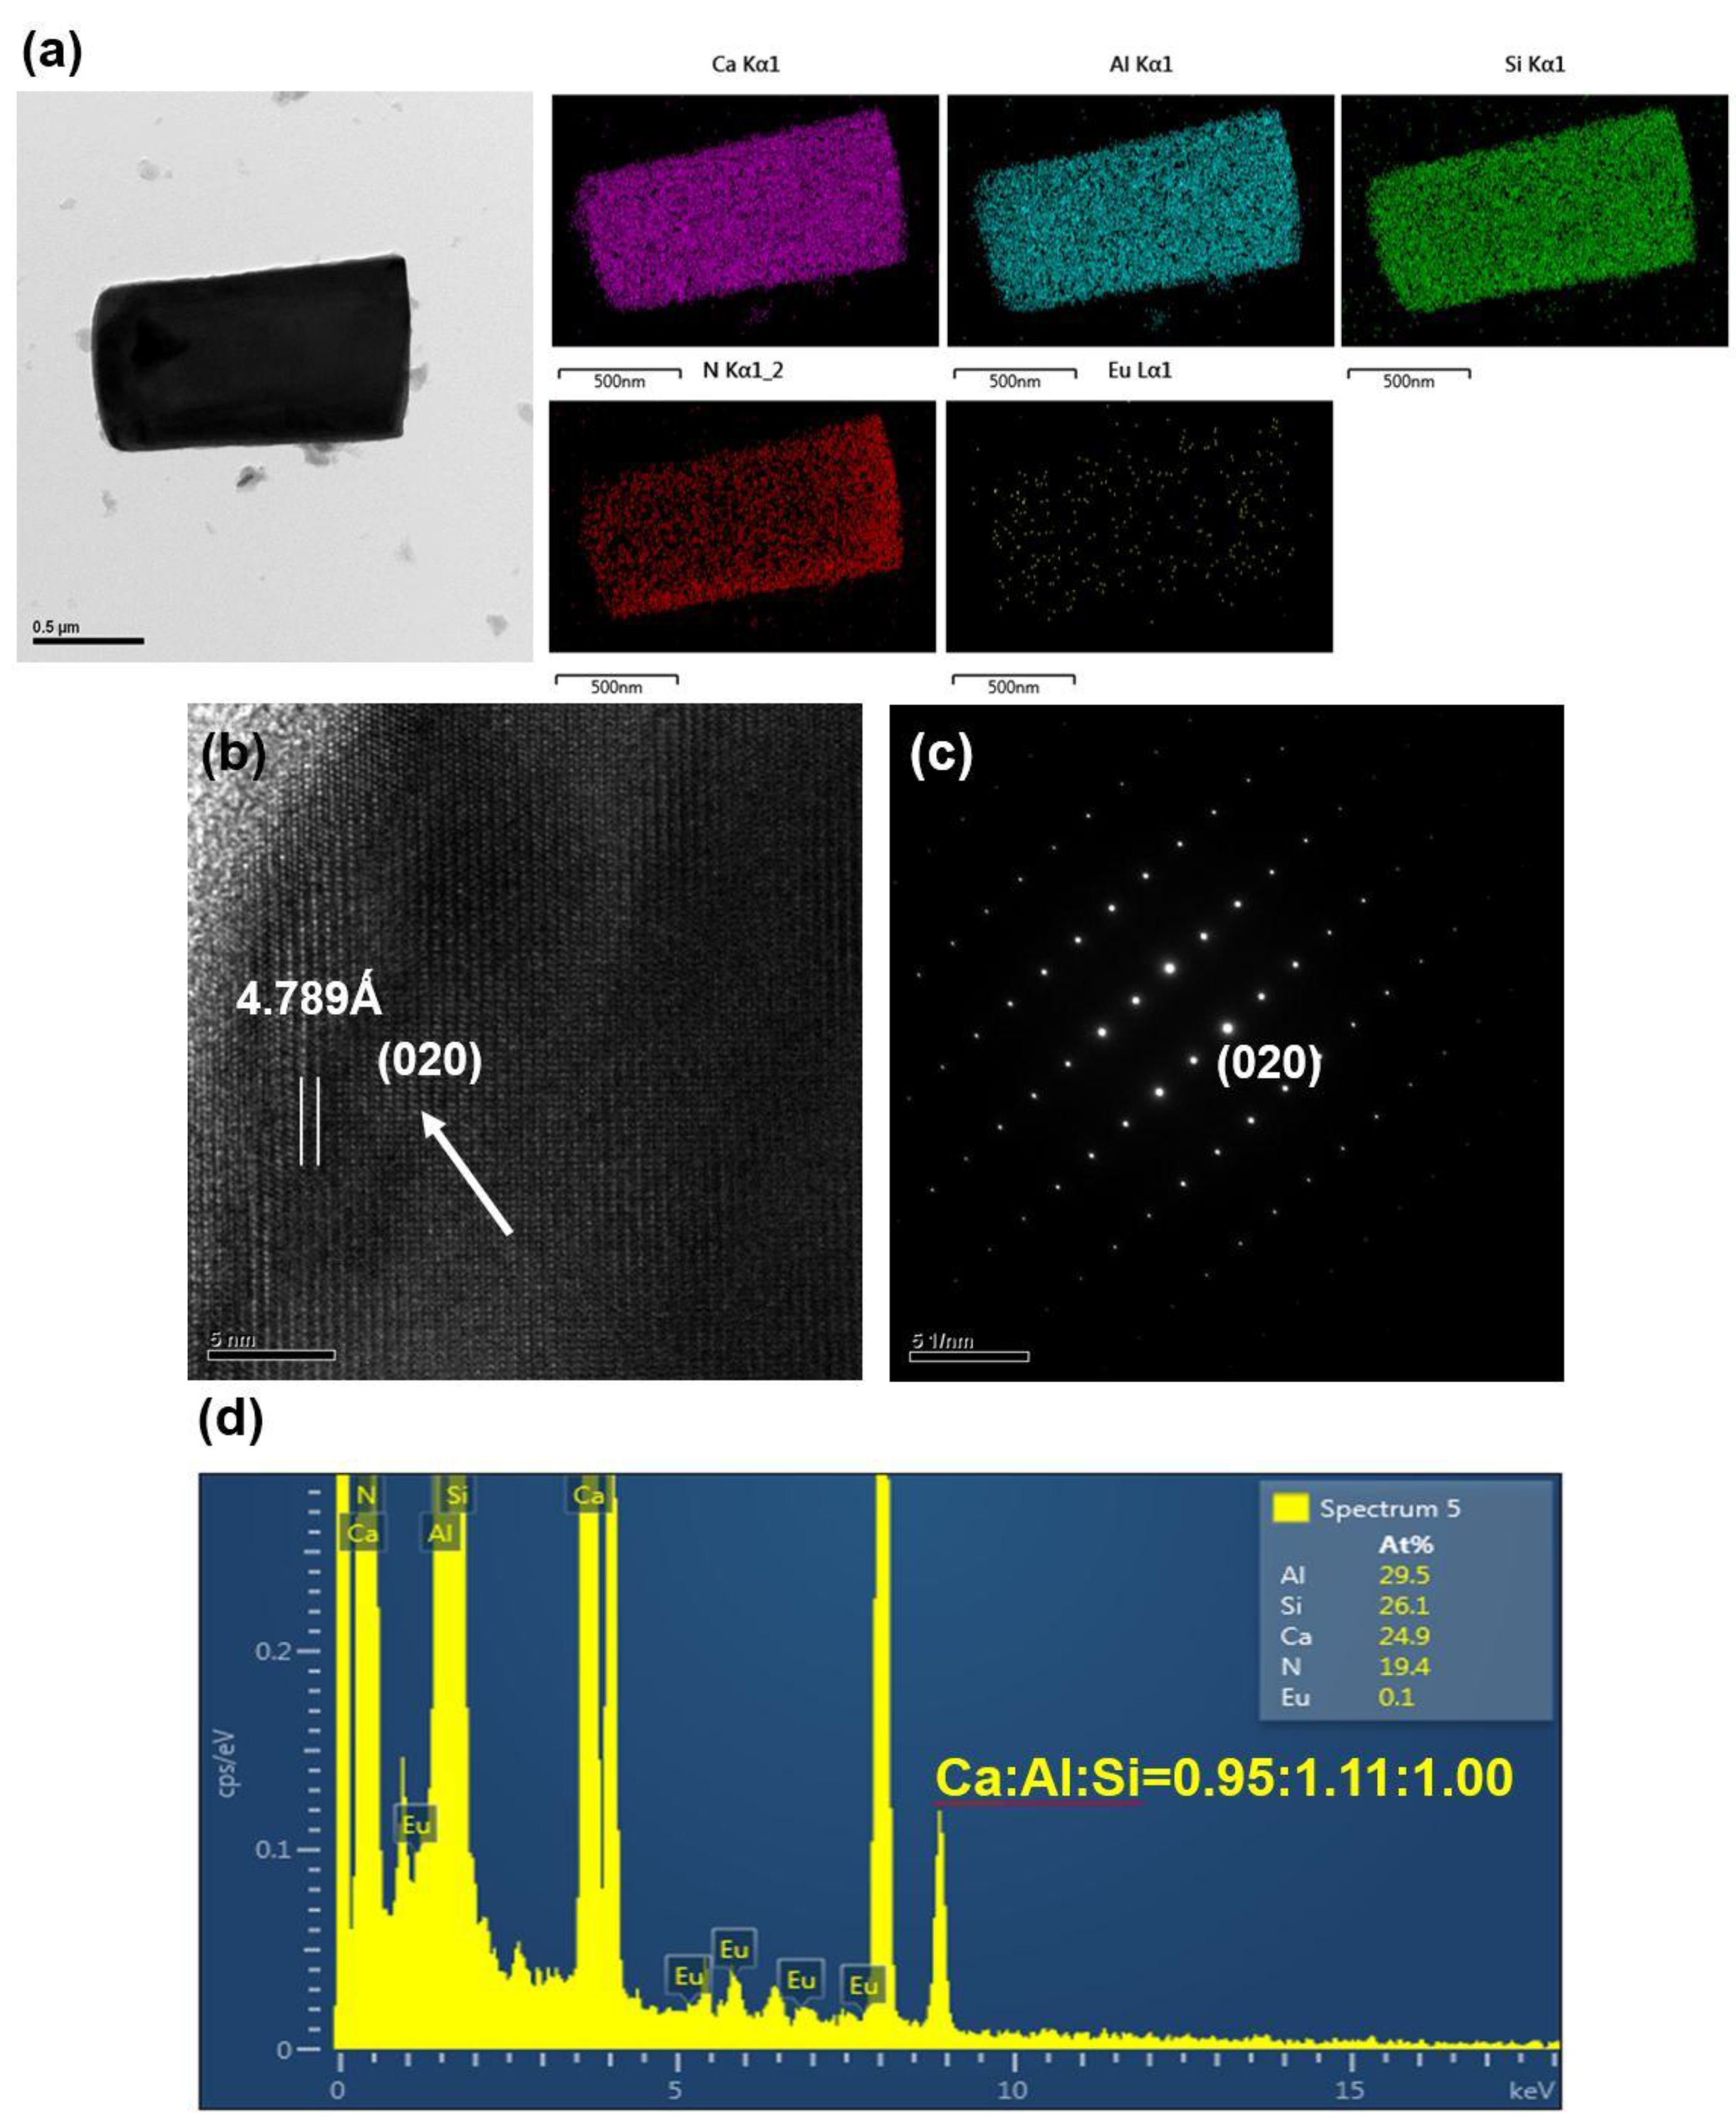
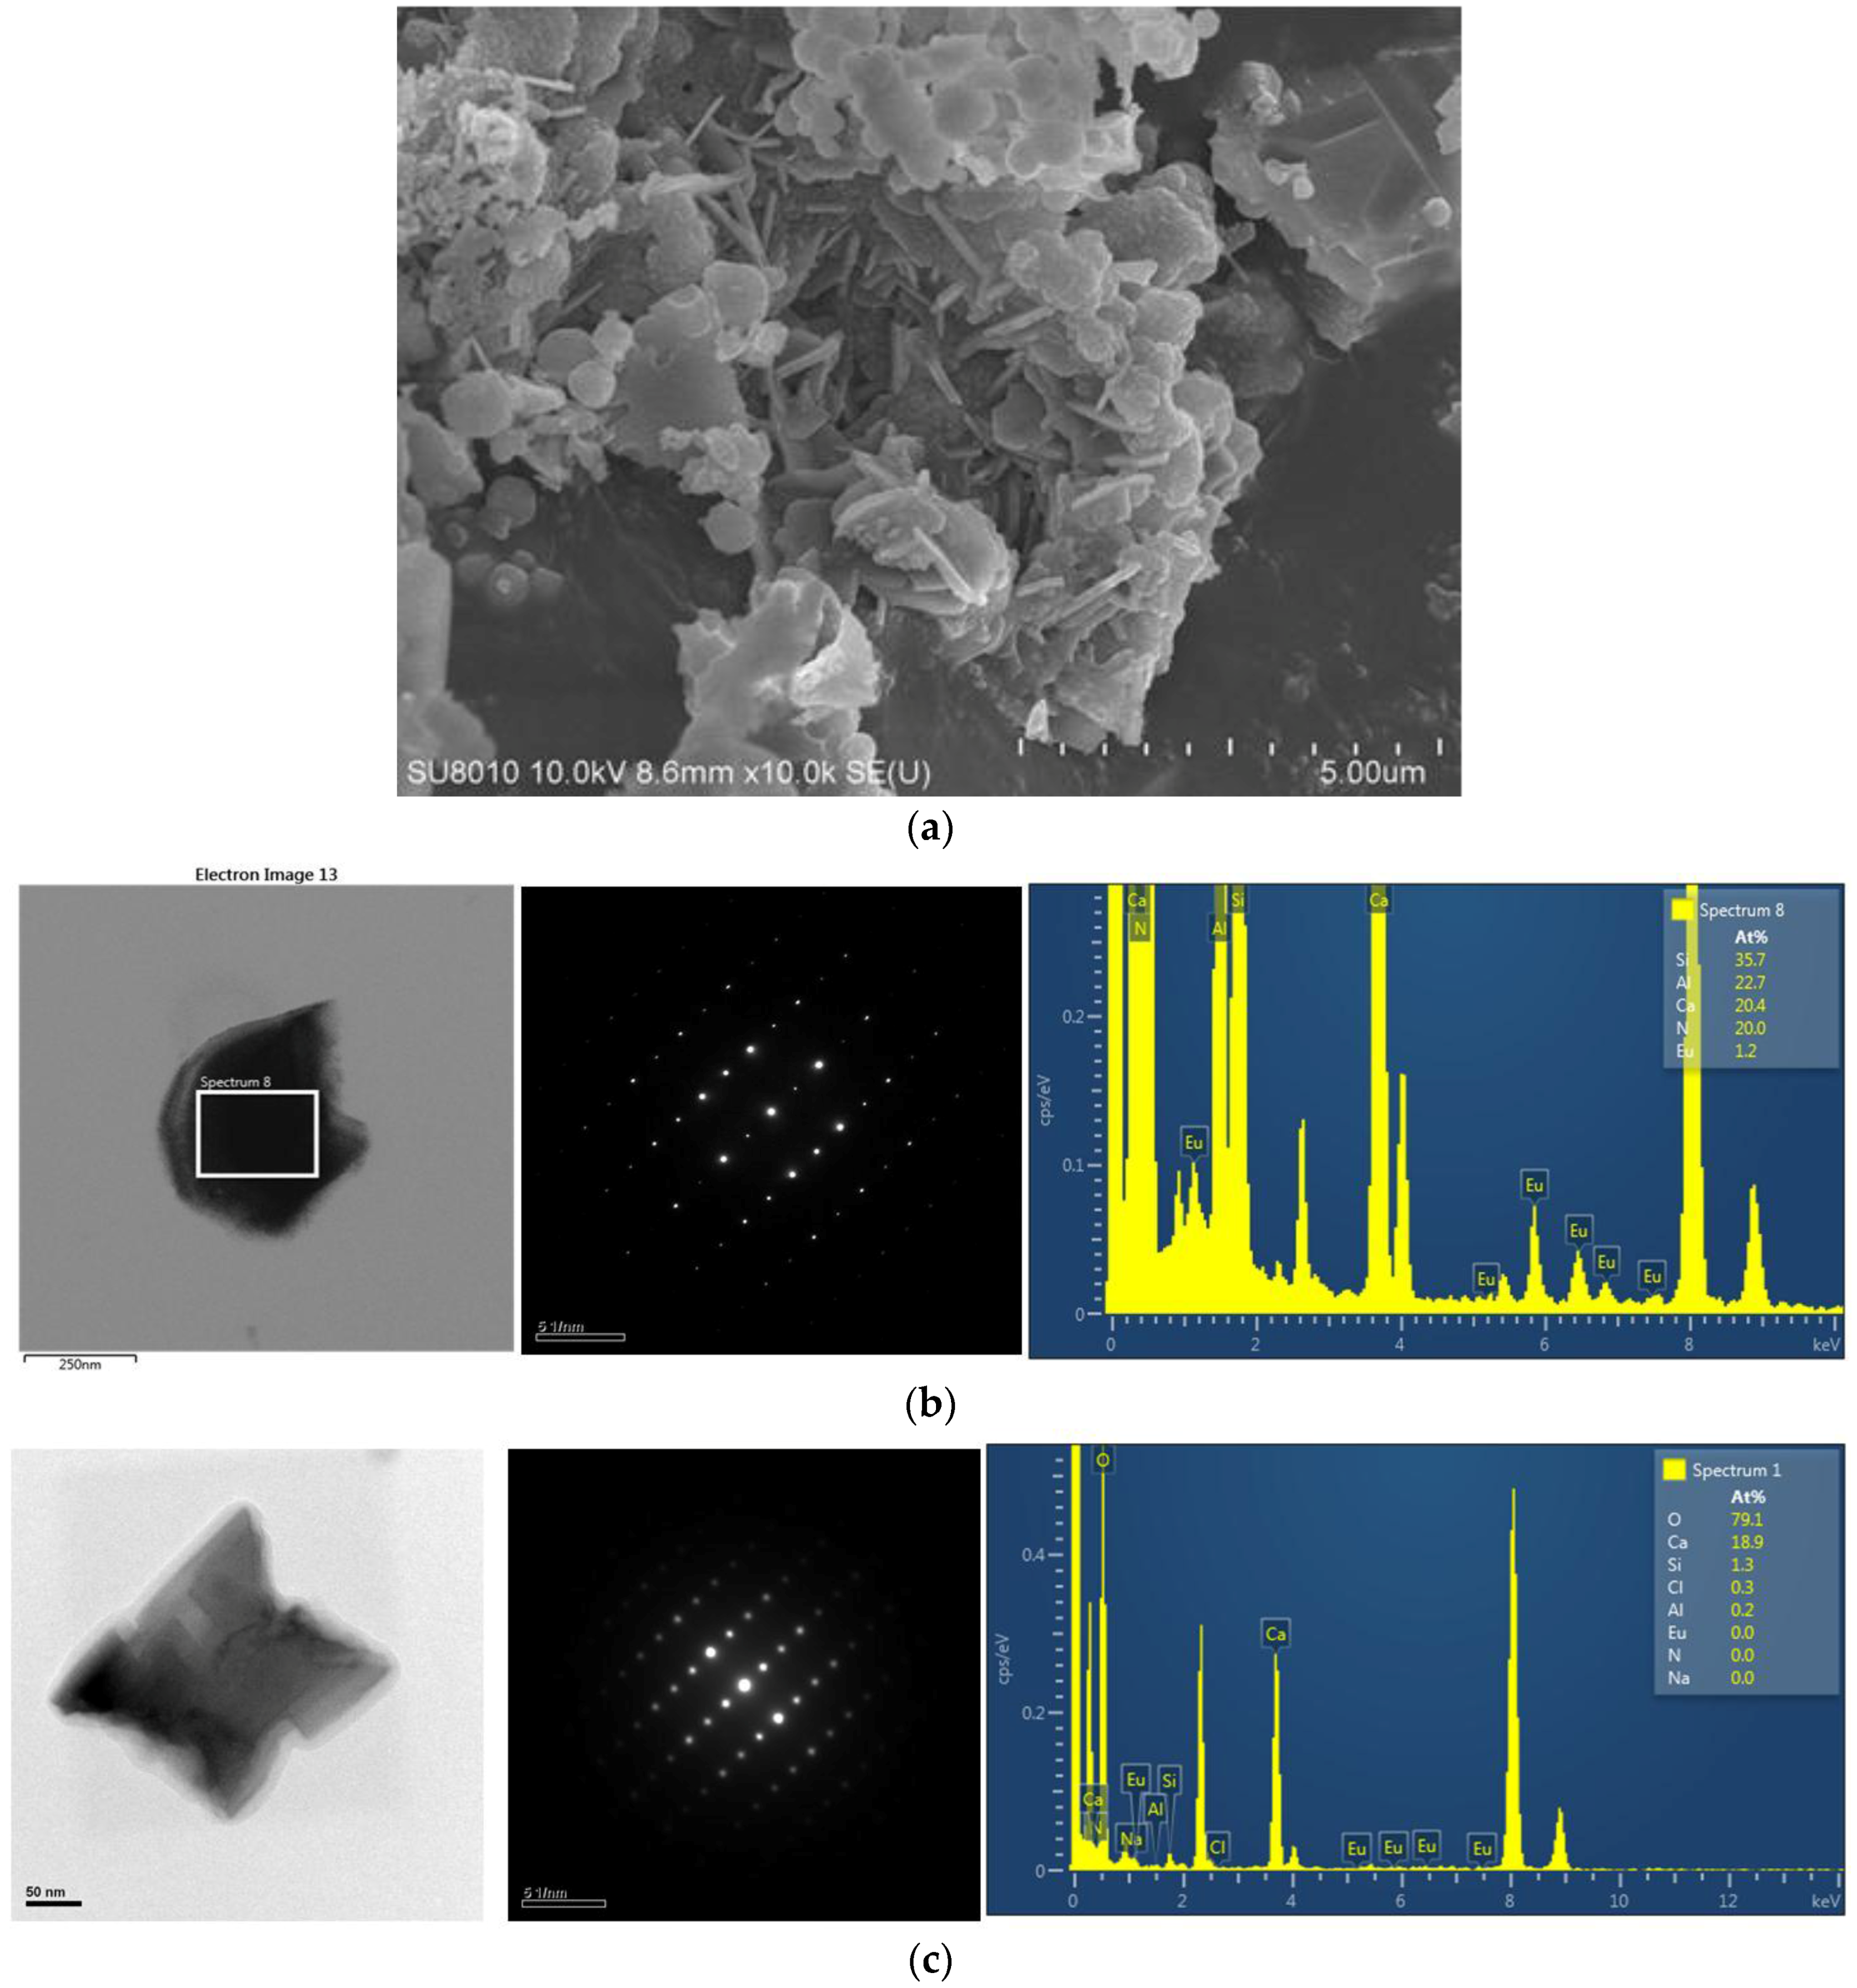
2.1. Effects of Ca Content on Product Formation and Morphology

Figure 1a–f are the XRD patterns of the as-synthesized products obtained with various Ca contents (Y = 0.25–1.68) in the reactant compacts. As can be seen, in addition to the phase of CASIN (JCPDS No. 39-0747), Ca-α-SiAlON (JCPDS No. 33-0261), AlN (JCPDS No. 89-3446), CaO (JCPDS No. 17-0912), Eu3N2 (JCPDS No. 89-4095), Ca2Al2SiO7 (JCPDS No. 89-1489) and residual Eu2O3 (JCPDS No. 43-1009) were also detected. As will be described later, the characteristic emission of AlN:Eu2+ was measured at Y = 0.25 and that of Ca-α-SiAlON:Eu2+ was measured at Y = 0.25 and Y = 0.75, indicating that AlN:Eu2+ and Ca-α-SiAlON:Eu2+ were formed at Y = 0.25 and Y = 0.25–0.75, respectively. (As will be described later, the formation of AlN:Eu2+ and Ca-α-SiAlON:Eu2+ was also confirmed by TEM-EDS and SAED measurements. In addition, note that the XRD angles of AlN and AlN:Eu2+ are very close to each other and thus the two compounds cannot be distinguished on XRD patterns [13,14,15]. The same is the case of Ca-α-SiAlON and Ca-α-SiAlON:Eu2+ [16,17,18].) The XRD peak intensity of CASIN is seen to increase with increasing Y to a maximum at Y = 1.50 but begins to decrease as Y is further increased to 1.68, indicating that the formation of CASIN continuously increases as the Ca content is increased from 0.25 to 1.50 but begins to decrease as the Ca content is further increased to 1.68. (The volume percentages of AlN, CaAlSiN3 and Ca-α-SiAlON phases formed during synthesis with various Ca contents were estimated based on the XRD measurements and shown in Figure 2.) As mentioned previously, Ca2Al2SiO7, CaO and residual Eu2O3 can be removed by washing the product with an acid. Figure 1g shows the XRD pattern of the product (synthesized with a Ca content of 1.50) after this washing. (Note that all the XRD patterns shown in Figure 1 were measured under the same experimental conditions.)
Listed in Table 1 and Table 2 are cationic molar ratios of the products (synthesized with various Y) after grinding and washing with an acid, which were obtained by ICP-OES and SEM-EDS analysis, respectively. (Note that the values of the cationic molar ratios were obtained by taking the value of Si to be 1.) As can be seen, the Ca and Eu molar ratios in the products both increase with increasing Y (except the SEM-EDS analysis of Eu at Y = 1.50 and 1.68), indicating that as Y increases, the incorporation of Ca and Eu into the products (i.e., Ca-α-SiAlON:Eu2+ at Y = 0.25–0.75 and CaAlSiN3:Eu2+ at various Y for Ca; and AlN:Eu2+ at Y = 0.25, Ca-α-SiAlON:Eu2+ at Y = 0.25–0.75 and CaAlSiN3:Eu2+ at various Y for Eu) are both roughly enhanced. Furthermore, the Ca and Eu molar ratios in the synthesized products are seen to be lower than those in the reactant compositions (except the SEM-EDS analysis of Ca at Y = 0.25). In fact, this is consistent with the XRD measurement (Figure 1), in which a by-product CaO, and residual Eu2O3 were detected in all the as-synthesized products.
After grinding with a motar and pestle (for 3 min) and washing with an acid, the products were observed to be composed mainly of bar-like, plate-like and agglomerated fine particles. Figure 3, Figure 4, Figure 5, Figure 6, Figure 7, Figure 8 and Figure 9 show the TEM and HRTEM (high resolution transmission electron microscopy) images, SAED patterns and EDS element mapping of the bar-like and plate-like particles in the products synthesized with Y = 0.25 (Figure 3, Figure 4 and Figure 5), 0.75 (Figure 6) and 1.50 (Figure 7 and Figure 8). The SAED patterns shown in Figure 4c and Figure 7c indicate that the bar-like crystals can be Ca-α-SiAlON:Eu2+ or CaAlSiN3:Eu2+ and those shown in Figure 3c, Figure 5c, Figure 6c and Figure 8c indicate that the plate-like crystals can be AlN:Eu2+, Ca-α-SiAlON:Eu2+, AlN or CaAlSiN3:Eu2+. (Note that the morphologies observed here are in consistency with those reported in other studies [13,14,15,16,17,18,19,20].) The element mapping of each crystal is consistent with the compound revealed by the corresponding SAED pattern. In addition, similar measurements (Figure 9) indicate that the agglomerated fine particles can be CaO, Eu3N2 or CaAlSiN3:Eu2+. When Y ≤ 1.00, it is found by SEM observation that plate-like and agglomerated fine particles are the major types of particles (with small amounts of bar-like particles). With increasing Y in this region (Y ≤ 1.00), the amount of plate-like particles decrease while that of agglomerated fine particles increases and at Y = 1.00, agglomerated fine particles are the most abundant type of particles. As Y is increased from 1.00 to 1.50, the amount of bar-like particles increases while that of agglomerated fine particles greatly decreases. As Y is further increased to 1.68, the amount of bar-like particles decreases while that of plate-like particles increases. Among all the samples obtained with various Y, the one with Y = 1.50 has the most abundant bar-like particles.

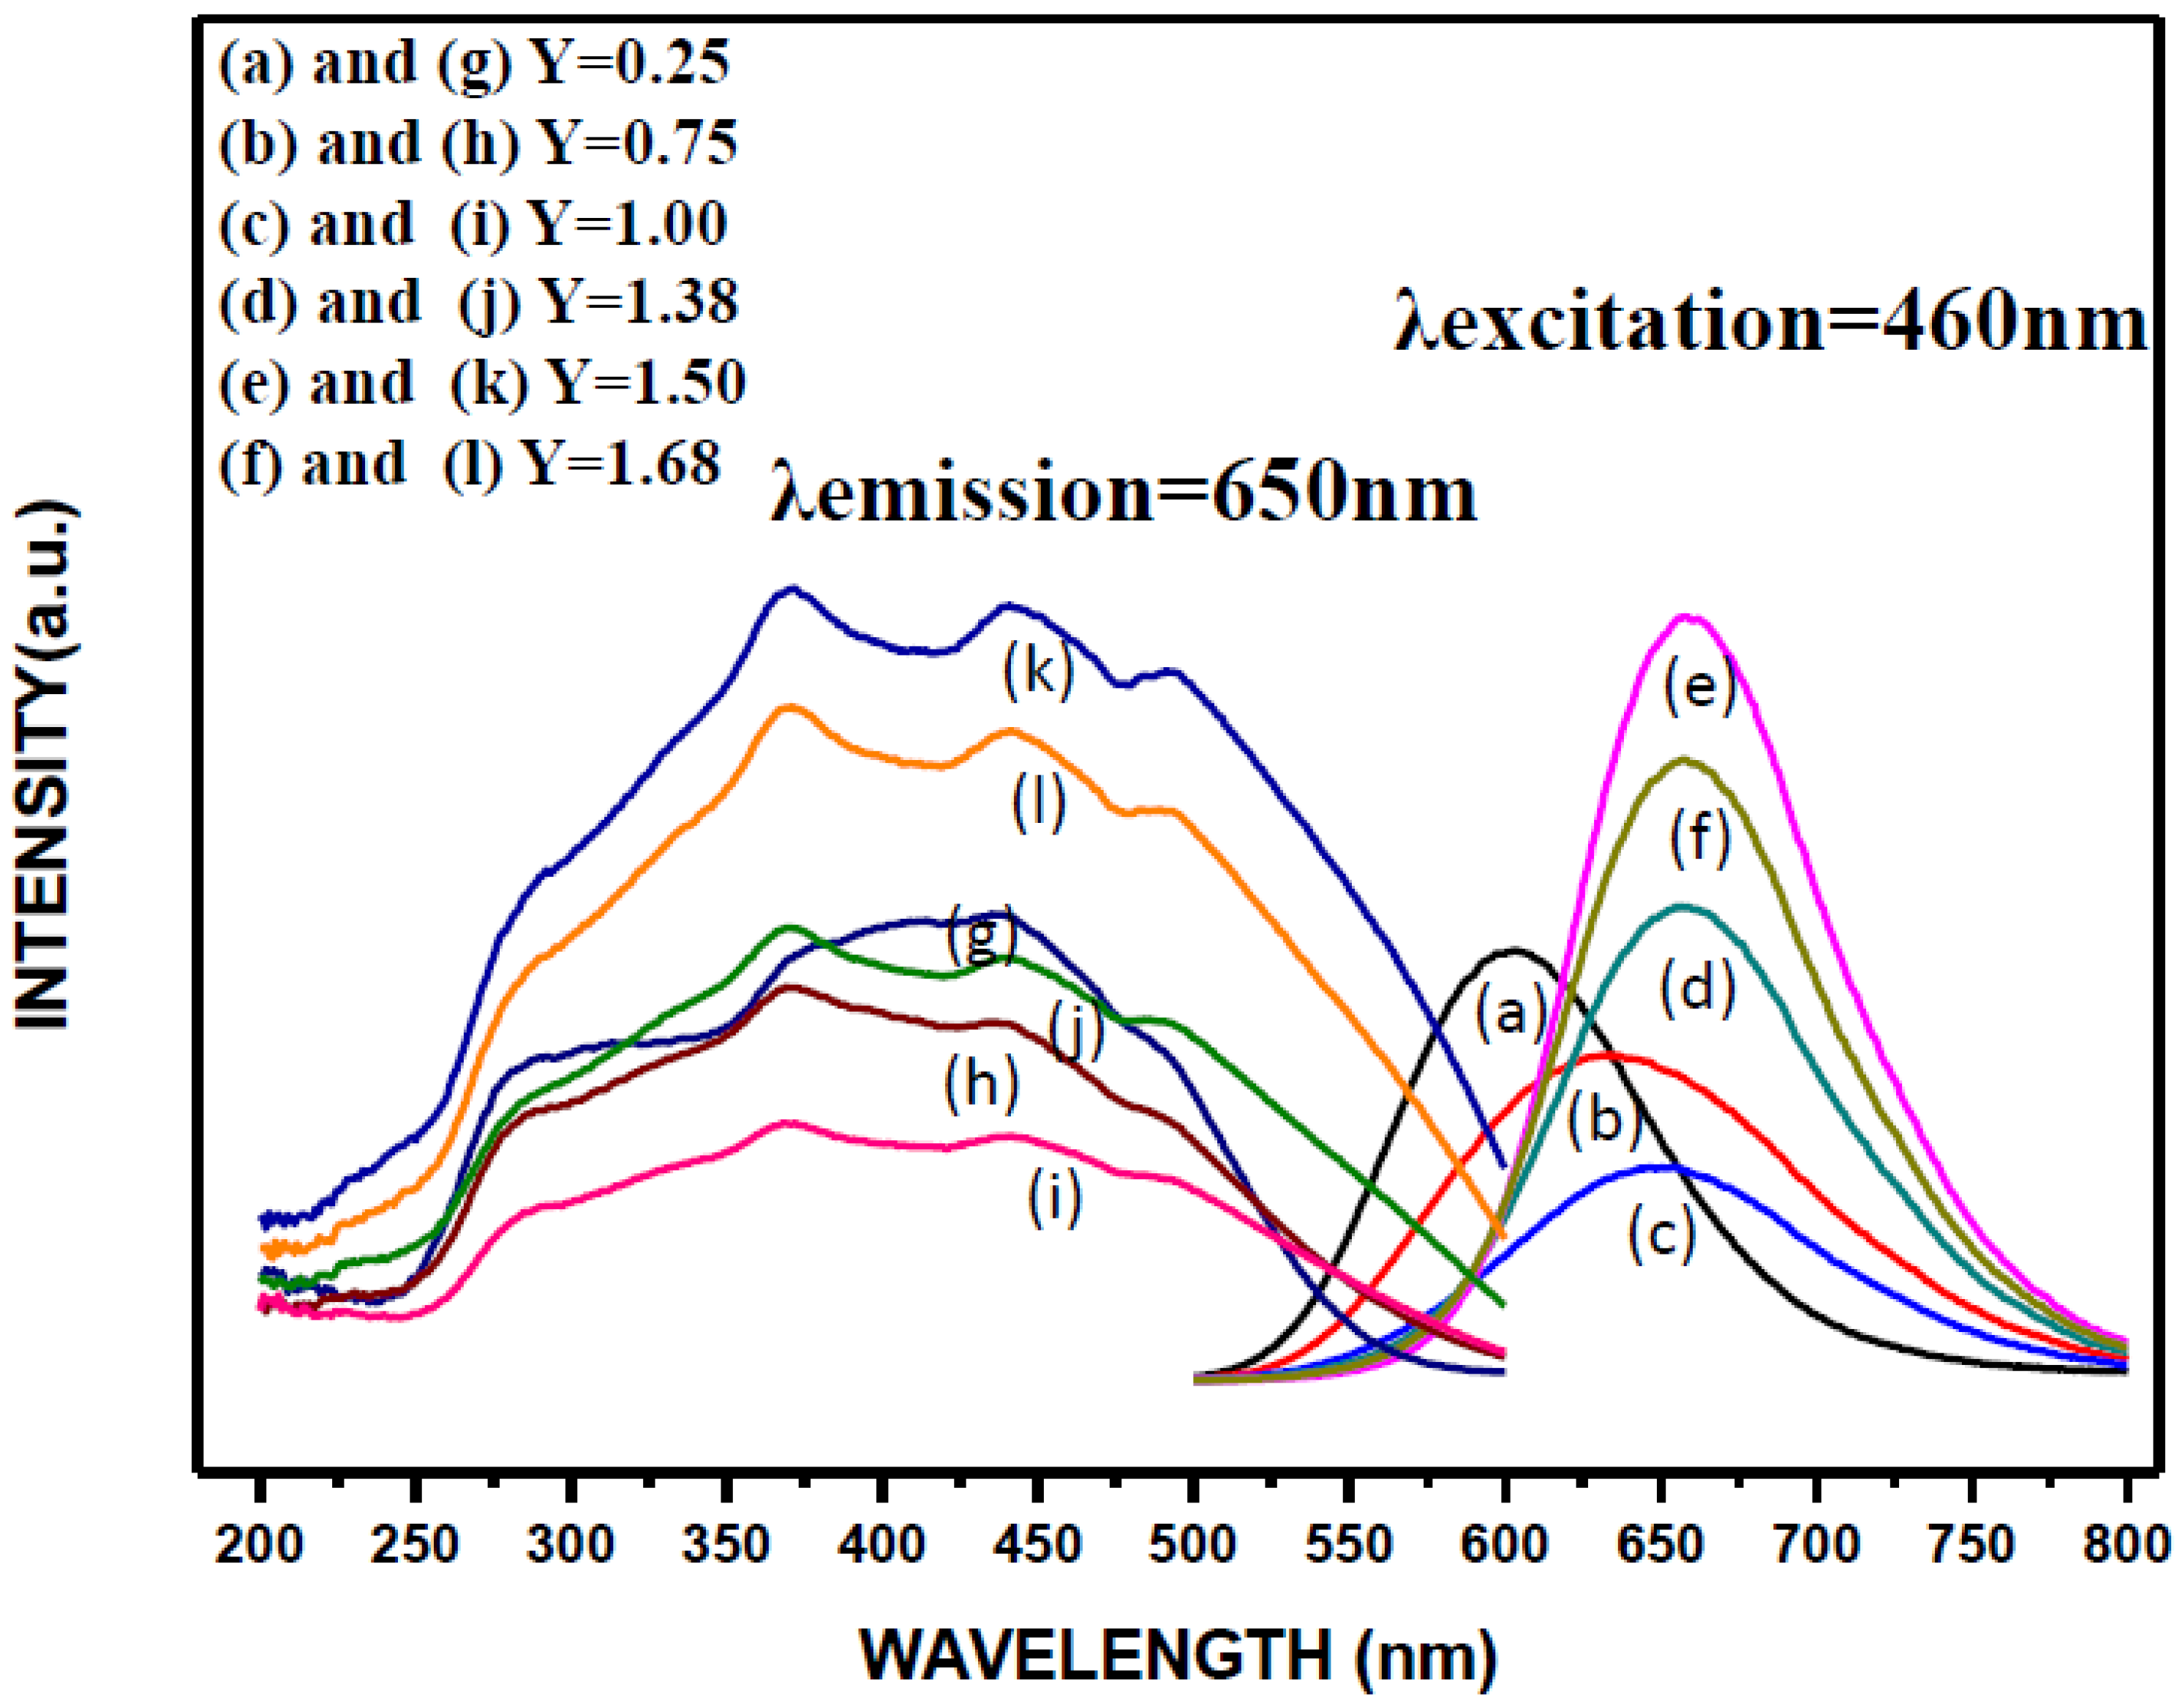
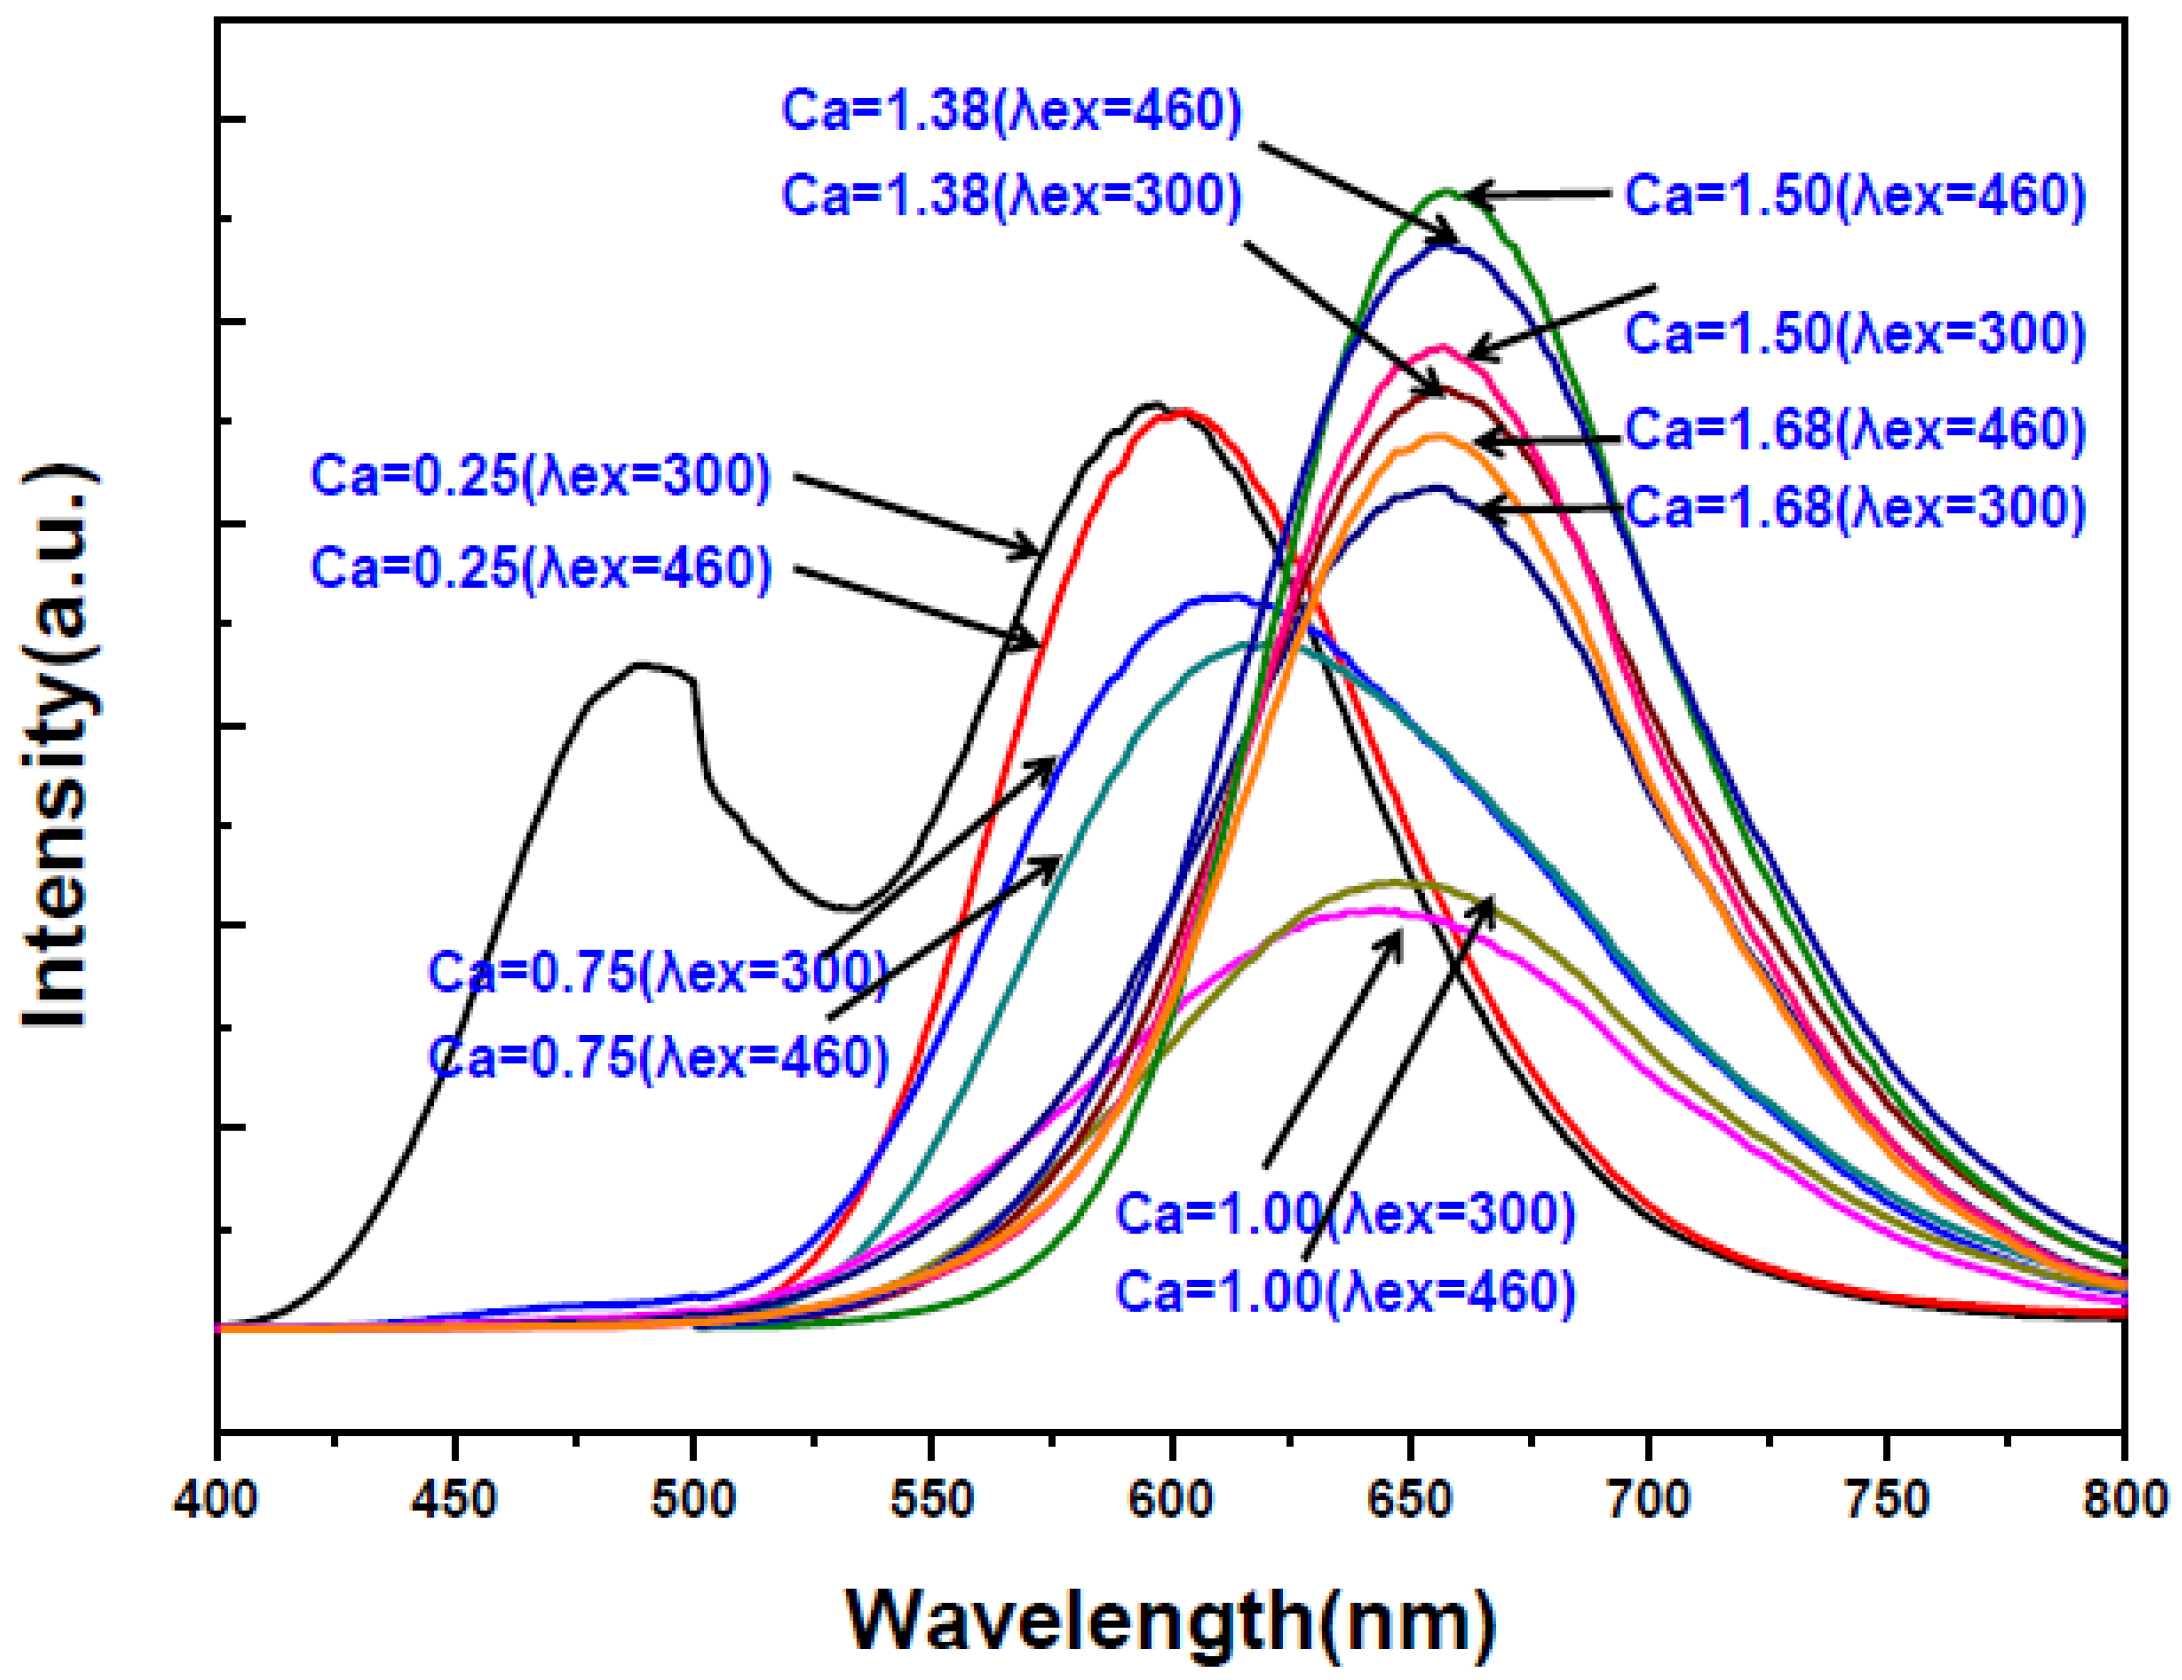
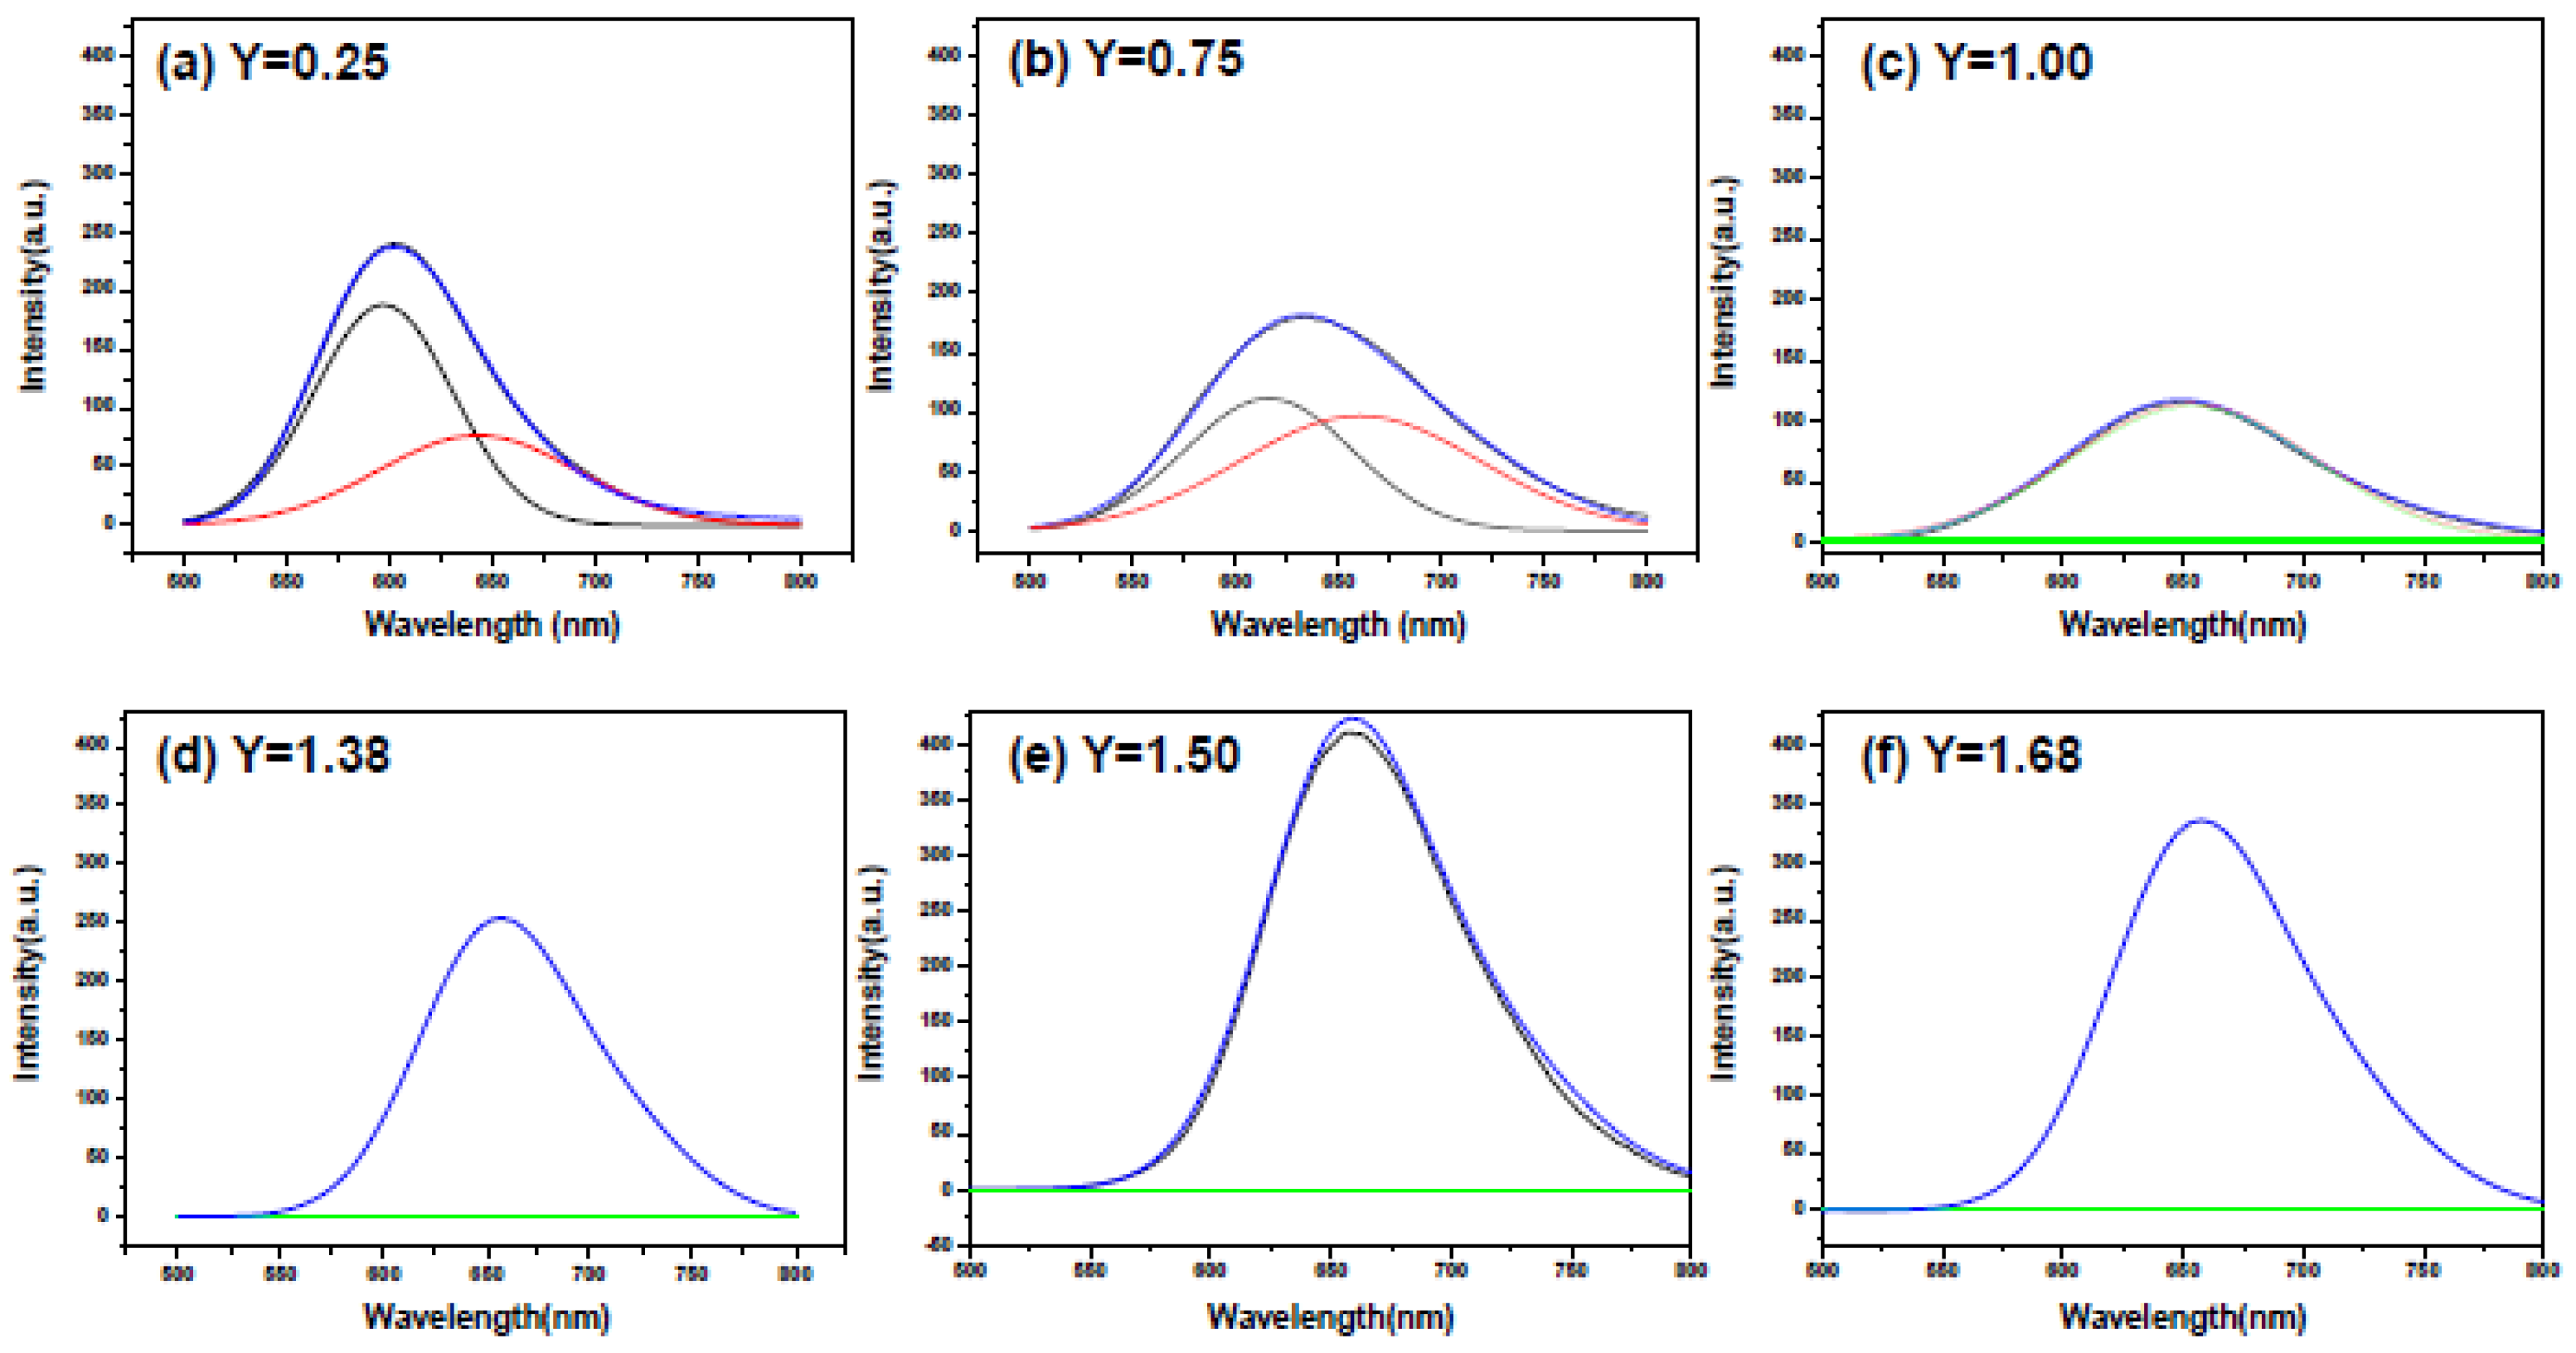
2.2. Effects of Ca Content on Photoluminescence Properties

Figure 10 shows the excitation and emission spectra of the products synthesized with various Ca contents. The excitation spectra were obtained by measuring the emission at 650 nm and the emission spectra were measured by excitation at 460 nm. As can be seen, the wavelength regions of the excitation spectra are all similar (from ~225 to ~600 nm) for various Ca contents. However, their intensity decreases as the Ca content is increased from 0.25 to 1.00 but increases as the Ca content is increased from 1.00 to 1.50 and then decreases again as the Ca content is further increased to 1.68.The excitation spectra all consist of two main absorption bands: The one in the range of 225–400 nm is ascribed to the host lattice excitation due to transition from the valence to the conduction band. The other excitation band being in the range of 400–600 nm is assigned to the 4f7→4f65d1 transition of the Eu2+ ion as a result of crystal field splitting [4,17,18].
As mentioned previously, the XRD measurements (Figure 1) show that at low Ca contents (i.e., Y = 0.25 and 0.75), the phases of Ca-α-SiAlON (including Ca-α-SiAlON:Eu2+ and Ca-α-SiAlON), AlN (including AlN:Eu2+ and AlN), CaO, Eu3N2, Ca2Al2SiO7 and residual Eu2O3 were detected in addition to the phase of CaAlSiN3 [21]. Among these, CaAlSiN3, Ca-α-SiAlON and AlN have been reported to be possible host lattices forming phosphors activated by Eu2+ [10,11,12,13,14,15,16,17,18,19,20]. Among these three possible phosphors, AlN:Eu2+ cannot be excited by λ = 460 nm but can be excited by λ = 300 nm; however, CaAlSiN3:Eu2+ and Ca-α-SiAlON:Eu2+ can both be excited by λ = 300 and 460nm [22,23,24,25,26,27,28,29,30,31,32]. For this reason, the emission spectra of the synthesized products (after grinding and acid washing) by excitation at λ = 300 nm were also measured and the results (together with the emission spectra by excitation at λ = 460 nm as shown in Figure 10) are shown in Figure 11. As can be seen at Y = 0.25, the emission spectra excited by λ = 300 nm has two peaks while that by λ = 460 nm has only one peak. The additional peak (centered at 480 nm) is thus believed to be generated by AlN:Eu2+. (Note that this emission is in consistency with the observation reported in many other studies [13,14,15].) However, this peak was not measured at Y ≥ 0.75 (see Figure 11) perhaps due to the great decrease in the formation of AlN phase at Y ≥ 0.75. One other possible reason may be that the doping of AlN with Eu2+ (by substitution for Al3+) is more difficult than that of Ca-α-SiAlON or CaAlSiN3 with Eu2+ (by substitution for Ca2+). The increasing formation of CaAlSiN3 phase at Y ≥ 0.75 thus suppresses the formation of AlN:Eu2+. (Note the charge difference between Al3+ and Eu2+ and the differences in radius among the three ions: Al3+, 0.50Ǻ; Ca2+, 1.00Ǻ and Eu2+, 1.17Ǻ.)
Since the emission spectra excited by λ = 460 nm at Y ≤ 0.75 appear asymmetric, Gaussian deconvolution was made to all the emission spectra excited by λ = 460 nm and the results are shown in Figure 12. As can be seen, two Gaussian peaks can be deconvoluted for the emission spectra at Y = 0.25 and 0.75 (under excitation of λ = 460 nm) by best least-square fit. The high energy emission peaks (centered at ~600 nm) of the deconvoluted emission spectra are believed to be due to Ca-α-SiAlON:Eu2+ and the low energy emission peaks (centered at ~650 nm) are due to CaAlSiN3:Eu2+.
Figure 12 also shows the absence of the high energy emission peak in all the emission spectra with Y ≥ 1.0 and all the emission spectra (with Y ≥ 1.0) to be single broad band emission [33,34]. The absence of the high energy emission peak is in consistency with the fact that Ca-α-SiAlON phase was not detected by XRD measurement when Y ≥ 1.0 (Figure 1) and the single broad band emission (centered at ~650 nm) is apparently generated by CaAlSiN3:Eu2+. As can be seen in Figure 10, the emission intensity increases as the Ca content is increased from 1.00 to 1.50 but begins to decrease as the Ca content is further increased to 1.68. This may be explained by that the formation of CaAlSiN3 phase is increased as Y is increased from 1.00 to 1.50 but begins to decrease as Y is further increased to 1.68 as revealed by the XRD measurement (Figure 1) described previously. Besides, as described previously, the formation of the bar-like crystals (identified as CaAlSiN3:Eu2+ at Y ≥ 1.00) increases as Y is increased from 1.00 to 1.50 but begins to decrease as Y is further increased to 1.68. This suggests that the bar-like morphology of CaAlSiN3:Eu2+ may have stronger emission than the other two morphologies (i.e., plate-like and agglomerated fine particles of CaAlSiN3:Eu2+), thus leading to the above mentioned variation of the emission intensity from Y = 1.00 to Y = 1.68.

3. Experimental Section

As mentioned previously, the present study was carried out by employing the combustion synthesis process developed in our previous study [10] for the synthesis of CASIN. Listed in Table 3 are the characteristics of the reagents used in this study. Calcium, aluminum, silicon, europium oxide, sodium azide (NaN3), ammonium chloride and silicon nitride powders were used as the starting materials. To study the effect of Ca content on the formation of CASIN and its photoluminescence property, the molar ratio of Ca (denoted by Y) varies from 0.25 to 1.68 while those of others were kept constant as Al:Si:Si3N4:Eu2O3:NaN3:NH4Cl = 1:0.25:0.25:0.02:3.5:0.6. These starting materials were thoroughly mixed in the desired proportions and then pressed into cylindrical compacts (referred to as reactant compacts) with 17 mm in diameter and ~16 mm in length. The reactant compact thus obtained was then wrapped up with an igniting agent (i.e., a mixed powder of Mg and Fe3O4 at 4:1 molar ratio) to obtain a larger cylindrical compact (referred to as a wrapped compact) with 30 mm in diameter and ~30 mm in length (These compacts were prepared following the procedures described in our previous study [10]).
The combustion synthesis reactor used in this study has been described and shown schematically in our previous studies [35,36] and thus is not repeated here. The wrapped compact was placed on a height adjustable stage which was adapted so that the top surface of the compact was about 5 mm below the tungsten heating coil. The reactor was evacuated to 65 Pa by flushing with nitrogen between the evacuations. After the evacuation, the reactor was backfilled with nitrogen to the desired pressures. The combustion reaction was ignited by heating the top surface of the compact for ~10 s by applying an electrical power of ~1 KW to the heating coil.
After combustion, the igniting agent was converted to MgO + Fe, which was loosely attached to the interior product. The interior product could thus be easily separated from the combustion product of the igniting agent. The as-synthesized products contained byproducts, AlN, Ca2Al2SiO7, Eu3N2, CaO and small amounts of unreacted Eu2O3. Ca2Al2SiO7, CaO and small amounts of unreacted Eu2O3 could be removed by washing the products with an acid (e.g., 32 wt. % HCl aqueous solution as used in this study). The crystalline phase of the product was identified by X-ray diffraction (D8 Discover, Bruker Axs Gmbh, Karlsruhe, Germany) using Cu Kα radiation operating at 40 kV and 40 mA. The powder diffraction patterns were obtained using a Bruker Axs Nanostar Universal System coupled with an IuS-type X-ray tube for a microfocus X-ray source with a wavelength of 0.154 nm. The diffraction signals were recorded on an image plate with an exposure period of 30 min. The data was collected in the range of 20° ≤ 2θ ≤ 80°. Scanning electron micrographs (SEM) together with energy-dispersed X-ray spectroscopy (EDS) measurements were performed on a field-emission scanning electron microscope (SU-8100, Hitachi, Japan). The cationic compositions of the synthesized product were analyzed by inductively coupled plasma optical emission spectrometry (ICP-OES, Agilent 725, Santa Clara, CA, USA). The excitation and emission spectra were measured at room temperature using a Fluorescent Spectrophotometer (F-7000, Hitachi, Japan) with a 150 W xenon lamp at a scanning speed of 1200 nm/min. High resolution transmission electron microscopy (i.e., HRTEM) images, selected area electron diffraction (SAED) patterns and element mapping were obtained on an transmission electron microscope (JEM-2100F, JEOL, Tokyo, Japan) equipped with an energy-dispersive X-ray spectroscope (EDS) system operating at 200 kV.

4. Conclusions

Ca content in the reactant mixture (expressed as molar ratio “Y” in Ca:Al:Si:Si3N4:Eu2O3:NaN3:NH4Cl = Y:1.0:0.25:0.25:0.02:3.5:0.6) was found to affect significantly the formation and photoluminescence properties of CASIN (CaAlSiN3:Eu2+) phosphor by combustion synthesis. At Y = 0.25, AlN:Eu2+ and Ca-α-SiAlON:Eu2+ were detected (by XRD) to be formed as major phosphor products. Formation of Ca-α-SiAlON:Eu2+ was found to be decreased as Y was increased to 0.75 and AlN:Eu2+ and Ca-α-SiAlON:Eu2+ were not detected at Y ≥ 0.75 and ≥1.00, respectively. Formation of CASIN was found to be increased with increasing Y as Y was increased from 0.25 to 1.50 but began to decrease as Y was further increased to 1.68. The emission intensity of CASIN was found to vary with Y in a similar trend to its extent of formation. Three major types of morphology were observed for the synthesized products: plate-like crystals, bar-like crystals and agglomerated fine particles. AlN:Eu2+ was found to be formed as plate-like crystals, Ca-α-SiAlON:Eu2+ was formed as both plate-like and bar-like crystals, and CASIN was formed in all the three types of morphology. Among the three types of morphology of CASIN, the bar-like morphology seems to give a stronger emission than the other two. The Ca and Eu contents (expressed as molar ratios) in the synthesized products were found to increase roughly with increasing Y but were both lower than the respective Ca and Eu contents in the reactant mixtures.

Acknowledgments

Support of this research by the National Science Council of the Republic of China under Grant No. NSC 102-2221-E-006-222 is gratefully acknowledged.

Author Contributions

The process design, experimental work and writing of the first draft of the manuscript were all carried out and finished by Shu-Chi Huang. The following correction, modification and revision of the manuscript were also performed by Shu-Chi Huang under the supervision of Shyan-Lung Chung.

Conflicts of Interest

The authors declare no conflict of interest.

References

  1. Hu, Y.S.; Zhuang, W.D.; He, H.Q.; Liu, R.H.; Chen, G.T.; Liu, Y.H.; Huang, X.W. High temperature stability of Eu2+-activated nitride red phosphors. J. Rare Earth 2014, 32, 12–16. [Google Scholar] [CrossRef]
  2. Huang, W.Y.; Yoshimura, F.; Ueda, K.; Pang, W.K.; Su, B.J.; Jang, L.Y.; Chiang, C.Y.; Zhou, W.; Duy, N.H.; Liu, R.S. Domination of second-sphere shrinkage effect to improve photoluminescence of red nitride phosphors. Inorg. Chem. 2014, 53, 12822–12831. [Google Scholar] [CrossRef] [PubMed]
  3. Xie, R.J.; Hirosaki, N.; Sakuma, K.; Kimura, N. White light-emitting diodes (LEDs) using (oxy)nitride phosphors. J. Phys. D Appl. Phys. 2008, 41, 144013–144018. [Google Scholar] [CrossRef]
  4. Lin, C.C.; Zheng, Y.S.; Chen, H.Y.; Ruan, C.H.; Xiao, G.W.; Liu, R.S. Improving optical properties of white LED fabricated by a blue LED chip with yellow/red phosphors. J. Electrochem. Soc. 2010, 157, H900–H903. [Google Scholar] [CrossRef]
  5. Chung, S.L.; Huang, S.C.; Chou, W.C.; Tangguh, W. Phosphors based on nitridosilicates: Synthesis methods and luminescent properties. Curr. Opin. Chem. Eng. 2014, 3, 62–67. [Google Scholar] [CrossRef]
  6. Li, Y.Q.; van Steen, J.E.J.; van Krevel, J.W.H.; Botty, G.; Delsing, A.C.A.; DiSalvo, F.J.; de With, G.; Hintzen, H.T. Luminescence properties of red-emitting M2Si5N8:Eu2+ (M = Ca, Sr, Ba) LED conversion phosphors. J. Alloy. Compd. 2006, 417, 273–279. [Google Scholar] [CrossRef]
  7. Piao, X.; Horikawa, T.; Hanzawa, H.; Machida, K.I. Photoluminescence properties of Ca2Si5N8:Eu2+ nitride phosphor prepared by carbothermal reduction and nitridation method. Chem. Lett. 2006, 35, 334–335. [Google Scholar] [CrossRef]
  8. Watanabe, H.; Yamane, H.; Kijima, N. Crystal structure and luminescence of Sr0.99Eu0.01AlSiN3. J. Solid State Chem. 2008, 181, 1848–1852. [Google Scholar] [CrossRef]
  9. Merzhanov, A.G.; Borovinskaya, I.P. A new class of combustion processes. Combust. Sci. Technol. 1975, 10, 195–201. [Google Scholar] [CrossRef]
  10. Chung, S.L.; Huang, S.C. Combustion synthesis and photoluminescence properties of red-emitting CaAlSiN3:Eu2+ phosphor for white-LEDs. Materials 2014, 7, 7828–7842. [Google Scholar] [CrossRef]
  11. Suehiro, T.; Xie, R.J.; Hirosaki, N. Gas-reduction-nitridation synthesis of CaAlSiN3:Eu2+ fine powder phosphors for solid-state lighting. Ind. Eng. Chem. Res. 2014, 53, 2713–2717. [Google Scholar] [CrossRef]
  12. Li, J.W.; Watanabe, T.; Sakamoto, N.; Wada, H.; Setoyama, T.; Yoshimura, M. Synthesis of a multinary nitride, Eu-doped CaAlSiN3, from alloy at low temperatures. Chem. Mater. 2008, 20, 2095–2105. [Google Scholar] [CrossRef]
  13. Yin, L.J.; Zhu, Q.Q.; Yu, W.; Hao, L.Y.; Xu, X.; Hu, F.C.; Lee, M.H. Europium location in the AlN:Eu green phosphor prepared by a gas-reduction-nitridation route. J. Appl. Phys. 2012, 111. [Google Scholar] [CrossRef]
  14. Yin, L.J.; Xu, X.; Yu, W.; Yang, J.G.; Yang, L.X.; Yang, X.F.; Hao, L.Y.; Liu, X.J. Synthesis of Eu2+-doped AlN phosphors by carbothermal reduction. J. Am. Ceram. Soc. 2010, 93, 1702–1707. [Google Scholar] [CrossRef]
  15. Inoue, K.; Hirosaki, N.; Xie, R.J.; Takeda, T. Highly efficient and thermally stable blue-emitting AlN:Eu2+ phosphor for ultraviolet white light-emitting diodes. J. Phys. Chem. C 2009, 113, 9392–9397. [Google Scholar] [CrossRef]
  16. Li, H.L.; Hirosaki, N.; Xie, R.J.; Suehiro, T.; Mitomo, M. Fine yellow α-SiAlON:Eu phosphors for white LEDs prepared by the gas-reduction-nitridation method. Sci. Technol. Adv. Mater. 2007, 8, 601–606. [Google Scholar] [CrossRef]
  17. Liu, L.; Zhou, X.; Xie, R.J.; Huang, Q. Facile synthesis of Ca-α-SiAlON:Eu2+ phosphor by the microwave sintering method and its photoluminescence properties. Chin. Sci. Bull. 2012, 58, 708–712. [Google Scholar] [CrossRef]
  18. Ge, Y.Y.; Chen, Y.; Wang, Q.; Cui, W.; Zou, Y.F.; Xie, Z.P.; Yuan, X.Y.; Chen, K.X. Effect of NH4Cl additive on combustion synthesis of Eu-doped Ca-α-SiAlON phosphors. J. Alloys Compd. 2016, 654, 404–409. [Google Scholar] [CrossRef]
  19. Li, G.H.; Chen, J.J.; Mao, Z.Y.; Song, W.W.; Sun, T.; Wang, D.J. Carbothermal synthesis of CaAlSiN3:Eu2+ red-emitting phosphors and the photoluminescent properties. J Mater Sci Mater Electron. 2015, 26, 10201–10206. [Google Scholar] [CrossRef]
  20. Xie, R.J.; Mitomo, M.; Xu, F.F.; Uheda, K.; Bando, Y. Preparation of Ca-α-sialon ceramics with compositions along the Si3N4–1/2 Ca3N2:3AlN line. Z. Metallkd. 2001, 92, 931–936. [Google Scholar]
  21. Cai, J.J.; Pan, H.H.; Wang, Y. Luminescence properties of red-emitting Ca2Al2SiO7:Eu3+ nanoparticles prepared by sol-gel method. Rare Met. 2011, 30, 374–380. [Google Scholar] [CrossRef]
  22. Li, Y.Q.; Hirosaki, N.; Xie, R.J.; Takeda, T.; Mitomo, M. Yellow-orange-emitting CaAlSiN3:Ce3+ phosphor: Structure, photoluminescence, and application in white LEDs. Chem. Mater. 2008, 20, 6704–6714. [Google Scholar] [CrossRef]
  23. Dierre, B.; Takeda, T.; Sekiguchi, T.; Suehiro, T.; Takahashi, K.; Yamamoto, Y.; Xie, R.J.; Hirosaki, N. Local analysis of Eu2+ emission in CaAlSiN3. Sci. Technol. Adv. Mater. 2013, 14. [Google Scholar] [CrossRef]
  24. Wang, Y.; Zhao, F.Y.; Piao, X.Q.; Sun, Z.; Horikawa, T.; Machida, K.I. Synthesis and photoluminescence properties of divalent europium doped-CaAlSi1+2xN3+2xOx (x = 0–1) solid solution phosphors. ECS J. Solid State Sci. Technol. 2013, 2, R131–R134. [Google Scholar] [CrossRef]
  25. Li, S.X.; Liu, X.J.; Liu, J.Q.; Li, H.L.; Mao, R.H.; Huang, Z.R.; Xie, R.J. Synthesis, composition optimization, and tunable red emission of CaAlSiN3:Eu2+ phosphors for white light-emitting diodes. J. Mater. Res. 2015, 30, 2919–2927. [Google Scholar] [CrossRef]
  26. Dexter, D.L. A theory of sensitized luminescence in solids. J. Chem. Phys. 1953, 21, 836–850. [Google Scholar] [CrossRef]
  27. Yang, J.J.; Wang, T.; Chen, D.C.; Chen, G.D.; Liu, Q.L. An investigation of Eu2+-doped CaAlSiN3 fabricated by an alloy-nitridation method. Mater. Sci. Eng. B 2012, 177, 1596–1604. [Google Scholar] [CrossRef]
  28. Chung, S.L.; Chou, W.C. Combustion synthesis of Ca2Si5N8:Eu2+ phosphors and their luminescent properties. J. Am. Ceram. Soc. 2013, 96, 2086–2092. [Google Scholar] [CrossRef]
  29. Li, J.W.; Watanabe, T.; Wada, H.; Setoyama, T.; Yoshimura, M. Low-temperature crystallization of Eu-doped red-emitting CaAlSiN3 from alloy-derived ammonometallates. Chem. Mater. 2007, 19, 3592–3594. [Google Scholar] [CrossRef]
  30. Xie, R.J.; Hirosaki, N.; Suehiro, T.; Xu, F.F.; Mamoru, M. A simple, efficient synthetic route to Sr2Si5N8:Eu2+-based red phosphors for white light-emitting diodes. Chem. Mater. 2006, 18, 5578–5583. [Google Scholar] [CrossRef]
  31. Uheda, K.; Hirosaki, N.; Yamamoto, Y.; Naito, A.; Nakajima, T.; Yamamotoa, H. Luminescence properties of a red phosphor, CaAlSiN3:Eu2+, for white light-emitting diodes. Electrochem. Solid State Lett. 2006, 9, H22–H25. [Google Scholar] [CrossRef]
  32. Xie, R.J.; Mitomo, M.; Uheda, K.; Xu, F.F.; Akimune, Y. Preparation and luminescence spectra of calcium- and rare-earth (R = Eu,Tb, and Pr)-codoped α-SiAlON ceramics. J. Am. Ceram. Soc. 2002, 85, 1229–1234. [Google Scholar] [CrossRef]
  33. Xie, R.J.; Hirosaki, N. Silicon-based oxynitride and nitride phosphors for white LEDs—A review. Sci. Technol. Adv. Mater. 2007, 8, 588–600. [Google Scholar] [CrossRef]
  34. Zeuner, M.; Pagano, S.; Schnick, W. Nitridosilicates and oxonitridosilicates: From ceramic materials to structural and functional diversity. Angew. Chem. Int. Ed. Engl. 2011, 50, 7754–7775. [Google Scholar] [CrossRef] [PubMed]
  35. Lin, C.N.; Chung, S.L. Combustion synthesis method for synthesis of aluminum nitride powder using aluminum containers. J. Mater. Res. 2001, 16, 3518–3525. [Google Scholar] [CrossRef]
  36. Lin, C.N.; Chung, S.L. Combustion synthesis method for synthesis of aluminum nitride powder using aluminum containers (II). J. Mater. Res. 2004, 19, 3037–3045. [Google Scholar] [CrossRef]
Figure 1. XRD patterns of the as-synthesized products obtained with Y = 0.25 (a); 0.75 (b); 1.00 (c); 1.38 (d); 1.50 (e); and 1.68 (f); and a product obtained with Y = 1.50 after acid washing (g).
Materials 09 00178 g001
Figure 2. Volume Percentages of AlN, CaAlSiN3 and Ca-α-SiAlON phases formed during synthesis with various Ca contents.
Materials 09 00178 g002
Figure 3. (a) TEM image and corresponding element mapping of Al, N, and Eu; (b) HRTEM image; (c) SAED pattern; and (d) element analysis of a plate-like particle (showing it to be AlN:Eu2+) in a product synthesized with Ca:Al:Si:Si3N4:Eu2O3:NaN3:NH4Cl = 0.25:1.0:0.25:0.25:0.02:3.5:0.6.
Materials 09 00178 g003
Figure 4. (a) TEM image; (b) HRTEM image; and (c) SAED pattern of a bar-like particle (showing it to be Ca-α-SiAlON:Eu2+) in a product synthesized with Ca:Al:Si:Si3N4:Eu2O3:NaN3:NH4Cl = 0.25:1.0:0.25:0.25:0.02:3.5:0.6.
Materials 09 00178 g004
Figure 5. (a) TEM image; (b) HRTEM image; and (c) SAED pattern of a plate-like particle (showing it to be Ca-α-SiAlON:Eu2+) in a product synthesized with Ca:Al:Si:Si3N4:Eu2O3:NaN3:NH4Cl = 0.25:1.0:0.25:0.25:0.02:3.5:0.6.
Materials 09 00178 g005
Figure 6. (a) TEM image; (b) HRTEM image; (c) SAED pattern; and (d) element analysis of a plate-like particle (showing it to be AlN) in a product synthesized with Ca:Al:Si:Si3N4:Eu2O3:NaN3:NH4Cl = 0.75:1.0:0.25:0.25:0.02:3.5:0.6.
Materials 09 00178 g006
Figure 7. (a) TEM image and corresponding element mapping of Ca, Al, Si, N, and Eu; (b) HRTEM image; (c) SAED pattern; and (d) element analysis of a bar-like particle (showing it to be CaAlSiN3:Eu2+) in a product synthesized with Ca:Al:Si:Si3N4:Eu2O3:NaN3:NH4Cl = 1.5:1.0:0.25:0.25:0.02:3.5:0.6.
Materials 09 00178 g007
Figure 8. (a) TEM image and corresponding element mapping of Ca, Al, Si, N, and Eu; (b) HRTEM image; (c) SAED pattern; and (d) element analysis of a plate-like particle (showing it to be CaAlSiN3:Eu2+) in a product synthesized with Ca:Al:Si:Si3N4:Eu2O3:NaN3:NH4Cl = 1.5:1.0:0.25:0.25:0.02:3.5:0.6.
Materials 09 00178 g008
Figure 9. SEM and TEM images, SAED patterns and element analysis of agglomerated fine particles synthesized with Ca:Al:Si:Si3N4:Eu2O3:NaN3:NH4Cl = 1.0:1.0:0.25:0.25:0.02:3.5:0.6. (a) SEM image of agglomerated fine particles; (b) TEM image, SAED pattern and element analysis of an agglomerated fine particle (showing it to be CaSiAlN3:Eu2+); (c) TEM image, SAED pattern and element analysis of an agglomerated fine particle (showing it to be CaO).
Materials 09 00178 g009
Figure 10. The emission ((a); (b); (c); (d); (e); and (f), excited by λ = 460 nm) and excitation ((g); (h); (i); (j); (k); and (l)) spectra of the phosphors synthesized with various Ca contents.
Materials 09 00178 g010
Figure 11. Emission spectra of the products synthesized with various Ca contents under excitation of λ = 300 and 460 nm.
Materials 09 00178 g011
Figure 12. Gaussian deconvolution of photoluminescence emission spectra (by excitation of λ = 460 nm) of the products synthesized with various Ca contents.
Materials 09 00178 g012
Table 1. ICP-OES (inductively coupled plasma optical emission spectrometry) analysis of cationic molar ratios of the products (synthesized with various Y) after grinding and washing with an acid (also shown are the reactant compositions).
Reactant CompositionCationic Molar Ratios of the Products
Ca (Y)AlSiEuCaAlSiEu
0.251.001.000.020.121.061.000.010
0.751.001.000.020.351.191.000.011
1.001.001.000.020.571.141.000.013
1.381.001.000.020.641.151.000.014
1.501.001.000.020.771.181.000.015
1.681.001.000.020.881.111.000.018
Table 2. SEM-EDS (scanning electron micrographs (SEM) together with energy-dispersed X-ray spectroscopy (EDS)) analysis of cationic molar ratios of the products (synthesized with various Y) after grinding and washing with an acid (also shown are the reactant compositions).
Reactant CompositionCationic Molar Ratios of the Products
Ca (Y)AlSiEuCaAlSiEu
0.251.001.000.020.260.681.000.004
0.751.001.000.020.390.731.000.006
1.001.001.000.020.600.711.000.007
1.381.001.000.020.830.811.000.013
1.501.001.000.020.860.871.000.013
1.681.001.000.020.880.901.000.011
Table 3. Characteristics of the Reagents Used in this Study.
ReagentParticle Size (um)Purity (%)Source
Si1–599Alfa Aesar
(Ward Hill, MA, USA)
Ca<96399.5Alfa Aesar
(Heysham, England)
Eu2O33.099.999Baogang Group
(Baotou, China)
NaN3d50 ≈ 15099Johnson Matthey
(Tokyo, Japan)
NH4Cl-99Panreac
(Barcelona, Spain)
Ald50 ≈ 399First Chemical Work
(Taipei, Taiwan)
α-Si3N4d50 ≈ 1099.999Seminc Company
(Ward Hill, MA, USA)
Mgd50 ≈ 2099Nihon Shiyaku
(Osaka, Japan)
Fe3O410299Nihon Shiyaku
(Osaka, Japan)
N2Gas99Yun Shan
(Tainan, Taiwan)

