
ZnO-Layered Double Hydroxide@Graphitic Carbon Nitride Composite for Consecutive Adsorption and Photodegradation of Dyes under UV and Visible Lights


Abstract
:1. Introduction
2. Experimental Details
2.1. Materials
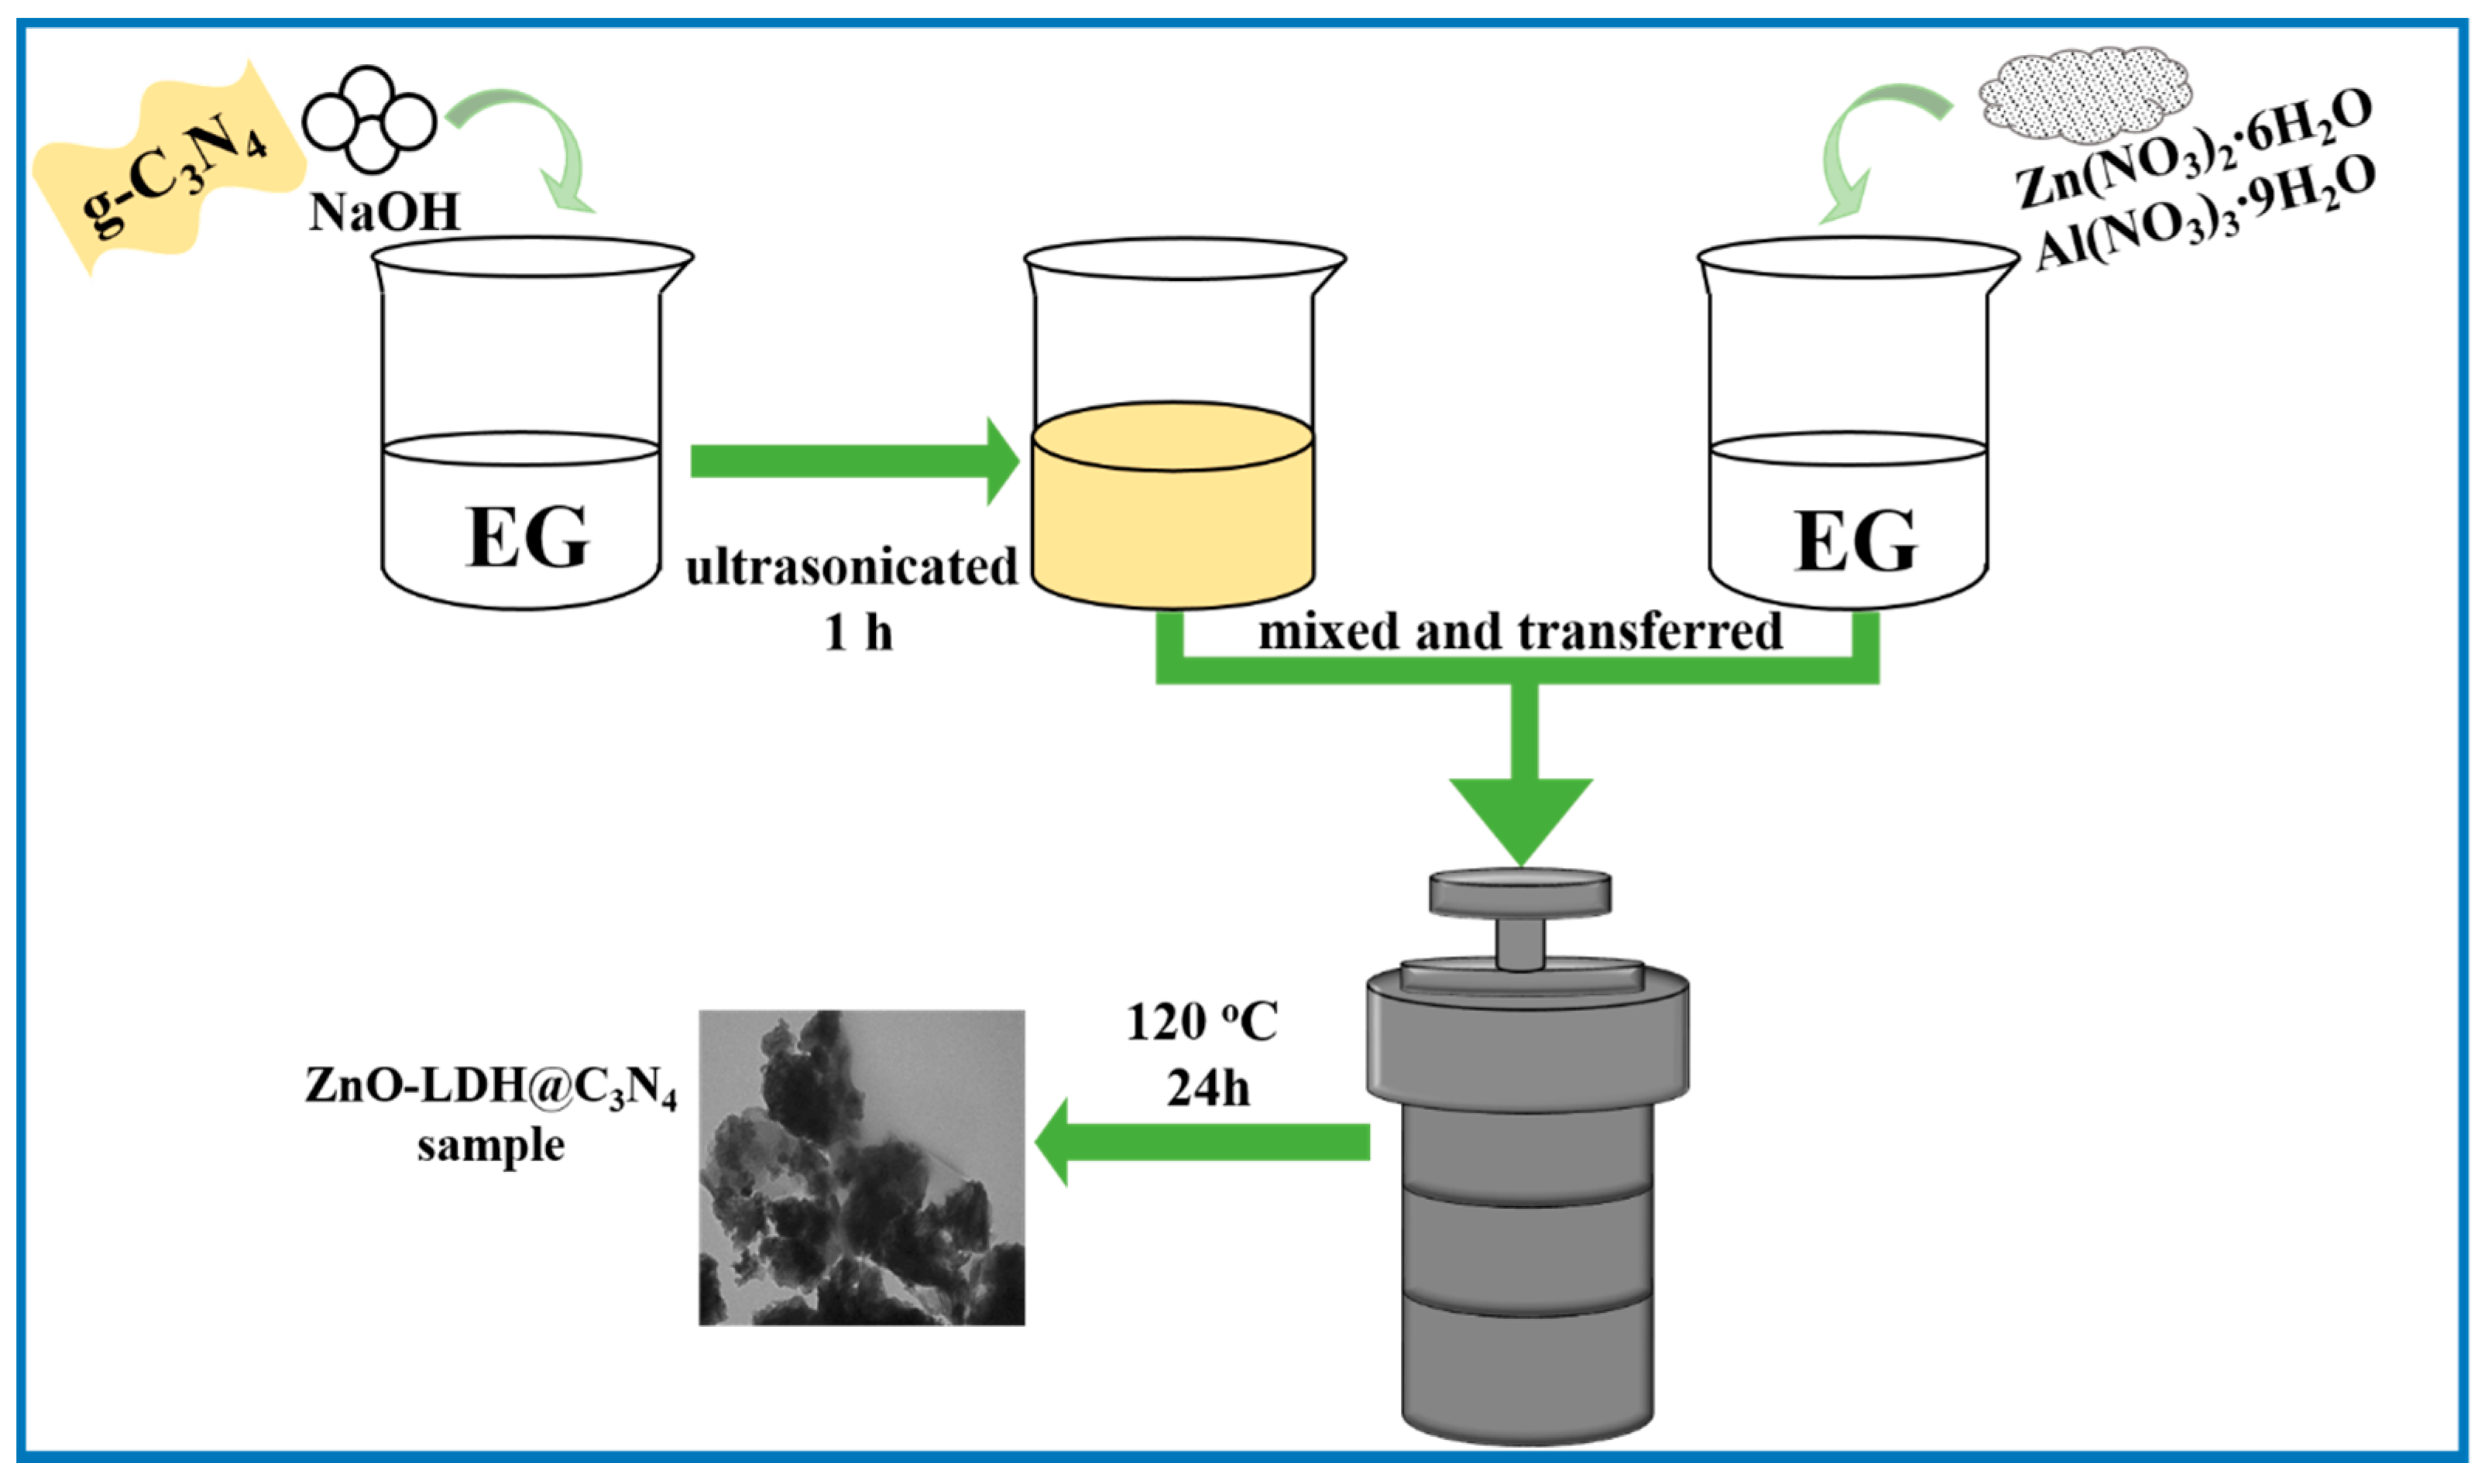
2.2. Preparation of ZnO-LDH@C3N4 Composite
2.2.1. Synthesis of g-C3N4 Nanosheets
2.2.2. Preparation of ZnO-LDH@C3N4 Composite
2.2.3. Synthesis of ZnO-LDH
2.3. Characterization
2.4. Adsorption Measurements
2.5. Photocatalytic Degradation Test of Cationic Dye Methylene Blue (MB)
2.6. Intermediate Species of Photocatalytic Degradation
3. Results and Discussion
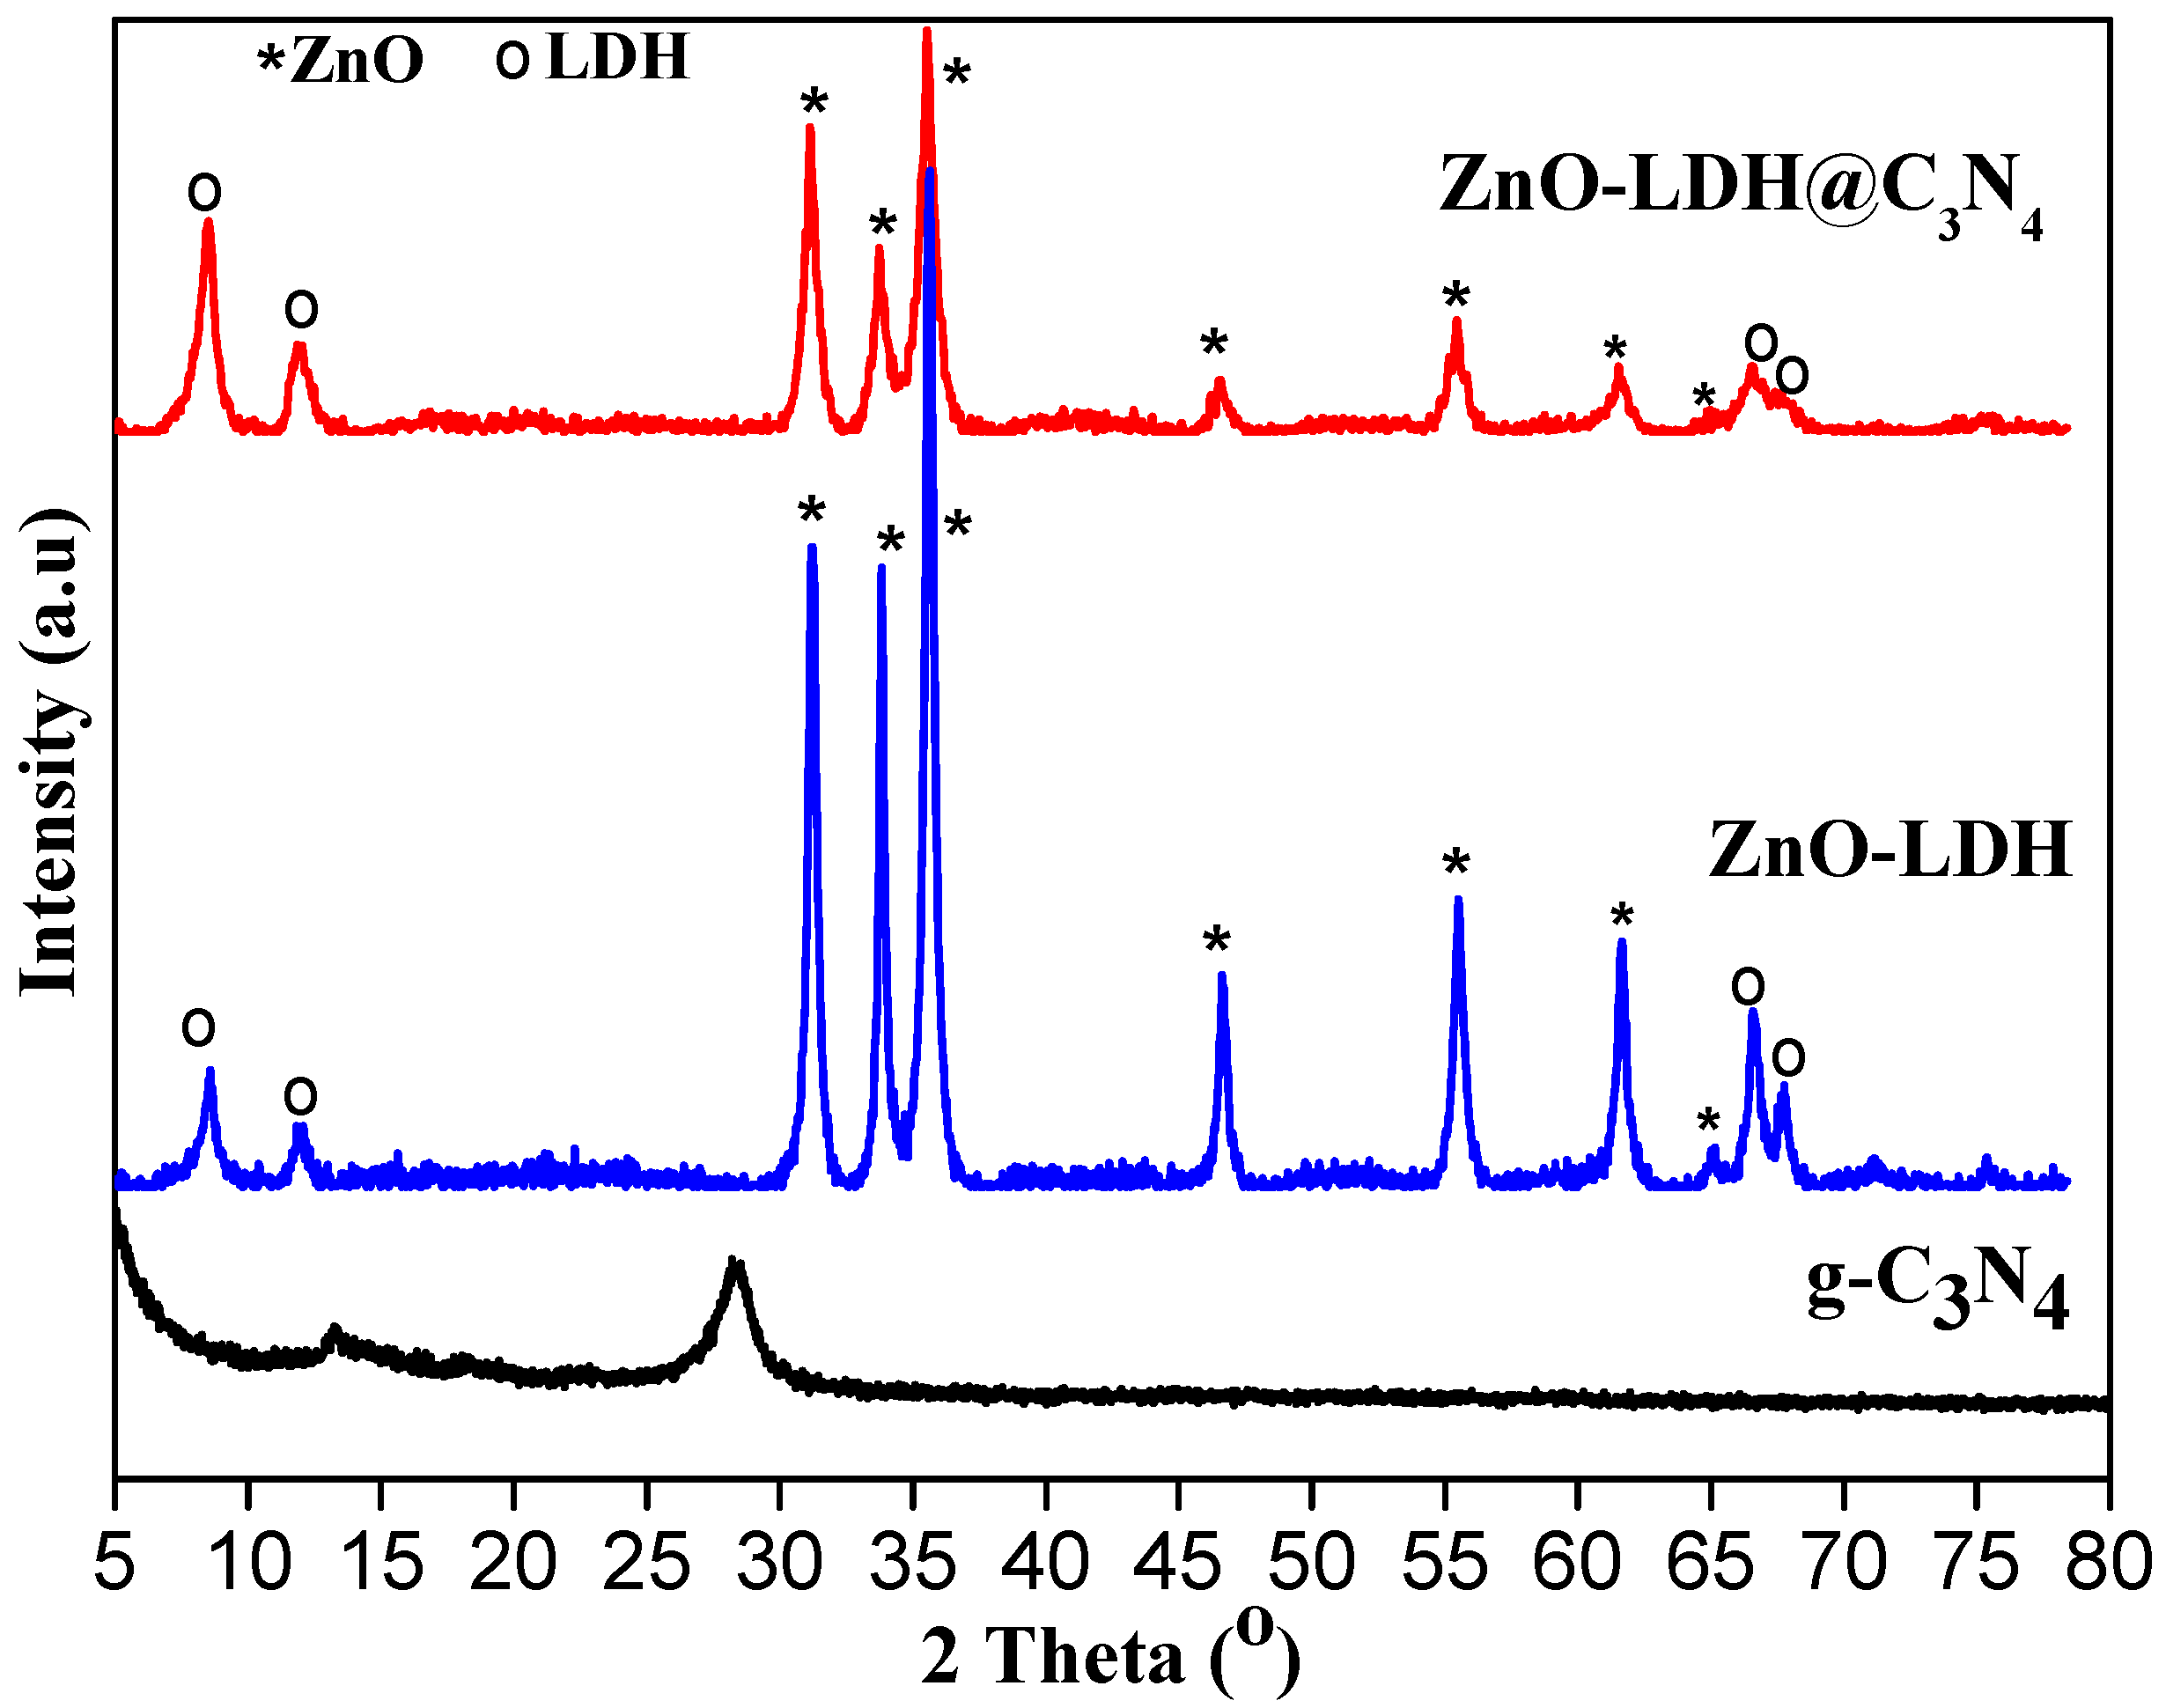
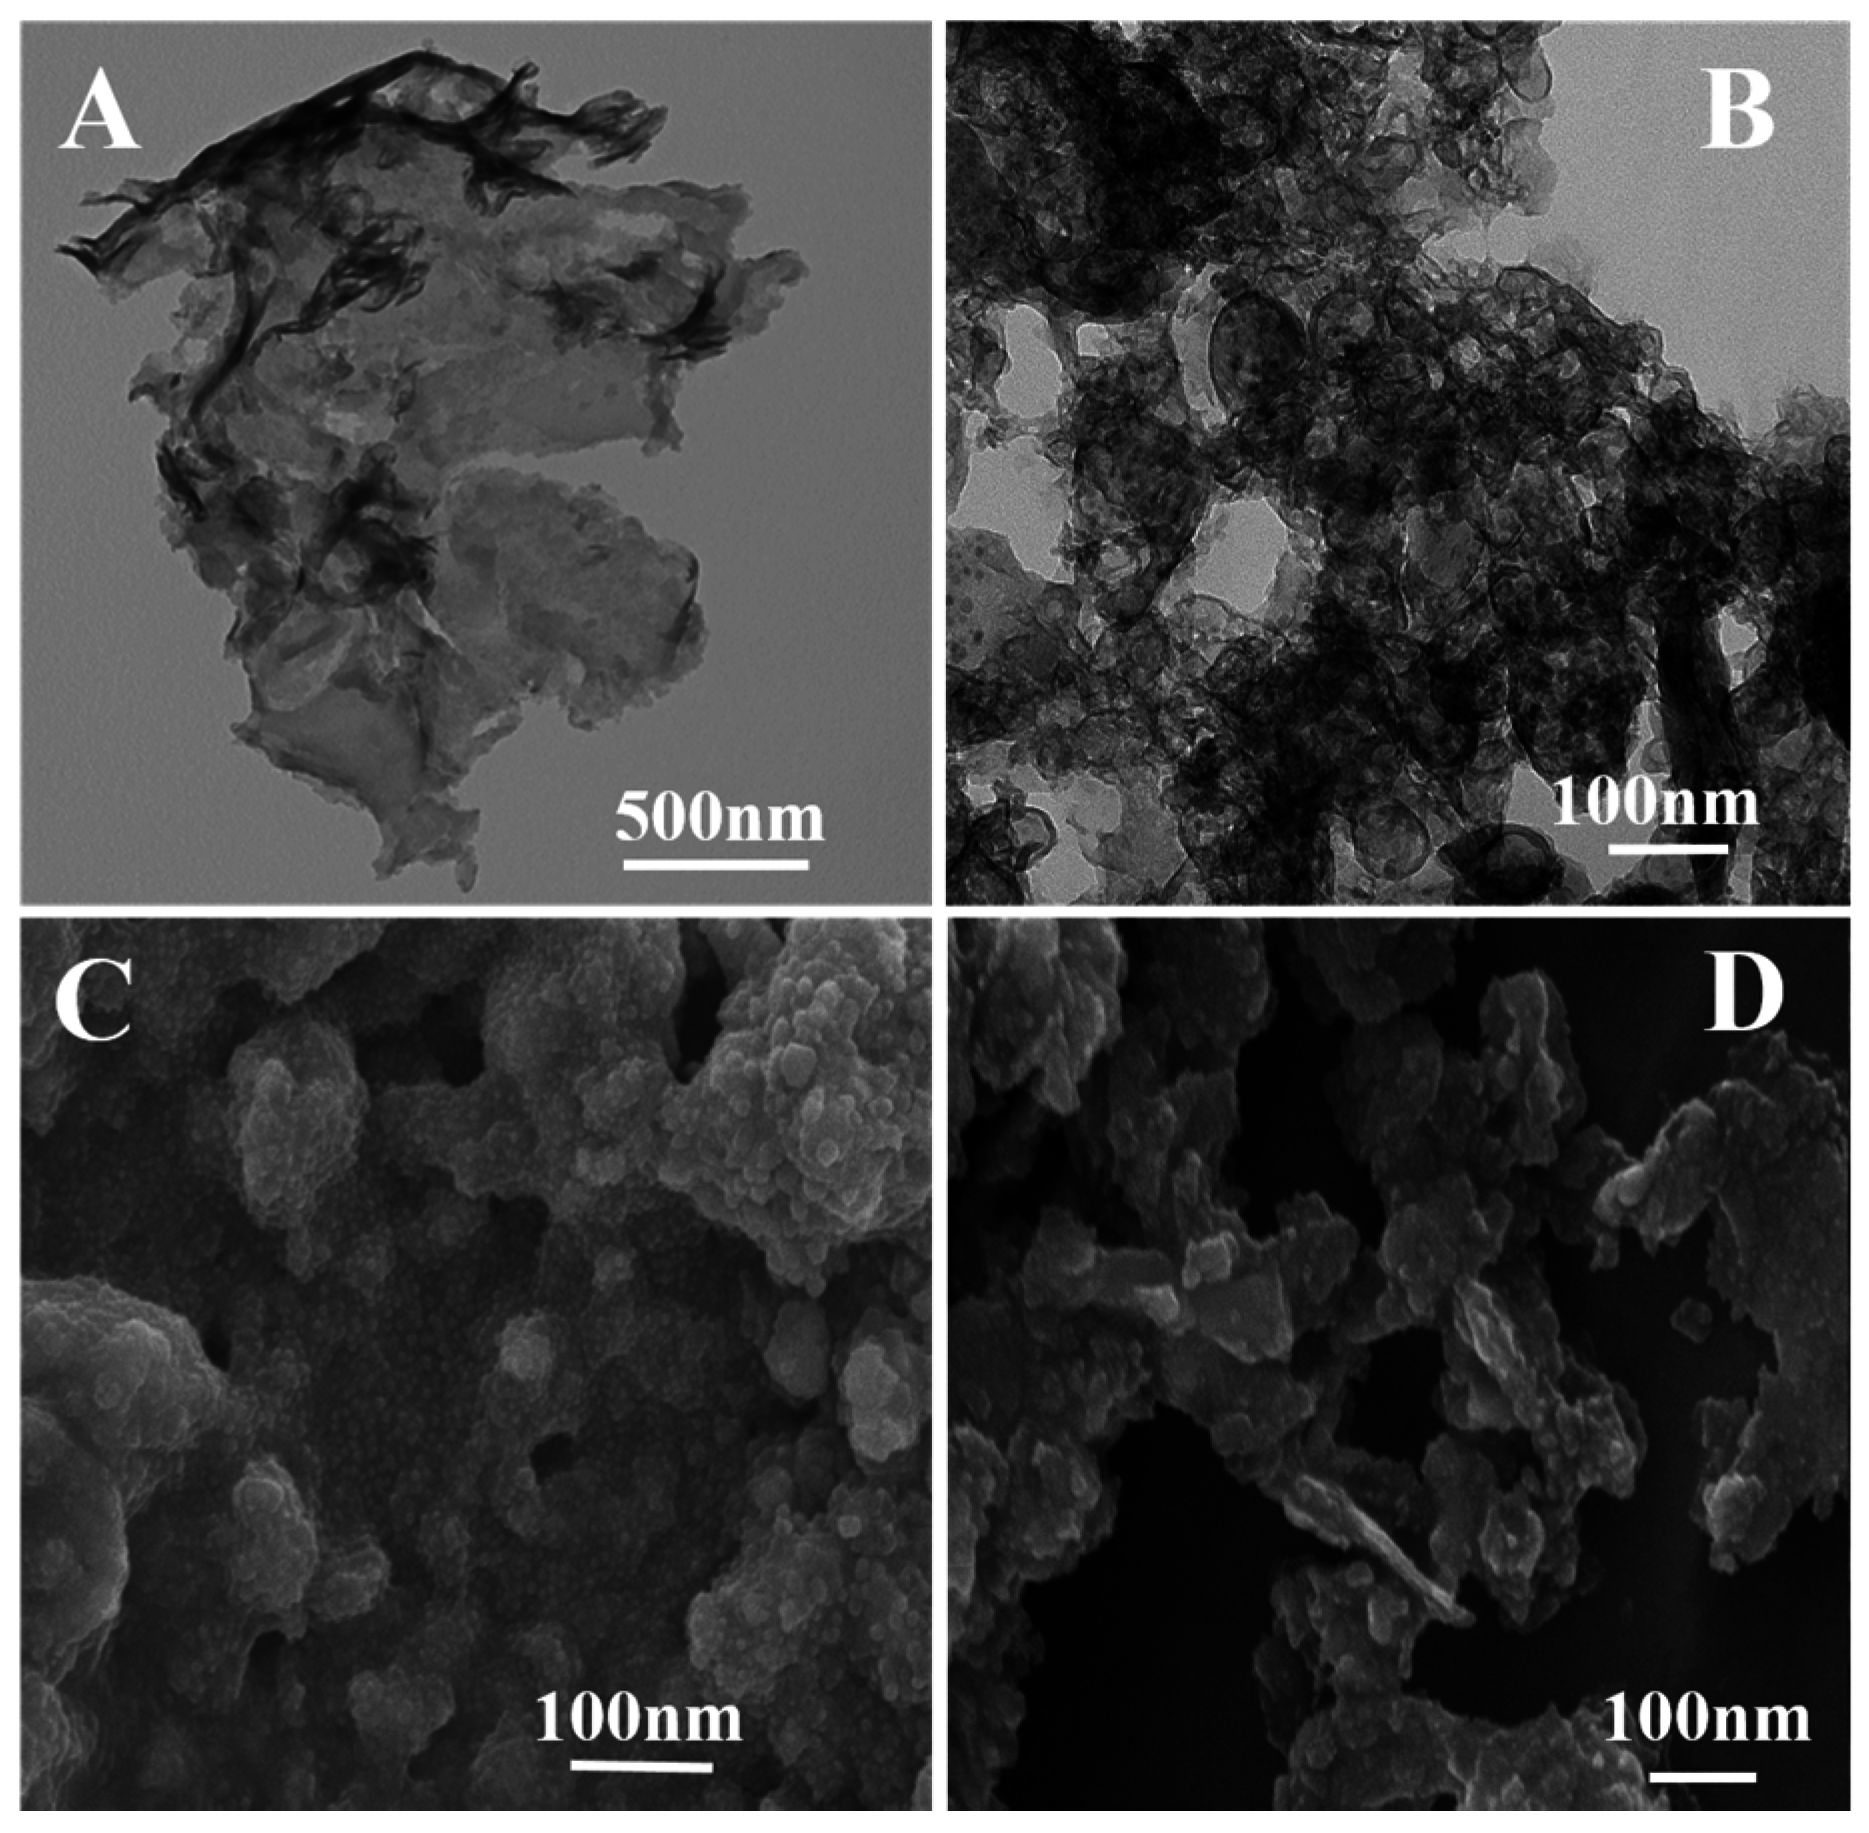
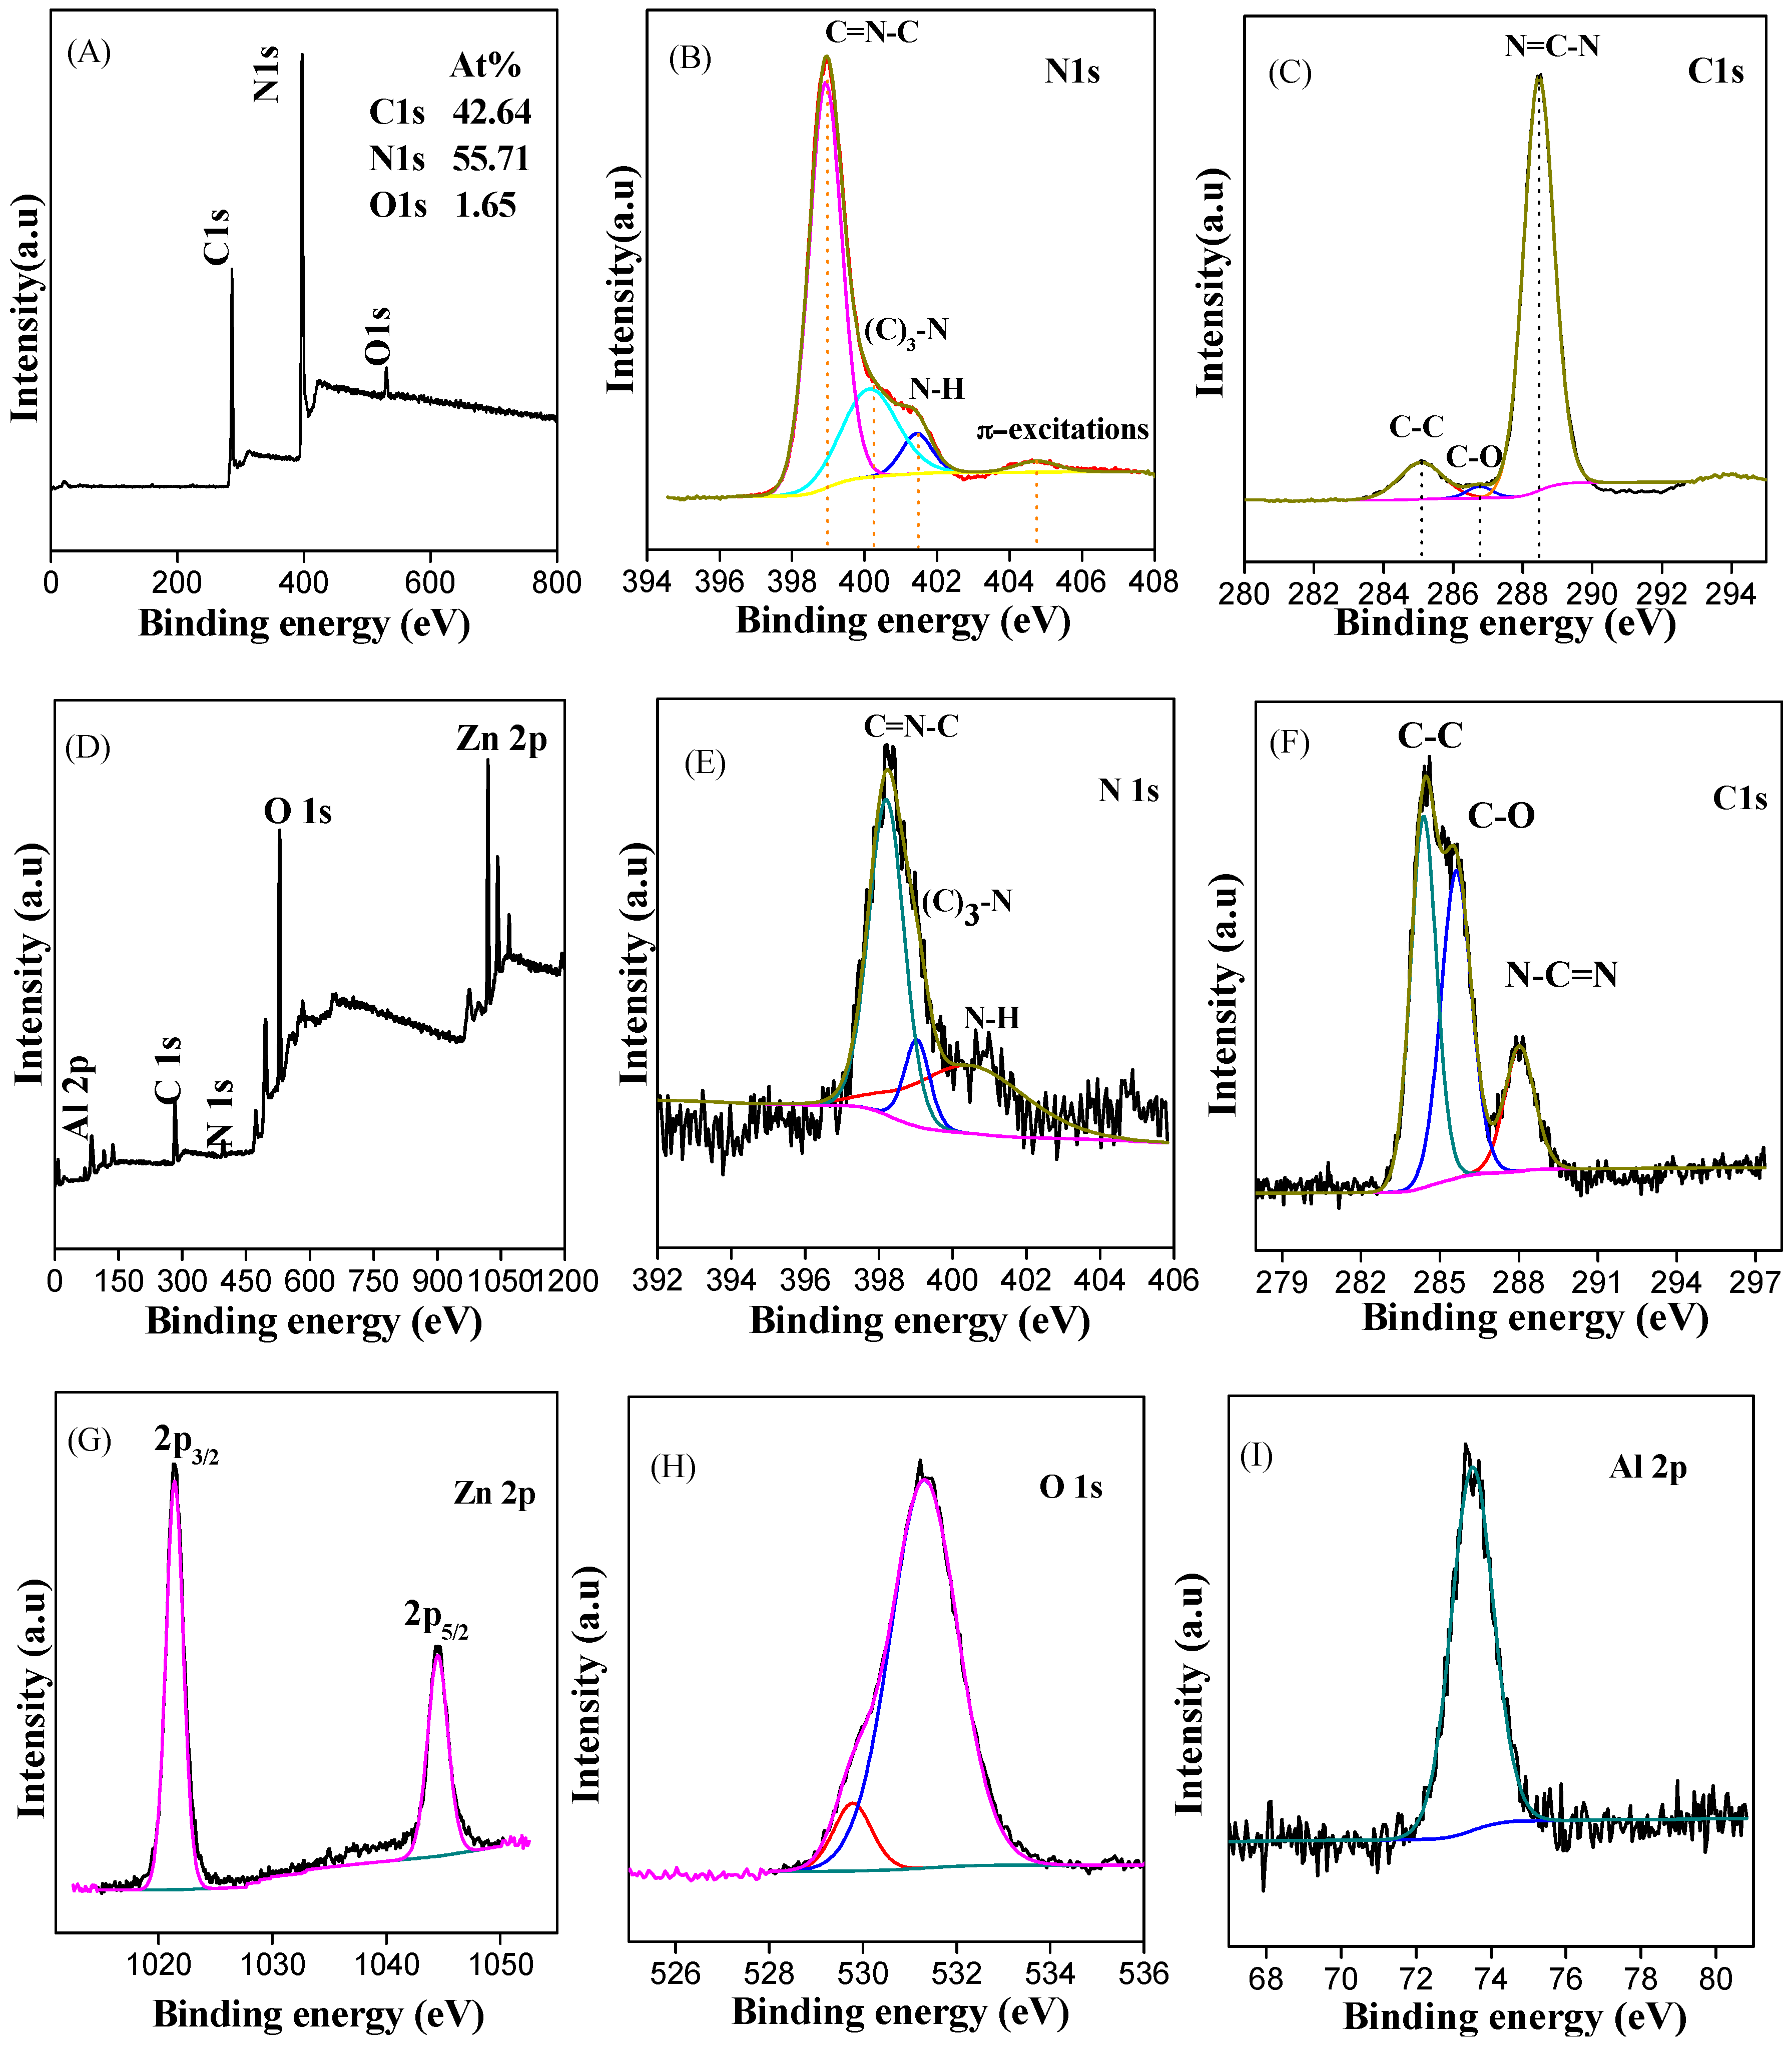
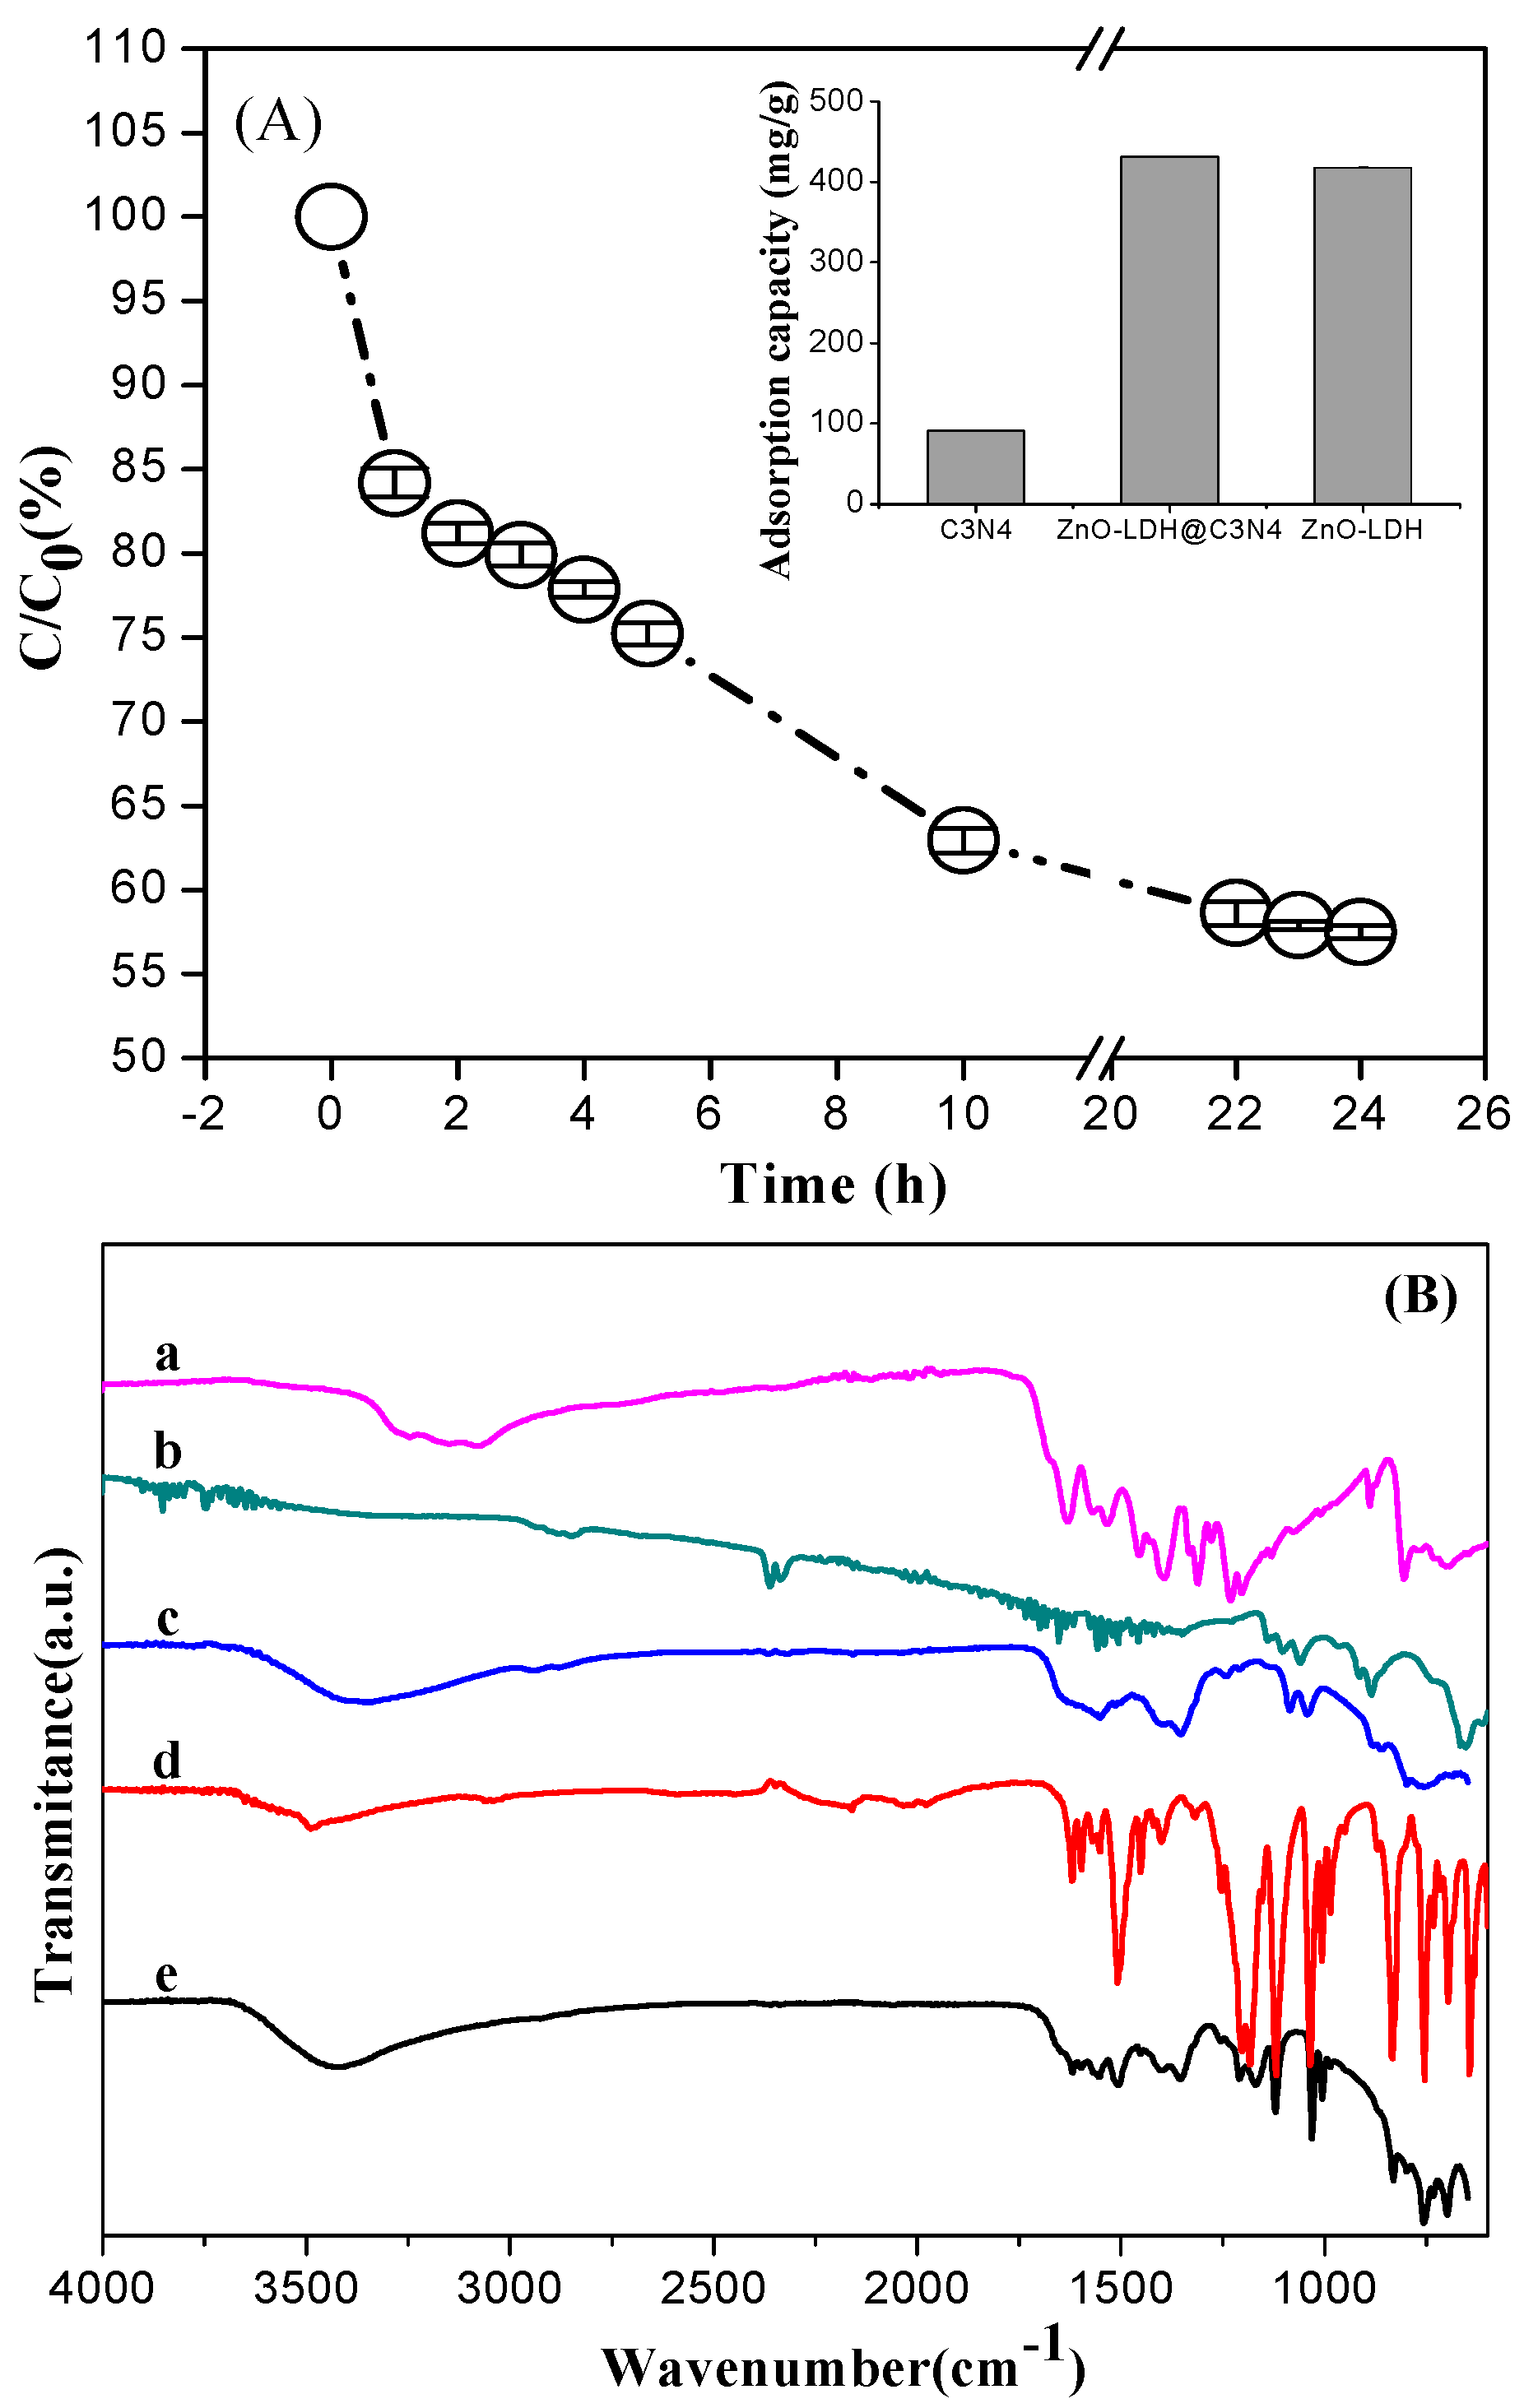
3.1. Characterization of Samples
3.2. Adsorption Capacity and Photocatalytic Activity of ZnO-LDH@C3N4 Composite
3.2.1. Adsorption Performance on Anionic Dye OrgII
3.2.2. Adsorption Performance on Cationic Dye MB
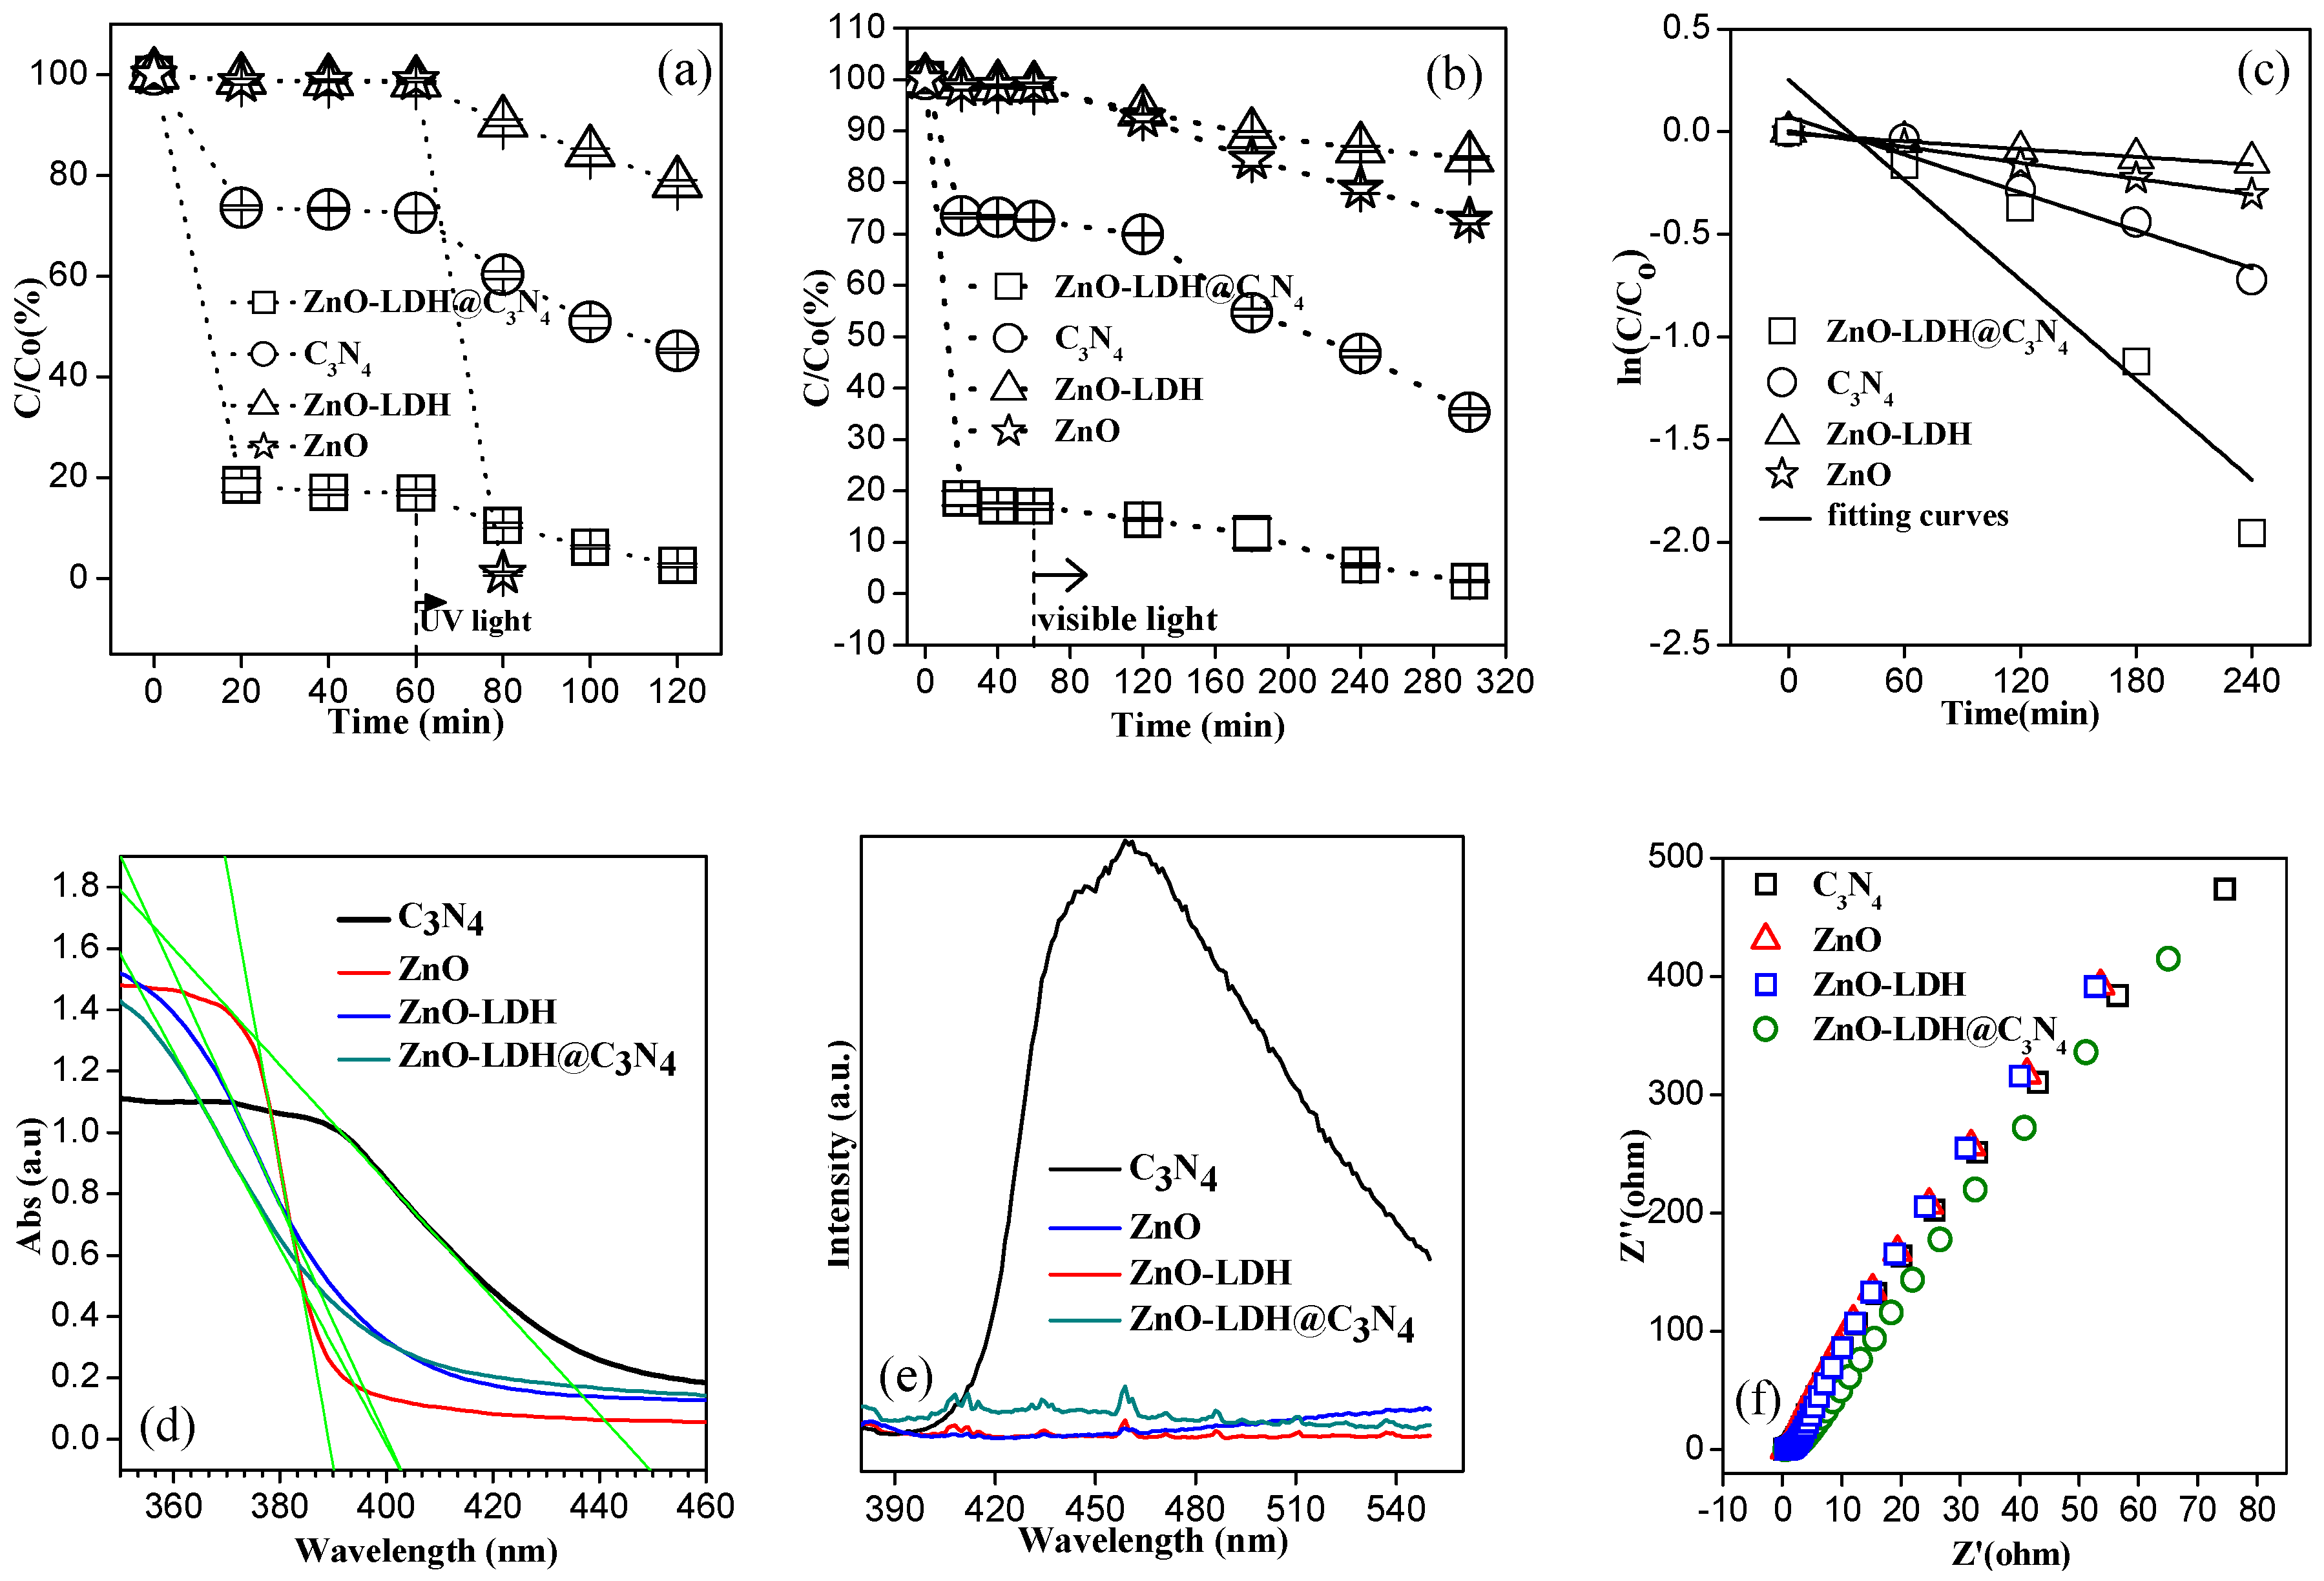
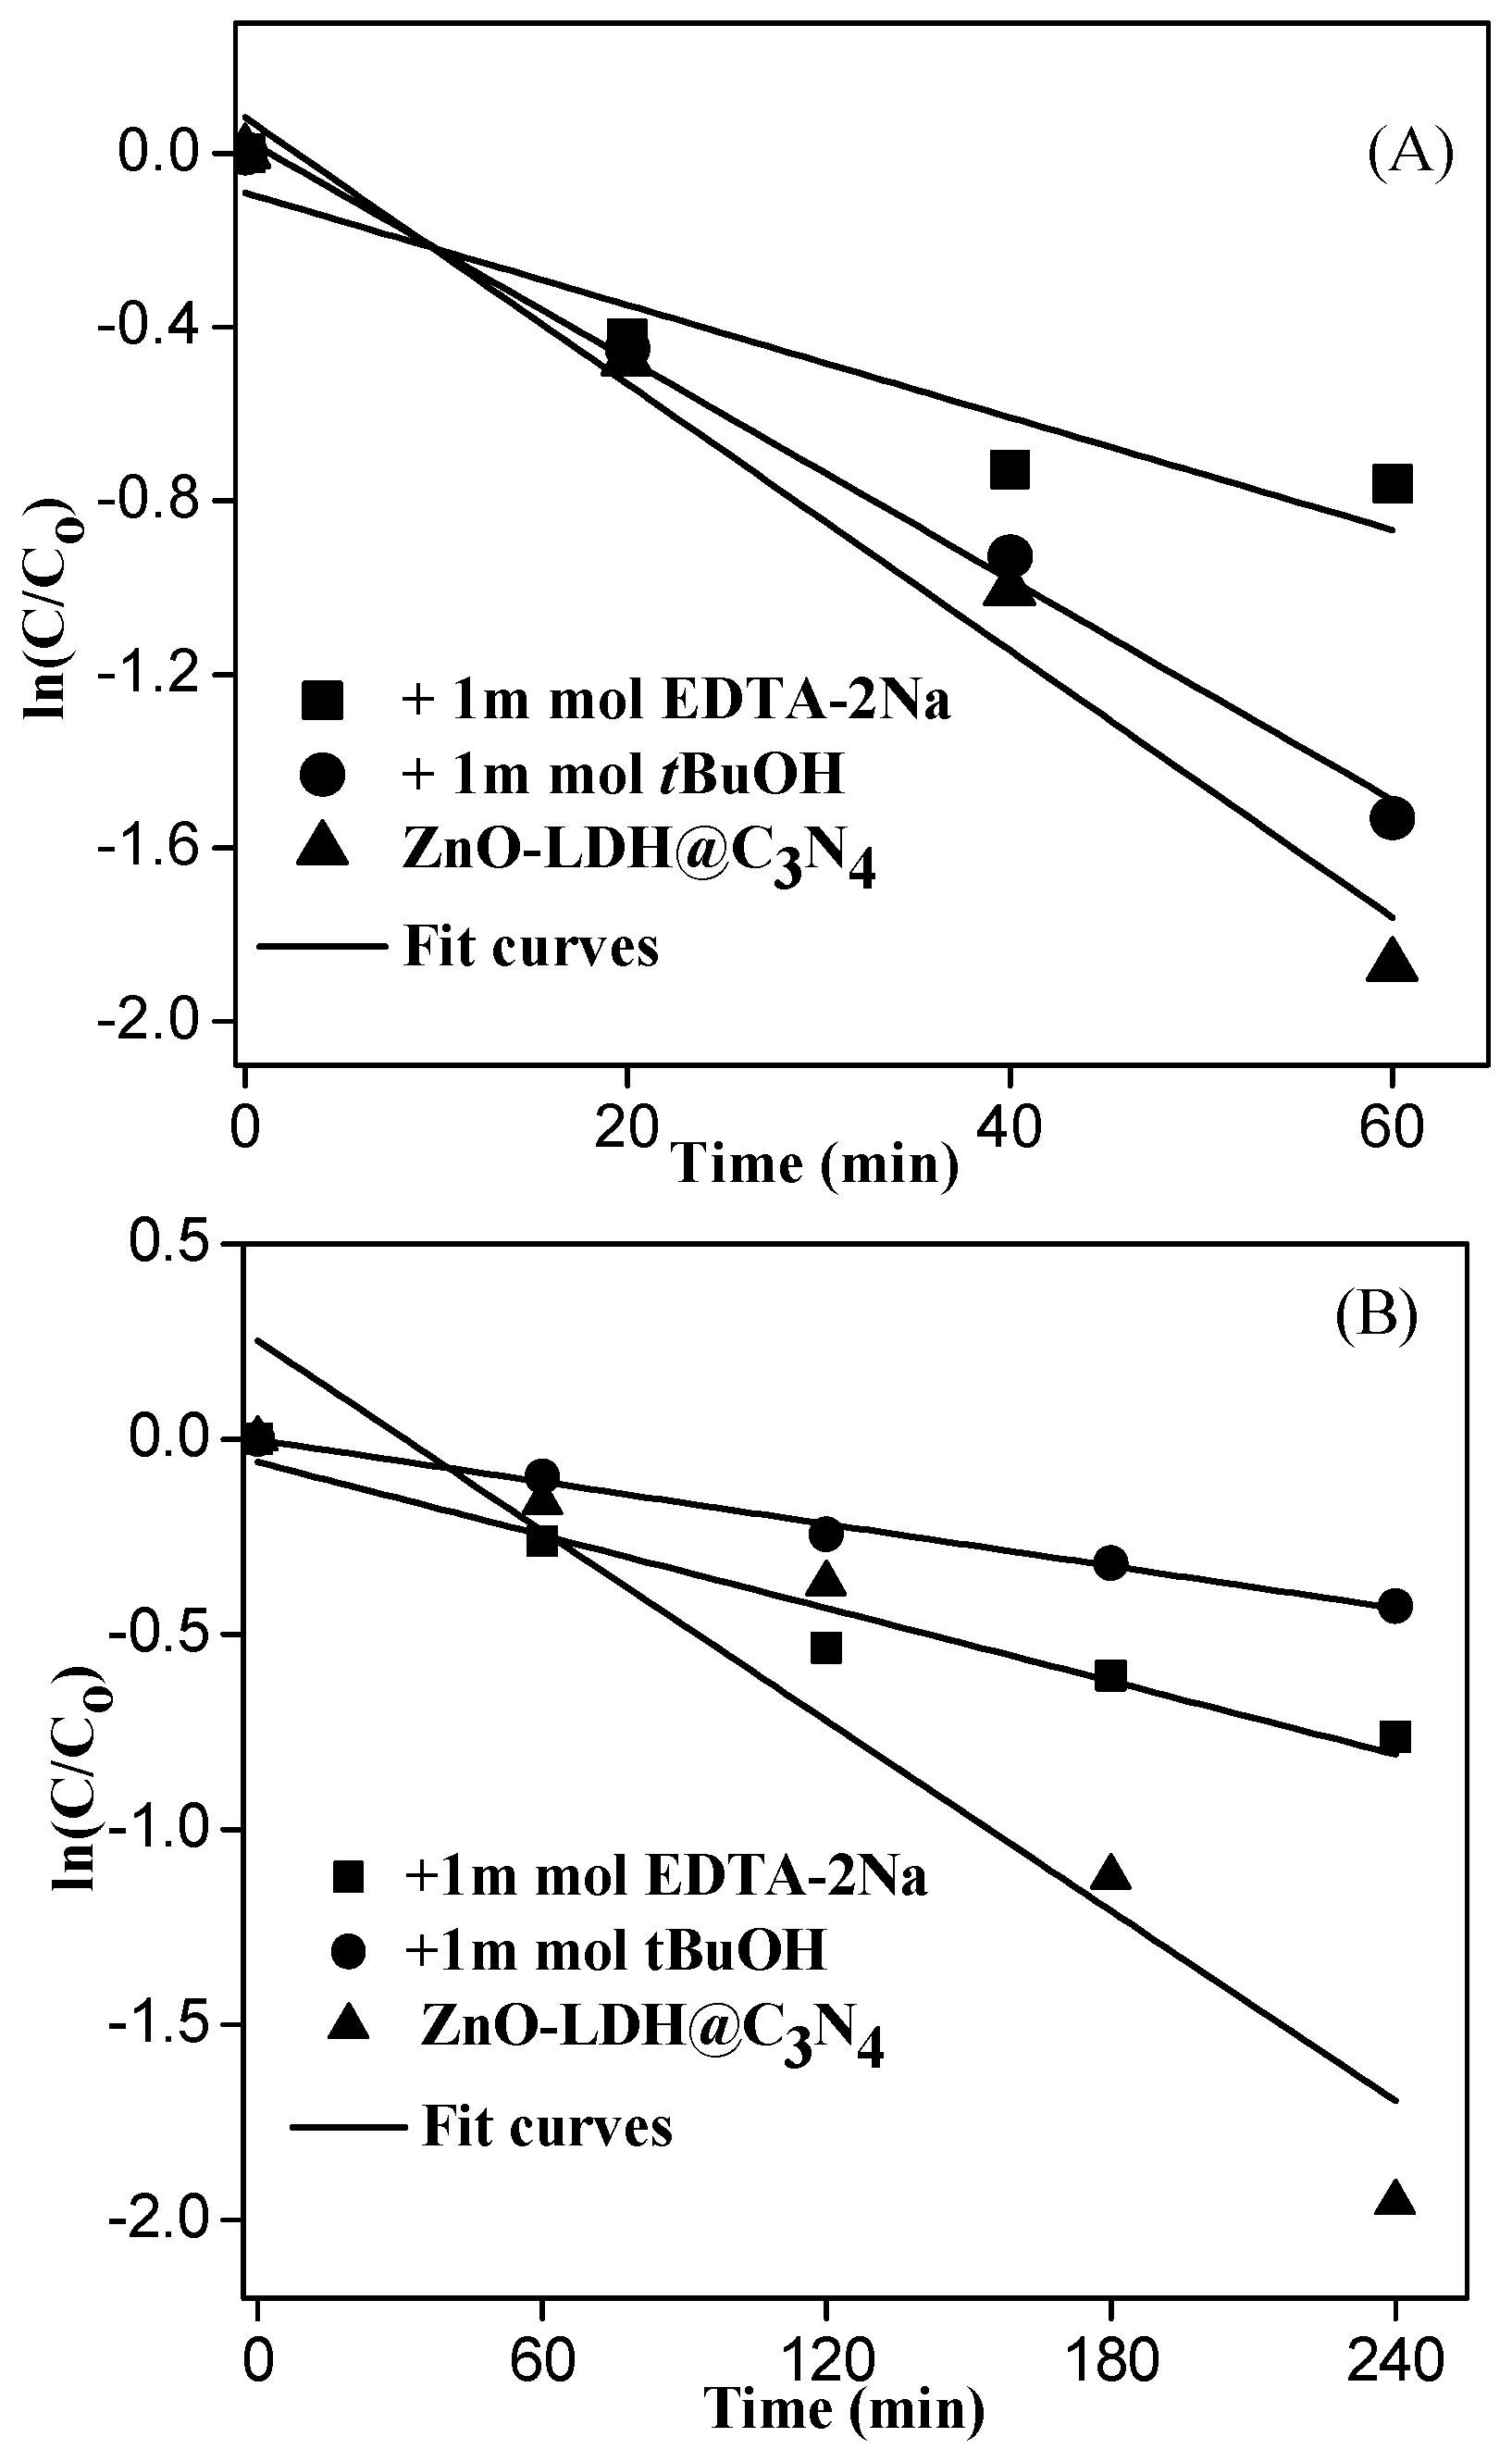
3.3. Photocatalytic Degradation Performance on MB of ZnO-LDH@C3N4 under UV and Visible Light
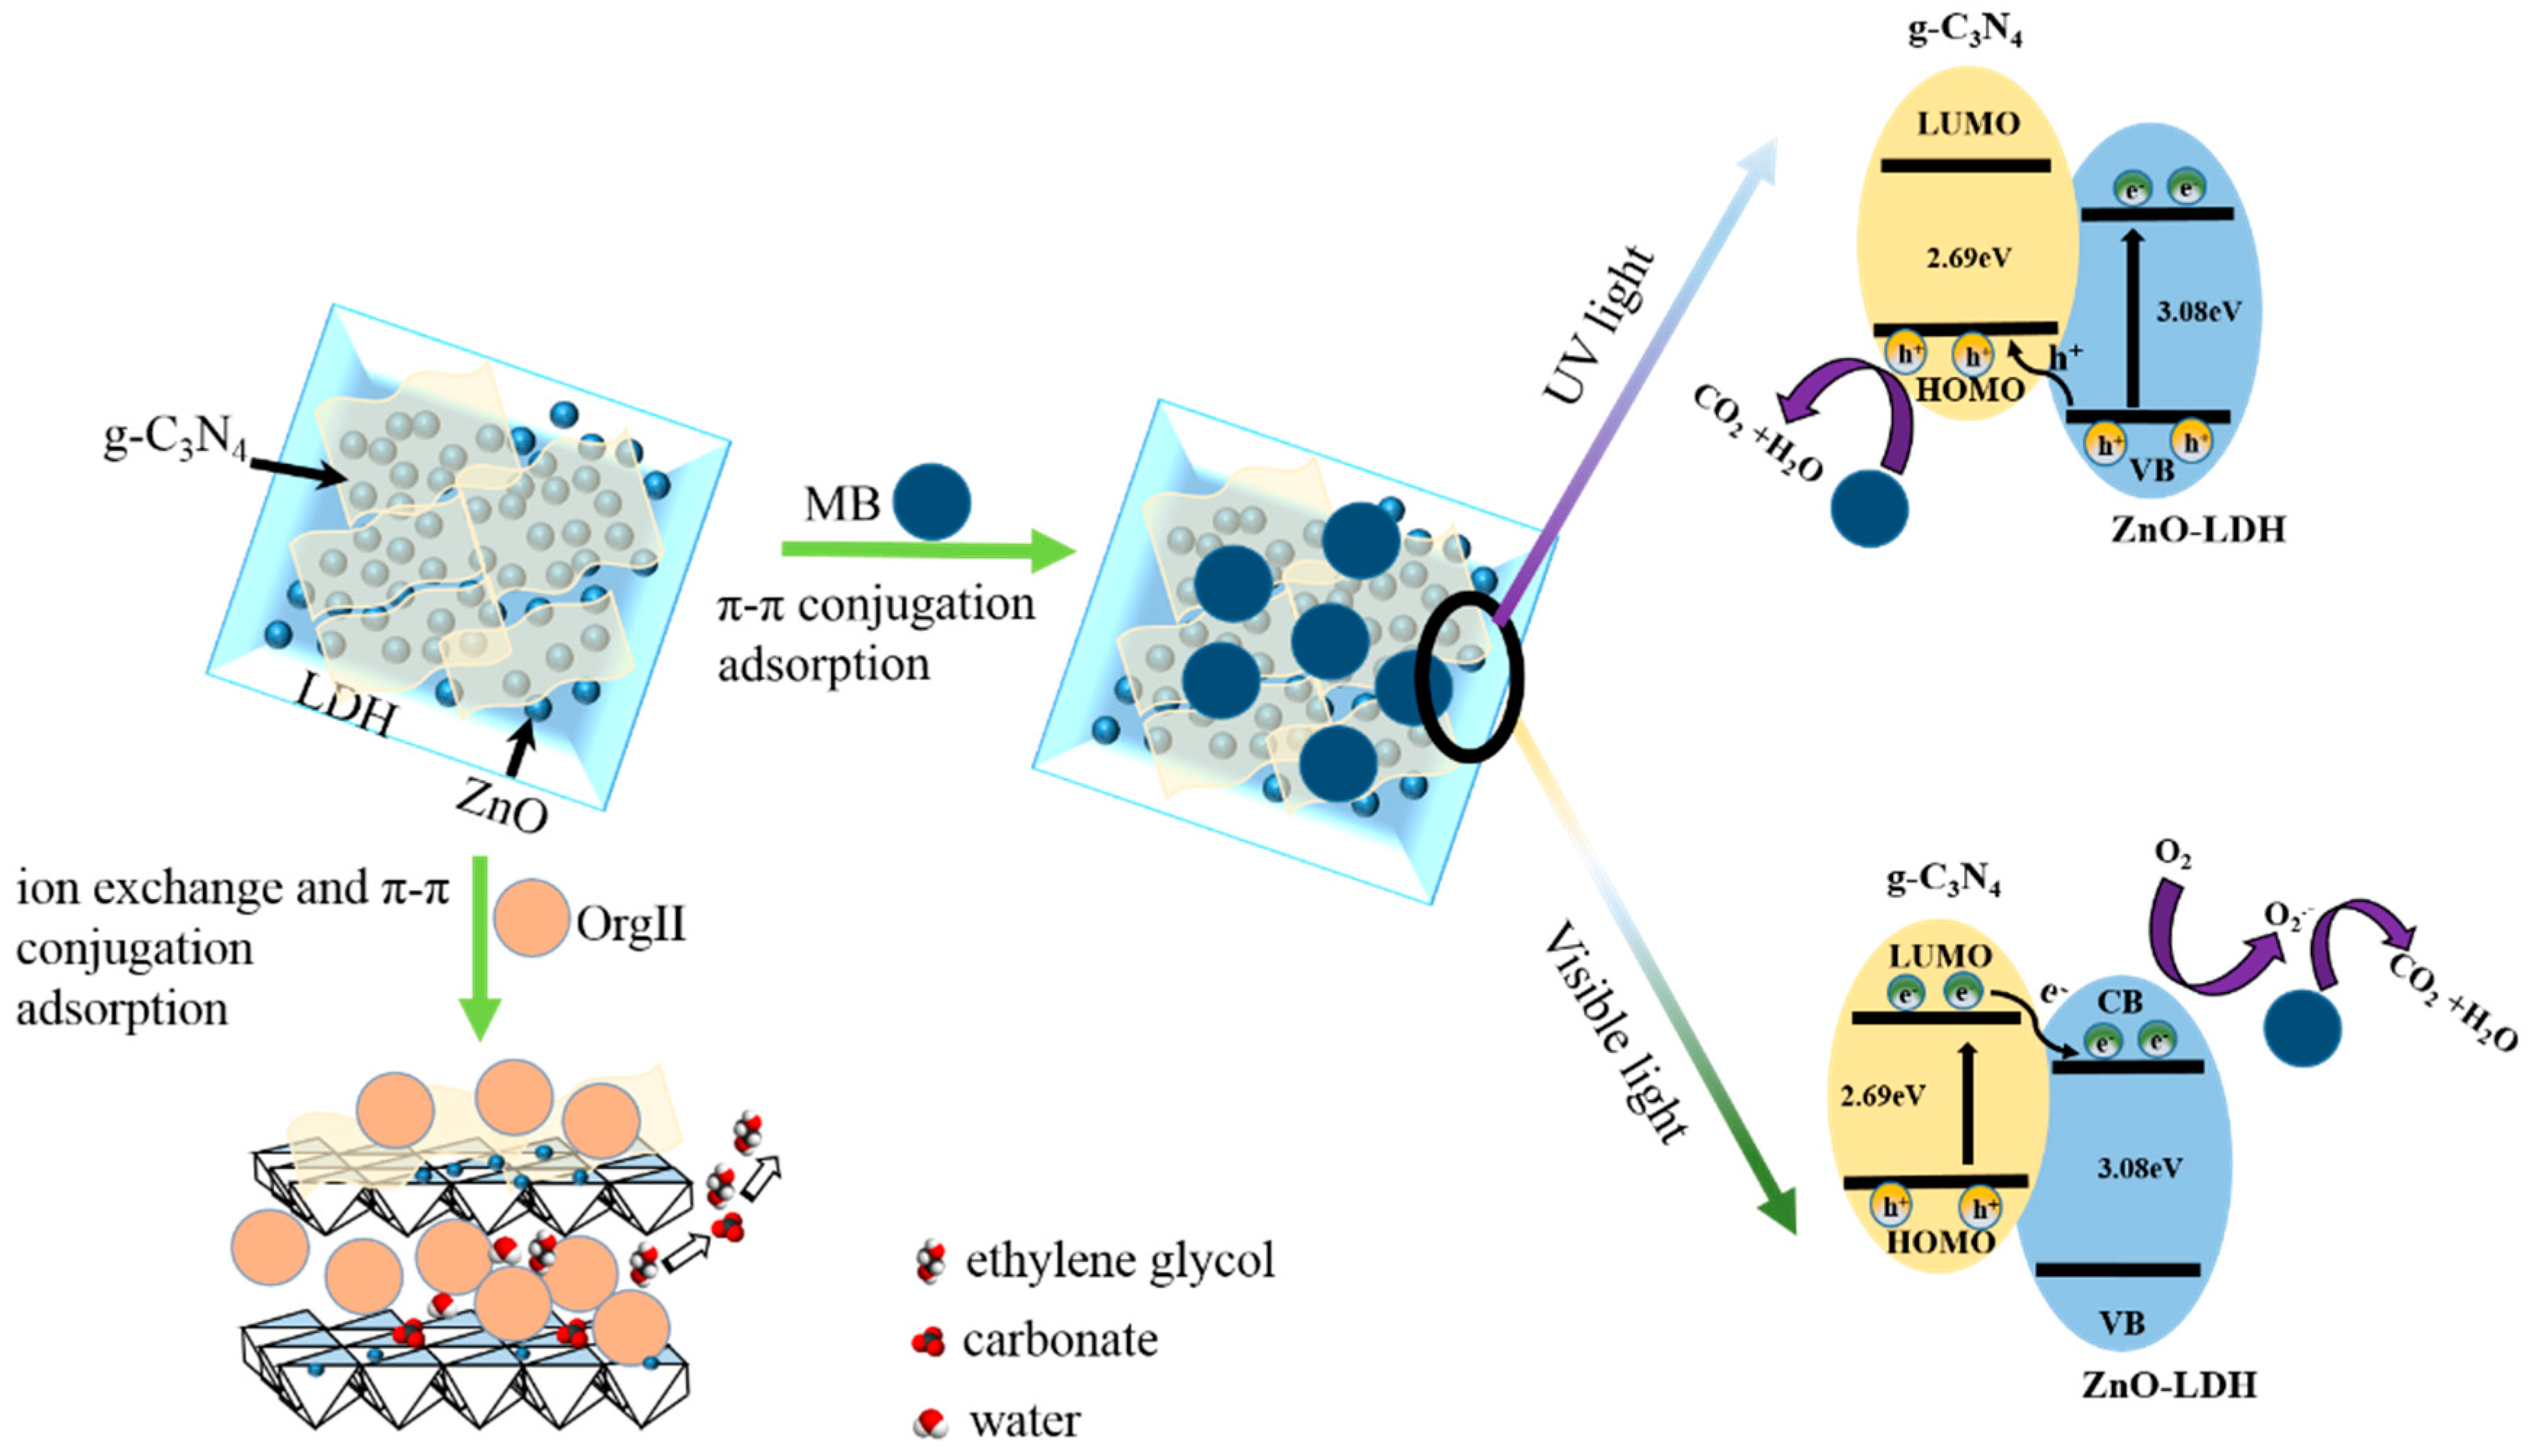
3.4. Proposed Mechanism under UV and Visible-Light Irradiations
4. Conclusions
Supplementary Materials
Acknowledgments
Author Contributions
Conflicts of Interest
References
- Guo, Y.W.; Zhu, Z.L.; Qiu, Y.L.; Zhao, J.F. Enhanced adsorption of acid brown 14 dye on calcined Mg/Fe layered double hydroxide with memory effect. Chem. Eng. J. 2013, 219, 69–77. [Google Scholar] [CrossRef]
- Li, C.; Wei, M.; Evans, D.G.; Duan, X. Layered Double Hydroxide-based Nanomaterials as Highly Efficient Catalysts and Adsorbents. Small 2014, 10, 4469–4486. [Google Scholar] [CrossRef] [PubMed]
- Chao, Y.F.; Chen, P.C.; Wang, S.L. Adsorption of 2, 4-D on Mg/Al–NO3 layered double hydroxides with varying layer charge density. Appl. Clay Sci. 2008, 40, 193–200. [Google Scholar] [CrossRef]
- Liu, L.Y.; Pu, M.; Yang, L.; Li, D.Q.; Evans, D.G.; He, J. Experimental and theoretical study on the structure of acid orange 7-pillared layered double hydroxide. Mater. Chem. Phys. 2007, 106, 422–427. [Google Scholar] [CrossRef]
- Chen, C.; Gunawan, P.; Xu, R. Self-assembled Fe3O4-layered double hydroxide colloidal nanohybrids with excellent performance for treatment of organic dyes in water. J. Mater. Chem. 2011, 21, 1218–1225. [Google Scholar] [CrossRef]
- Zhang, L.; Xiong, Z.; Li, L.; Burt, R.; Zhao, X.S. Uptake and degradation of Orange II by zinc aluminum layered double oxides. J. Colloid Interface Sci. 2016, 469, 224–230. [Google Scholar] [CrossRef] [PubMed]
- Zhou, J.; Xu, Z.P.; Qiao, S.; Liu, Q.; Xu, Y.; Qian, G. Enhanced removal of triphosphate by MgCaFe-Cl-LDH: Synergism of precipitation with intercalation and surface uptake. J. Hazard. Mater. 2011, 189, 586–594. [Google Scholar] [CrossRef] [PubMed]
- Zhang, J.; Chen, Y.; Wang, X. Two-dimensional covalent carbon nitride nanosheets: Synthesis, functionalization, and applications. Energy Environ. Sci. 2015, 8, 3092–3108. [Google Scholar] [CrossRef]
- Cao, S.; Low, J.; Yu, J.; Jaroniec, M. Polymeric Photocatalysts Based on Graphitic Carbon Nitride. Adv. Mater. 2015, 27, 2150–2176. [Google Scholar] [CrossRef] [PubMed]
- Lin, Q.; Li, L.; Liang, S.; Liu, M.; Bi, J.; Wu, L. Efficient synthesis of monolayer carbon nitride 2D nanosheet with tunable concentration and enhanced visible-light photocatalytic activities. Appl. Catal. B Environ. 2015, 163, 135–142. [Google Scholar] [CrossRef]
- Xiong, T.; Cen, W.; Zhang, Y.; Dong, F. Bridging the g-C3N4 Interlayers for Enhanced Photocatalysis. ACS Catal. 2016, 6, 2462–2472. [Google Scholar] [CrossRef]
- Lan, M.; Fan, G.; Yang, L.; Li, F. Enhanced visible-light-induced photocatalytic performance of a novel ternary semiconductor coupling system based on hybrid Zn-In mixed metal oxide/g-C3N4 composites. RSC Adv. 2015, 5, 5725–5734. [Google Scholar] [CrossRef]
- Chai, B.; Peng, T.; Mao, J.; Li, K.; Zan, L. Graphitic carbon nitride (g-C3N4)-Pt-TiO2 nanocomposite as an efficient photocatalyst for hydrogen production under visible light irradiation. Phys. Chem. Chem. Phys. 2012, 14, 16745–16752. [Google Scholar] [CrossRef] [PubMed]
- Sridharan, K.; Jang, E.; Park, T.J. Novel visible light active graphitic C3N4-TiO2 composite photocatalyst: Synergistic synthesis, growth and photocatalytic treatment of hazardous pollutants. Appl. Catal. B Environ. 2013, 142, 718–728. [Google Scholar] [CrossRef]
- Chen, D.M.; Wang, K.W.; Xiang, D.G.; Zong, R.L.; Yao, W.Q.; Zhu, Y.F. Significantly enhancement of photocatalytic performances via core-shell structure of ZnO@mpg-C3N4. Appl. Catal. B Environ. 2014, 147, 554–561. [Google Scholar] [CrossRef]
- Di, J.; Xia, J.; Yin, S.; Xu, H.; Xu, L.; Xu, Y.; He, M.; Li, H. Preparation of sphere-like g-C3N4/BiOI photocatalysts via a reactable ionic liquid for visible-light-driven photocatalytic degradation of pollutants. J. Mater. Chem. A 2014, 2, 5340–5351. [Google Scholar] [CrossRef]
- Jiang, Z.; Zhu, C.; Wan, W.; Qian, K.; Xie, J. Constructing graphite-like carbon nitride modified hierarchical yolk-shell TiO2 spheres for water pollution treatment and hydrogen production. J. Mater. Chem. A 2016, 4, 1806–1818. [Google Scholar] [CrossRef]
- Zhou, S.; Liu, Y.; Li, J.; Wang, Y.; Jiang, G.; Zhao, Z.; Wang, D.; Duan, A.; Liu, J.; Wei, Y. Facile in situ synthesis of graphitic carbon nitride (g-C3N4)-N-TiO2 heterojunction as an efficient photocatalyst for the selective photoreduction of CO2 to CO. Appl. Catal. B Environ. 2014, 158, 20–29. [Google Scholar] [CrossRef]
- Song, C.; Fan, M.; Hu, B.; Chen, T.; Wang, L.; Shi, W. Synthesis of a g-C3N4-sensitized and NaNbO3-substrated II-type heterojunction with enhanced photocatalytic degradation activity. Crystengcomm 2015, 17, 4575–4583. [Google Scholar]
- Kumar, S.; Baruah, A.; Tonda, S.; Kumar, B.; Shanker, V.; Sreedhar, B. Cost-effective and eco-friendly synthesis of novel and stable N-doped ZnO/g-C3N4 core-shell nanoplates with excellent visible-light responsive photocatalysis. Nanoscale 2014, 6, 4830–4842. [Google Scholar] [CrossRef] [PubMed]
- Chen, D.; Wang, K.; Ren, T.; Ding, H.; Zhu, Y. Synthesis and characterization of the ZnO/mpg-C3N4 heterojunction photocatalyst with enhanced visible light photoactivity. Dalton Trans. 2014, 43, 13105–13114. [Google Scholar] [CrossRef] [PubMed]
- Li, X.; Li, M.; Yang, J.; Li, X.; Hu, T.; Wang, J.; Sui, Y.; Wu, X.; Kong, L. Synergistic effect of efficient adsorption g-C3N4/ZnO composite for photocatalytic property. J. Phys. Chem. Solids 2014, 75, 441–446. [Google Scholar] [CrossRef]
- Wang, Y.; Shi, R.; Lin, J.; Zhu, Y. Enhancement of photocurrent and photocatalytic activity of ZnO hybridized with graphite-like C3N4. Energy Environ. Sci. 2011, 4, 2922–2929. [Google Scholar] [CrossRef]
- Liu, J. Simple pyrolysis of urea into graphitic carbon nitride with recyclable adsorption and photocatalytic activity. J. Mater. Chem. 2011, 21, 14398. [Google Scholar] [CrossRef]
- Ran, J.; Ma, T.Y.; Gao, G.; Du, X.W.; Qiao, S.Z. Porous P-doped graphitic carbon nitride nanosheets for synergistically enhanced visible-light photocatalytic H2 production. Energy Environ. Sci. 2015, 8, 3708–3717. [Google Scholar] [CrossRef]
- Koilraj, P.; Srinivasan, K. High Sorptive Removal of Borate from Aqueous Solution Using Calcined ZnAl Layered Double Hydroxides. Ind. Eng. Chem. Res. 2011, 50, 6943–6951. [Google Scholar] [CrossRef]
- Cho, S.; Kim, S.; Jang, J.W.; Jung, S.H.; Oh, E.; Lee, B.R.; Lee, K.H. Large-Scale Fabrication of Sub-20-nm-Diameter ZnO Nanorod Arrays at Room Temperature and Their Photocatalytic Activity. J. Phys. Chem. C 2009, 113, 10452–10458. [Google Scholar] [CrossRef]
- Roy Chowdhury, P.; Bhattacharyya, K.G. Ni/Ti layered double hydroxide: Synthesis, characterization and application as a photocatalyst for visible light degradation of aqueous methylene blue. Dalton Trans. 2015, 44, 6809–6824. [Google Scholar] [CrossRef] [PubMed]
- Guimarães, J.L.; Marangoni, R.; Ramos, L.P.; Wypych, F. Covalent Grafting of Ethylene Glycol into the Zn–Al–CO3 Layered Double Hydroxide. J. Colloid Interface Sci. 2000, 227, 445–451. [Google Scholar] [CrossRef] [PubMed]
- Lee, W.; Chen, Y. Effect of hydrotalcite on the physical properties and drug-release behavior of nanocomposite hydrogels based on poly[acrylic acid-co-poly(ethylene glycol) methyl ether acrylate] gels. J. Appl. Polym. Sci. 2004, 94, 692–699. [Google Scholar] [CrossRef]
- Xu, J.; Wang, Y.; Shang, J.K.; Jiang, Q.; Li, Y.X. Synthesis of Mesoporous Carbon Nitride via a Novel Detemplation and its Superior Performance for Base-catalyzed Reactions. Catal. Sci. Technol. 2016, 6, 4192–4200. [Google Scholar] [CrossRef]
- Mao, J.; Peng, T.; Zhang, X.; Li, K.; Ye, L.; Zan, L. Effect of graphitic carbon nitride microstructures on the activity and selectivity of photocatalytic CO2 reduction under visible light. Catal. Sci. Technol. 2013, 3, 1253–1260. [Google Scholar] [CrossRef]
- Chen, Y.; Wang, B.; Lin, S.; Zhang, Y.; Wang, X. Activation of n → π* Transitions in Two-Dimensional Conjugated Polymers for Visible Light Photocatalysis. J. Phys. Chem. C 2014, 118, 29981–29989. [Google Scholar] [CrossRef]
- Hong, J.; Zhang, W.; Wang, Y.; Zhou, T.; Xu, R. Photocatalytic Reduction of Carbon Dioxide over Self-Assembled Carbon Nitride and Layered Double Hydroxide: The Role of Carbon Dioxide Enrichment. ChemCatChem 2014, 6, 2315–2321. [Google Scholar] [CrossRef]
- Nayak, S.; Mohapatra, L.; Parida, K. Visible light-driven novel g-C3N4/NiFe-LDH composite photocatalyst with enhanced photocatalytic activity towards water oxidation and reduction reaction. J. Mater. Chem. A 2015, 3, 18622–18635. [Google Scholar] [CrossRef]
- Xu, J.; Li, Y.; Peng, S.; Lu, G.; Li, S. Eosin Y-sensitized graphitic carbon nitride fabricated by heating urea for visible light photocatalytic hydrogen evolution: The effect of the pyrolysis temperature of urea. Phys. Chem. Chem. Phys. 2013, 15, 7657–7665. [Google Scholar] [CrossRef] [PubMed]
- Samanta, S.; Martha, S.; Parida, K. Facile Synthesis of Au/g-C3N4 Nanocomposites: An Inorganic/Organic Hybrid Plasmonic Photocatalyst with Enhanced Hydrogen Gas Evolution Under Visible-Light Irradiation. ChemCatChem 2014, 6, 1453–1462. [Google Scholar]
- Yang, S.; Gong, Y.; Zhang, J.; Zhan, L.; Ma, L.; Fang, Z.; Vajtai, R.; Wang, X.; Ajayan, P.M. Exfoliated Graphitic Carbon Nitride Nanosheets as Efficient Catalysts for Hydrogen Evolution Under Visible Light. Adv. Mater. 2013, 25, 2452–2456. [Google Scholar] [CrossRef] [PubMed]
- Yu, J.; Wang, S.; Low, J.; Xiao, W. Enhanced photocatalytic performance of direct Z-scheme g-C3N4-TiO2 photocatalysts for the decomposition of formaldehyde in air. Phys. Chem. Chem. Phys. 2013, 15, 16883–16890. [Google Scholar] [CrossRef] [PubMed]
- Huang, J.; Yang, Z.; Wang, R.; Zhang, Z.; Feng, Z.; Xie, X. Zn-Al layered double oxides as high-performance anode materials for zinc-based secondary battery. J. Mater. Chem. A 2015, 3, 7429–7436. [Google Scholar] [CrossRef]
- Yu, C.L.; Yang, K.; Xie, Y.; Fan, Q.Z.; Yu, J.C.; Shu, Q.; Wang, C.Y. Novel hollow Pt-ZnO nanocomposite microspheres with hierarchical structure and enhanced photocatalytic activity and stability. Nanoscale 2013, 5, 2142–2151. [Google Scholar] [CrossRef] [PubMed]
- Yan, S.C.; Li, Z.S.; Zou, Z.G. Photodegradation of Rhodamine B and Methyl Orange over Boron-Doped g-C3N4 under Visible Light Irradiation. Langmuir 2010, 26, 3894–3901. [Google Scholar] [CrossRef] [PubMed]
- Martha, S.; Nashim, A.; Parida, K.M. Facile synthesis of highly active g-C3N4 for efficient hydrogen production under visible light. J. Mater. Chem. A 2013, 1, 7816–7824. [Google Scholar] [CrossRef]
- Wang, Z.; Guan, W.; Sun, Y.; Dong, F.; Zhou, Y.; Ho, W.K. Water-assisted production of honeycomb-like g-C3N4 with ultralong carrier lifetime and outstanding photocatalytic activity. Nanoscale 2015, 7, 2471–2479. [Google Scholar] [CrossRef] [PubMed]
- Yuan, Y.J.; Ye, Z.J.; Lu, H.W.; Hu, B.; Li, Y.H.; Chen, D.Q.; Zhong, J.S.; Yu, Z.T.; Zou, Z.G. Constructing Anatase TiO2 Nanosheets with Exposed (001) Facets/Layered MoS2 Two-Dimensional Nanojunctions for Enhanced Solar Hydrogen Generation. ACS Catal. 2015, 6, 532–541. [Google Scholar] [CrossRef]


| Samples | Zeta Potential 1 (mV) | SBET (m2g−1) | Pore Volume (cm3g−1) | Crystallite Size 2 (nm) | Bandgap 3 (eV) | k 4 (min−1) |
|---|---|---|---|---|---|---|
| g-C3N4 | 40.7 | 128.6 | 0.598 | - | 2.72 | 0.185 |
| ZnO-LDH | 30.4 | 113.7 | 0.261 | 5.2 | 3.08 | 0.0378 |
| ZnO-LDH@C3N4 | 32.9 | 152.5 | 0.298 | 3.4 | 3.06 | 0.487 |
| ZnO | - | - | - | 16.1 | 3.20 | 0.0775 |
© 2016 by the authors; licensee MDPI, Basel, Switzerland. This article is an open access article distributed under the terms and conditions of the Creative Commons Attribution (CC-BY) license (http://creativecommons.org/licenses/by/4.0/).
Share and Cite
Zhang, L.; Li, L.; Sun, X.; Liu, P.; Yang, D.; Zhao, X. ZnO-Layered Double Hydroxide@Graphitic Carbon Nitride Composite for Consecutive Adsorption and Photodegradation of Dyes under UV and Visible Lights. Materials 2016, 9, 927. https://doi.org/10.3390/ma9110927
Zhang L, Li L, Sun X, Liu P, Yang D, Zhao X. ZnO-Layered Double Hydroxide@Graphitic Carbon Nitride Composite for Consecutive Adsorption and Photodegradation of Dyes under UV and Visible Lights. Materials. 2016; 9(11):927. https://doi.org/10.3390/ma9110927
Chicago/Turabian StyleZhang, Luhong, Li Li, Xiaoming Sun, Peng Liu, Dongfang Yang, and Xiusong Zhao. 2016. "ZnO-Layered Double Hydroxide@Graphitic Carbon Nitride Composite for Consecutive Adsorption and Photodegradation of Dyes under UV and Visible Lights" Materials 9, no. 11: 927. https://doi.org/10.3390/ma9110927
APA StyleZhang, L., Li, L., Sun, X., Liu, P., Yang, D., & Zhao, X. (2016). ZnO-Layered Double Hydroxide@Graphitic Carbon Nitride Composite for Consecutive Adsorption and Photodegradation of Dyes under UV and Visible Lights. Materials, 9(11), 927. https://doi.org/10.3390/ma9110927