
Fibre Morphological Characteristics of Kraft Pulps of Acacia melanoxylon Estimated by NIR-PLS-R Models


Abstract
:
1. Introduction
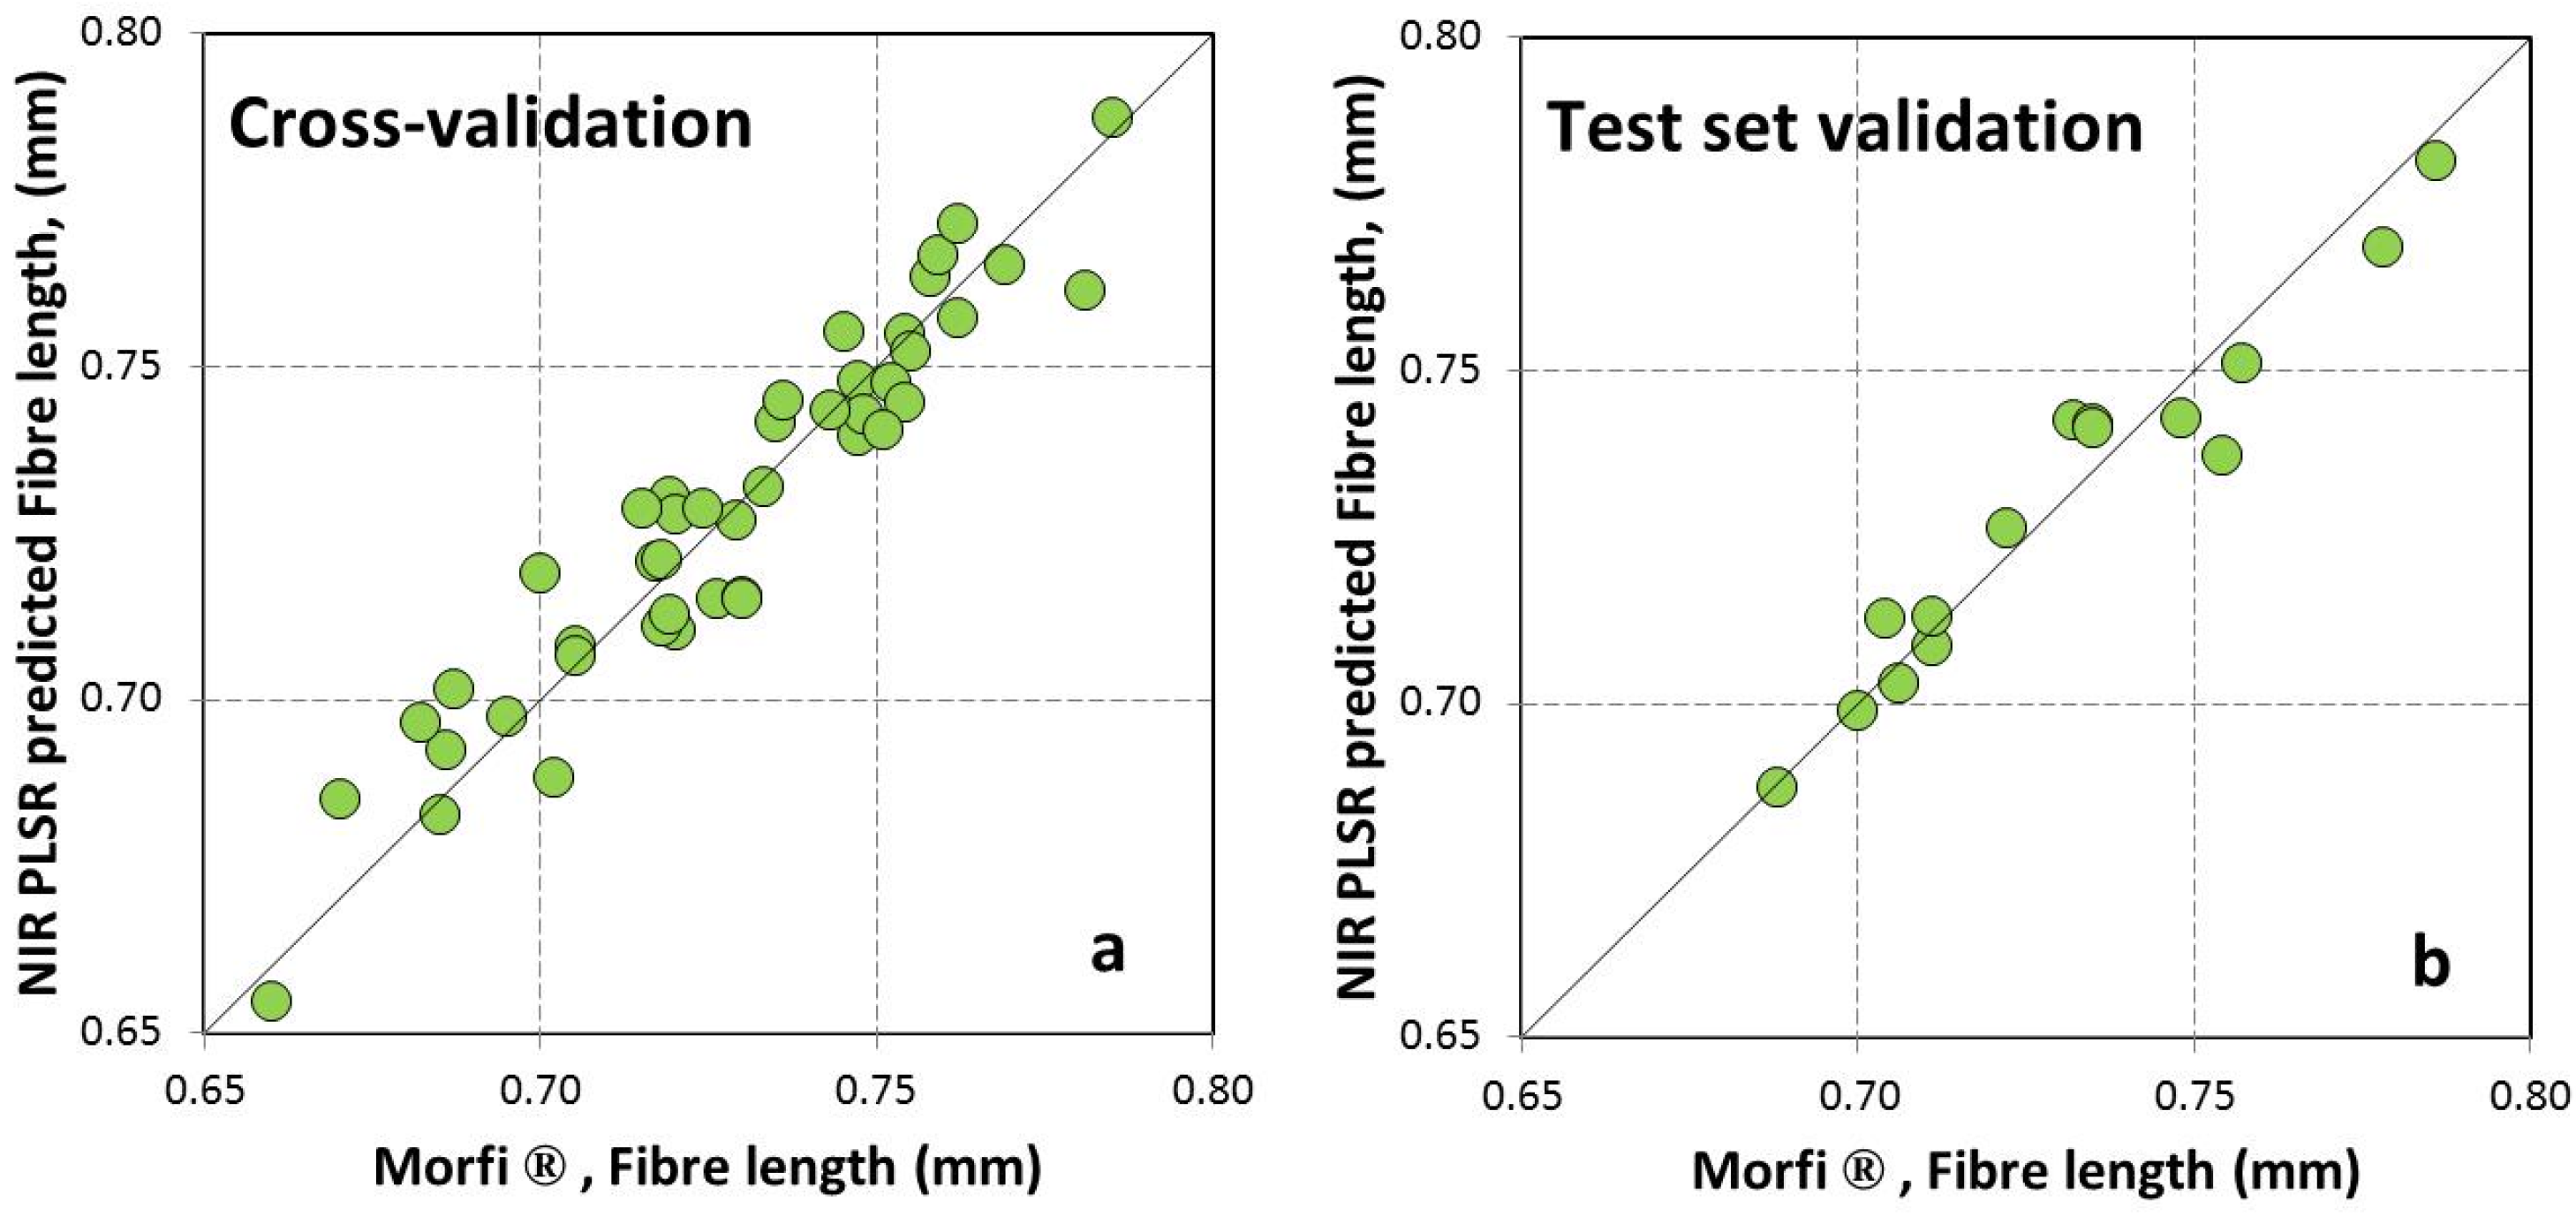
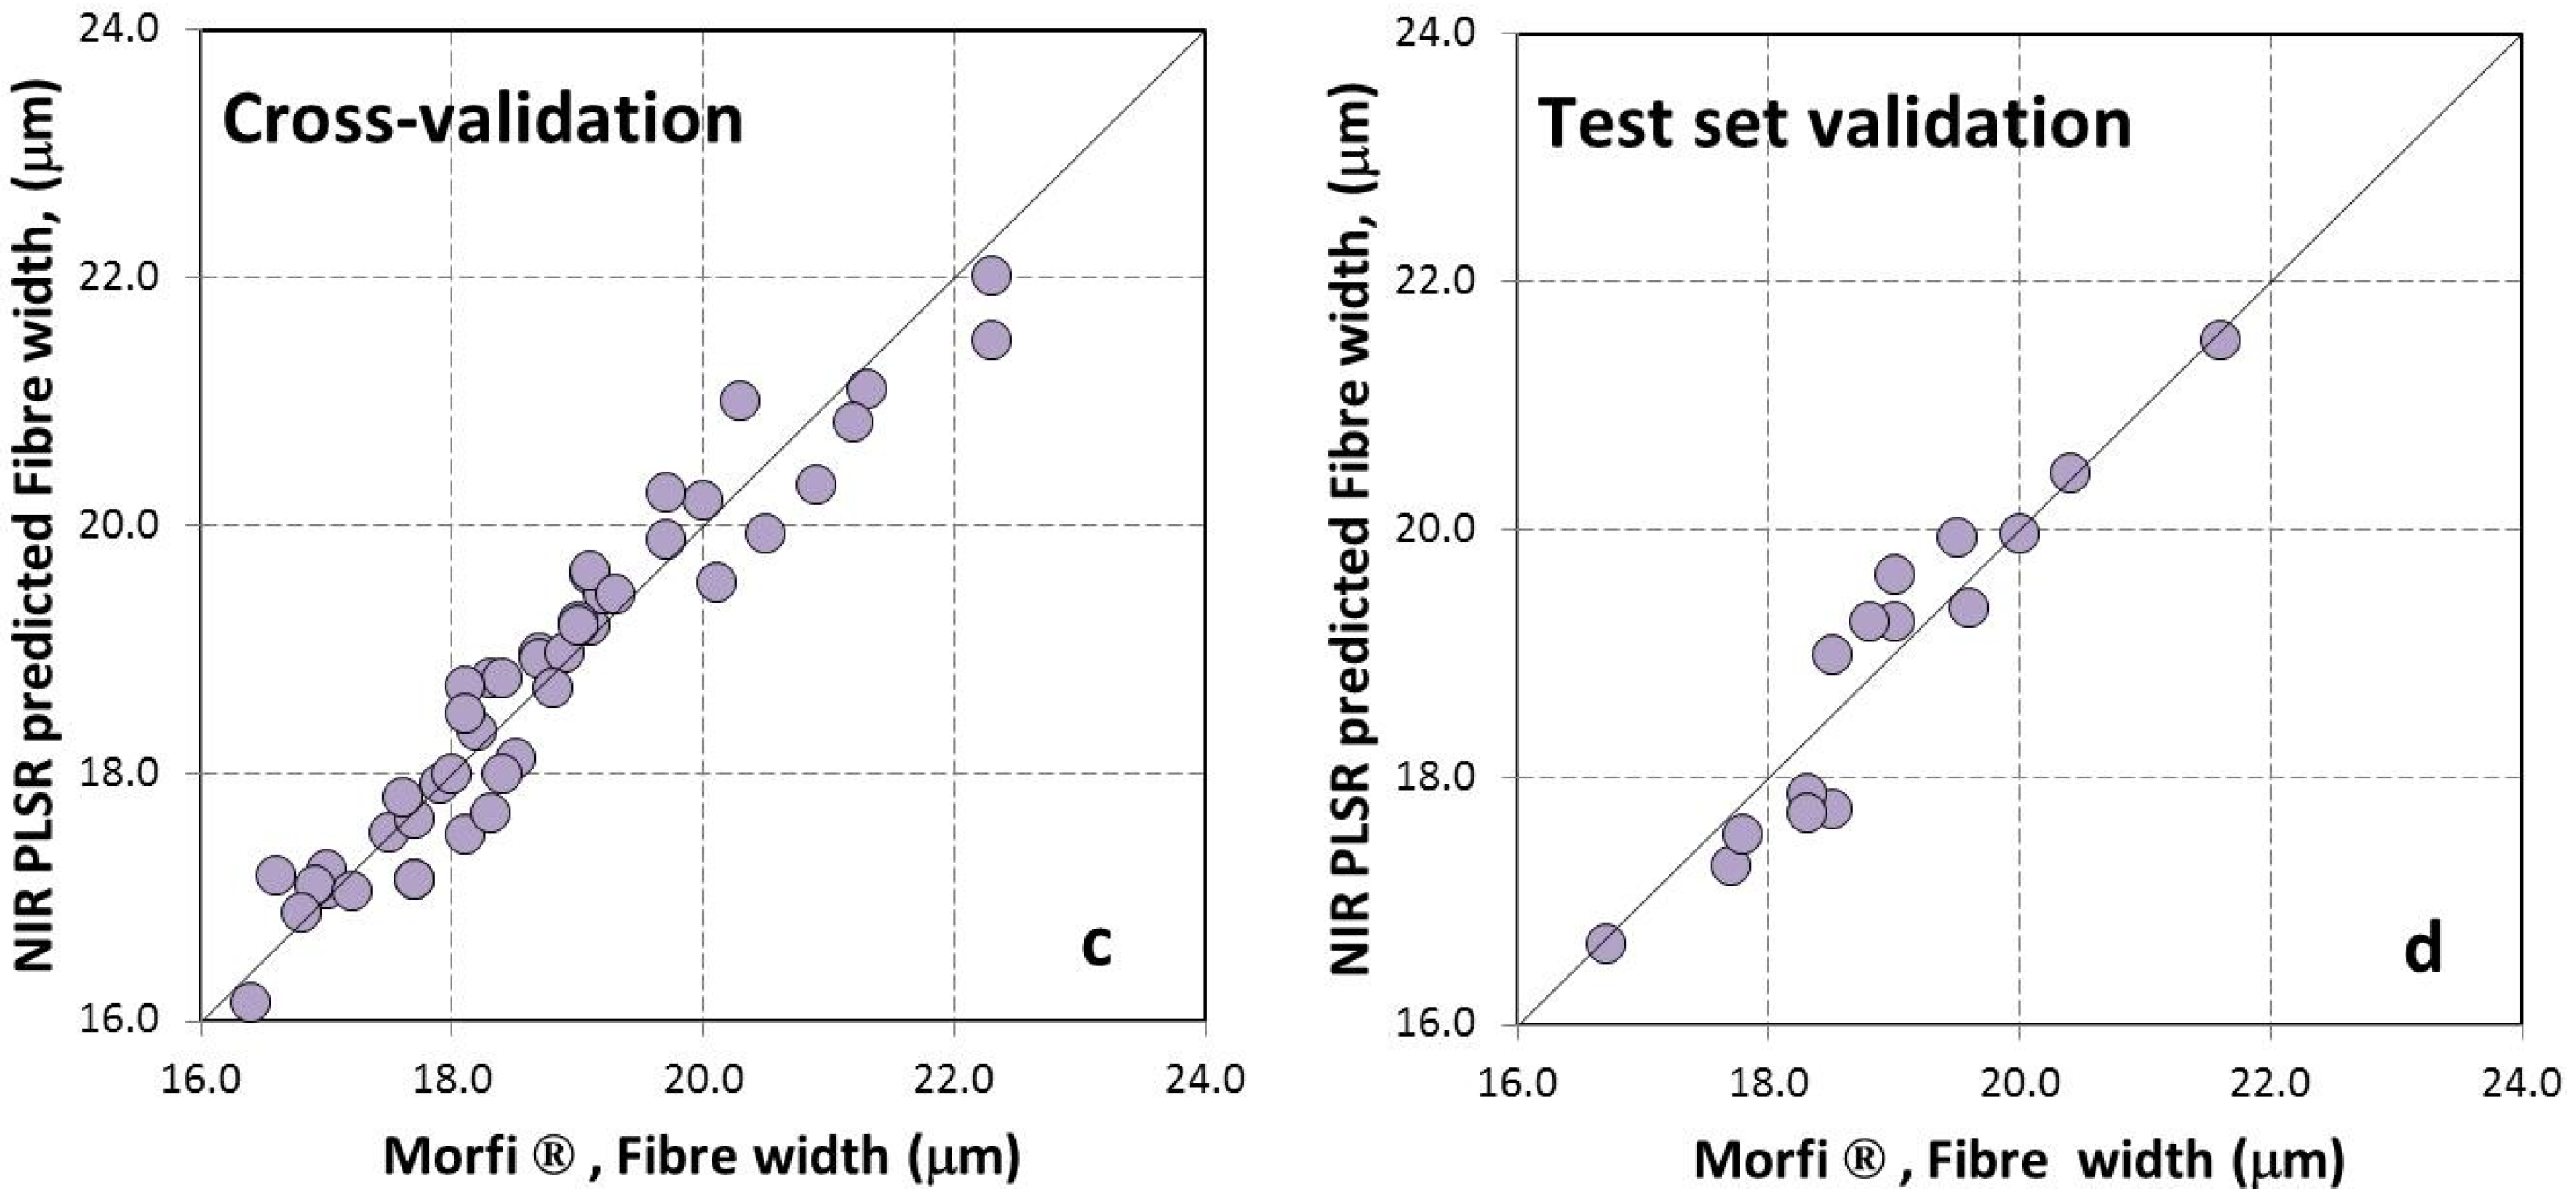
2. Results

| Parameter | Fiber Length (mm) | Fiber Width (μm) | ||
|---|---|---|---|---|
| Calibration Set | Test Set | Calibration Set | Test Set | |
| Number of samples | 45 | 15 | 45 | 15 |
| Maximum | 0.79 | 0.79 | 22.3 | 21.6 |
| Minimum | 0.66 | 0.69 | 16.4 | 16.7 |
| Average | 0.73 | 0.73 | 18.7 | 18.9 |
| SD | 0.03 | 0.03 | 1.4 | 1.2 |
| CV | 4.0 | 3.7 | 6.4 | 5.6 |
| Parameter | Pre-Processing | Number of Samples | Cross-Validation (CV) | Test Set Validation (TS) | ||||||||
|---|---|---|---|---|---|---|---|---|---|---|---|---|
| Rank | r2 (%) | RMSECV | RPD | Rank | r2 (%) | RMSEP | RPD | OS (%) | OL (%) | |||
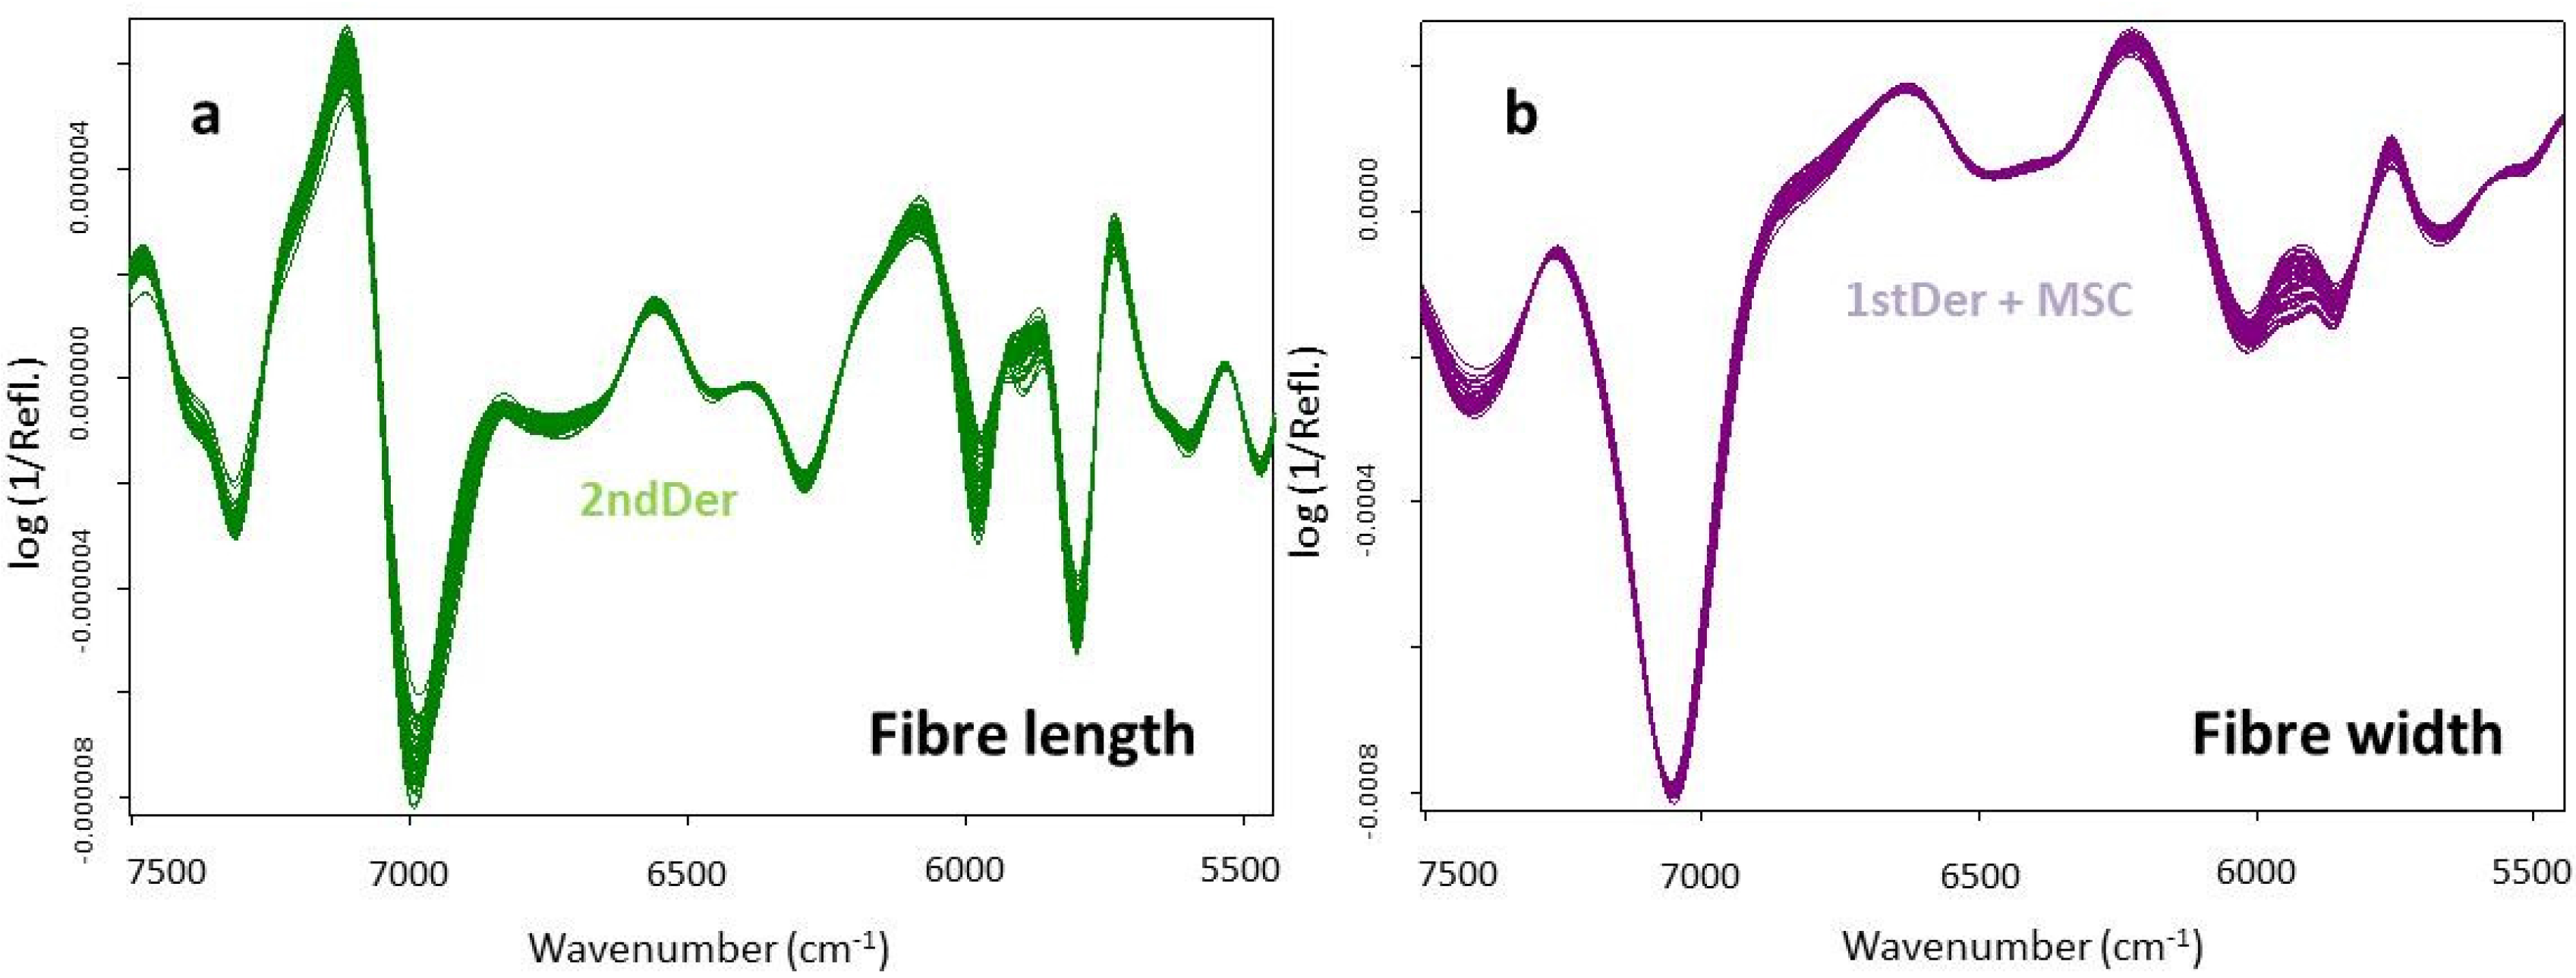
| Fiber Length (mm) | 1stDer | 45 | 9 | 92.4 | 0.008 | 3.6 | 8 | 87.8 | 0.010 | 2.9 | 0.0 | 0.0 |
| 2ndDer | 45 | 8 | 91.6 | 0.009 | 3.5 | 8 | 93.5 | 0.007 | 3.9 | 0.0 | 0.0 | |
| ConOff | 44 | 10 | 90.6 | 0.009 | 3.3 | 9 | 76.9 | 0.014 | 2.2 | 0.0 | 0.0 | |
| MinMax | 45 | 9 | 80.2 | 0.014 | 2.3 | 8 | 76.6 | 0.014 | 2.1 | 0.0 | 0.0 | |
| MSC | 45 | 9 | 81.7 | 0.013 | 2.3 | 7 | 70.9 | 0.015 | 1.9 | 0.0 | 0.0 | |
| None | 42 | 10 | 88.5 | 0.010 | 3.0 | 9 | 62.4 | 0.017 | 1.8 | 0.0 | 0.0 | |
| SLS | 45 | 9 | 91.7 | 0.009 | 3.5 | 7 | 80.1 | 0.013 | 2.3 | 0.0 | 0.0 | |
| VecNor | 45 | 9 | 81.6 | 0.013 | 2.3 | 7 | 70.7 | 0.015 | 1.9 | 0.0 | 0.0 | |
| 1stDer + MSC | 44 | 8 | 86.5 | 0.011 | 2.7 | 6 | 76.4 | 0.014 | 2.1 | 0.0 | 0.0 | |
| 1stDer + SLS | 45 | 9 | 93.4 | 0.008 | 3.9 | 7 | 88.9 | 0.009 | 3.0 | 0.0 | 0.0 | |
| 1stDer + VecNor | 44 | 8 | 86.4 | 0.011 | 2.7 | 6 | 76.4 | 0.014 | 2.1 | 0.0 | 0.0 | |
| Fiber Width (μm) | 1stDer | 45 | 7 | 91.8 | 0.41 | 3.5 | 6 | 85.0 | 0.45 | 2.6 | 0.0 | 0.0 |
| 2ndDer | 44 | 7 | 88.5 | 0.45 | 3.0 | 9 | 93.7 | 0.29 | 4.0 | 0.0 | 0.0 | |
| ConOff | 45 | 9 | 92.6 | 0.38 | 3.7 | 8 | 71.1 | 0.62 | 1.9 | 0.0 | 0.0 | |
| MinMax | 45 | 8 | 92.5 | 0.39 | 3.7 | 7 | 75.1 | 0.58 | 2.0 | 0.0 | 0.0 | |
| MSC | 45 | 8 | 93.0 | 0.37 | 3.8 | 6 | 75.0 | 0.58 | 2.0 | 0.0 | 0.0 | |
| None | 45 | 10 | 92.6 | 0.38 | 3.7 | 5 | 75.7 | 0.51 | 2.1 | 0.0 | 0.1 | |
| SLS | 45 | 8 | 92.5 | 0.37 | 3.7 | 7 | 72.3 | 0.61 | 1.9 | 0.0 | 0.0 | |
| VecNor | 45 | 8 | 93.0 | 0.37 | 3.8 | 6 | 74.7 | 0.58 | 2.0 | 0.0 | 0.0 | |
| 1stDer + MSC | 45 | 6 | 92.5 | 0.39 | 3.7 | 6 | 90.4 | 0.36 | 3.3 | 0.0 | 0.0 | |
| 1stDer + SLS | 44 | 7 | 90.2 | 0.41 | 3.2 | 7 | 88.2 | 0.40 | 2.9 | 0.0 | 0.0 | |
| 1stDer + VecNor | 45 | 6 | 92.5 | 0.39 | 3.7 | 6 | 87.6 | 0.41 | 2.9 | 0.0 | 0.0 | |
| Property | References | Material | Wavenumber Ranges (cm−1) | Pre-Processing |
|---|---|---|---|---|
| Wood basic density | [34] | Solid wood | 8250–7494 + 5450–5304 | 1stDer + SLS |
| Pulp yield | [35] | Woodmeal | 9087–5440 + 4605–4243 | 2ndDer |
| Kappa number | [36] | Kraft pulp | 6110–5440 | 1stDer |
| ISO brightness of unbleached pulp | [37] | 9404–7498 + 4605–4243 | 1stDer |
3. Discussion
| Parameter | Pre-Processing | Calibration (C) | Cross-Validation (CV) | ||||||
|---|---|---|---|---|---|---|---|---|---|
| Rank | r2 (%) | RMSEE | RPD | Rank | r2 (%) | RMSECV | RPD | ||
| Fiber length (mm) | 2ndDer | 8 | 96.5 | 0.006 | 5.3 | 8 | 94.0 | 0.007 | 4.1 |
| Fiber width (μm) | 1stDer + MSC | 6 | 95.0 | 0.32 | 4.5 | 6 | 92.8 | 0.37 | 3.7 |
| Species | Reference | Parameter | Pre-Processing | Rank | r2 | RMSECV | RMSEP |
|---|---|---|---|---|---|---|---|
| Eucalyptus camaldulensis | [27] | Fiber length (mm) | MSC | 6 | 87.0/93.0 | 0.018 mm | 0.012 mm |
| Pinus taeda | [23] | Tracheid radial diameter (μm) | 1stDer (a) | 10 | 46.0/42.0 | 1.58 * μm | 1.77 ** μm |
| 1stDer (b) | 10 | 45.0/46.0 | 1.59 * μm | 1.60 ** μm | |||
| Tracheid tangential diameter (μm) | 1stDer (a) | 6 | 60.0/63.0 | 1.00 * μm | 1.09 ** μm | ||
| 1stDer (b) | 6 | 60.0/62.0 | 1.02 * μm | 1.04 ** μm | |||
| [21] | Tracheid radial diameter (μm) | 2ndDer (c) | 6 | 70.0/36.0 | 1.10 * μm | 1.50 ** μm | |
| Tracheid tangential diameter (μm) | 6 | 80.0/61.0 | 0.60 * μm | 1.30 ** μm | |||
| Tracheid radial diameter (μm) | 2ndDer (d) | 5 | 59.0/16.0 | 1.30 * μm | 1.70 ** μm | ||
| Tracheid tangential diameter (μm) | 4 | 73.0/16.0 | 0.70 * μm | 1.70 ** μm | |||
| Pinus radiata | [22] | Tracheid radial diameter (μm) | 2ndDer | 6 | 65.0/28.0–30.0 | 1.60 * μm | 1.90–2.70 ** μm |
| Tracheid tangential diameter (μm) | 4 | 69.0/69.0–79.0 | 1.00 * μm | 1.20–1.70 ** μm |
4. Materials and Methods
4.1. Wood Samples
4.2. Kraft Pulps
4.3. Morphological Properties of Pulp Fibers
4.4. Spectra Collection and Data Processing
5. Conclusions
Acknowledgments
Author Contributions
Conflicts of Interest
References
- Anjos, O.; Santos, A.; Simões, R.; Pereira, H. Morphological, mechanical and optical properties of cypress. Holzforschung 2014, 68, 861–995. [Google Scholar] [CrossRef]
- El-Hosseiny, F.; Anderson, D. Effect of fibre length and coarseness on the burst strength of paper. Tappi J. 1999, 82, 202–203. [Google Scholar]
- Zobel, B.J.; Buijtenen, J.P. Wood Variation: Its Causes and Control; Springer: Heidelberg, Germany, 1989; p. 286. [Google Scholar]
- Keays, J.L.; Hatton, J.V.; Bailey, G.R.; Neilson, R.W. Present and Future Uses of Canadian Poplars in Fibre and Wood Products. Available online: http://digitalcommons.usu.edu/aspen_bib/5234/ (accessed on 23 December 2015).
- Dinwoodie, J.M. The relationship between fibre morphology and paper properties: A review of literature. Tappi 1965, 48, 440–447. [Google Scholar]
- Van Buijtenen, J.P.; Einspahr, D.W.; Peckham, J.R. Natural variation in Populus tremuloides Michx. II. Variation in pulp and papermaking properties. Tappi 1962, 45, 58–61. [Google Scholar]
- Malan, F.S.; Male, J.R.; Venter, J.S. Relationship between the properties of eucalyptus wood and some chemical, pulp and paper properties. Paper South. Africa 1994, 2, 6–16. [Google Scholar]
- Labosky, P., Jr.; Ifju, G. A study of loblolly pine growth increments. Part IV. Papermaking properties. Wood Fiber 1981, 13, 120–137. [Google Scholar]
- DuPlooy, A.B.J. The relationship between wood and pulp properties of E. grandis (Hill ex-Maiden) grown in South Africa. Appita 1980, 33, 257–264. [Google Scholar]
- Wandgaard, F.F.; Williams, D.L. Fiber length and fiber strength in relation to tearing resistance of hardwood pulps. TAPPI 1970, 53, 2153–2154. [Google Scholar]
- Watson, A.J.; Dadswell, H.E. Influence on fibre morphology on paper properties. Part 1. Fibre length. Appita J. 1961, 14, 168–176. [Google Scholar]
- Seth, R.S.; Page, D.H. Fiber properties and tearing resistance. Tappi J. 1988, 71, 103–107. [Google Scholar]
- Niskanen, K. Paper Physics; Fapet Oy: Helsinki, Finland, 1998. [Google Scholar]
- Paavilainen, L. Quality-competitiveness of Asian short-fibre raw materials in different paper grades. Paperi Ja Puu 2000, 82, 156–161. [Google Scholar]
- Santos, A.J.A.; Anjos, O.; Amaral, M.E.; Gil, N.; Pereira, H.; Simões, R. Influence on pulping yield and pulp properties of wood density of Acacia melanoxylon. J. Wood Sci. 2012, 58, 479–486. [Google Scholar] [CrossRef]
- Wimmer, R.; Downes, G.M.; Evans, R.; Rasmussen, G.; French, J. Direct effects of wood characteristics on pulp and handsheet properties of Eucalyptus globulus. Holzforschung 2002, 56, 244–252. [Google Scholar] [CrossRef]
- Technical Association of the Pulp & Paper Industry (TAPPI). Fiber Length of Pulp by Classification, Test Method T 233 cm-06, TAPPI Standard Test Methods; TAPPI: Atlanta, GA, USA.
- Technical Association of the Pulp & Paper Industry (TAPPI). Fiber Length of Pulp by Projection, Test Method T 232 cm-01, TAPPI Standard Test Methods; TAPPI: Atlanta, GA, USA.
- Technical Association of the Pulp & Paper Industry (TAPPI). Fiber Length of Pulp and Paper by Automated Optical Analyser Using Polarized Light, Test Method T 271 om-12, TAPPI Standard Test Methods; TAPPI: Atlanta, GA, USA.
- Tsuchikawa, S.; Kobori, H. A review of recent application of near infrared spectroscopy to wood science and technology. J. Wood Sci. 2015, 61, 213–220. [Google Scholar] [CrossRef]
- Schimleck, L.R.; Mora, C.; Daniels, R.F. Estimation of tracheid morphological characteristics of green Pinus taeda L. radial strips by near infrared spectroscopy. Wood Fiber Sci. 2004, 36, 527–535. [Google Scholar]
- Schimleck, L.R.; Evans, R. Estimation of Pinus radiata D. Don tracheid morphological characteristics by near infrared spectroscopy. Holzforschung 2004, 58, 66–73. [Google Scholar] [CrossRef]
- Jones, P.D.; Schimleck, L.R.; Peter, G.F.; Daniels, R.F.; Clark, A. Non-destructive estimation of Pinus taeda L. tracheid morphological characteristics for samples from a wide range of sites in Georgia. Wood Sci. Technol. 2005, 39, 529–545. [Google Scholar] [CrossRef]
- Via, B.K.; Shupe, T.F.; Stine, M.; So, C.L.; Groom, L.H. Tracheid length prediction in Pinus palustris by means of near infrared spectroscopy: The influence of age. Holz als Roh-Und Werkstoff 2005, 63, 231–236. [Google Scholar] [CrossRef]
- Wang, Y.H.; Feim, B.H.; Fu, F.; Jiang, Z.H.; Qin, D.C.; Yang, Z.A. Novel method for estimating wood fiber length using near infrared spectroscopy. China Pulp Paper 2008, 27, 6–9. [Google Scholar]
- Viana, L.C.; Trugilho, P.F.; Hein, P.R.; Lima, J.T.; da Silva, J.R. Predicting the morphological characteristics and basic density of Eucalyptus wood using the NIRS technique. Cerne 2009, 15, 421–429. [Google Scholar]
- Inagaki, T.; Schwanninger, M.; Kato, R.; Kurata, Y.; Thanapase, W.; Puthson, P.; Tsuchikawa, S. Eucalyptus camaldulensis density and fiber length estimated by near-infrared spectroscopy. Wood Sci. Technol. 2012, 46, 143–155. [Google Scholar] [CrossRef]
- Sun, B.L.; Chai, Y.B.; Huang, A.M.; Liu, J.H. Application of NIR spectroscopy to estimate of MFA and fiber length of Neosinocalamus affinis. Spectrosc. Spectr. Anal. 2011, 31, 3251–3255. [Google Scholar]
- Santos, A.J.A.; Anjos, O.; Simões, R. Papermaking potential of Acacia dealbata and Acacia melanoxylon. Appita J. 2006, 59, 58–64. [Google Scholar]
- Anjos, O.; Santos, A.J.A.; Simões, R. Effect of Acacia melanoxylon fibre morphology on papermaking potential. Appita J. 2011, 64, 185–191. [Google Scholar]
- Lourenço, A.; Baptista, I.; Gominho, J.; Pereira, H. The influence of heartwood on the pulping properties of Acacia melanoxylon wood. J. Wood Sci. 2008, 54, 464–469. [Google Scholar] [CrossRef]
- Griffin, A.R.; Twayi, H.; Braunstein, R.; Downes, G.M.; Son, D.H.; Harwood, C.E. A comparison of fibre and pulp properties of diploid and tetraploid Acacia mangium grown in Vietnam. Appita J. 2014, 67, 43–49. [Google Scholar]
- American Association of Cereal Chemists (AACC) International. Near-Infrared Methods-Guidelines for Model Development and Maintenance, AACC-Standards Method 39-00:15; AACC International: St. Paul, MN, USA.
- Santos, A.J.A.; Alves, A.M.; Simões, R.M.; Pereira, H.; Rodrigues, J.; Schwanninger, M. Estimation of wood basic density of Acacia melanoxylon (R. Br.) by near infrared spectroscopy. J. Near Infrared Spec. 2012, 20, 267–274. [Google Scholar] [CrossRef]
- Santos, A.J.A.; Anjos, O.; Pereira, H. Prediction of blackwood Kraft pulps yields with wood NIR-PLS-R models. Wood Sci. Technol. 2015. under review. [Google Scholar]
- Santos, A.J.A.; Anjos, O.; Simões, R.; Rodrigues, J.; Pereira, H. Kappa number prediction of Acacia melanoxylon unbleached Kraft pulps using NIR-PLSR models with a narrow interval of variation. BioResources 2014, 9, 6735–6744. [Google Scholar] [CrossRef]
- Santos, A.J.A.; Anjos, O.; Pereira, H. Estimation of Acacia melanoxylon unbleached Kraft pulp brightness by NIR spectroscopy. Forest Syst. 2015, 24. [Google Scholar] [CrossRef]
- Williams, P.; Norris, K. Near-Infrared Technology in the Agricultural and Food Industries, 2nd ed.; American Association of Cereal Chemists: St. Paul, MN, USA, 2004; p. 296. [Google Scholar]
- Santos, A.J.A.; Simões, R.; Tavares, M. Variation of some wood macroscopic properties along the stem of Acacia melanoxylon R. Br. adult trees in Portugal. Forest Syst. 2013, 22, 463–470. [Google Scholar] [CrossRef]
- Alves, A.; Santos, A.J.A.; da Silva Perez, D.; Rodrigues, J.; Pereira, H.; Simões, R.; Schwanninger, M. NIR PLSR model selection for Kappa number prediction of maritime pine Kraft pulps. Wood Sci. Technol. 2007, 41, 491–499. [Google Scholar] [CrossRef]
© 2015 by the authors; licensee MDPI, Basel, Switzerland. This article is an open access article distributed under the terms and conditions of the Creative Commons by Attribution (CC-BY) license (http://creativecommons.org/licenses/by/4.0/).
Share and Cite
Pereira, H.; Santos, A.J.A.; Anjos, O. Fibre Morphological Characteristics of Kraft Pulps of Acacia melanoxylon Estimated by NIR-PLS-R Models. Materials 2016, 9, 8. https://doi.org/10.3390/ma9010008
Pereira H, Santos AJA, Anjos O. Fibre Morphological Characteristics of Kraft Pulps of Acacia melanoxylon Estimated by NIR-PLS-R Models. Materials. 2016; 9(1):8. https://doi.org/10.3390/ma9010008
Chicago/Turabian StylePereira, Helena, António José Alves Santos, and Ofélia Anjos. 2016. "Fibre Morphological Characteristics of Kraft Pulps of Acacia melanoxylon Estimated by NIR-PLS-R Models" Materials 9, no. 1: 8. https://doi.org/10.3390/ma9010008
APA StylePereira, H., Santos, A. J. A., & Anjos, O. (2016). Fibre Morphological Characteristics of Kraft Pulps of Acacia melanoxylon Estimated by NIR-PLS-R Models. Materials, 9(1), 8. https://doi.org/10.3390/ma9010008