
The Effects of Different Fine Recycled Concrete Aggregates on the Properties of Mortar

Abstract
:1. Introduction
2. Experimental
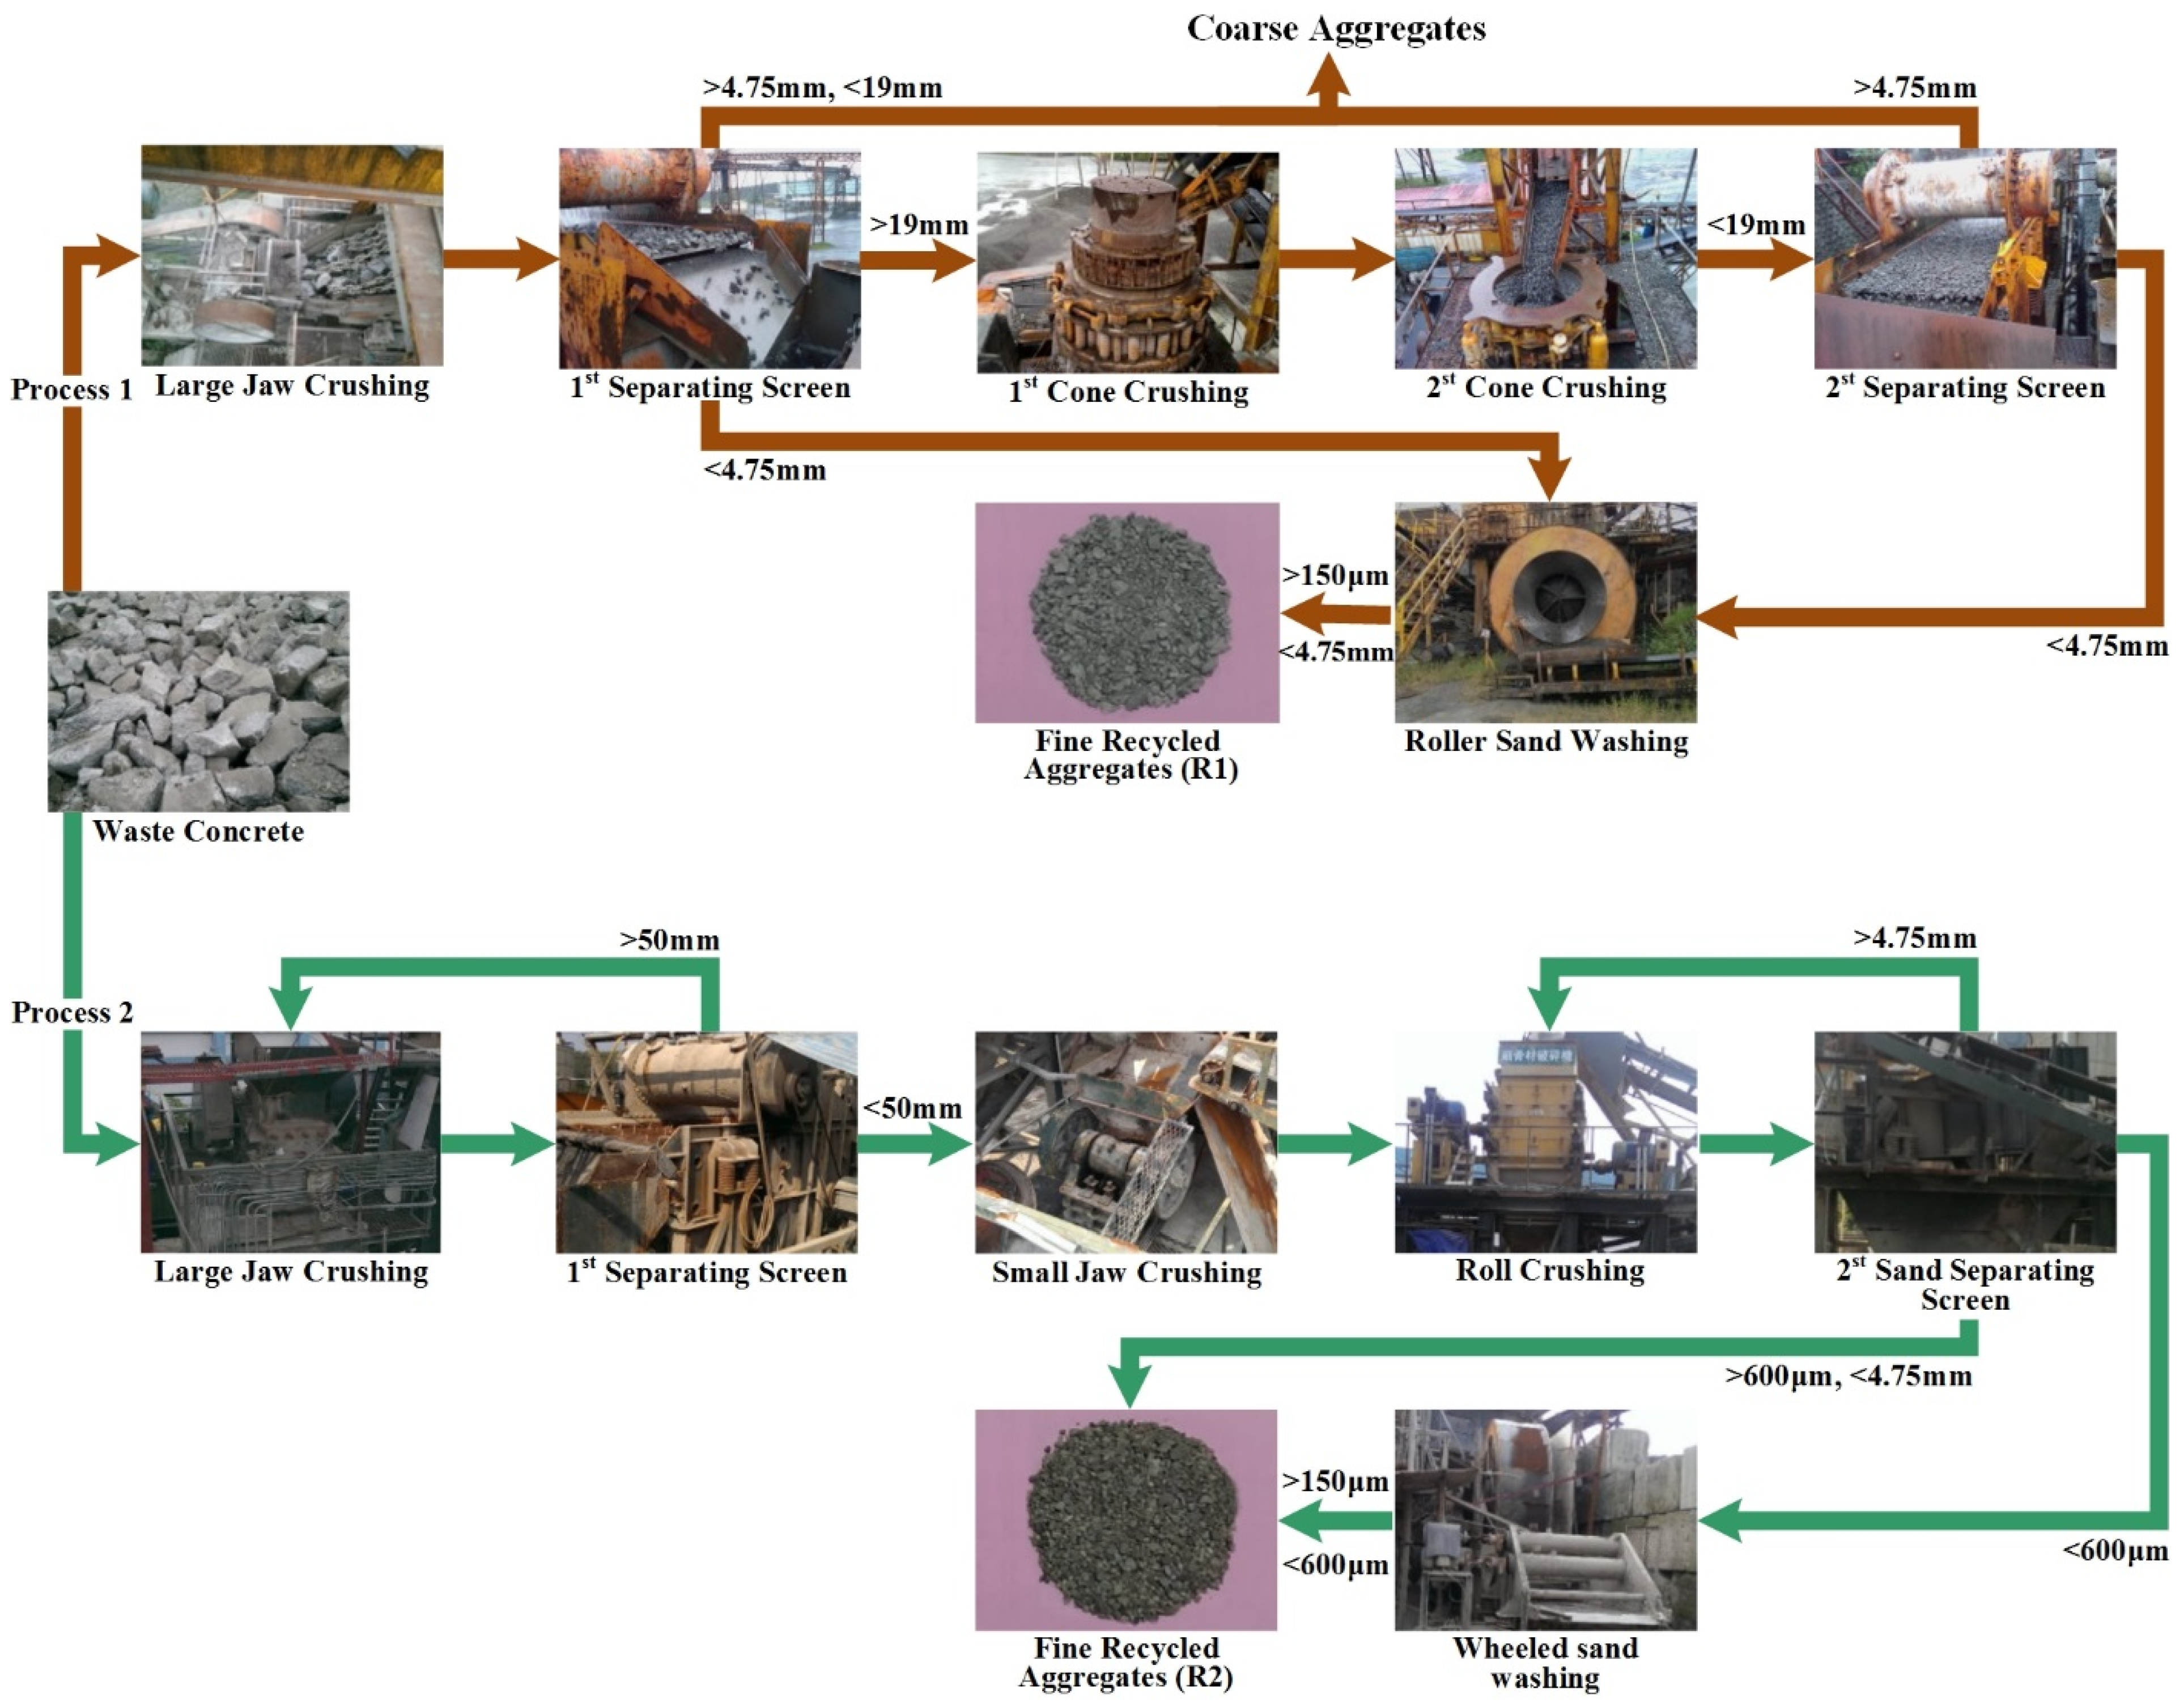
2.1. Materials

| Physical properties | FNA | R1 | R2 |
|---|---|---|---|
| Saturated surface dry density (kg/m3) (ASTM C128-12 [27]) | 2653 | 2347 | 2404 |
| Water absorption (%) (ASTM C128-12 [27]) | 1.3 | 8.9 | 6.6 |
| Fineness modulus (ASTM C136-14 [28]) | 2.9 | 3.3 | 3.1 |
2.2. Mix Proportions
| Mix notation | W/C ratio | FRCA content (%) | Mix proportions (kg/m3) | |||||
|---|---|---|---|---|---|---|---|---|
| Water (kg) | Cement (kg) | FNA (kg) | R1 (kg) | R2 (kg) | Superplasticizer (kg) | |||
| AControl | 0.35 | 0 | 245 | 700 | 1400 | 4 | ||
| A25R1 | 0.35 | 25 | 245 | 700 | 1050 | 310 | 4 | |
| A50R1 | 0.35 | 50 | 245 | 700 | 700 | 619 | 4 | |
| A100R1 | 0.35 | 100 | 245 | 700 | 1239 | 4 | ||
| A25R2 | 0.35 | 25 | 245 | 700 | 1050 | 317 | 4 | |
| A50R2 | 0.35 | 50 | 245 | 700 | 700 | 634 | 4 | |
| A100R2 | 0.35 | 100 | 245 | 700 | 1269 | 4 | ||
| BControl | 0.55 | 0 | 340 | 620 | 1240 | - | ||
| B25R1 | 0.55 | 25 | 340 | 620 | 930 | 274 | - | |
| B50R1 | 0.55 | 50 | 340 | 620 | 620 | 548 | - | |
| B100R1 | 0.55 | 100 | 340 | 620 | 1097 | - | ||
| B25R2 | 0.55 | 25 | 340 | 620 | 930 | 281 | - | |
| B50R2 | 0.55 | 50 | 340 | 620 | 620 | 562 | - | |
| B100R2 | 0.55 | 100 | 340 | 620 | 1124 | - | ||
2.3. Fabrication of Specimens
2.4. Testing
3. Results and Discussion
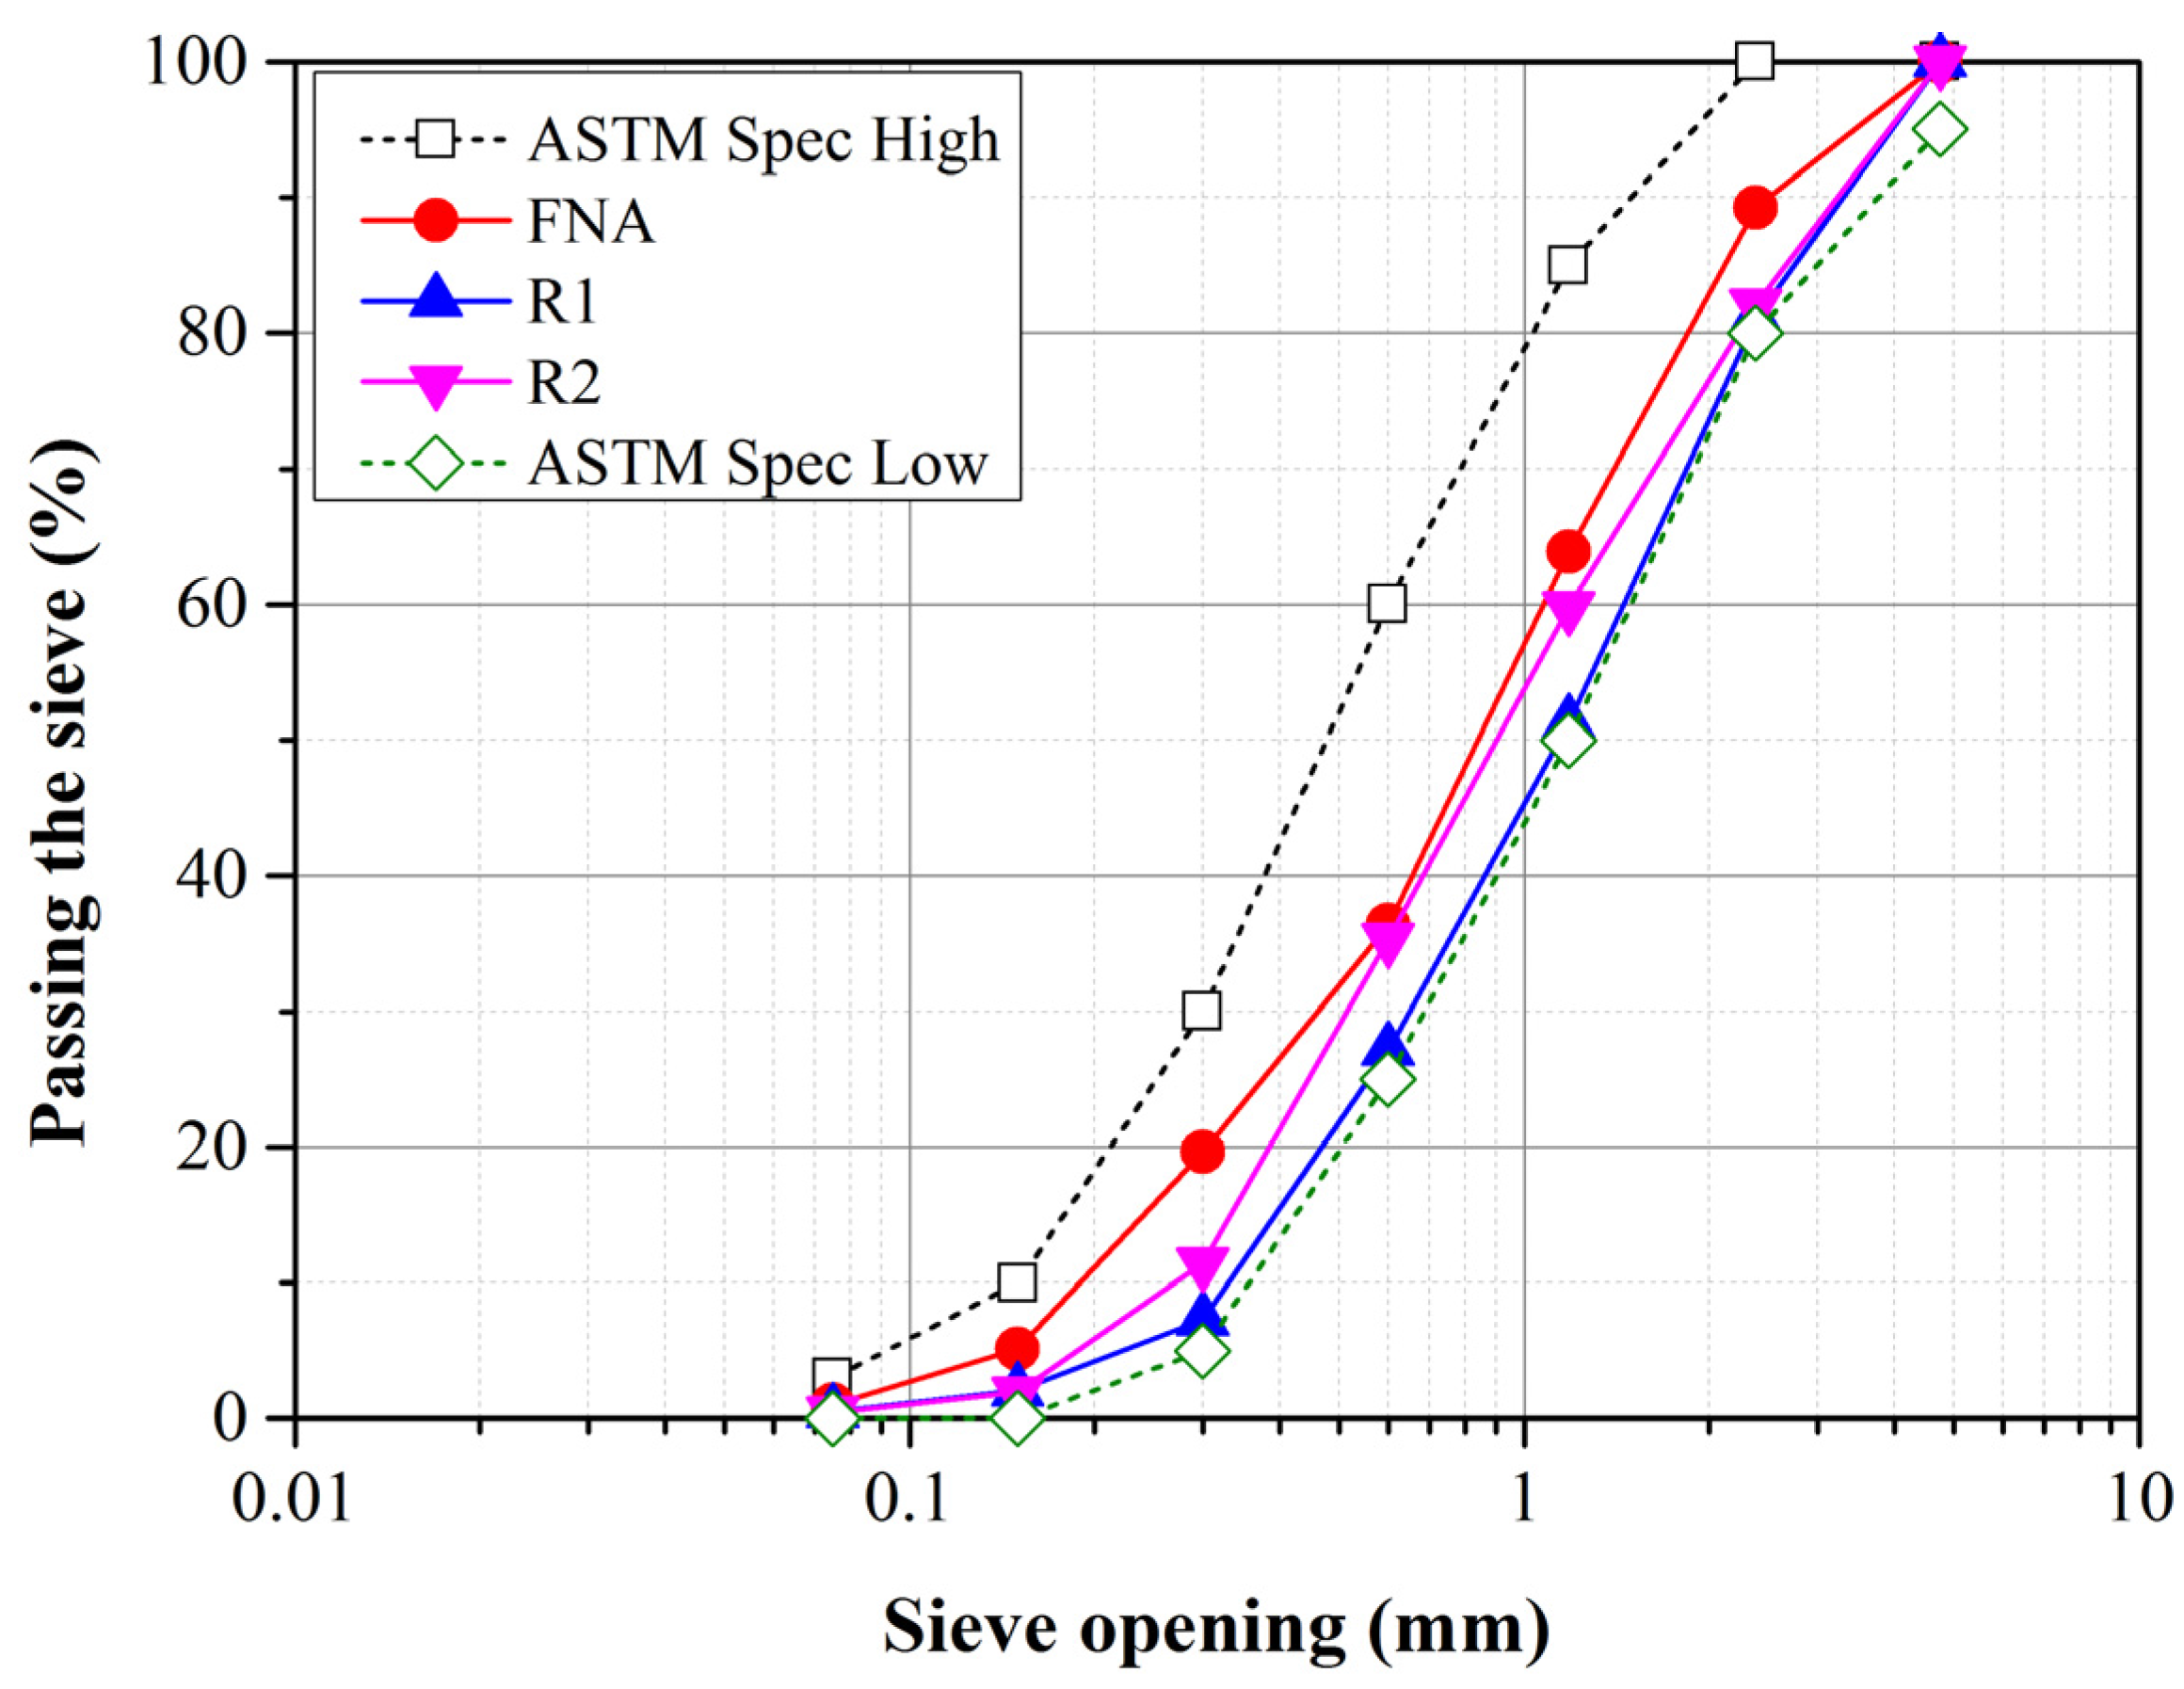
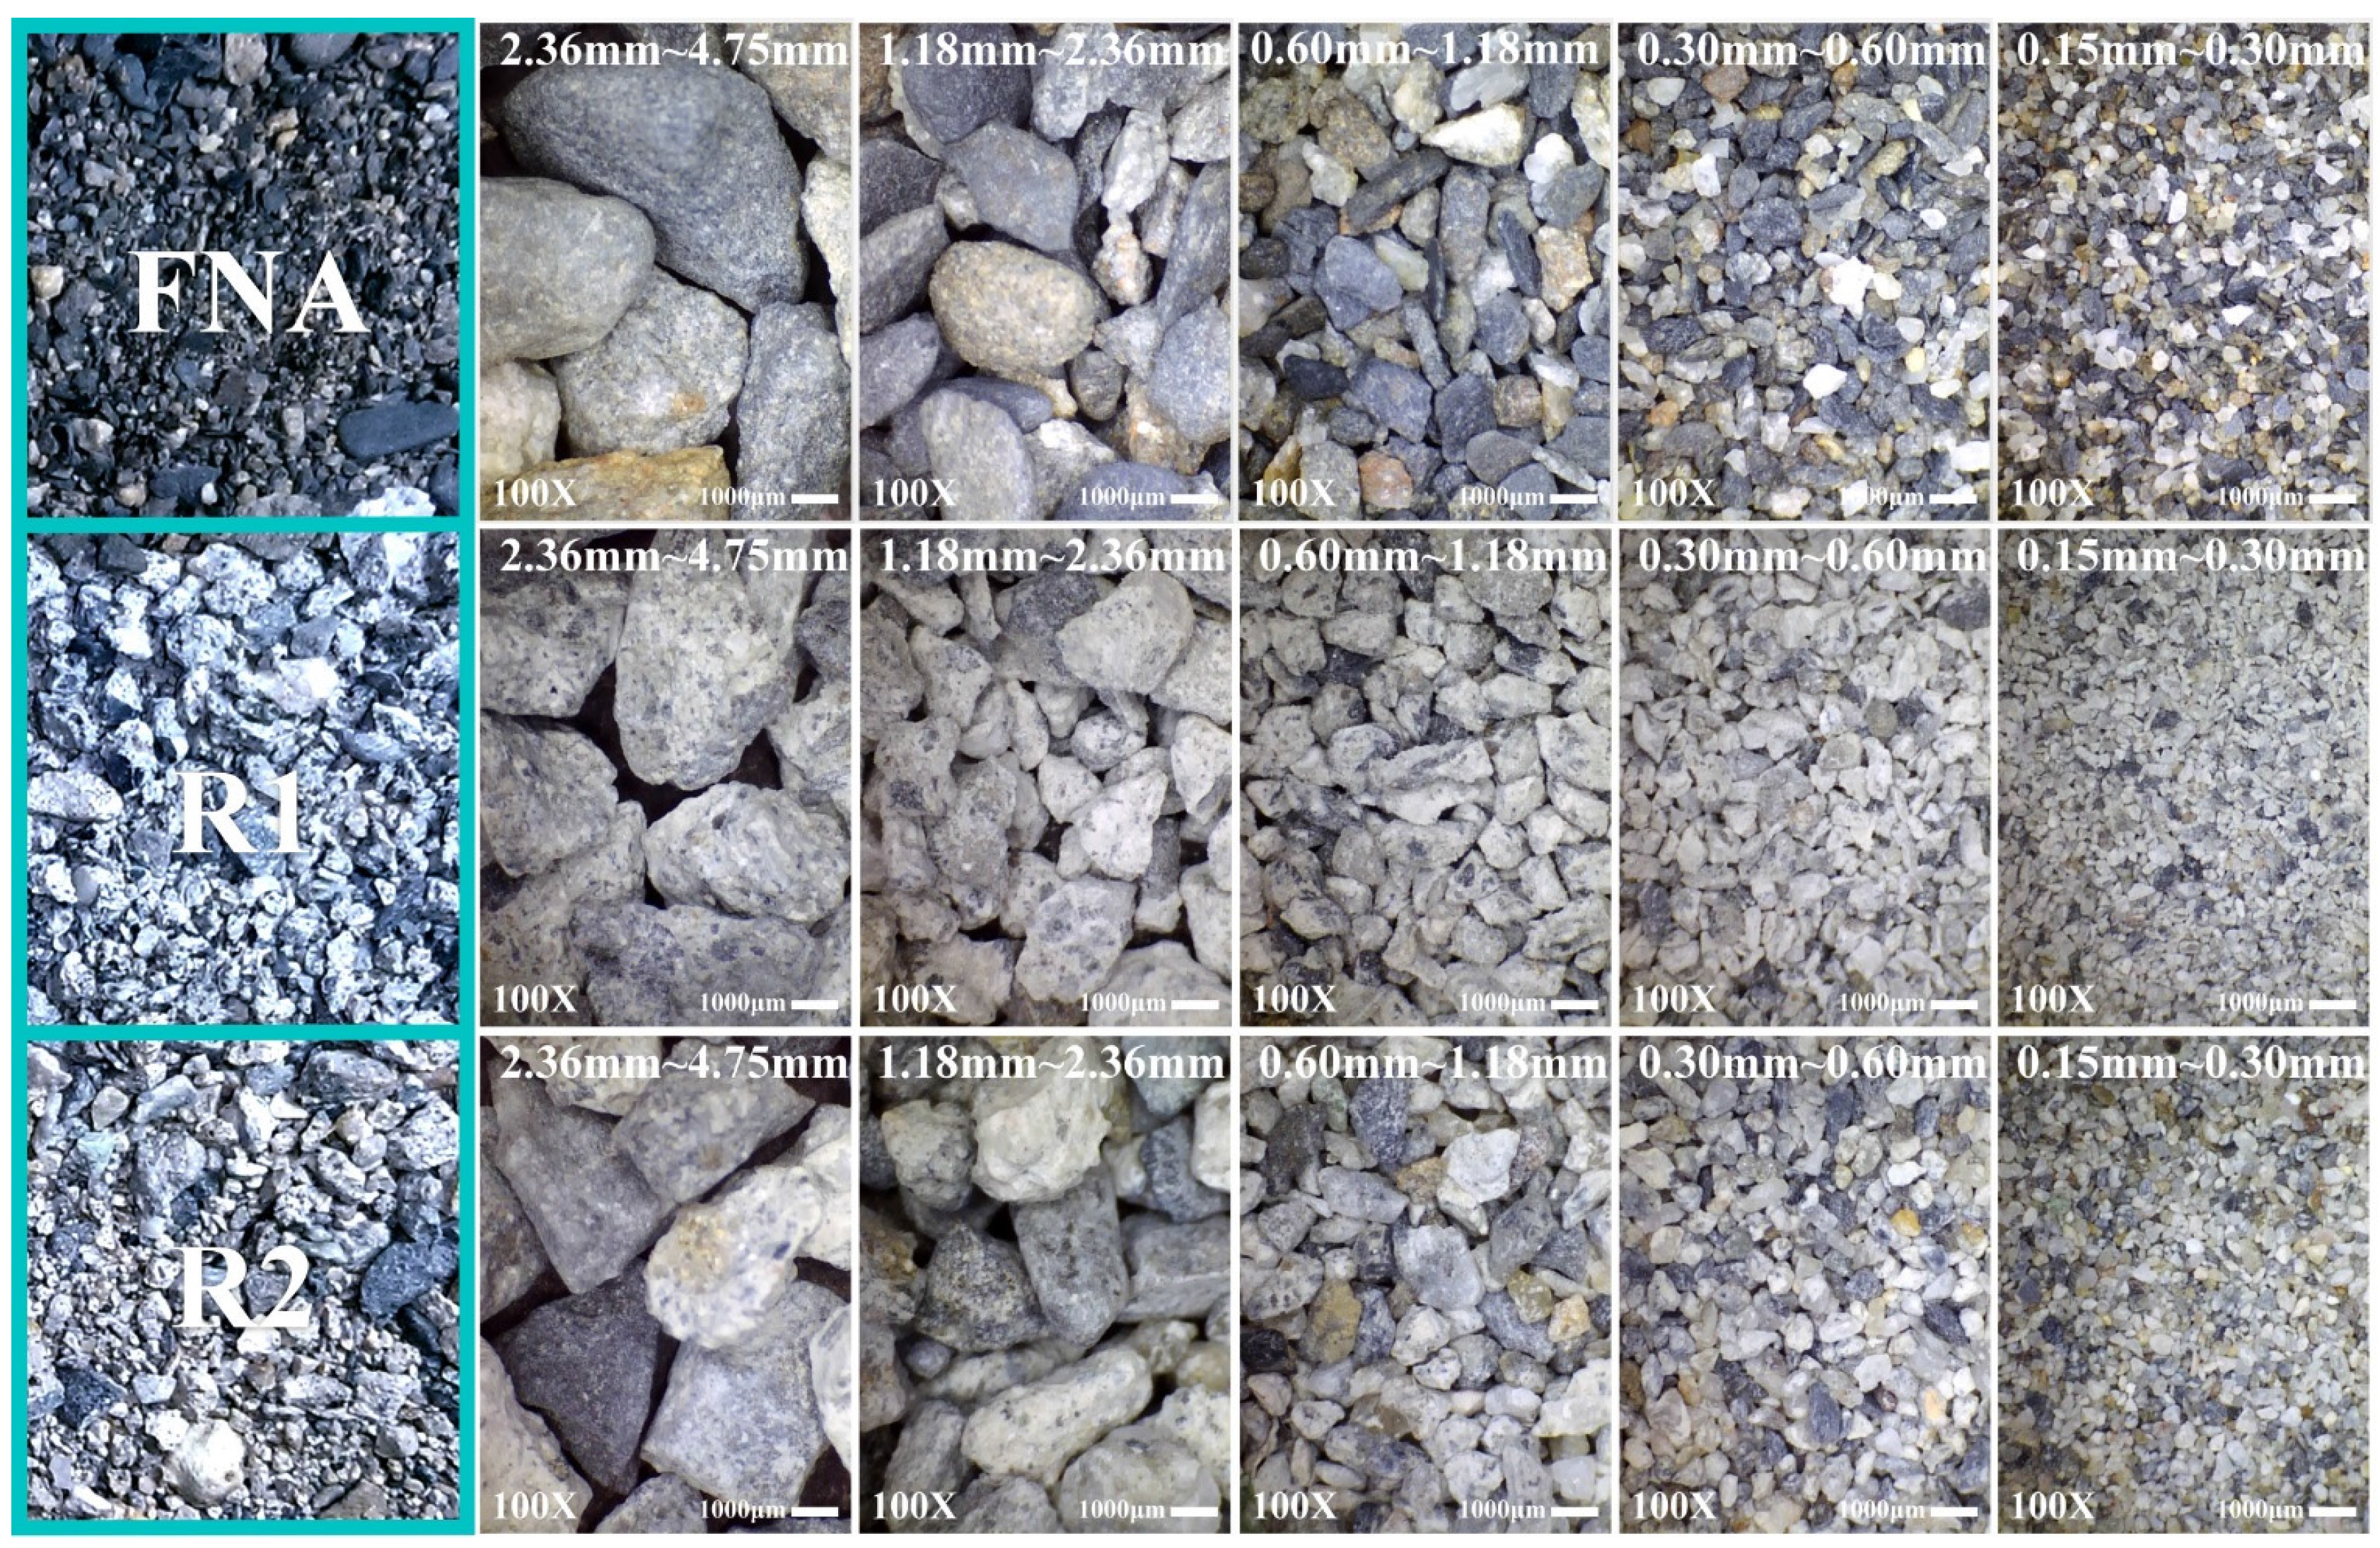
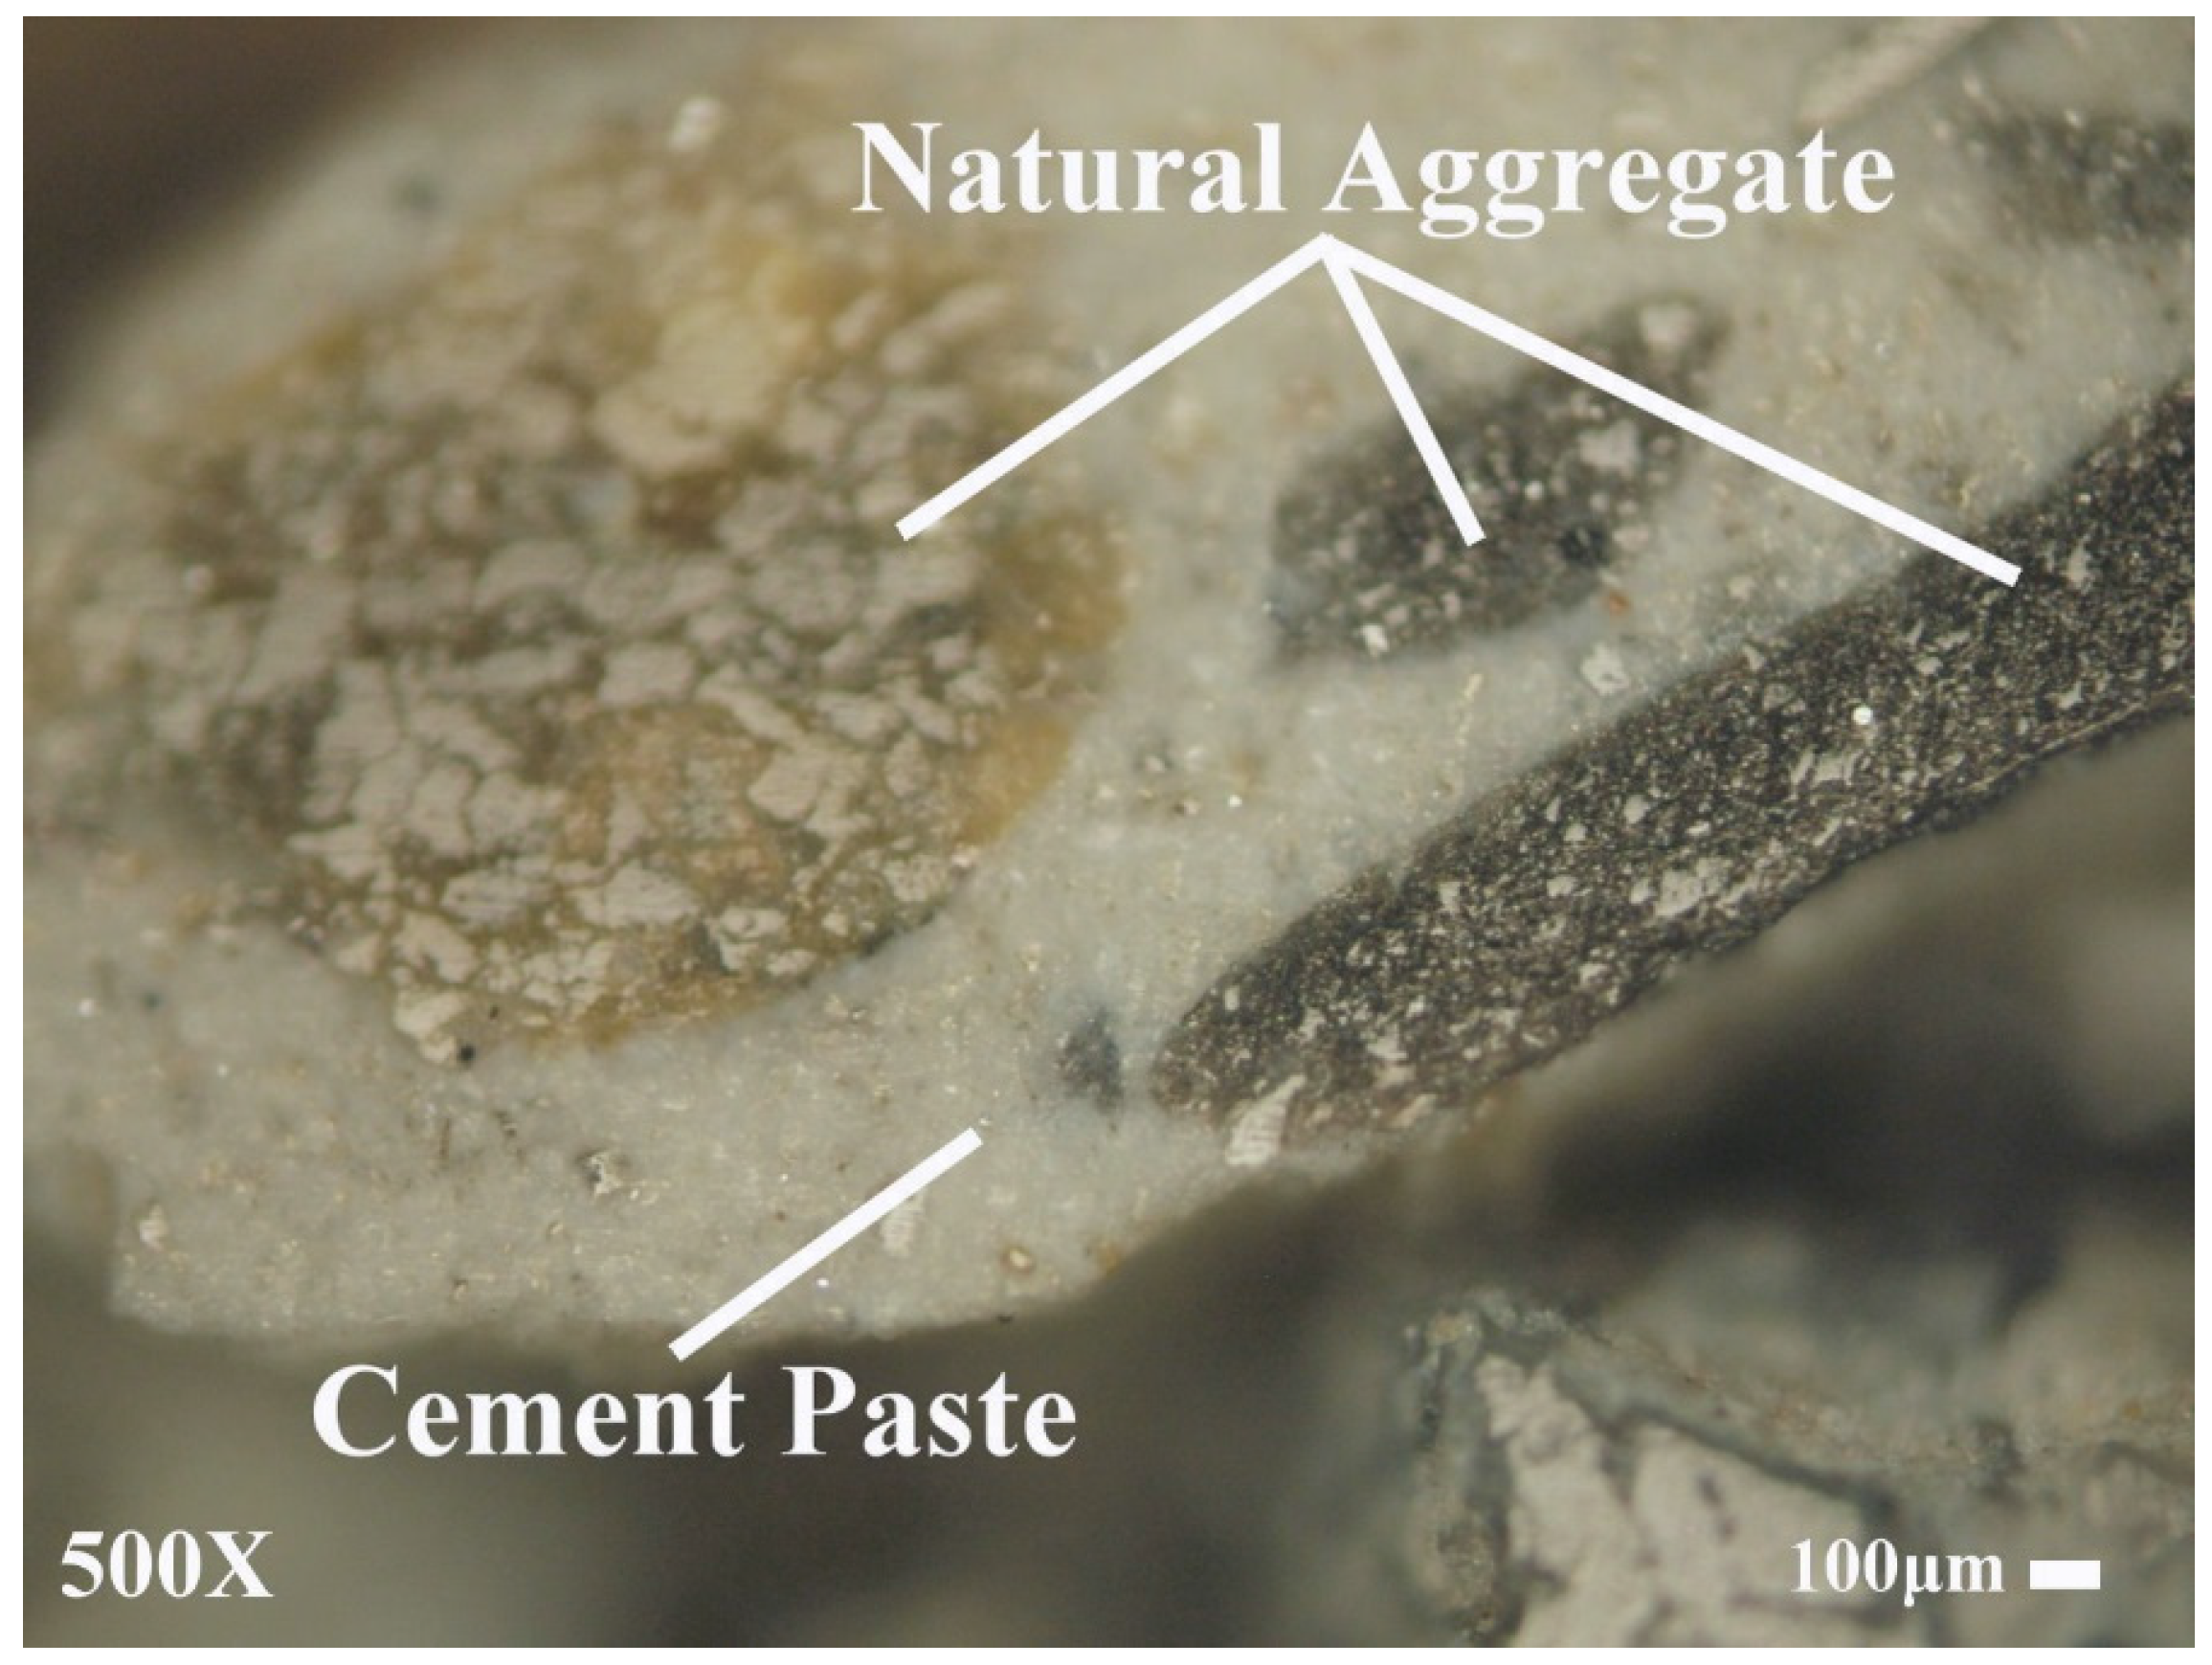
3.1. Properties of Fine Recycled Concrete Aggregates

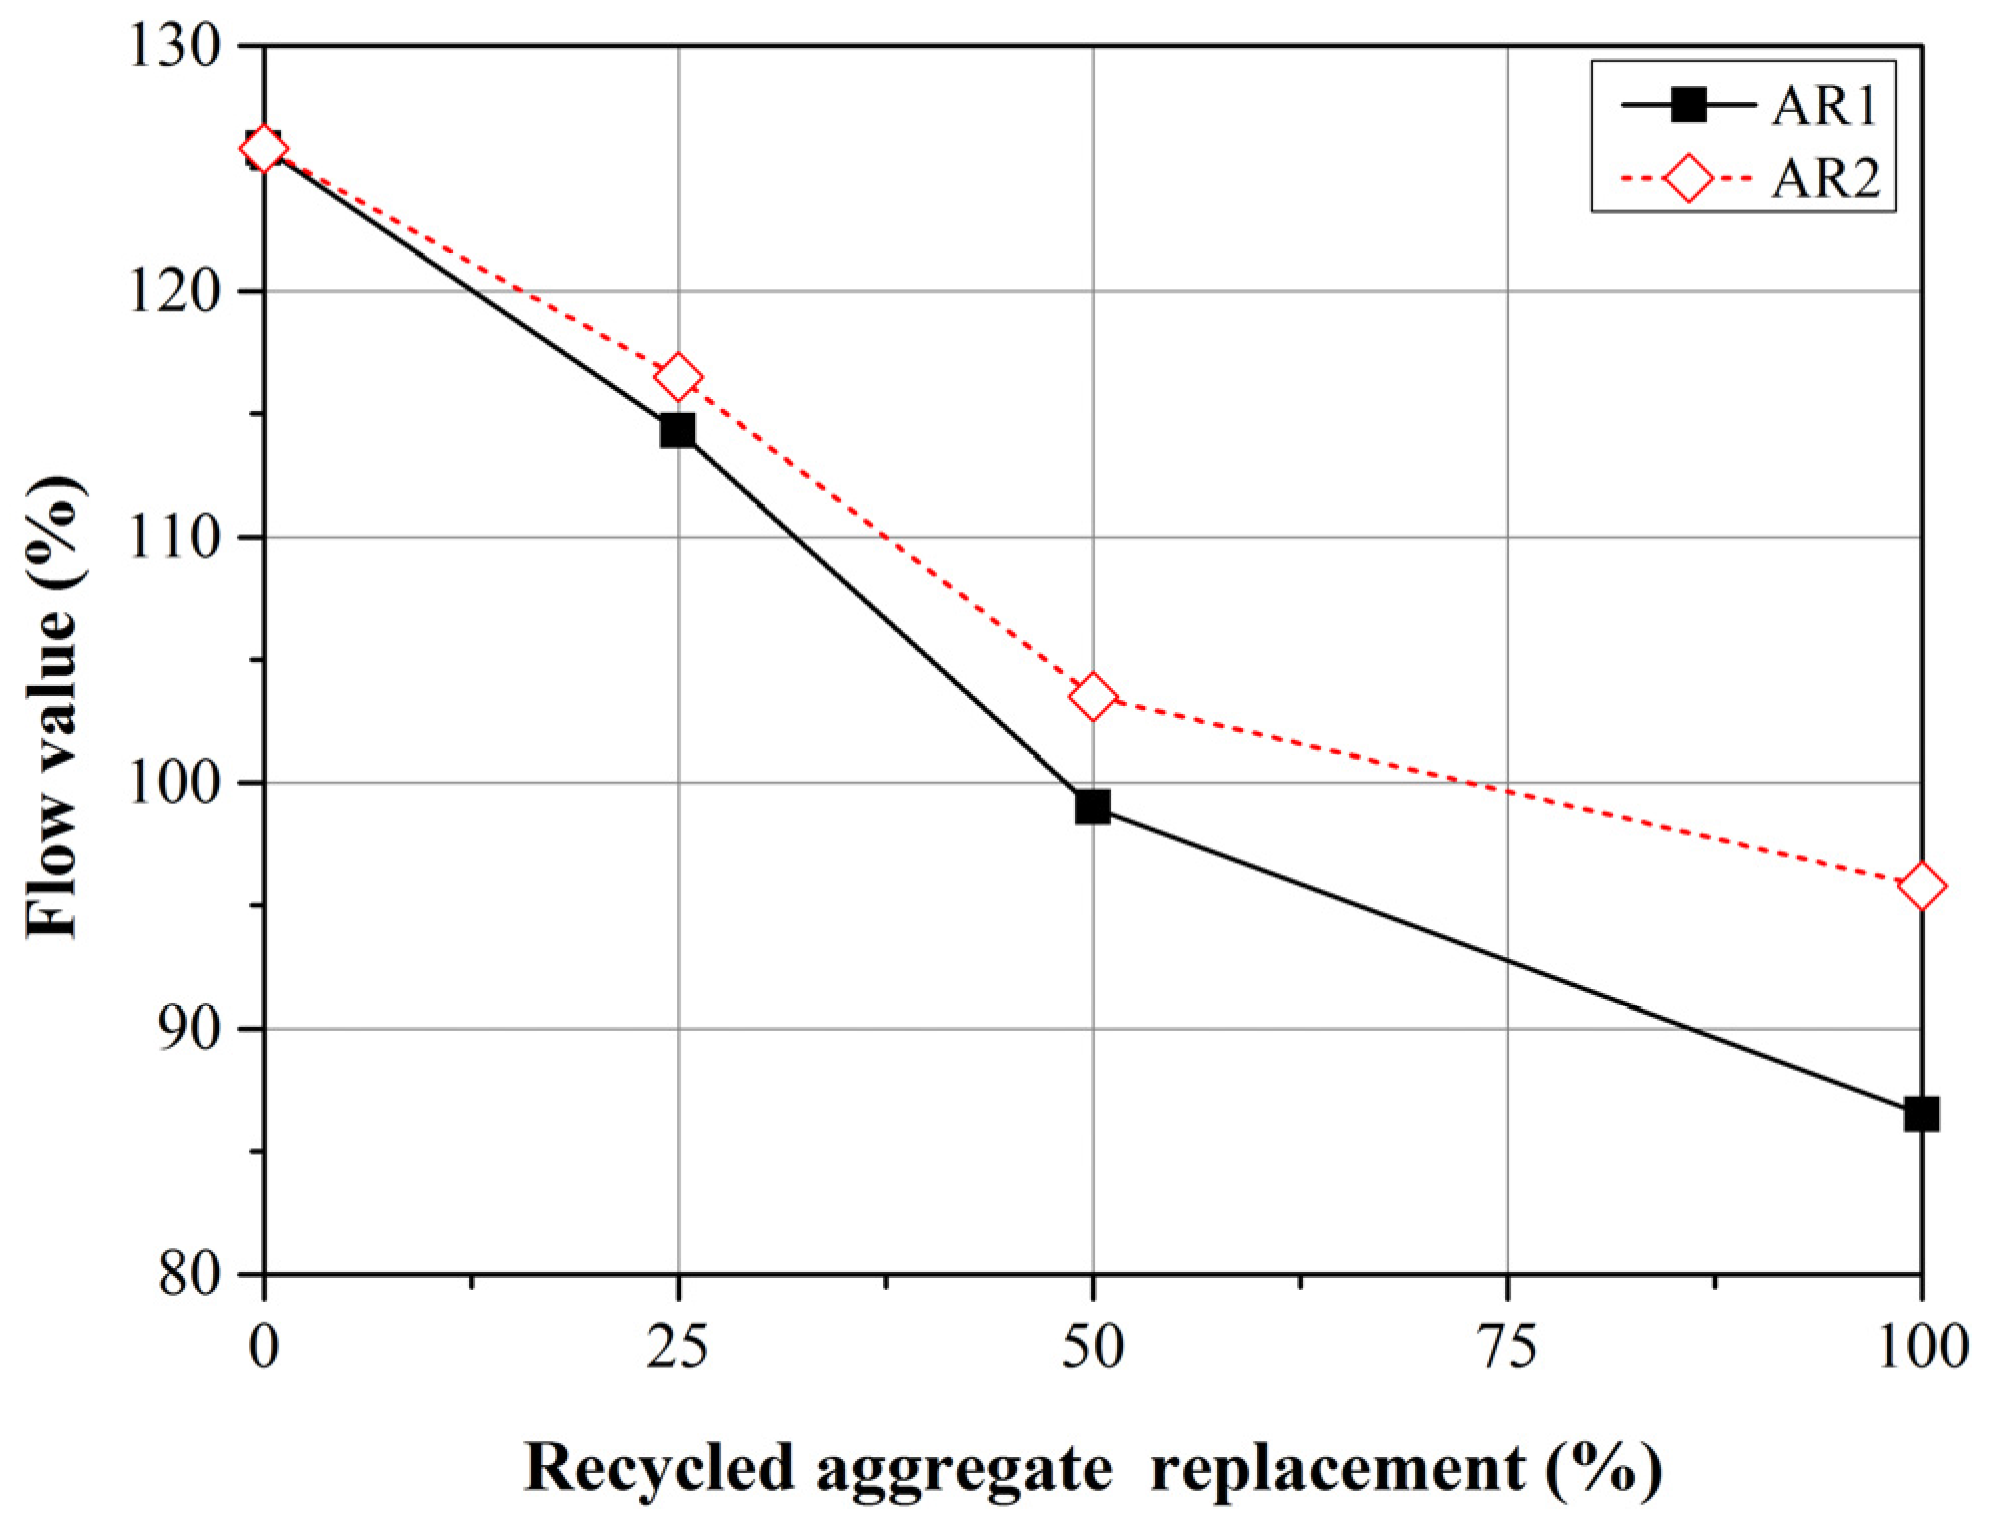
3.2. Flowability
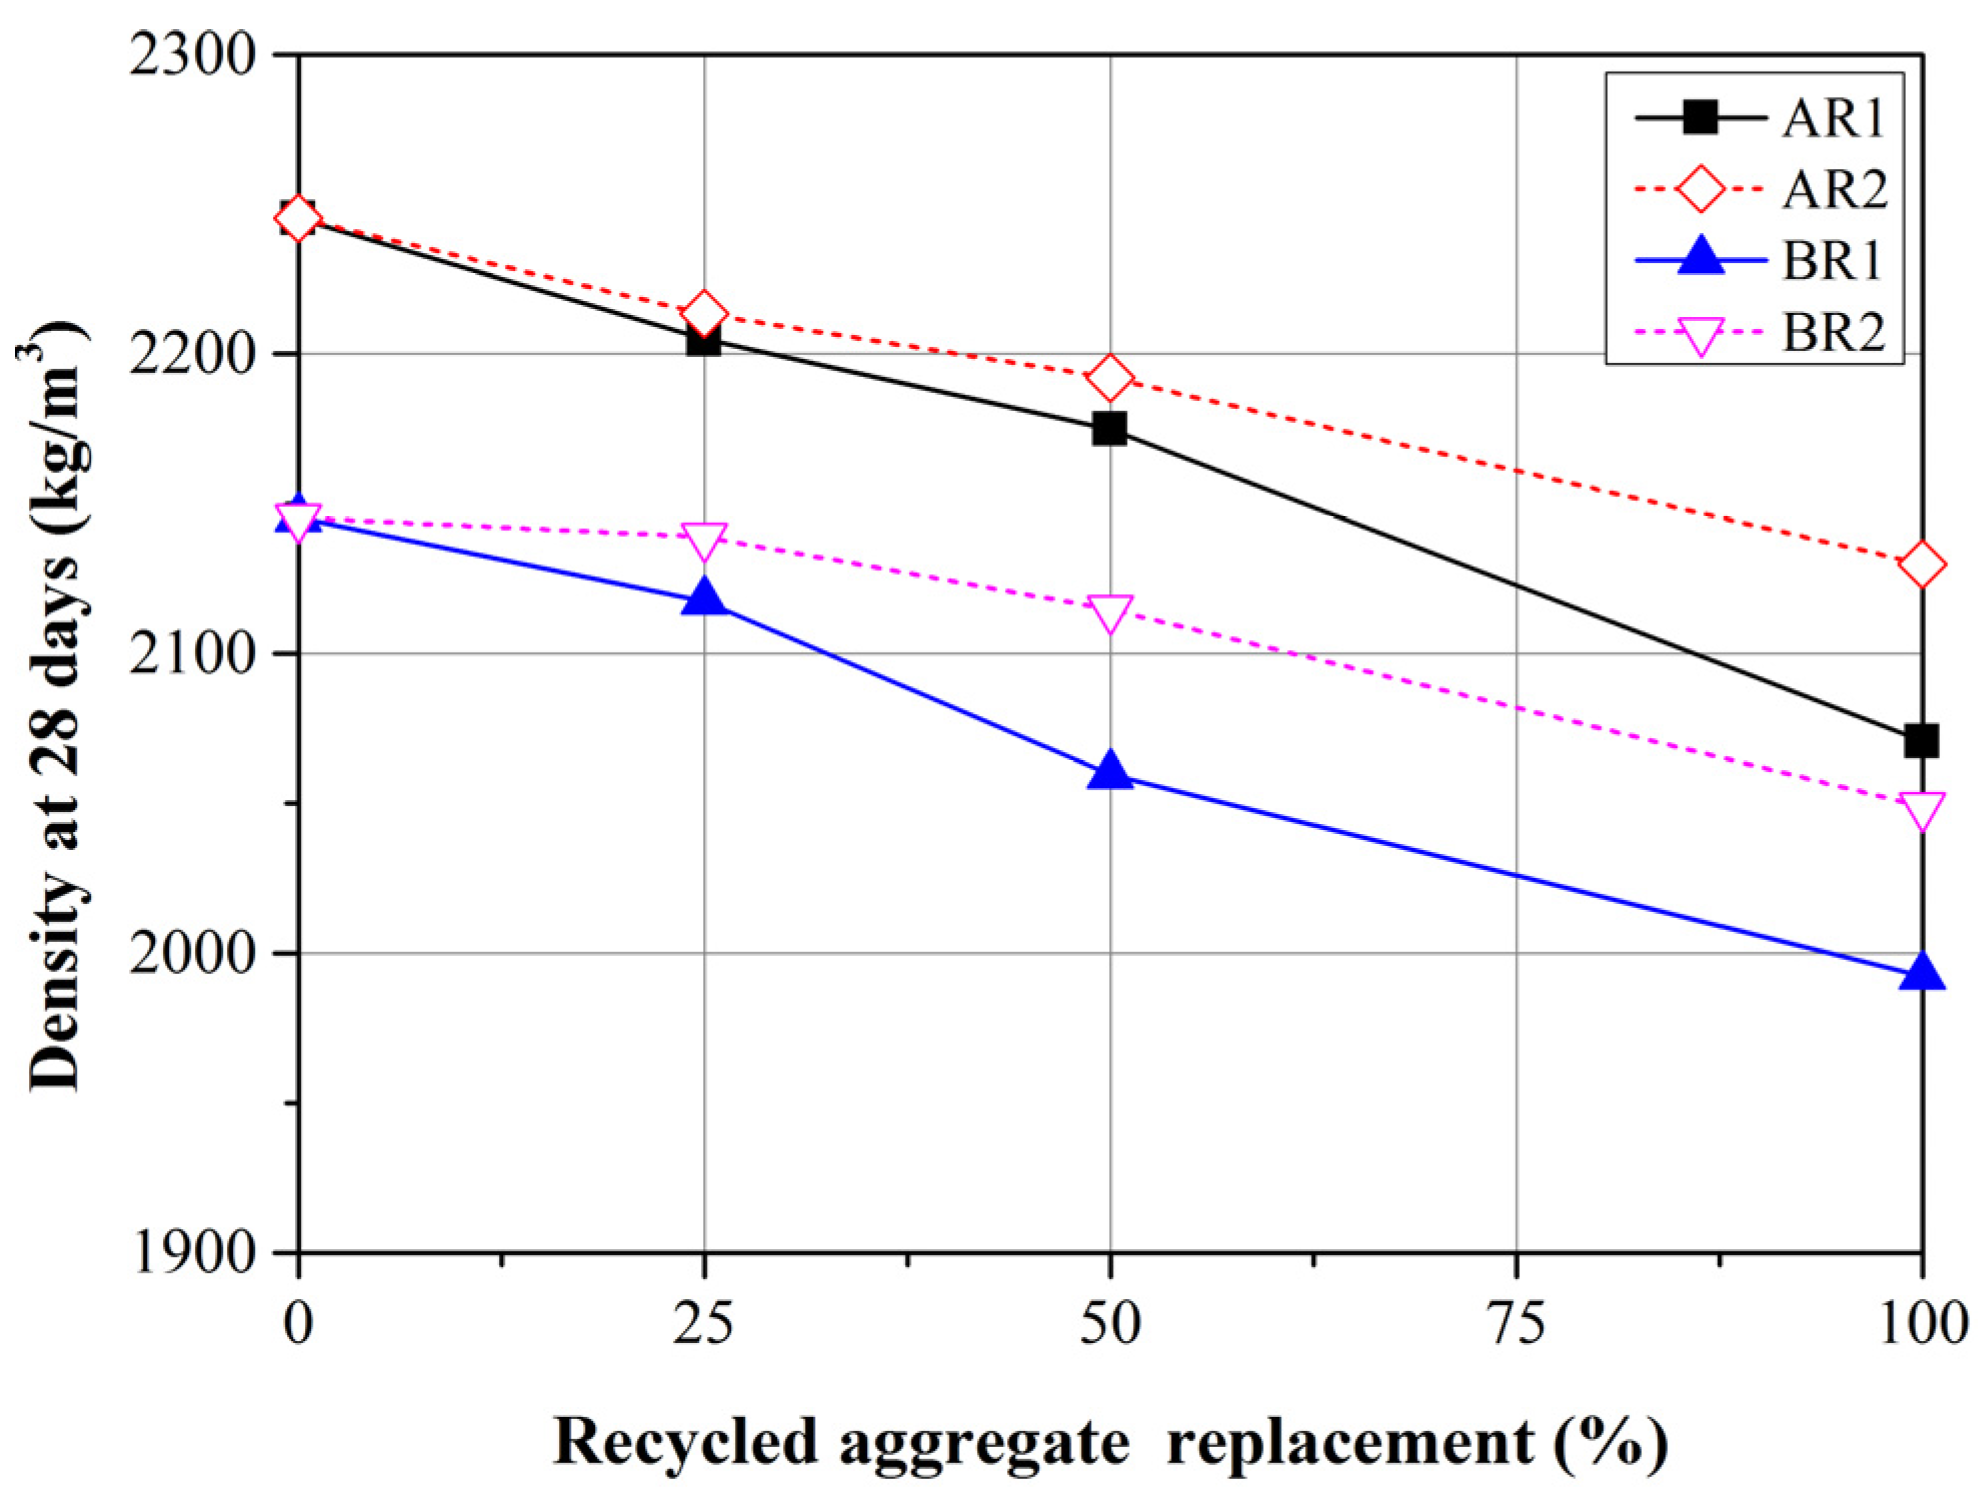
3.3. Density
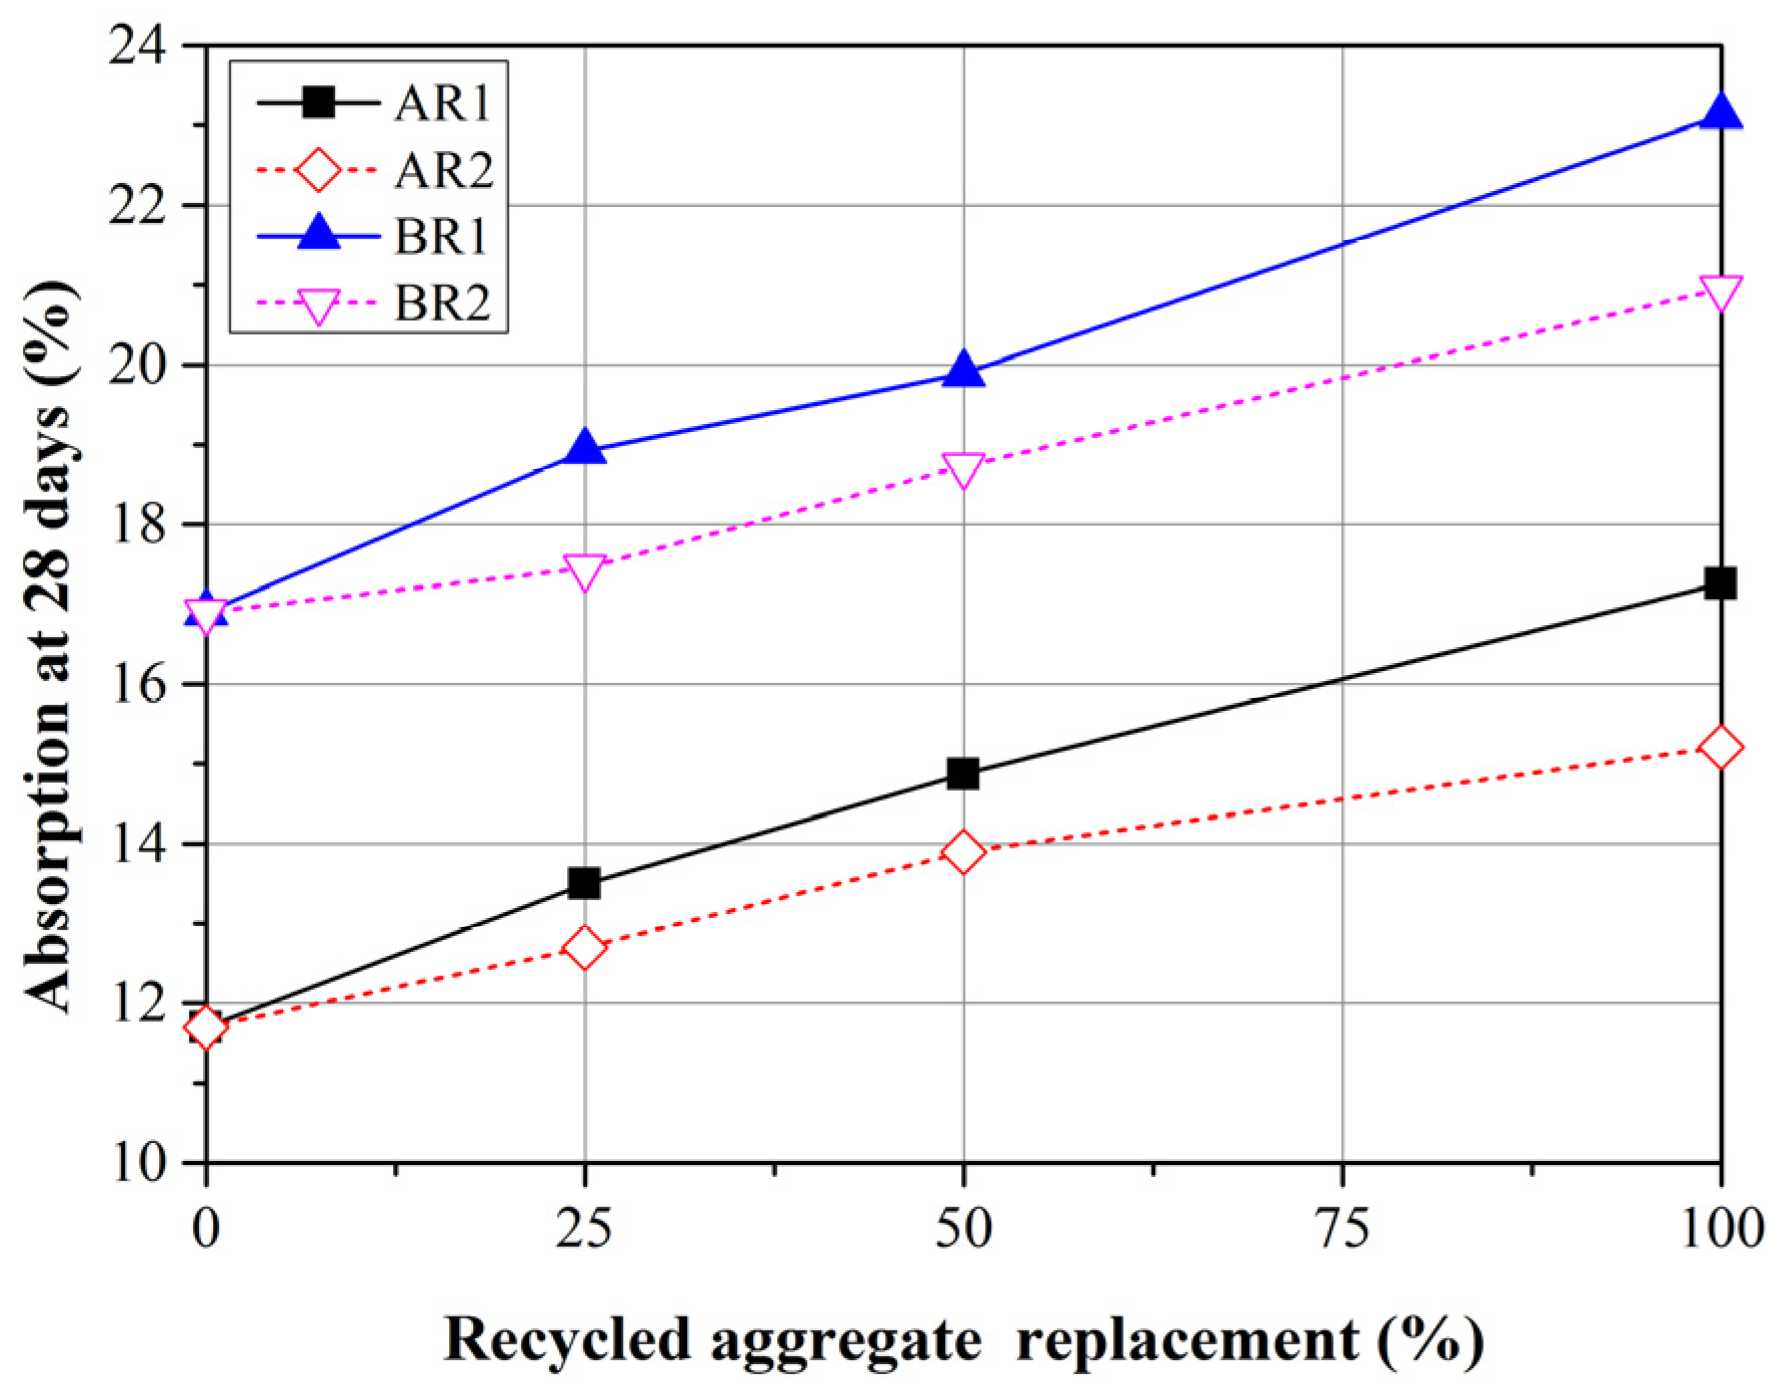
3.4. Absorption
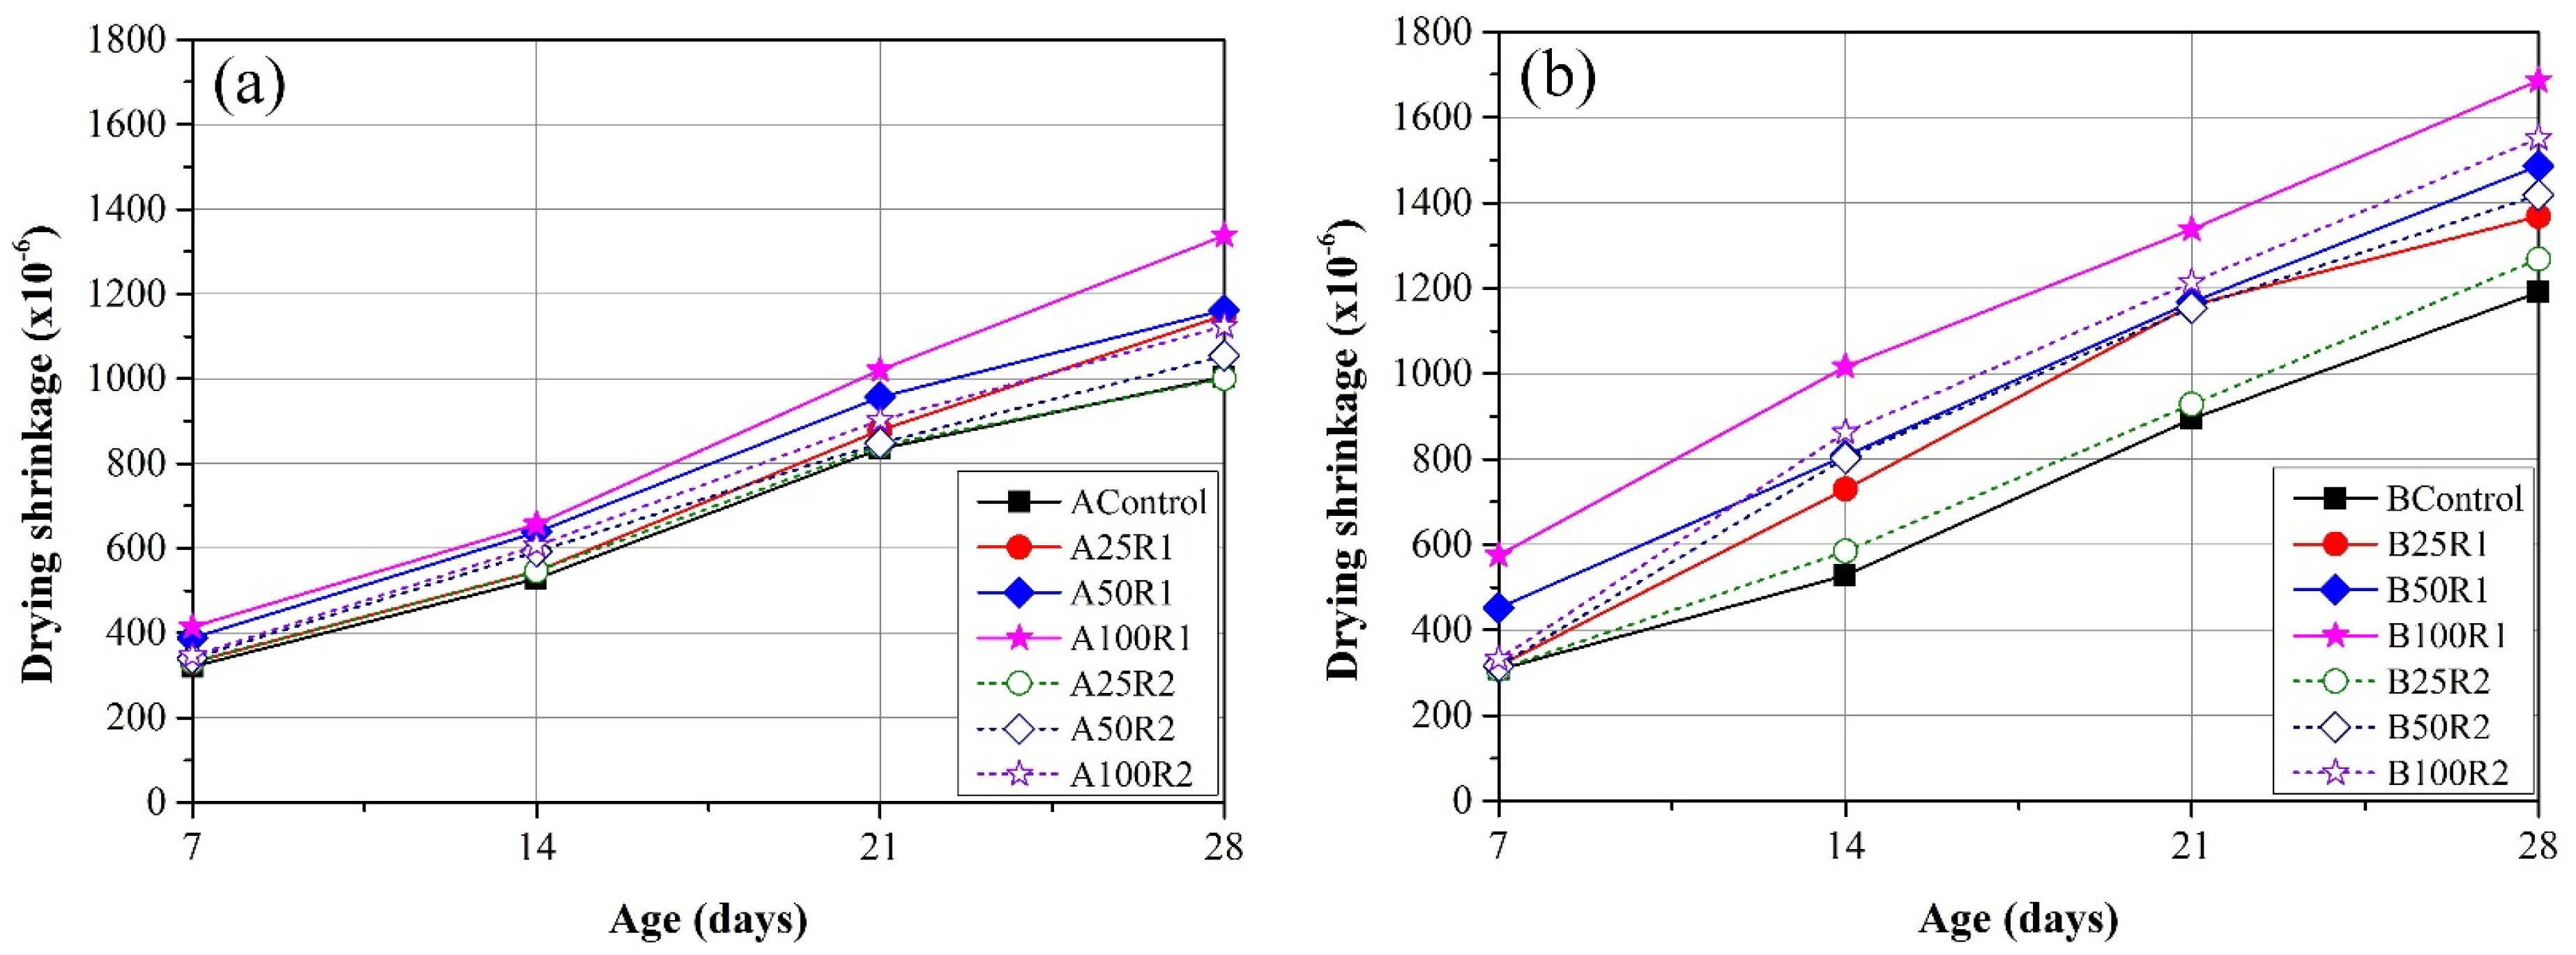
3.5. Drying Shrinkage

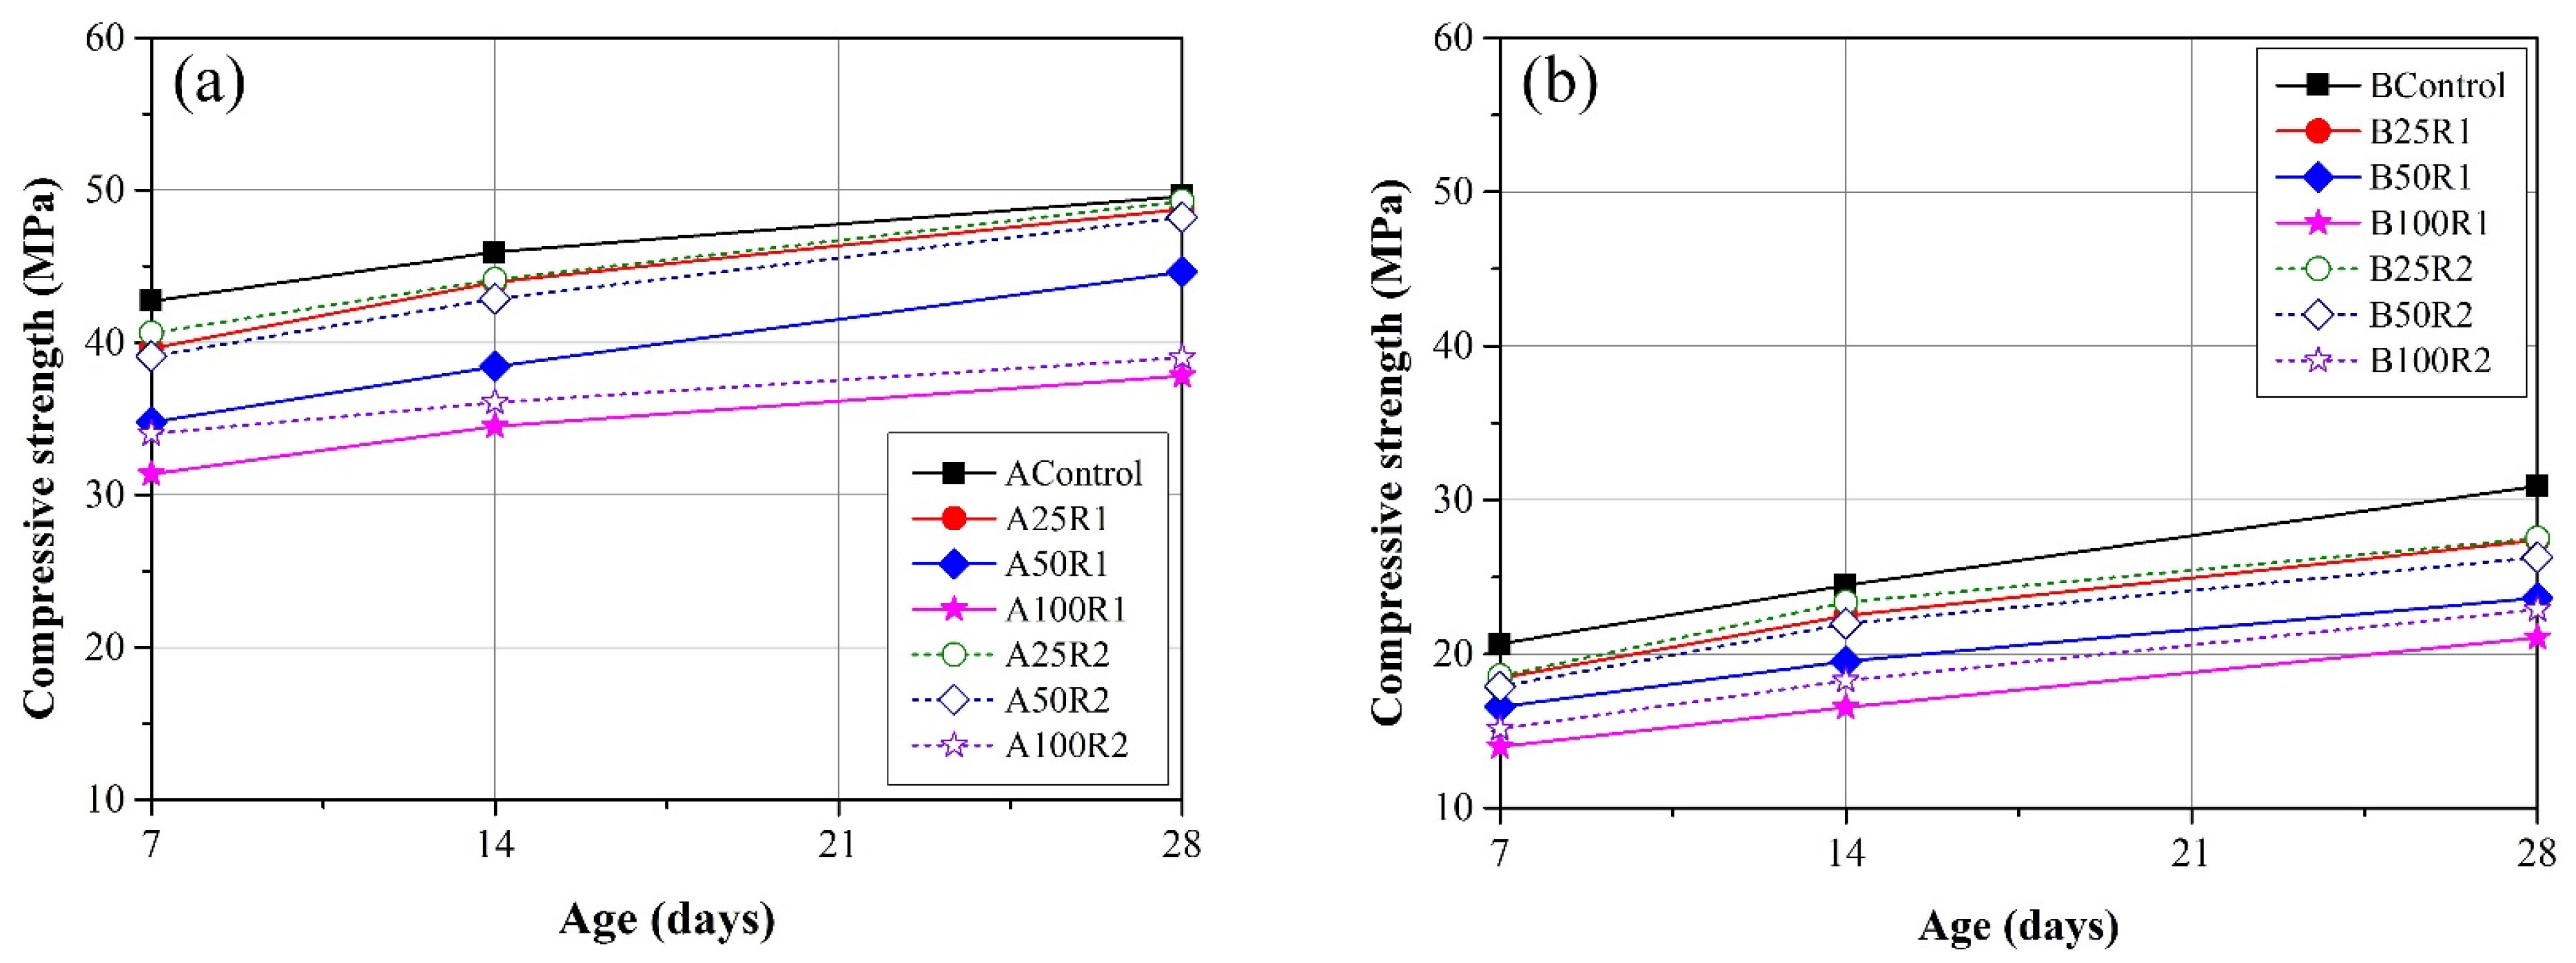
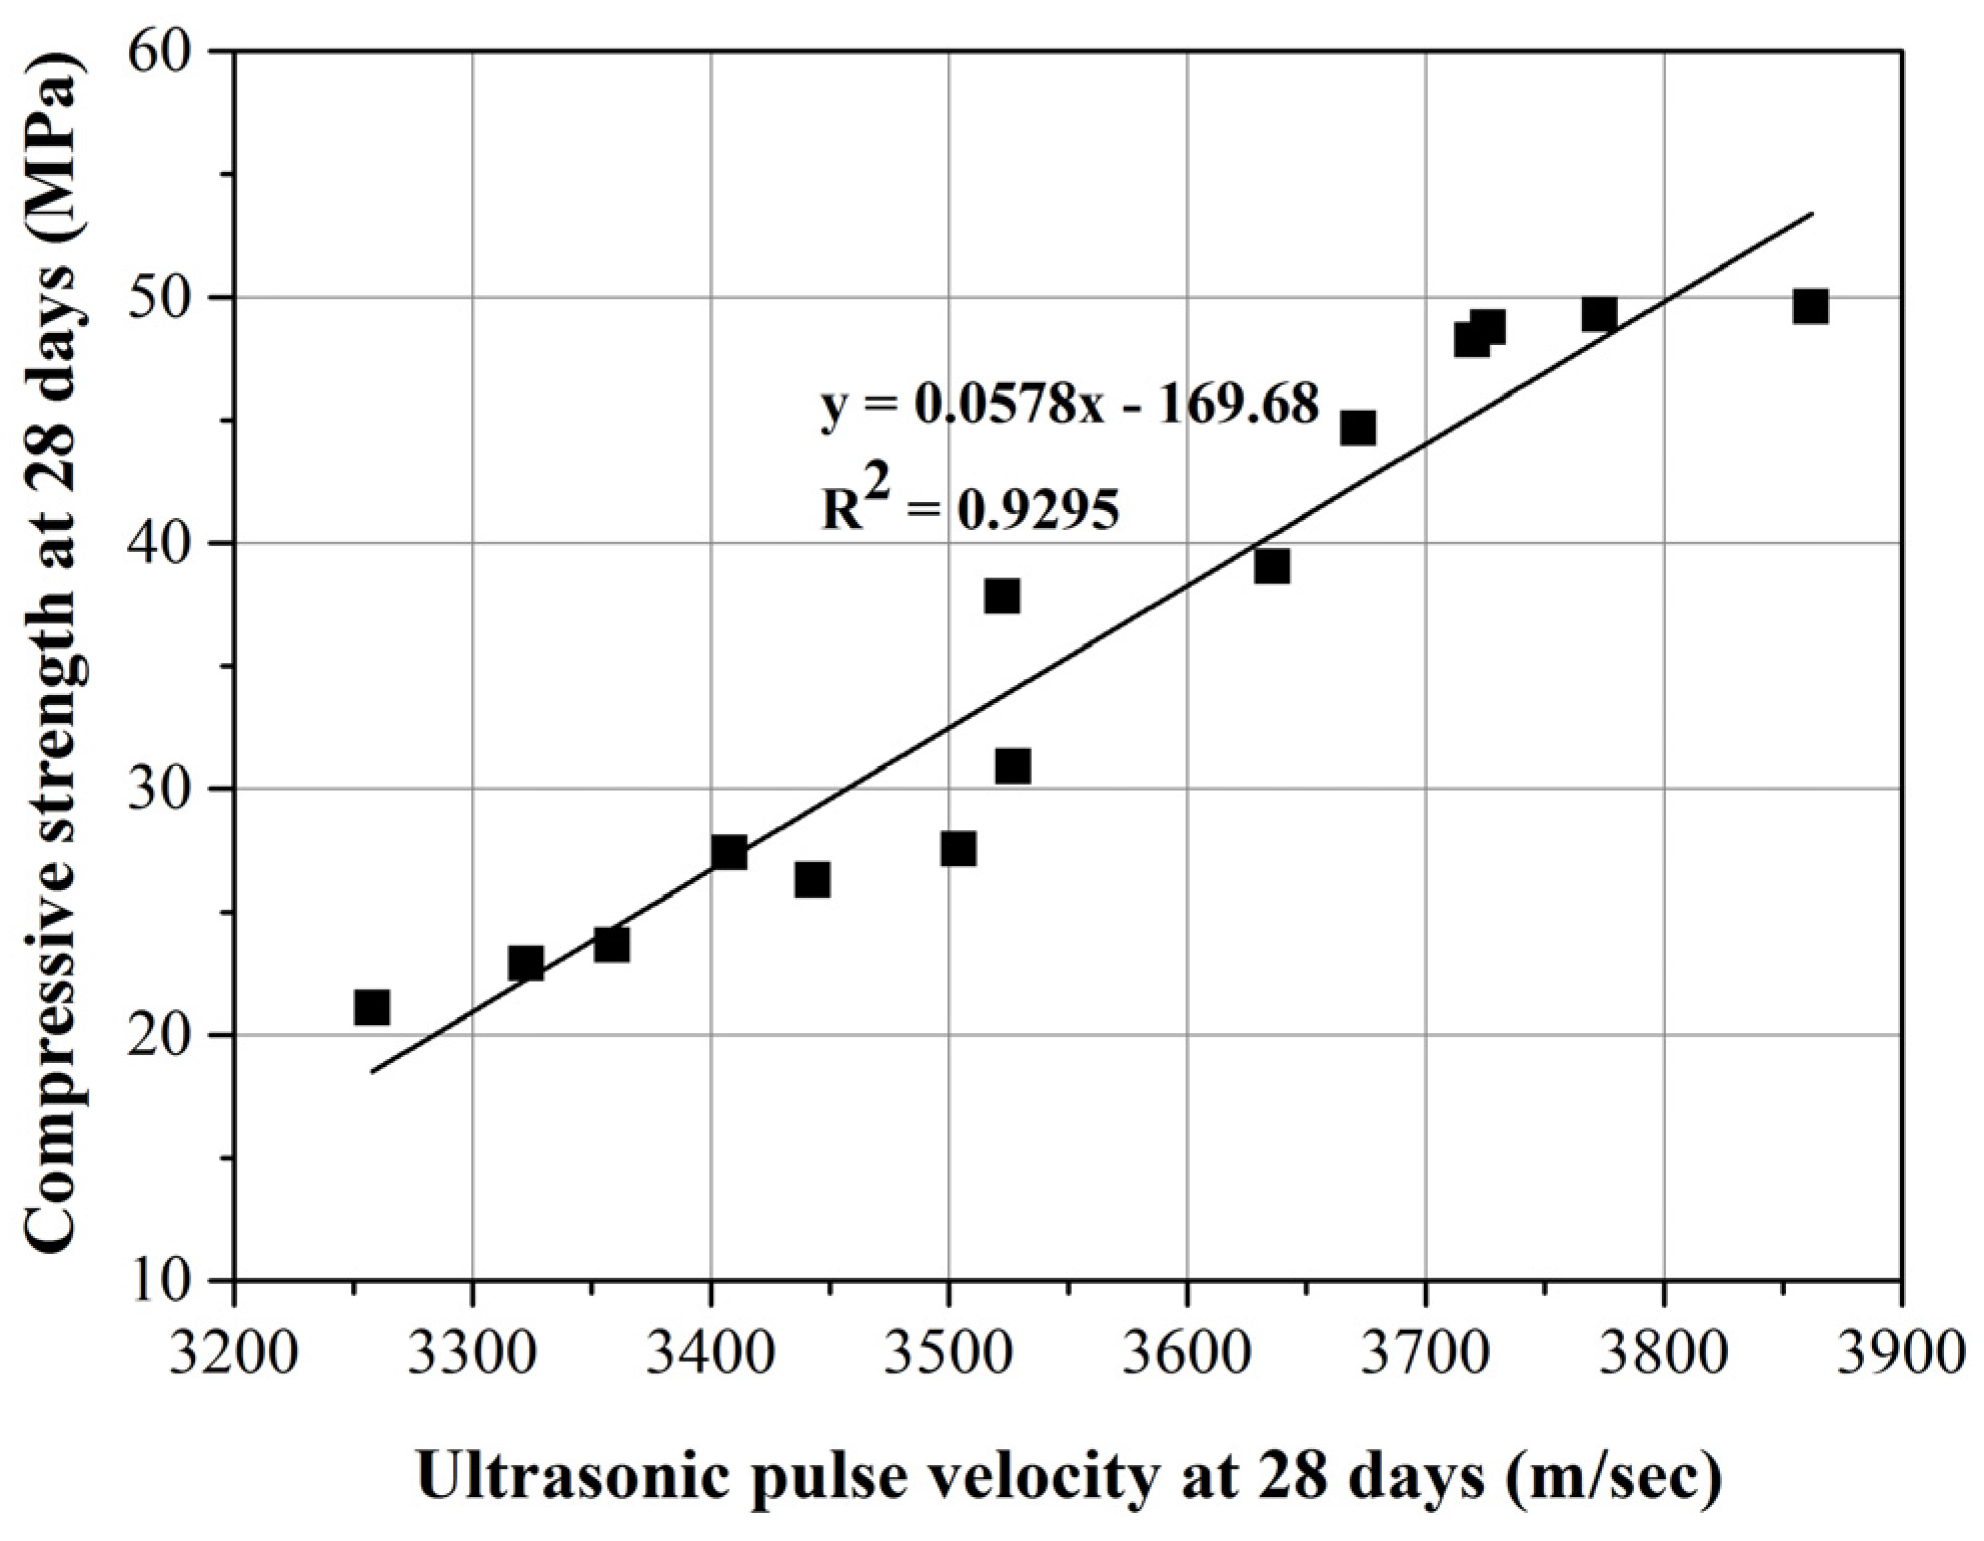
3.6. Compressive Strength

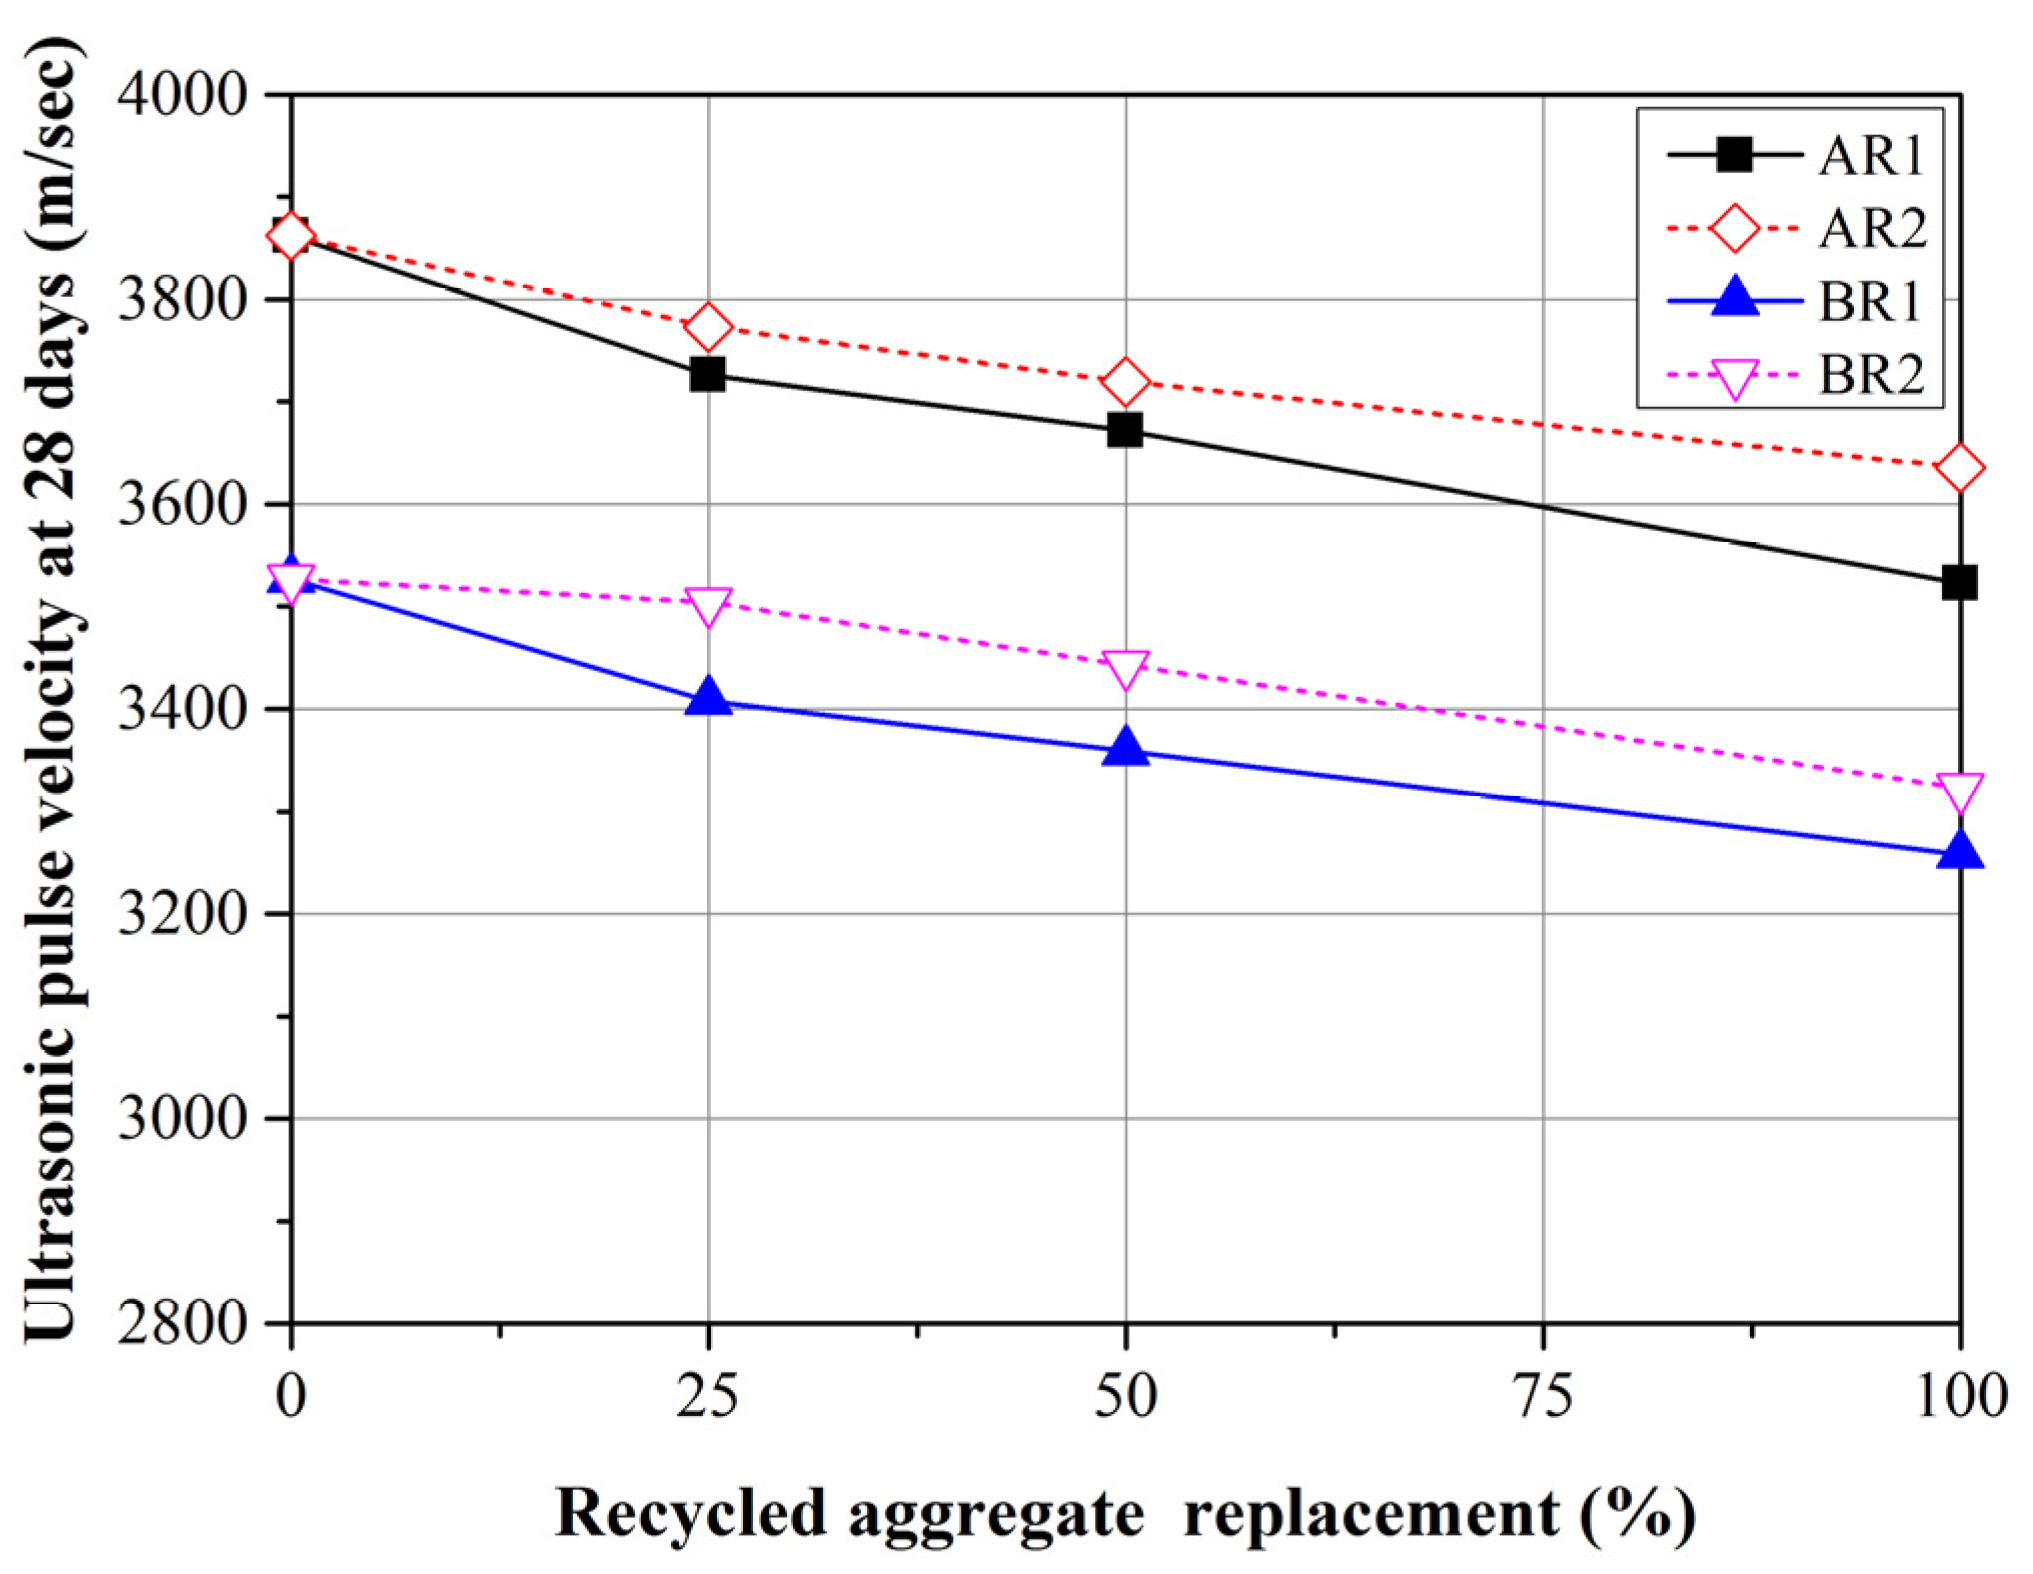
3.7. Ultrasonic Pulse Velocity (UPV)
4. Conclusions
- R2 has lower porosity, higher density, and lower water absorption than does R1, all of which are indicators of the superior quality of R2. This also demonstrates that the crushing process can significantly influence the quality of the resulting FRCA.
- In all of the mortars containing FRCA, an increase in the replacement ratio led to a reduction in flow values, density, compressive strength, and UPV values. This is a clear demonstration that the replacement ratio is an important factor influencing the physical and mechanical properties of the resulting mortar.
- When comparing mortars containing R1 or R2 at the same replacement ratio, the mortar containing R1 presented a lower flow value, lower density, higher absorption, higher drying shrinkage, lower compressive strength, and lower UPV values. This demonstrates that mortars containing R1 cannot match the physical or mechanical properties of R2, and further demonstrates the importance of the crushing process used in the production of FRCA.
- Our results demonstrate the superiority of mortars produced using aggregate processed from recycled concrete via multistage crushing to obtain only FRCA. Nonetheless, the performance benefits of using only fine recycled concrete aggregate must be balanced against the additional energy requirements and subsequent impact on the environment.
Author Contributions
Conflicts of Interest
References
- Fonseca, N.; de Brito, J.; Evangelista, L. The influence of curing conditions on the mechanical performance of concrete made with recycled concrete waste. Cement Concrete Compos. 2011, 33, 637–643. [Google Scholar]
- Choi, W.-C.; Yun, H.-D. Compressive behavior of reinforced concrete columns with recycled aggregate under uniaxial loading. Eng. Struct. 2012, 41, 285–293. [Google Scholar] [CrossRef]
- Ismail, S.; Ramli, M. Engineering properties of treated recycled concrete aggregate (RCA) for structural applications. Constr. Build. Mater. 2013, 44, 464–476. [Google Scholar] [CrossRef]
- Ma, H.; Xue, J.; Zhang, X.; Luo, D. Seismic performance of steel-reinforced recycled concrete columns under low cyclic loads. Constr. Build. Mater. 2013, 48, 229–237. [Google Scholar] [CrossRef]
- Huda, S.B.; Alam, M.S. Mechanical behavior of three generations of 100% repeated recycled coarse aggregate concrete. Constr. Build. Mater. 2014, 65, 574–582. [Google Scholar] [CrossRef]
- Pedro, D.; de Brito, J.; Evangelista, L. Influence of the use of recycled concrete aggregates from different sources on structural concrete. Constr. Build. Mater. 2014, 71, 141–151. [Google Scholar] [CrossRef]
- Soares, D.; de Brito, J.; Ferreira, J.; Pacheco, J. Use of coarse recycled aggregates from precast concrete rejects: Mechanical and durability performance. Constr. Build. Mater. 2014, 71, 263–272. [Google Scholar] [CrossRef]
- Thomas, C.; Setién, J.; Polanco, J.A.; Lombillo, I.; Cimentada, A. Fatigue limit of recycled aggregate concrete. Constr. Build. Mater. 2014, 52, 146–154. [Google Scholar] [CrossRef]
- Brand, A.S.; Roesler, J.R.; Salas, A. Initial moisture and mixing effects on higher quality recycled coarse aggregate concrete. Constr. Build. Mater. 2015, 79, 83–89. [Google Scholar] [CrossRef]
- Huda, S.B.; Shahria Alam, M. Mechanical and freeze-thaw durability properties of recycled aggregate concrete made with recycled coarse aggregate. J. Mater. Civ. Eng. 2015, 04015003. [Google Scholar] [CrossRef]
- Manzi, S.; Mazzotti, C.; Bignozzi, M.C. Short and long-term behavior of structural concrete with recycled concrete aggregate. Cement Concrete Compos. 2013, 37, 312–318. [Google Scholar] [CrossRef]
- Evangelista, L.; de Brito, J. Mechanical behaviour of concrete made with fine recycled concrete aggregates. Cement Concrete Compos. 2007, 29, 397–401. [Google Scholar] [CrossRef]
- Evangelista, L.; de Brito, J. Durability performance of concrete made with fine recycled concrete aggregates. Cement Concrete Compos. 2010, 32, 9–14. [Google Scholar] [CrossRef]
- Pereira, P.; Evangelista, L.; de Brito, J. The effect of superplasticisers on the workability and compressive strength of concrete made with fine recycled concrete aggregates. Constr. Build. Mater. 2012, 28, 722–729. [Google Scholar] [CrossRef]
- Pereira, P.; Evangelista, L.; de Brito, J. The effect of superplasticizers on the mechanical performance of concrete made with fine recycled concrete aggregates. Cement Concrete Compos. 2012, 34, 1044–1052. [Google Scholar] [CrossRef]
- Khatib, J.M. Properties of concrete incorporating fine recycled aggregate. Cement Concrete Res. 2005, 35, 763–769. [Google Scholar] [CrossRef]
- Shui, Z.; Xuan, D.; Wan, H.; Cao, B. Rehydration reactivity of recycled mortar from concrete waste experienced to thermal treatment. Constr. Build. Mater. 2008, 22, 1723–1729. [Google Scholar] [CrossRef]
- Neno, C.; de Brito, J.; Veiga, R. Using fine recycled concrete aggregate for mortar production. Mater. Res. 2013. [Google Scholar] [CrossRef]
- Khoshkenari, A.G.; Shafigh, P.; Moghimi, M.; Mahmud, H.B. The role of 0–2 mm fine recycled concrete aggregate on the compressive and splitting tensile strengths of recycled concrete aggregate concrete. Mater. Design 2014, 64, 345–354. [Google Scholar] [CrossRef]
- Lee, S.T. Influence of recycled fine aggregates on the resistance of mortars to magnesium sulfate attack. Waste Manag. 2009, 29, 2385–2391. [Google Scholar] [CrossRef] [PubMed]
- Sim, J.; Park, C. Compressive strength and resistance to chloride ion penetration and carbonation of recycled aggregate concrete with varying amount of fly ash and fine recycled aggregate. Waste Manag. 2011, 31, 2352–2360. [Google Scholar] [CrossRef] [PubMed]
- Florea, M.V.A.; Brouwers, H.J.H. Properties of various size fractions of crushed concrete related to process conditions and re-use. Cement Concrete Res. 2013, 52, 11–21. [Google Scholar] [CrossRef]
- Ulsen, C.; Kahn, H.; Hawlitschek, G.; Masini, E.A.; Angulo, S.C.; John, V.M. Production of recycled sand from construction and demolition waste. Constr. Build. Mater. 2013, 40, 1168–1173. [Google Scholar] [CrossRef]
- Song, I.H.; Ryou, J.S. Hybrid techniques for quality improvement of recycled fine aggregate. Constr. Build. Mater. 2014, 72, 56–64. [Google Scholar] [CrossRef]
- Koshiro, Y.; Ichise, K. Application of entire concrete waste reuse model to produce recycled aggregate class H. Constr. Build. Mater. 2014, 67, 308–314. [Google Scholar] [CrossRef]
- ASTM International, Standard Specification for Concrete Aggregates; ASTM C33M-13; ASTM International: West Conshohocken, PA, USA, 2013.
- ASTM International, Standard Test Method for Density, Relative Density (Specific Gravity), and Absorption of Fine Aggregate; ASTM C128-12; ASTM International: West Conshohocken, PA, USA, 2012.
- ASTM International, Standard Test Method for Sieve Analysis of Fine and Coarse Aggregates; ASTM C136M-14; ASTM International: West Conshohocken, PA, USA, 2014.
- ASTM International, Standard Test Method for Surface Moisture in Fine Aggregate; ASTM C70-13; ASTM International: West Conshohocken, PA, USA, 2013.
- ASTM International, Standard Test Method for Flow of Hydraulic Cement Mortar; ASTM C1437-13; ASTM International: West Conshohocken, PA, USA, 2013.
- ASTM International, Standard Test Method for Density, Absorption, and Voids in Hardened Concrete; ASTM C642-13; ASTM International: West Conshohocken, PA, USA, 2013.
- ASTM International, Standard Test Method for Drying Shrinkage of Mortar Containing Hydraulic Cement; ASTM C596-09; ASTM International: West Conshohocken, PA, USA, 2009.
- ASTM International, Standard Test Method for Compressive Strength of Hydraulic Cement Mortars (Using 2-in. or [50-mm] Cube Specimens); ASTM C109M-13; ASTM International: West Conshohocken, PA, USA, 2013.
- ASTM International, Standard Test Method for Pulse Velocity Through Concrete; ASTM C597-09; ASTM International: West Conshohocken, PA, USA, 2009.
- Kou, S.C.; Poon, C.S. Properties of self-compacting concrete prepared with coarse and fine recycled concrete aggregates. Cement Concrete Compos. 2009, 31, 622–627. [Google Scholar] [CrossRef]
© 2015 by the authors; licensee MDPI, Basel, Switzerland. This article is an open access article distributed under the terms and conditions of the Creative Commons Attribution license (http://creativecommons.org/licenses/by/4.0/).
Share and Cite
Fan, C.-C.; Huang, R.; Hwang, H.; Chao, S.-J. The Effects of Different Fine Recycled Concrete Aggregates on the Properties of Mortar. Materials 2015, 8, 2658-2672. https://doi.org/10.3390/ma8052658
Fan C-C, Huang R, Hwang H, Chao S-J. The Effects of Different Fine Recycled Concrete Aggregates on the Properties of Mortar. Materials. 2015; 8(5):2658-2672. https://doi.org/10.3390/ma8052658
Chicago/Turabian StyleFan, Cheng-Chih, Ran Huang, Howard Hwang, and Sao-Jeng Chao. 2015. "The Effects of Different Fine Recycled Concrete Aggregates on the Properties of Mortar" Materials 8, no. 5: 2658-2672. https://doi.org/10.3390/ma8052658
APA StyleFan, C.-C., Huang, R., Hwang, H., & Chao, S.-J. (2015). The Effects of Different Fine Recycled Concrete Aggregates on the Properties of Mortar. Materials, 8(5), 2658-2672. https://doi.org/10.3390/ma8052658