
Processing and Characterization of Cellulose Nanocrystals/Polylactic Acid Nanocomposite Films


Abstract
:1. Introduction
2. Experimental Section
2.1. Materials
2.2. Characterization
2.3. Fabrication of Films
3. Results and Discussion
3.1. Film Fracture Surface Morphology

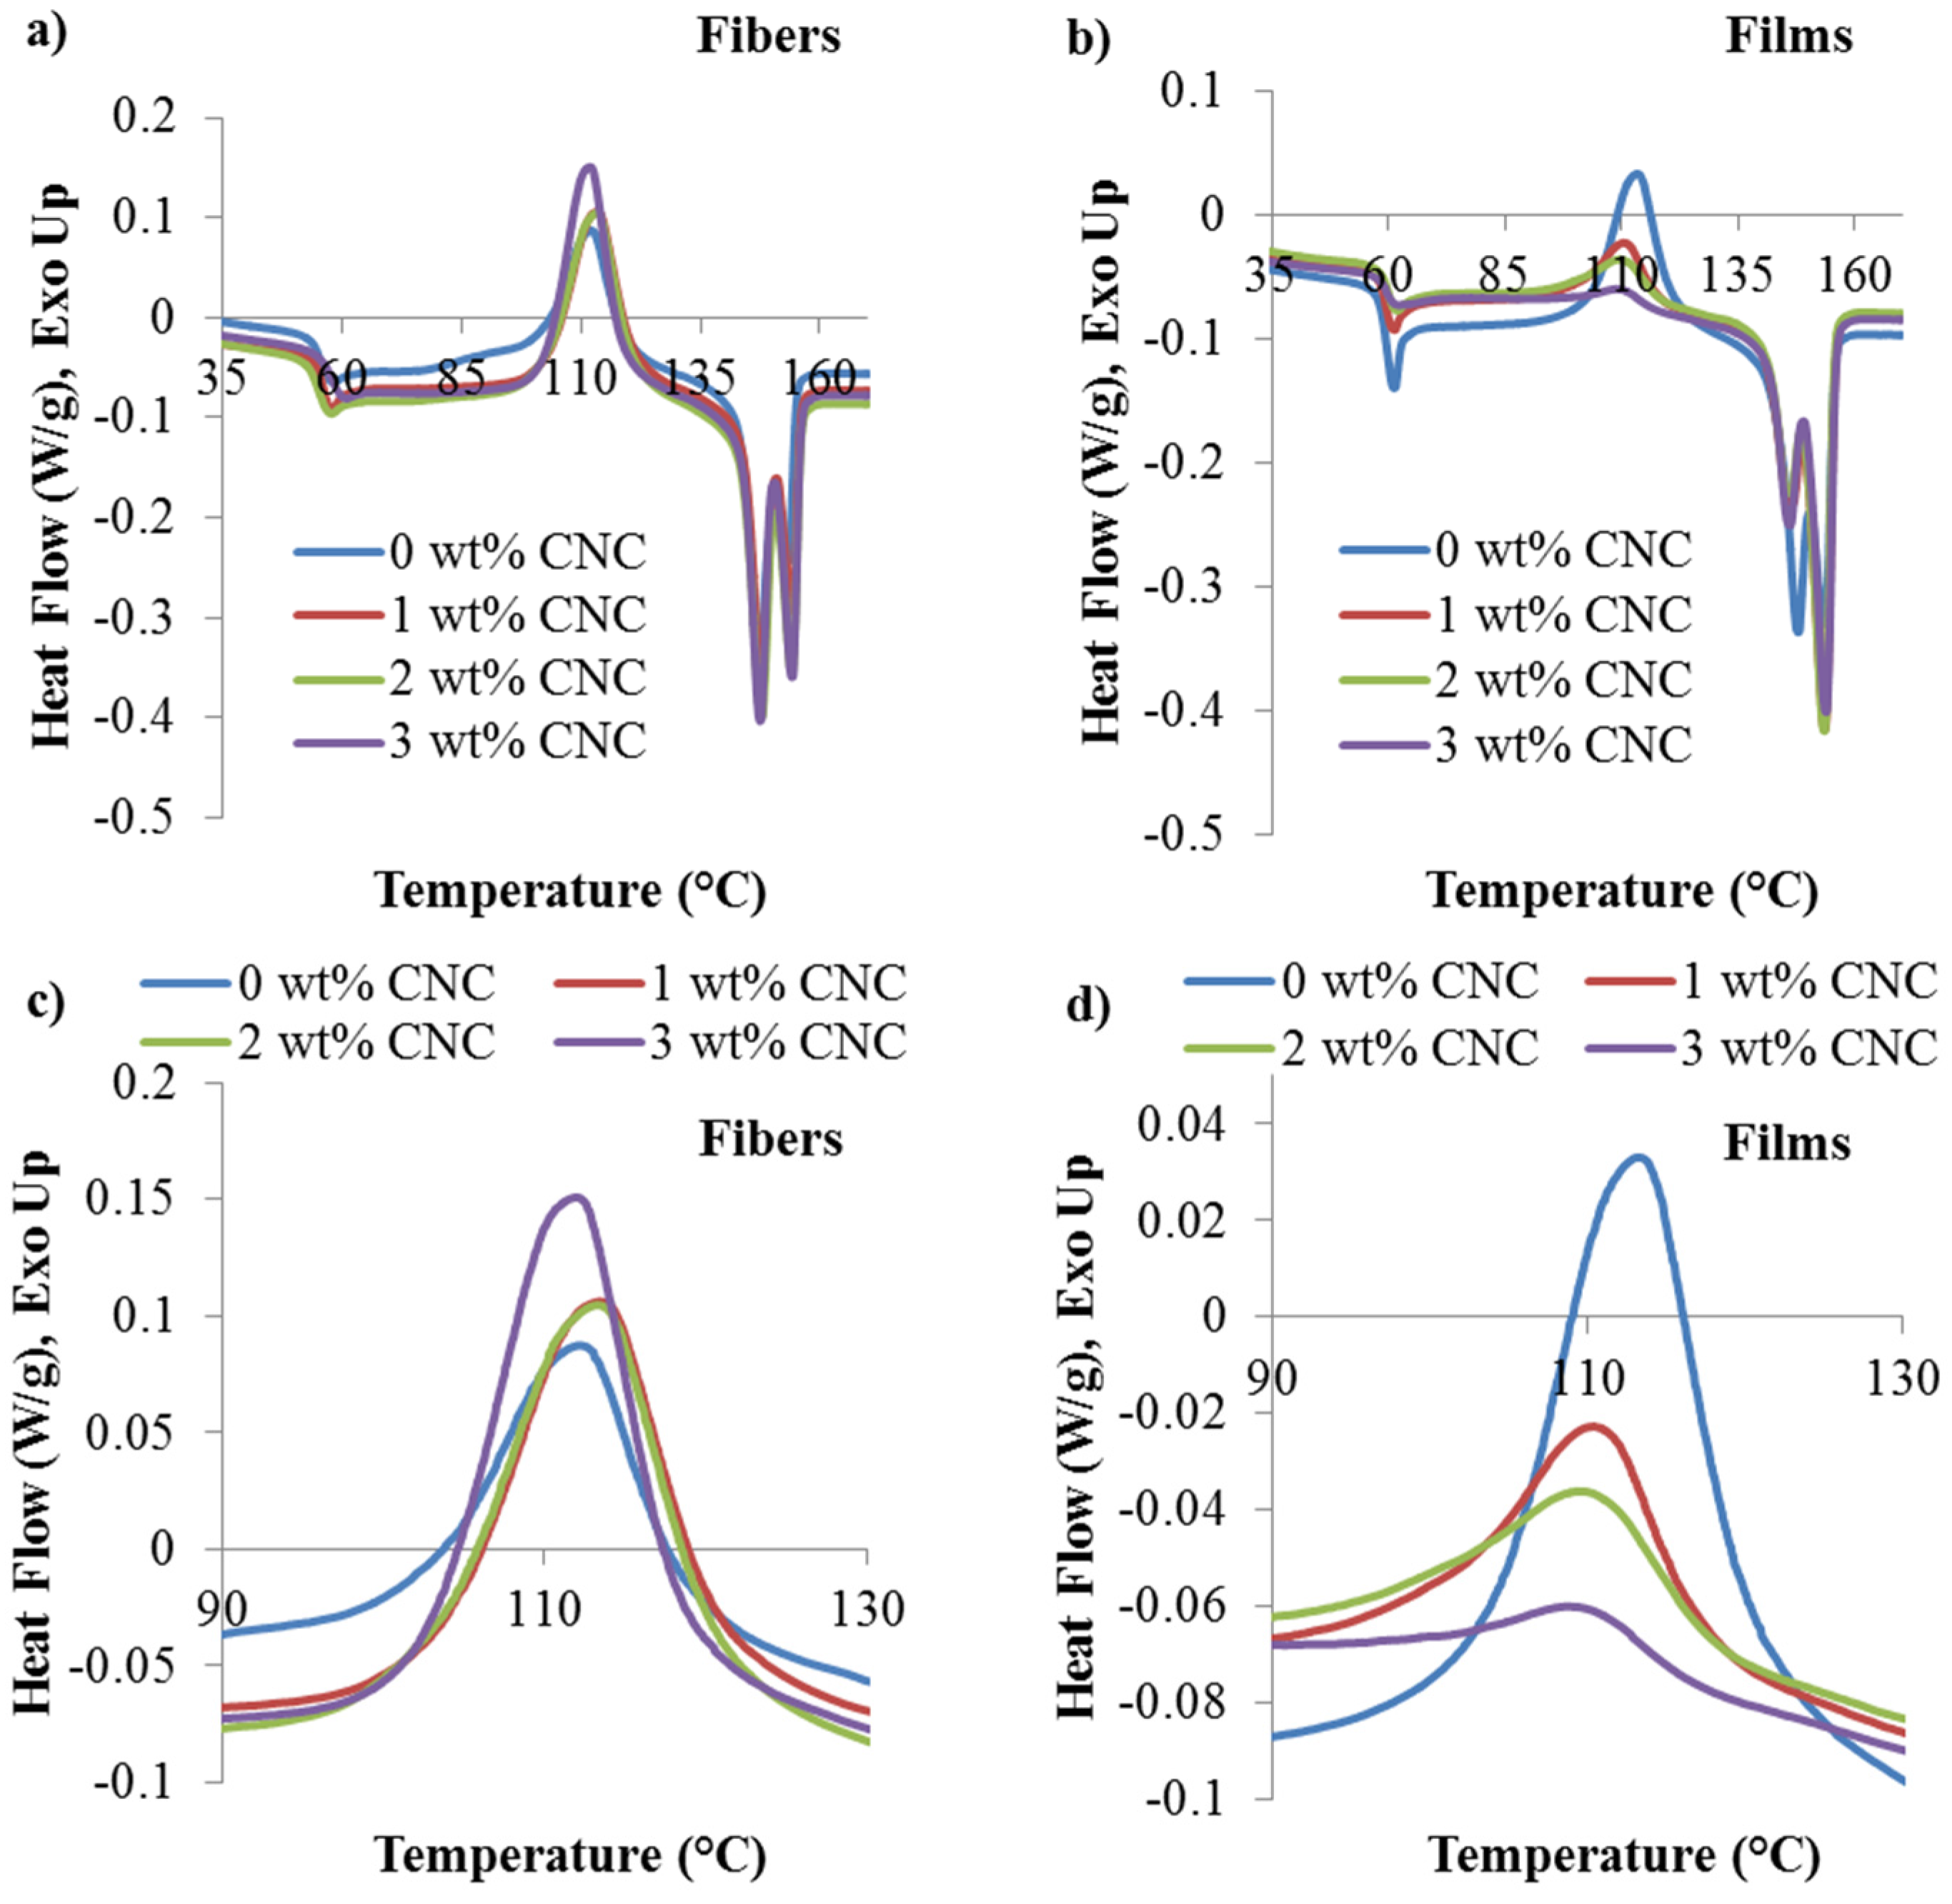
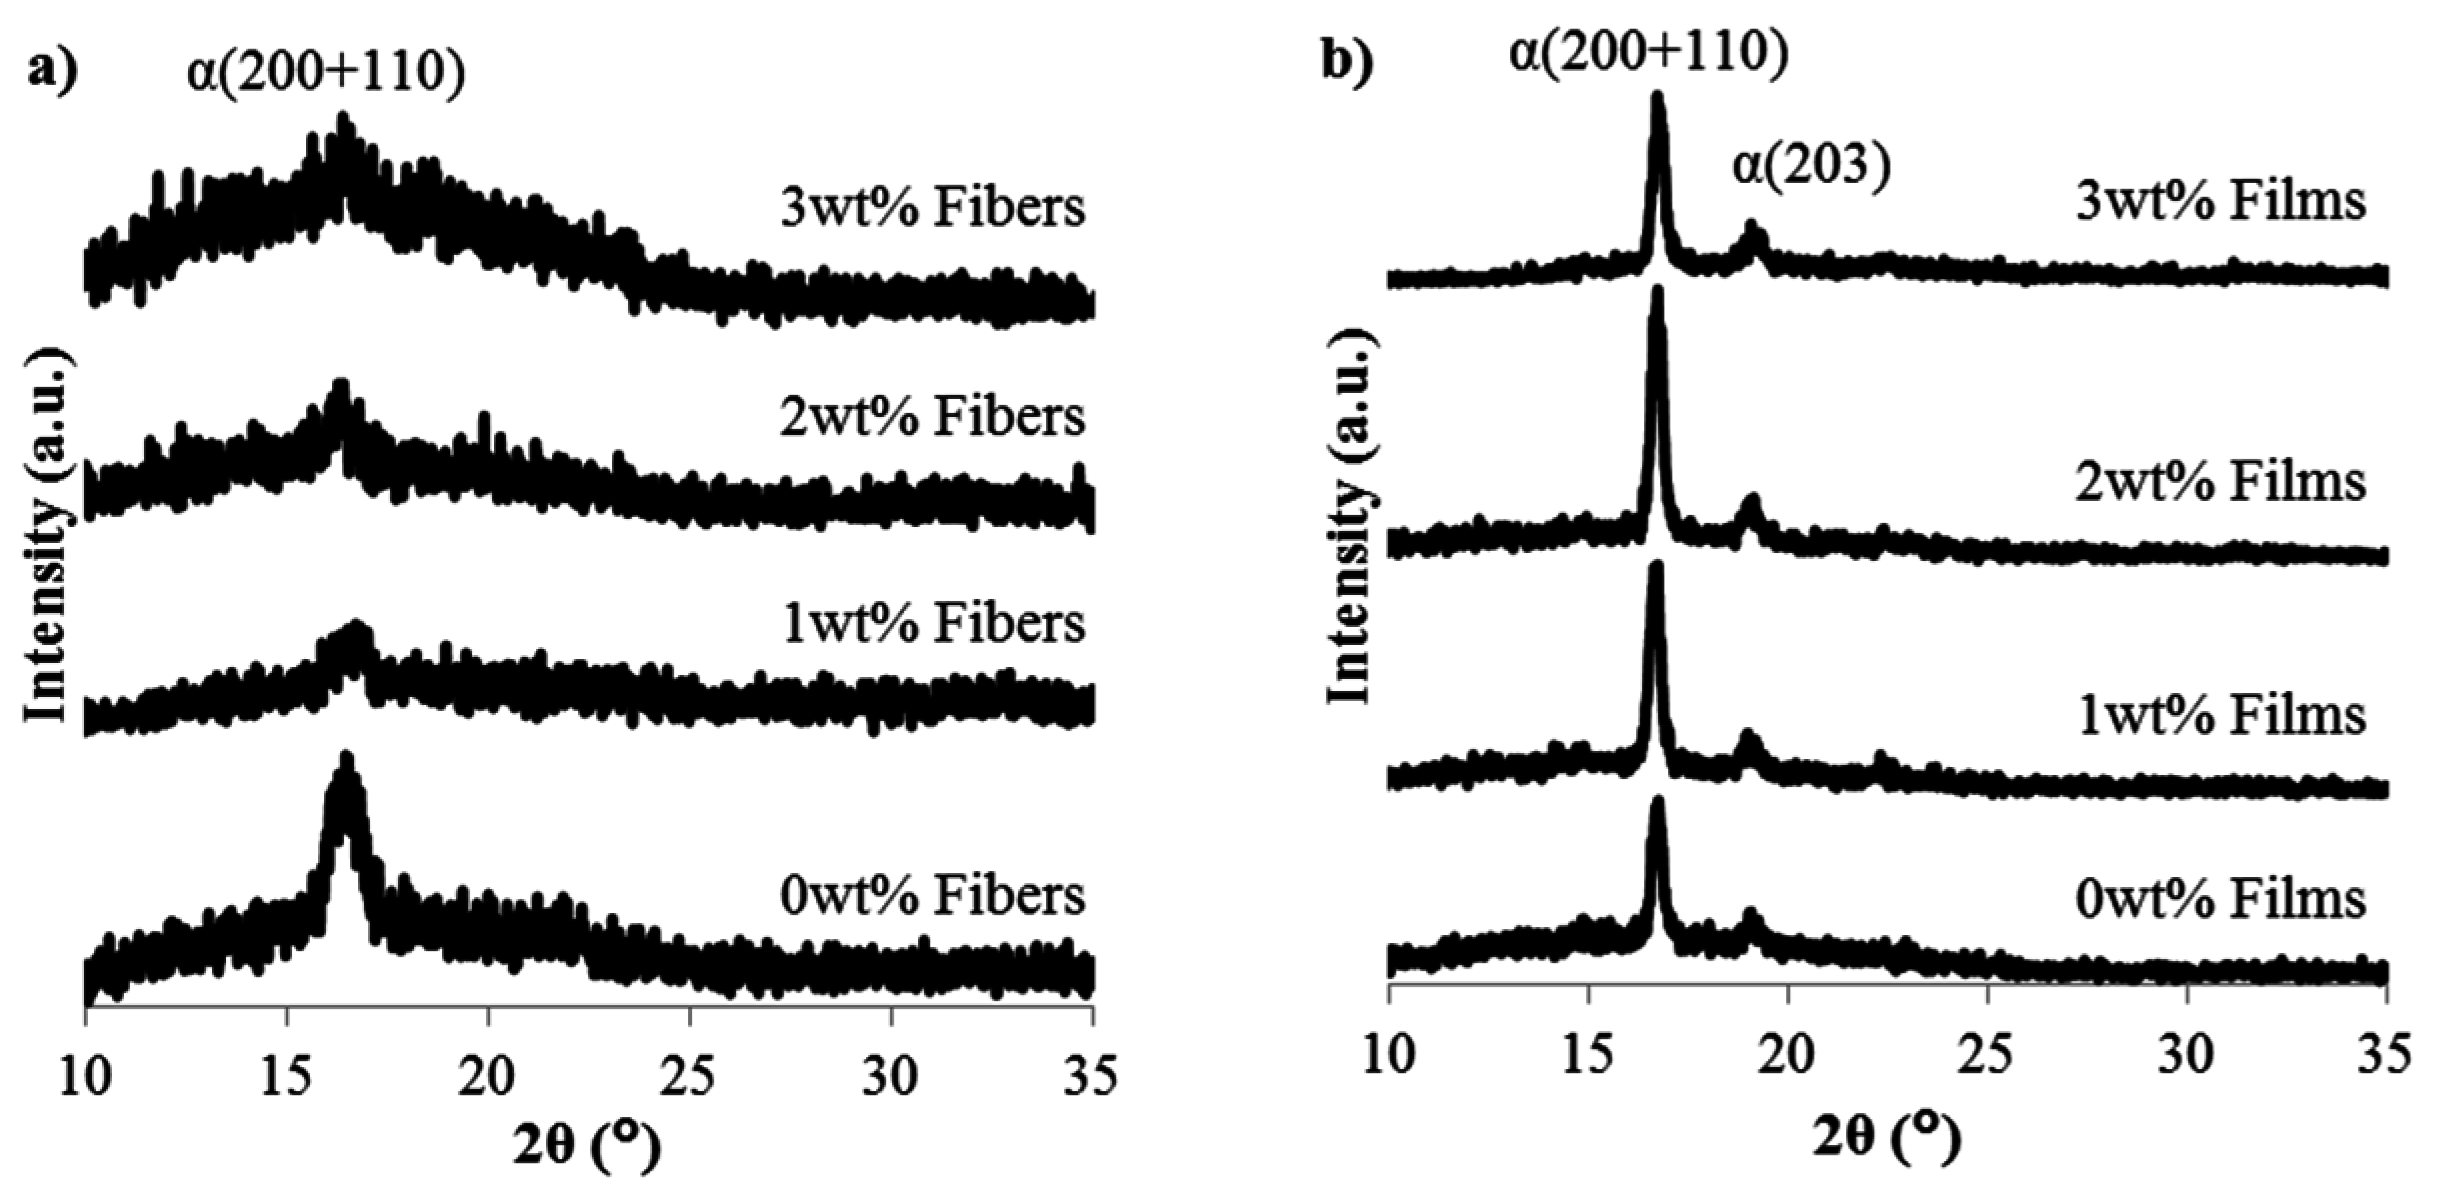
3.2. Crystallization Characterization of Composite Films

| CNC content | χ (%) | |ΔHc| (J/g) | Tcc (°C) | |||
|---|---|---|---|---|---|---|
| Fibers | Films | Fibers | Films | Fibers | Films | |
| 0 wt % CNC | 5.7 ± 2.4 | 11.5 ± 0.8 | 22.7 ± 2.6 | 16.2 ± 2.1 | 113.2 ± 0.5 | 113.0 ± 0.5 |
| 1 wt % CNC | 2.2 ± 2.1 | 24.1 ± 0.2 | 28.0 ± 2.9 | 7.3 ± 1.3 | 113.7 ± 0.2 | 110.2 ± 0.1 |
| 2 wt % CNC | 1.6 ± 1.2 | 25.3 ± 0.2 | 28.2 ± 2.8 | 5.8 ± 0.7 | 114.5 ± 1.4 | 109.9 ± 0.2 |
| 3 wt % CNC | 1.3 ± 1.3 | 29.7 ± 0.5 | 29.8 ± 0.7 | 1.9 ± 0.2 | 113.2 ± 1.3 | 109.3 ± 0.1 |
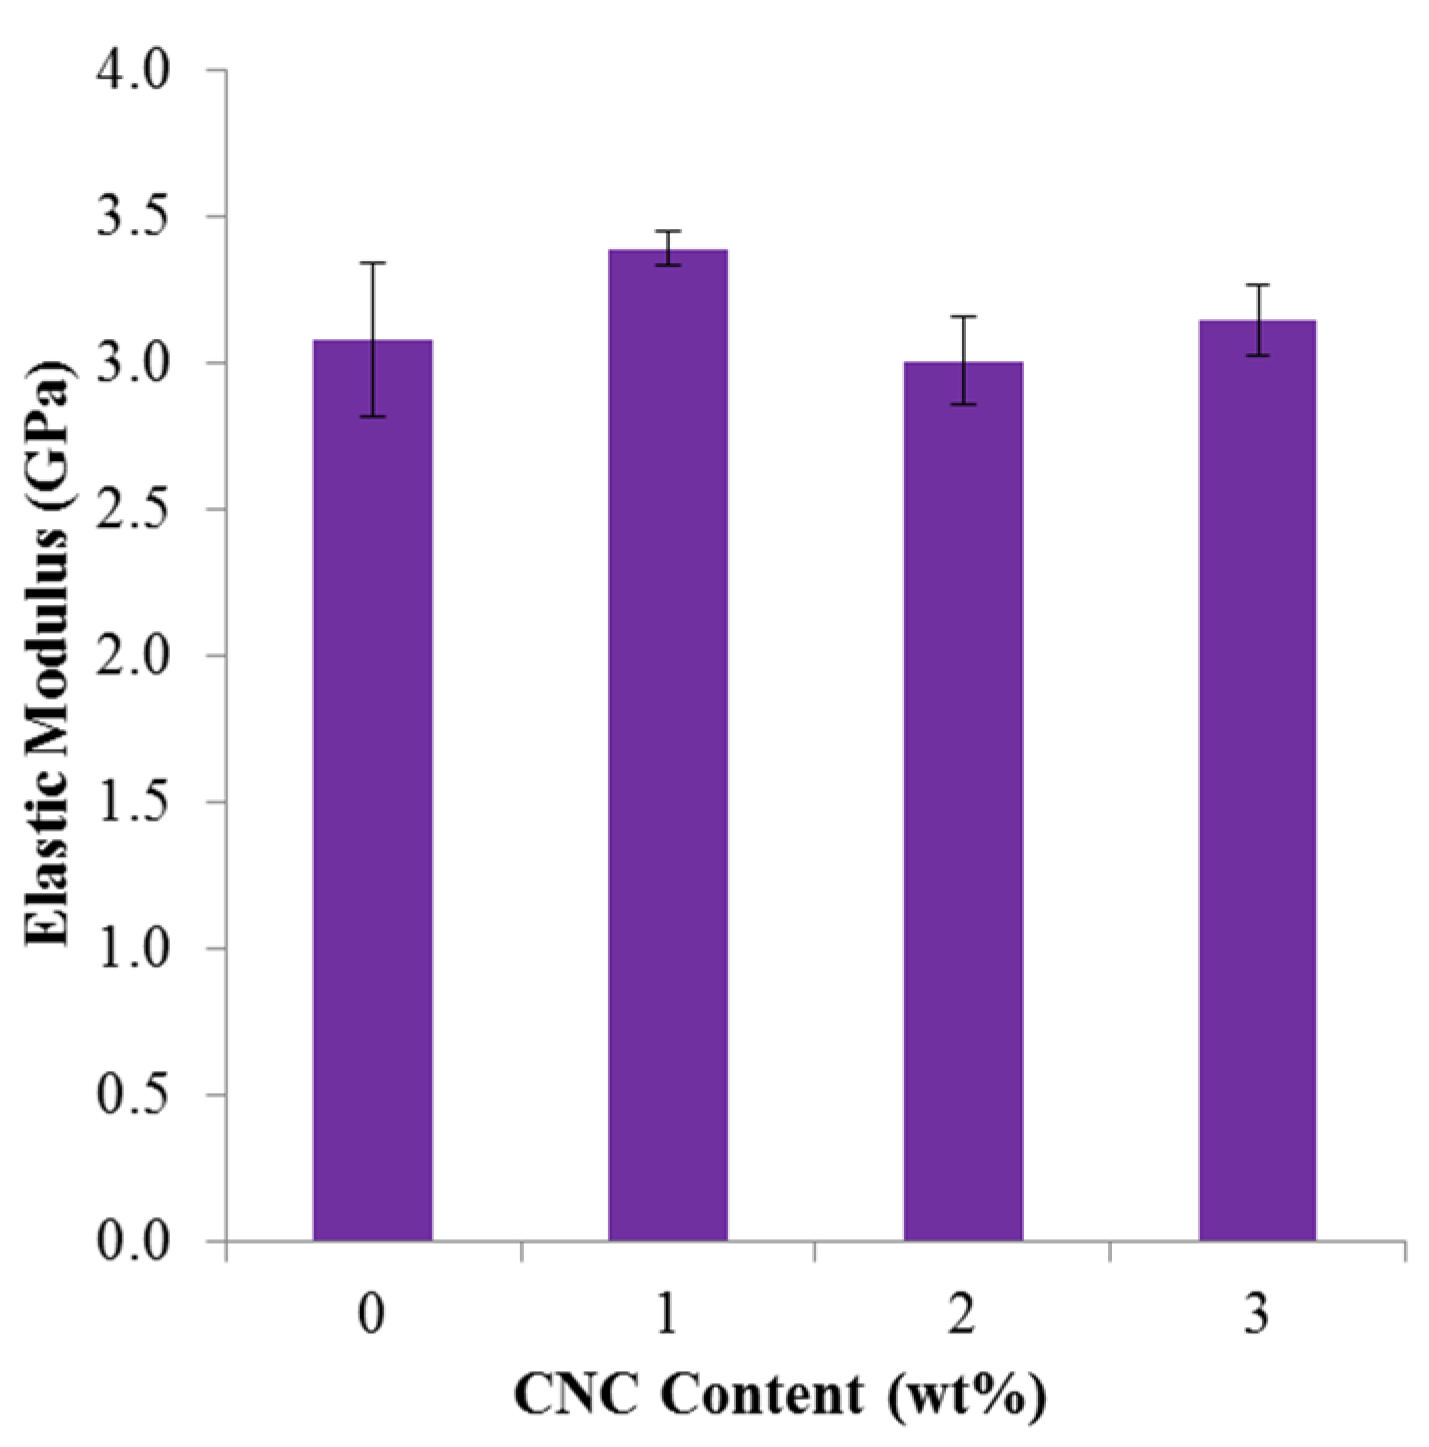
3.3. Thermo-Mechanical and Mechanical Response of Composite Films

| CNC content | E′ at 35 °C (GPa) | Tg, from tanδ (°C) |
|---|---|---|
| 0 wt % CNC | 1.9 ± 0.3 | 79.3 ± 0.8 |
| 1 wt % CNC | 2.7 ± 0.0 | 79.5 ± 0.3 |
| 2 wt % CNC | 2.7 ± 0.1 | 78.8 ± 0.0 |
| 3 wt % CNC | 2.9 ± 0.1 | 82.2 ± 0.3 |


4. Conclusions
Acknowledgments
Author Contributions
Conflicts of Interest
References
- Nampoothiri, K.M.; Nair, N.R.; John, R.P. An overview of the recent developments in polylactide (PLA) research. Bioresour. Technol. 2010, 101, 8493–8501. [Google Scholar] [CrossRef] [PubMed]
- Lunt, J. Large-scale production, properties and commercial applications of polylactic acid polymers. Polym. Degrad. Stab. 1998, 59, 145–152. [Google Scholar] [CrossRef]
- Drumright, R.E.; Gruber, P.R.; Henton, D.E. Polylactic acid technology. Adv. Mater. 2000, 12, 1841–1846. [Google Scholar] [CrossRef]
- Pei, A.H.; Zhou, Q.; Berglund, L.A. Functionalized cellulose nanocrystals as biobased nucleation agents in poly(L-lactide) (PLLA)–Crystallization and mechanical property effects. Compos. Sci. Technol. 2010, 70, 815–821. [Google Scholar] [CrossRef]
- Quillin, D.T.; Caulfield, D.F.; Koutsky, J.A. Crystallinity in the polypropylene/cellulose system. I. Nucleation and crystalline morphology. J. Appl. Polym. Sci. 1993, 50, 1187–1194. [Google Scholar] [CrossRef]
- Hansen, F.; Brun, V.; Keller, E.; Wegner, T.; Meador, M.; Friedersdorf, L. Cellulose Nanomaterials—A Path towards Commercialization Workshop Report. 2014. Available online: http://eprints.internano.org/2224/1/usforestservice_nih_2014_cellulose_nano_workshop_report.pdf (accessed on 26 November 2015).
- Moon, R.J.; Martini, A.; Nairn, J.; Simonsen, J.; Youngblood, J. Cellulose nanomaterials review: Structure, properties and nanocomposites. Chem. Soc. Rev. 2011, 40, 3941–3994. [Google Scholar] [CrossRef] [PubMed]
- Moon, R.J.; Beck, S.; Rudie, A.W. Cellulose nanocrystals—A material with unique properties and many potential applications. In Production and Applications of Cellulose Nanomaterials; Postek, M.T., Moon, R.J., Rudie, A.W., Bilodeau, M.A., Eds.; TAPPI Press: Peachtree Corners, GA, USA, 2013; pp. 9–12. [Google Scholar]
- Miao, C.W.; Hamad, W.Y. Cellulose reinforced polymer composites and nanocomposites: A critical review. Cellulose 2013, 20, 2221–2262. [Google Scholar] [CrossRef]
- Fortunati, E.; Peltzer, M.; Armentano, I.; Torre, L.; Jimenez, A.; Kenny, J.M. Effects of modified cellulose nanocrystals on the barrier and migration properties of PLA nano-biocomposites. Carbohydr. Polym. 2012, 90, 948–956. [Google Scholar] [CrossRef] [PubMed]
- Herrera, N.; Mathew, A.P.; Oksman, K. Plasticized polylactic acid/cellulose nanocomposites prepared using melt-extrusion and liquid feeding: Mechanical, thermal and optical properties. Compos. Sci. Technol. 2015, 106, 149–155. [Google Scholar] [CrossRef]
- Oksman, K.; Mathew, A.P.; Bondeson, D.; Kvien, I. Manufacturing process of cellulose whiskers/polylactic acid nanocomposites. Compos. Sci. Technol. 2006, 66, 2776–2784. [Google Scholar] [CrossRef]
- Jacobsen, S.; Fritz, H.G. Plasticizing polylactide—The effect of different plasticizers on the mechanical properties. Polym. Eng. Sci. 1999, 39, 1303–1310. [Google Scholar] [CrossRef]
- Jonoobi, M.; Harun, J.; Mathew, A.P.; Oksman, K. Mechanical properties of cellulose nanofiber (CNF) reinforced polylactic acid (PLA) prepared by twin screw extrusion. Compos. Sci. Technol. 2010, 70, 1742–1747. [Google Scholar] [CrossRef]
- Bondeson, D.; Oksman, K. Polylactic acid/cellulose whisker nanocomposites modified by polyvinyl alcohol. Compos. Part A Appl. Sci. Manuf. 2007, 38, 2486–2492. [Google Scholar] [CrossRef]
- John, M.J.; Anandjiwala, R.; Oksman, K.; Mathew, A.P. Melt-spun polylactic acid fibers: Effect of cellulose nanowhiskers on processing and properties. J. Appl. Polym. Sci. 2013, 127, 274–281. [Google Scholar] [CrossRef]
- Kamal, M.R.; Khoshkava, V. Effect of cellulose nanocrystals (CNC) on rheological and mechanical properties and crystallization behavior of pla/cnc nanocomposites. Carbohydr. Polym. 2015, 123, 105–114. [Google Scholar] [CrossRef] [PubMed]
- Girouard, N.; Schueneman, G.T.; Shofner, M.L.; Meredith, J.C. Exploiting colloidal interfaces to increase dispersion, performance, and pot-life in cellulose nanocrystal/waterborne epoxy composites. Polymer 2015, 68, 111–121. [Google Scholar] [CrossRef]
- American Society for Testing Materials. Tensile Properties of Thin Plastic Sheeting; ASTM D882; ASTM International: West Conshohocken, PA, USA, 2002. [Google Scholar]
- Todo, M.; Park, S.D.; Takayama, T.; Arakawa, K. Fracture micromechanisms of bioabsorbable PLLA/PCL polymer blends. Eng. Fract. Mech. 2007, 74, 1872–1883. [Google Scholar] [CrossRef]
- Fischer, E.W.; Sterzel, H.; Wegner, G. Investigation of the structure of solution grown crystals of lactide copolymers by means of chemical reactions. Kolloid Z. Z. Polym. 1973, 251, 980–990. [Google Scholar] [CrossRef]
- Chen, X.L.; Kalish, J.; Hsu, S.L. Structure evolution of alpha′-phase poly(lactic acid). J. Polym. Sci. Part B Polym. Phys. 2011, 49, 1446–1454. [Google Scholar] [CrossRef]
- Hebert, J.S.; Wood-Adams, P.; Heuzey, M.C.; Dubois, C.; Brisson, J. Morphology of polylactic acid crystallized during annealing after uniaxial deformation. J. Polym. Sci. Part B Polym. Phys. 2013, 51, 430–440. [Google Scholar] [CrossRef]
- Hoogsteen, W.; Postema, A.R.; Pennings, A.J.; Tenbrinke, G.; Zugenmaier, P. Crystal-structure, conformation, and morphology of solution-spun poly(L-lactide) fibers. Macromolecules 1990, 23, 634–642. [Google Scholar] [CrossRef]
- Pluta, M.; Galeski, A. Crystalline and supermolecular structure of polylactide in relation to the crystallization method. J. Appl. Polym. Sci. 2002, 86, 1386–1395. [Google Scholar] [CrossRef]
- Maiti, S.; Jayaramudu, J.; Das, K.; Reddy, S.M.; Sadiku, R.; Ray, S.S.; Liu, D.G. Preparation and characterization of nano-cellulose with new shape from different precursor. Carbohydr. Polym. 2013, 98, 562–567. [Google Scholar] [CrossRef] [PubMed]
- Xu, X.; Liu, F.; Jiang, L.; Zhu, J.Y.; Haagenson, D.; Wiesenborn, D.P. Cellulose nanocrystals vs. cellulose nanofibrils: A comparative study on their microstructures and effects as polymer reinforcing agents. ACS Appl. Mater. Interfaces 2013, 5, 2999–3009. [Google Scholar] [CrossRef] [PubMed]
- Reiner, R.S.; Rudie, A.W. 1 process scale-up of cellulose nanocrystal production to 25 kg per batch at the forest products laboratory. In Production and Applications of Cellulose Nanomaterials; Postek, M.T., Moon, R.J., Rudie, A.W., Bilodeau, M.A., Eds.; TAPPI Press: Peachtree Corners, GA, USA, 2013; pp. 21–24. [Google Scholar]
- Langford, J.I.; Wilson, A.J.C. Scherrer after sixty years: A survey and some new results in determination of crystallite size. J. Appl. Crystallogr. 1978, 11, 102–113. [Google Scholar] [CrossRef]
- Landel, R.F.; Nielsen, L.E. Mechanical Properties of Polymers and Composites, 2nd ed.; Taylor & Francis: London, UK, 1993. [Google Scholar]
- Jin, Z.; Pramoda, K.P.; Xu, G.; Goh, S.H. Dynamic mechanical behavior of melt-processed multi-walled carbon nanotube/poly(methyl methacrylate) composites. Chem. Phys. Lett. 2001, 337, 43–47. [Google Scholar] [CrossRef]
- Diez-Pascual, A.M.; Guan, J.W.; Simard, B.; Gomez-Fatou, M.A. Poly(phenylene sulphide) and poly(ether ether ketone) composites reinforced with single-walled carbon nanotube buckypaper: I—Structure, thermal stability and crystallization behaviour. Compos. Part A Appl. Sci. Manuf. 2012, 43, 997–1006. [Google Scholar] [CrossRef]
- Foreman, J.; Sauerbrunn, S.R.; Marcozzi, C.L. Exploring the sensitivity of thermal analysis techniques to the glass transition. 2006. Available online: http://www.tainstruments.co.jp/application/pdf/Thermal_Library/Applications_Briefs/TA082.PDF (accessed on 24 November 2015).
- Rusli, R.; Eichhorn, S.J. Determination of the stiffness of cellulose nanowhiskers and the fiber-matrix interface in a nanocomposite using raman spectroscopy. Appl. Phys. Lett. 2008, 93. [Google Scholar] [CrossRef]
- Lahiji, R.R.; Xu, X.; Reifenberger, R.; Raman, A.; Rudie, A.; Moon, R.J. Atomic force microscopy characterization of cellulose nanocrystals. Langmuir 2010, 26, 4480–4488. [Google Scholar] [CrossRef] [PubMed]
- Mathew, A.P.; Oksman, K.; Sain, M. Mechanical properties of biodegradable composites from poly lactic acid (PLA) and microcrystalline cellulose (MCC). J. Appl. Polym. Sci. 2005, 97, 2014–2025. [Google Scholar] [CrossRef]
© 2015 by the authors; licensee MDPI, Basel, Switzerland. This article is an open access article distributed under the terms and conditions of the Creative Commons by Attribution (CC-BY) license (http://creativecommons.org/licenses/by/4.0/).
Share and Cite
Sullivan, E.M.; Moon, R.J.; Kalaitzidou, K. Processing and Characterization of Cellulose Nanocrystals/Polylactic Acid Nanocomposite Films. Materials 2015, 8, 8106-8116. https://doi.org/10.3390/ma8125447
Sullivan EM, Moon RJ, Kalaitzidou K. Processing and Characterization of Cellulose Nanocrystals/Polylactic Acid Nanocomposite Films. Materials. 2015; 8(12):8106-8116. https://doi.org/10.3390/ma8125447
Chicago/Turabian StyleSullivan, Erin M., Robert J. Moon, and Kyriaki Kalaitzidou. 2015. "Processing and Characterization of Cellulose Nanocrystals/Polylactic Acid Nanocomposite Films" Materials 8, no. 12: 8106-8116. https://doi.org/10.3390/ma8125447
APA StyleSullivan, E. M., Moon, R. J., & Kalaitzidou, K. (2015). Processing and Characterization of Cellulose Nanocrystals/Polylactic Acid Nanocomposite Films. Materials, 8(12), 8106-8116. https://doi.org/10.3390/ma8125447