In this manuscript point defects will be expressed using Kröger-Vink notation. The superscripts denote the charge of the defects: a neutral defect is represented by an (x), a negative defect with ('), and a positive defect with a (•) superscript. The subscripts describe the site where the defect is located. For example, represents a neutral oxygen atom on an oxygen site; represents a vacancy on an oxygen site having an effective positive charge of +2; and e′ represents an electron with one negative charge.
3.1. Bixbyite In2O3
The In
2O
3 structure was studied using x-ray diffraction on single crystals at two wavelengths [
14]. Indium oxide crystallizes in the cubic bixbyite structure, also known as C-type rare-earth sesquioxide with the space group Ia3 (number 206). Its lattice parameter is 10.117(1) Å, and a unit cell has 32 cations and 48 anions. The bixbyite structure is derived from a 2 × 2 × 2 fluorite superstructure that is missing one fourth of the anions, allowing for small rearrangements of the ions. A total of 16 of these “structural oxygen vacancies” are situated at the
c sites, according to international notation [
15]. Depending on the location of these structurally vacant anion sites, two non-equivalent cation sites exist.
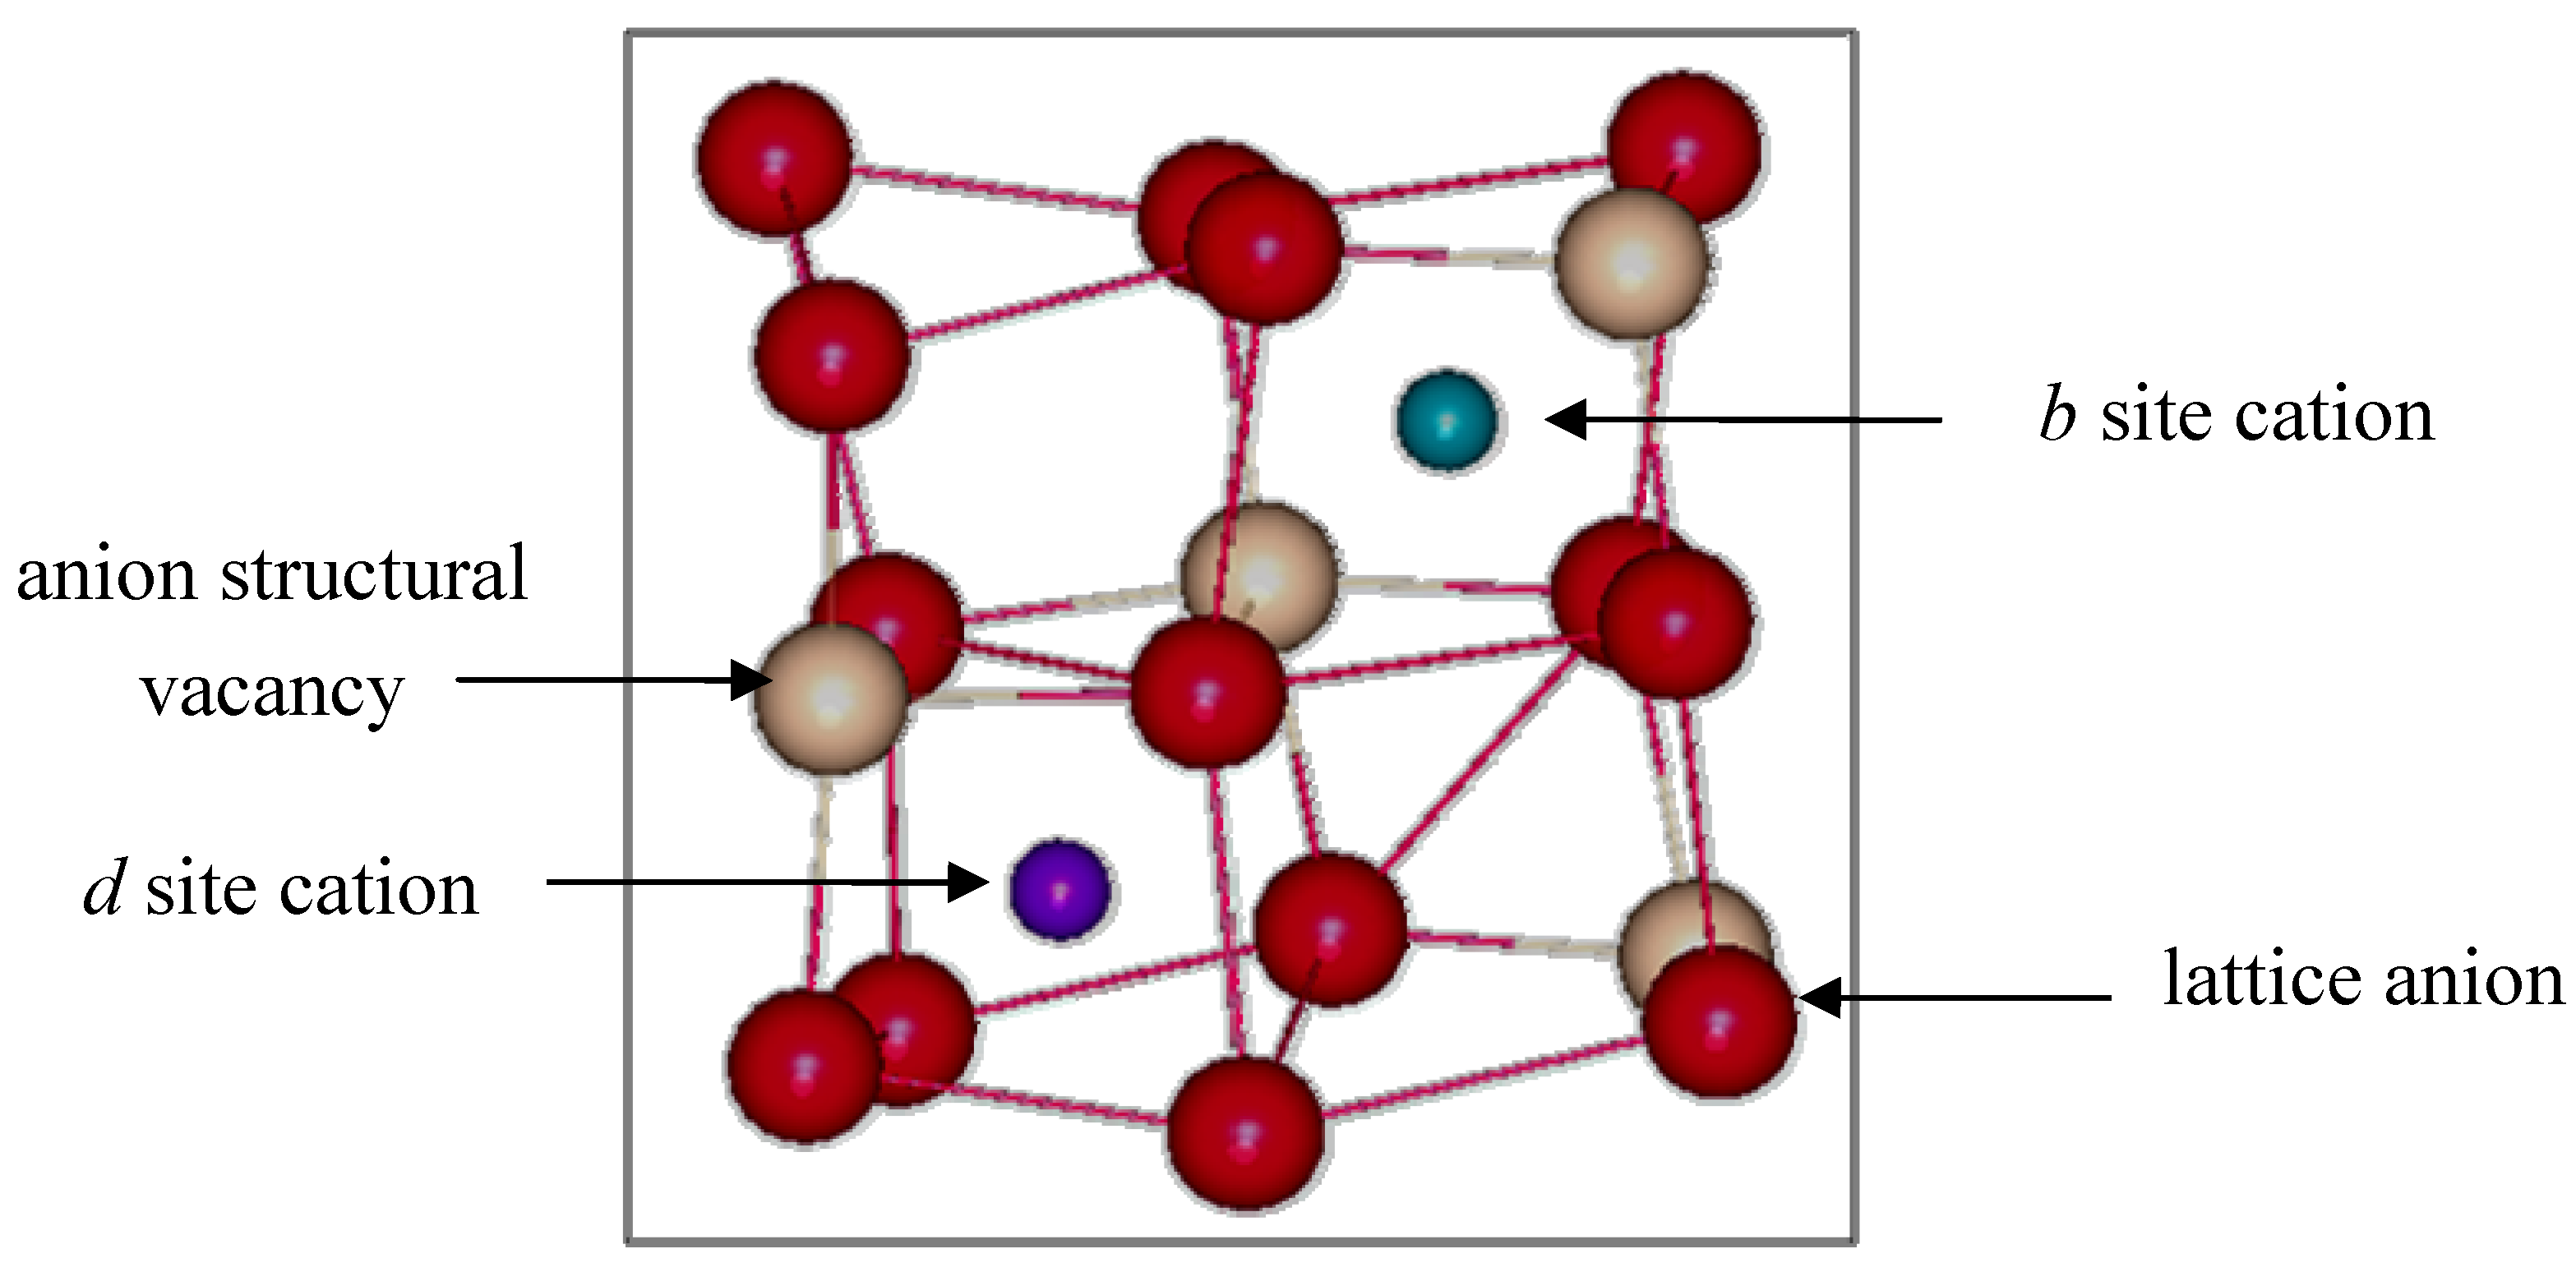
Figure 1 shows a schematic representation of the two distinct cation sites, which are referred to as equipoints
b and
d.
Figure 1.
Non-equivalent b and d cations sites found in bixbyite In2O3.
Figure 1.
Non-equivalent b and d cations sites found in bixbyite In2O3.
Eight b site cations have six equidistant oxygen anion neighbors at 2.18(1) Å. These oxygen anions lie approximately at the corners of a distorted cube with two anions vacancies along one body diagonal. The remaining 24 cations are found at the more distorted d sites, where the two anion vacancies lie along a face diagonal of the distorted cube. There are three cationd to oxygen bond lengths: 2.13(1) Å, 2.19(1) Å and 2.23(1) Å, which average 2.18(1) Å. The remaining 48 atoms are lattice oxygen anions located at the general position (e site) and coordinated to four indium cations.
The defect structure of pure In
2O
3 was indirectly deduced from electrical measurements performed by De Wit
et al. [
16,
17,
18,
19]. They observed a −1/6 dependence of log (
n) (carrier concentration) as a function of log (
pO
2) (partial pressure of oxygen). The non-stoichiometric decomposition and its corresponding equilibrium constant are described below:
The electroneutrality condition is
Substituting Equation (4) into Equation (3), the carrier concentration dependence on
pO
2 is
Therefore, the observed −1/6 slope indicated that undoped In
2O
3 exhibits n-type conductivity due to the presence of oxygen vacancies under reducing conditions. These vacancies would be formed by removing some of the lattice anions located at the
e sites and therefore introducing non-stoichiometry in the sample to obtain In
2O
3–x where
x depends on the oxidizing conditions of the material, but it is usually less than 0.01 [
16]. Due to the small population of oxygen vacancies that is predicted in pure indium oxide (less than 0.33% of the lattice oxygen site), no x-ray or neutron diffraction experiment has been able to confirm their existence. XRF techniques cannot determine the In/O ratio with such high precision either. However, theoretical models agree that the prevailing defects causing n-type conductivity in pure indium oxide are oxygen vacancies [
5].
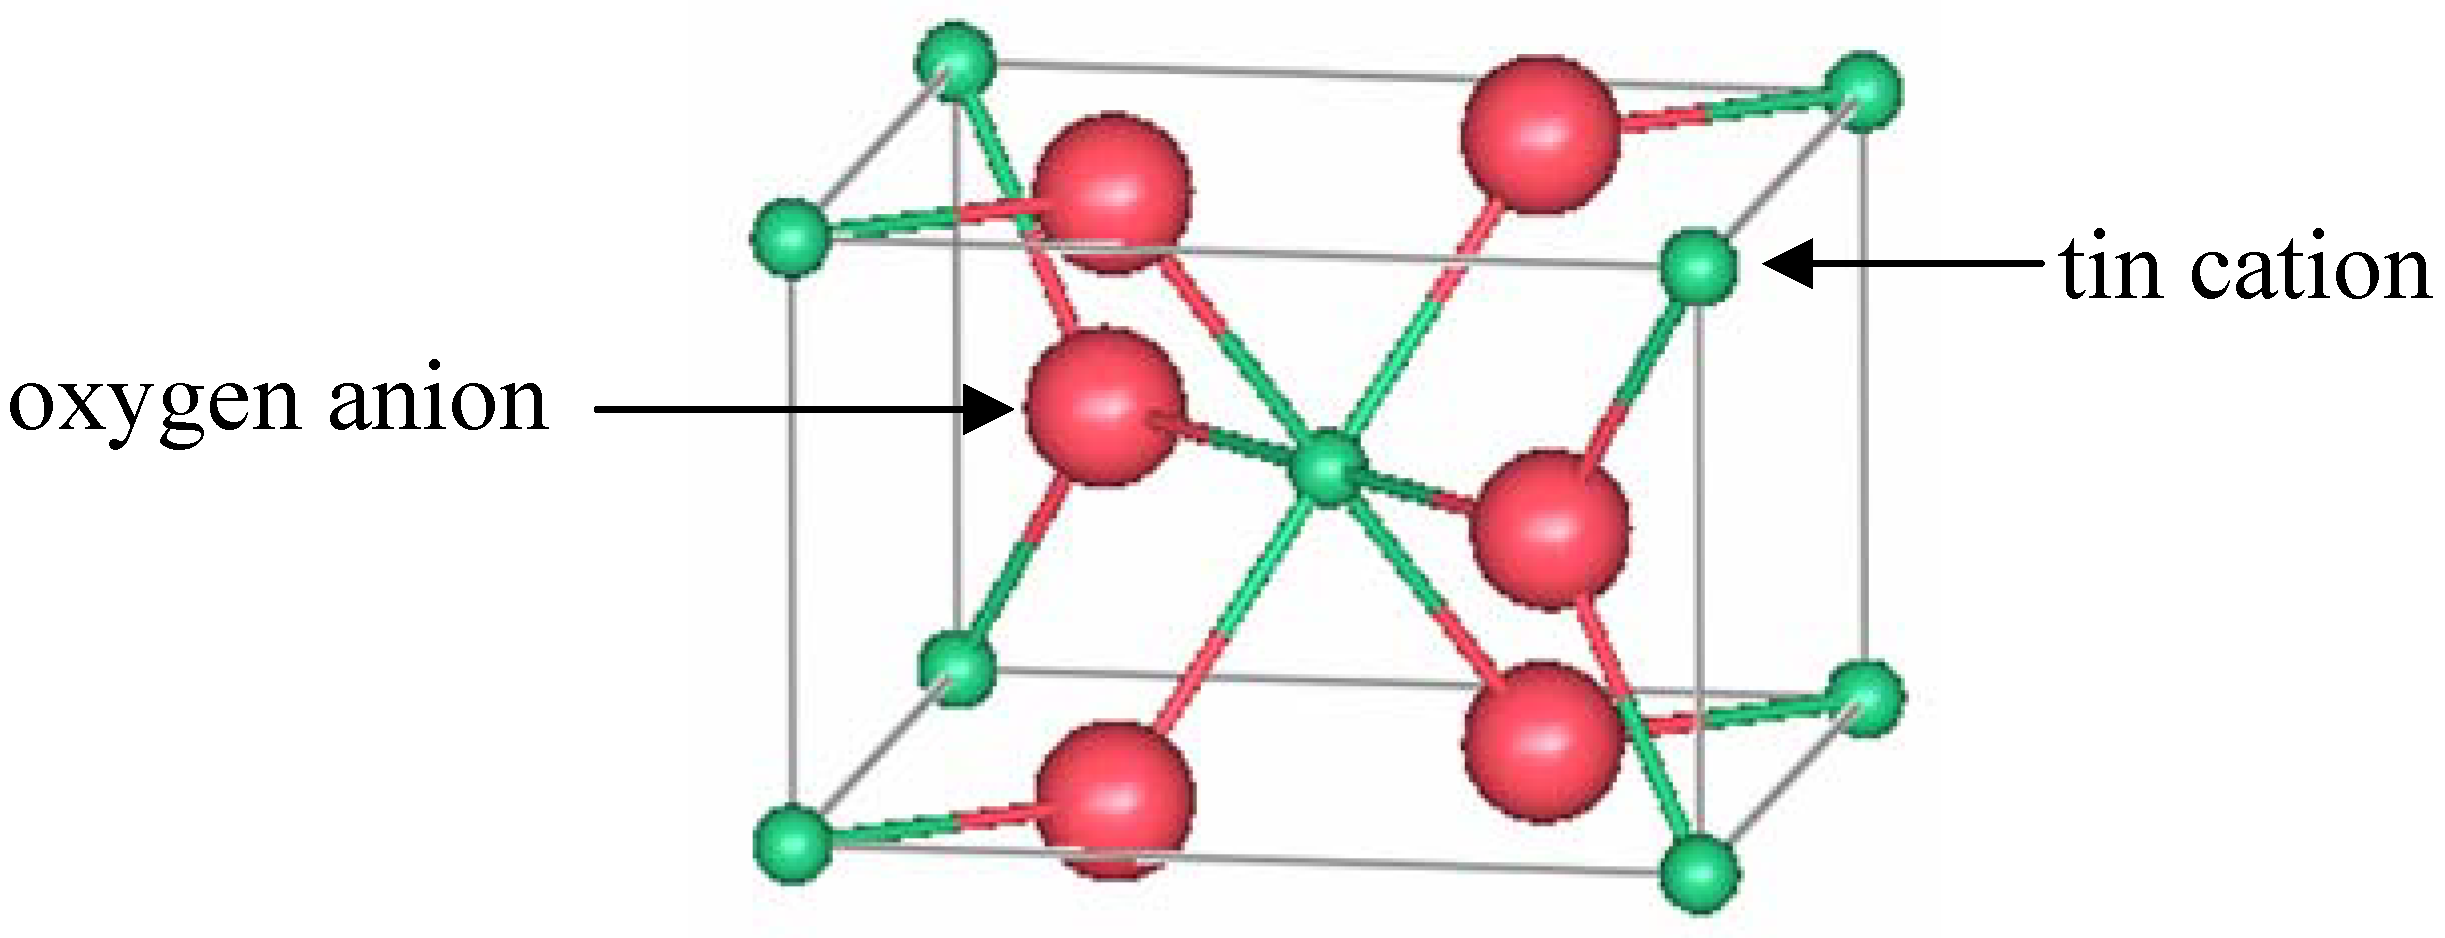
3.4. Rutile Tin Oxide (SnO2)
Tin oxide (TO) is an attractive transparent conductor since tin is less expensive and scarce compared to indium. Most of the applications of architectural glass which are deposited on building windows use tin-oxide based TCOs [
52]. Rutile tin oxide crystallizes in a tetragonal structure with space group P4
2/mnm (number 136) [
53]. A unit cell with lattice constants
a = 4.7374(1) Å and
c = 3.1864(1) Å contains two tin and four oxygen atoms. The tin cations are located at the
a sites, and the oxygen anions are found at the
f sites, according to Wyckoff notation [
15]. Edge-sharing octahedrally coordinated tin ions form chains along the [001] direction. From the oxygen perspective, the tin atoms are located at approximately the corners of an equilateral triangle.
Figure 3 shows a representation of a unit cell of rutile TO.
Figure 3.
One unit cell of rutile SnO2.
Figure 3.
One unit cell of rutile SnO2.
Samson and Fonstand [
54] established that TO exhibits n-type conductivity. They observed approximately a −1/6 slope in a log (conductivity) as a function of log (
pO
2), similar to the behavior observed for pure In
2O
3. Thus, they concluded that the major defect species in SnO
2 consists of oxygen vacancies (
). The non-stoichiometric decomposition and its corresponding equilibrium constant can be written as follows:
The electroneutrality condition results in . The material can then be expressed as SnO2−x where x depends on the oxidation state. As in In2O3, the hypothesized population of oxygen vacancies responsible for n-type conductivity is relatively small, so it is not possible to detect it using XRD, neutron diffraction or XRF techniques.
EXAFS studies on undoped TO nano-powders [
55,
56,
57] have studied the effect of particle size and disorder on short-range scales. Davis
et al. [
55] measured EXAFS and XRD on pure tin oxide nano-powders prepared by a sol-gel process. The particle size of 2 to 3 nm was determined from analyzing the peak width of the XRD peaks. The measurements at the Sn
K-edge were conducted in transmission mode at the 9.3 station of the CLRC Daresbury Synchrotron Radiation Source.
In situ experiments showed that the particles grew significantly at 400 °C. EXAFS spectra for higher coordination shells were reduced due to the small particle size. This observation was consistent with the results of Savin
et al. [
56] and Chadwick [
57]. When the coordination numbers and bond lengths for nano-SnO
2 were simultaneously refined, both the distances and the number of neighbors were smaller compared to bulk-SnO
2, especially for higher coordination shells. For the first shell, the distance only shortened by 0.005 Å, and the coordination number was approximately 6. However, for second, third, and fourth shells, the coordination numbers decreased by a factor of 2, and the third Sn-O shell showed the most dramatic decrease (0.142 Å).
Savin
et al. [
56] prepared ball-milled and sol-gel nano-samples. The particle size was determined from analysis of the XRD peaks using a conventional Cu
Kα source. EXAFS measurements were performed in transmission mode at station 9.3 of the CLRC Daresbury Synchrotron Radiation Source. The particle sizes obtained ranged from 8 nm up to 86 nm (this biggest size was referred to as “bulk” sample). Compared to the bulk sample, the EXAFS signals for the smaller nano-grains were attenuated, especially for the Sn-Sn bonds near 3 and 4 Å. The attenuation was inversely related to the particle size, except for the ball-milled sample with 16 nm, which showed the weakest signal of all samples. The EXAFS data were fit using two approaches. The first one refined the radial distances and Debye-Waller factors while fixing the coordination numbers to their crystallographic values: 6, 2, 4, and 8 for the first (Sn-O), second (Sn-Sn), third (Sn-O) and fourth (Sn-Sn) coordination shells, respectively. The radial distances refined to the ideal crystallographic values: 2.05 Å, 3.19 Å, 3.64 Å, and 3.70 Å, respectively, while the Debye-Waller factors increased with decreasing particle size and also with ball-milling time. The second refinement approach refined the coordination numbers and Debye-Waller factors while fixing the radial distances. In this case, the coordination numbers refined to smaller values due to a decrease in particle size. For the 11 nm sol-gel sample, the coordination numbers were 4.8, 1.5, 2.1, and 5.4, while for the 8 nm, sol gel sample they were 5.0, 2.4, 3.2, and 4.8. For the 16 nm ball milled sample, the coordination numbers were 5.0, 2.3, 4.4, and 3.6. For this last sample, the authors concluded that, besides grain size, the possible presence of an amorphous phase and an increase in disorder were important factors leading to the reduction in the number of neighbors. This conclusion was also derived from nuclear magnetic resonance results where an increase in structural disorder was evident.
Chadwick [
57] also conducted EXAFS experiments at the 9.3 station of the CLRC Daresbury Synchrotron Radiation Source. Data were collected up to
k = 18 Å
−1 at the Sn
K-edge on both bulk and 3 nm nanocrystals. Compared to the bulk sample, the EXAFS for the nanocrystalline sample was attenuated, and the signal from the Sn-Sn and bonds larger than 3 Å were dramatically reduced. This observation was consistent with the work of Savin
et al. [
56] and was attributed mostly to a reduced average coordination number and not disorder. Chadwick suggested that for grains smaller than 5 nm, due to a large fraction of surface atoms, the average coordination number of tin was reduced, although crystallites and interfaces could be highly disordered and contribute as well.
3.5. Sb-Doped SnO2
Antimony-doped tin oxide (ATO) shows improved n-type conductivity compared to pure tin oxide. Berry and Laundry [
58] performed Mössbauer experiments and found that at low doping levels antimony was primarily incorporated as Sn
5+. At increasing doping levels, more Sn
3+ species were present but their incorporation decreased the conductivity [
59]. Pyke
et al. [
60] used XRD, XRF, thermogravimetric techniques, and microscopy to study the solubility of antimony in TO at temperatures ranging from 600 °C to 1000 °C. The samples had starting compositions of Sn
1−xSb
xO
2 for 0 ≤
x ≤ 1. From the XRD peak widths, the average crystallite sizes increased from 4 nm to 18 nm. Equilibrium was difficult to achieve, and evaporation became problematic at higher temperatures and long annealing times. However, the results indicated that the solid solution of antimony in SnO
2 was less than 4 atomic percent. It should be noted that in thin films and nano-powders, higher Sb concentrations can be achieved. Several investigations on the defect structure of ATO consist of XRD [
61,
62], neutron diffraction [
63], and EXAFS measurements [
62,
64,
65]. A summary of those reports is presented next.
Gržeta
et al. [
61] used XRD and Mössbauer spectroscopy to investigate the substitution of Sb into the rutile SnO
2 structure using samples with different atomic doping levels: 0, 3.1(4), 6.2(6) and 11.9(5), and 14.0(7)% Sb. The concentrations in the samples were determined by atomic emission spectroscopy and particle induced x-ray emission. XRD measurements were performed using a laboratory Cu
Kα source, and the data were analyzed using Rietveld refinement [
28]. Analysis of the diffraction peak shapes indicated anisotropy in the nanosized grains. Mössbauer spectroscopy (
119Sn and
121Sb) results determined that tin was in the 4+ oxidation state, while antimony was in both the 3+ and 5+ states. The amount of Sb
3+ was twice as much as the Sb
5+ species. Structural results from XRD included atomic positions, isotropic Debye-Waller factors, fractional site occupancies, and lattice parameters. Both unit cell parameters,
a and
c, consistently increased with Sb-doping, except for the sample with highest doping level, where the lattice cell was only slightly larger than in pure tin oxide. All samples were phase pure, except for the sample with the most antimony, where 5 wt % of the sample was Sb
2O
3. For this sample the total amount of antimony was 19.4(7) atomic percent only 14.0(7) at.% was actually present in the rutile structure, and the rest was present in the secondary phase. The ratio
c/a was 0.672 for all samples.
Compared to Sn
4+, Sb
3+ is 0.07 Å larger and Sb
5+ is 0.09 Å smaller in radius, so based on ionic size alone, an increase in the lattice parameters would indicate that Sb
3+ substitutes for tin. Gržeta
et al. [
61] allowed the structural refinement of both 3+ and 5+ ions. Fractional occupancies were reported for the phase-pure samples. For the sample with 3.1%, the occupational fraction of both Sn
4+ and Sb
5+ added up to 0.96, while the occupation of Sb
3+ was 0.04(2). For the sample with 6.2%, the fractional occupation of Sn
4+ and Sb
5+ species refined to 0.91, and to 0.09(2) for Sb
3+. The authors also refined the occupation of the oxygen site for these two samples. Because antimony has 51 electrons and tin has 50, in this case, the fractional occupancies obtained using a conventional Cu
Kα source should be interpreted with caution, since, as mentioned in section 2.1, the oxygen signal for XRD is very weak, and elements that are next to each other in the periodic table are indistinguishable using a conventional Cu
Kα. Anomalous synchrotron x-ray experiments and/or neutron diffraction measurements would provide more reliable results and insight into the substitution of antimony into the tin oxide rutile structure.
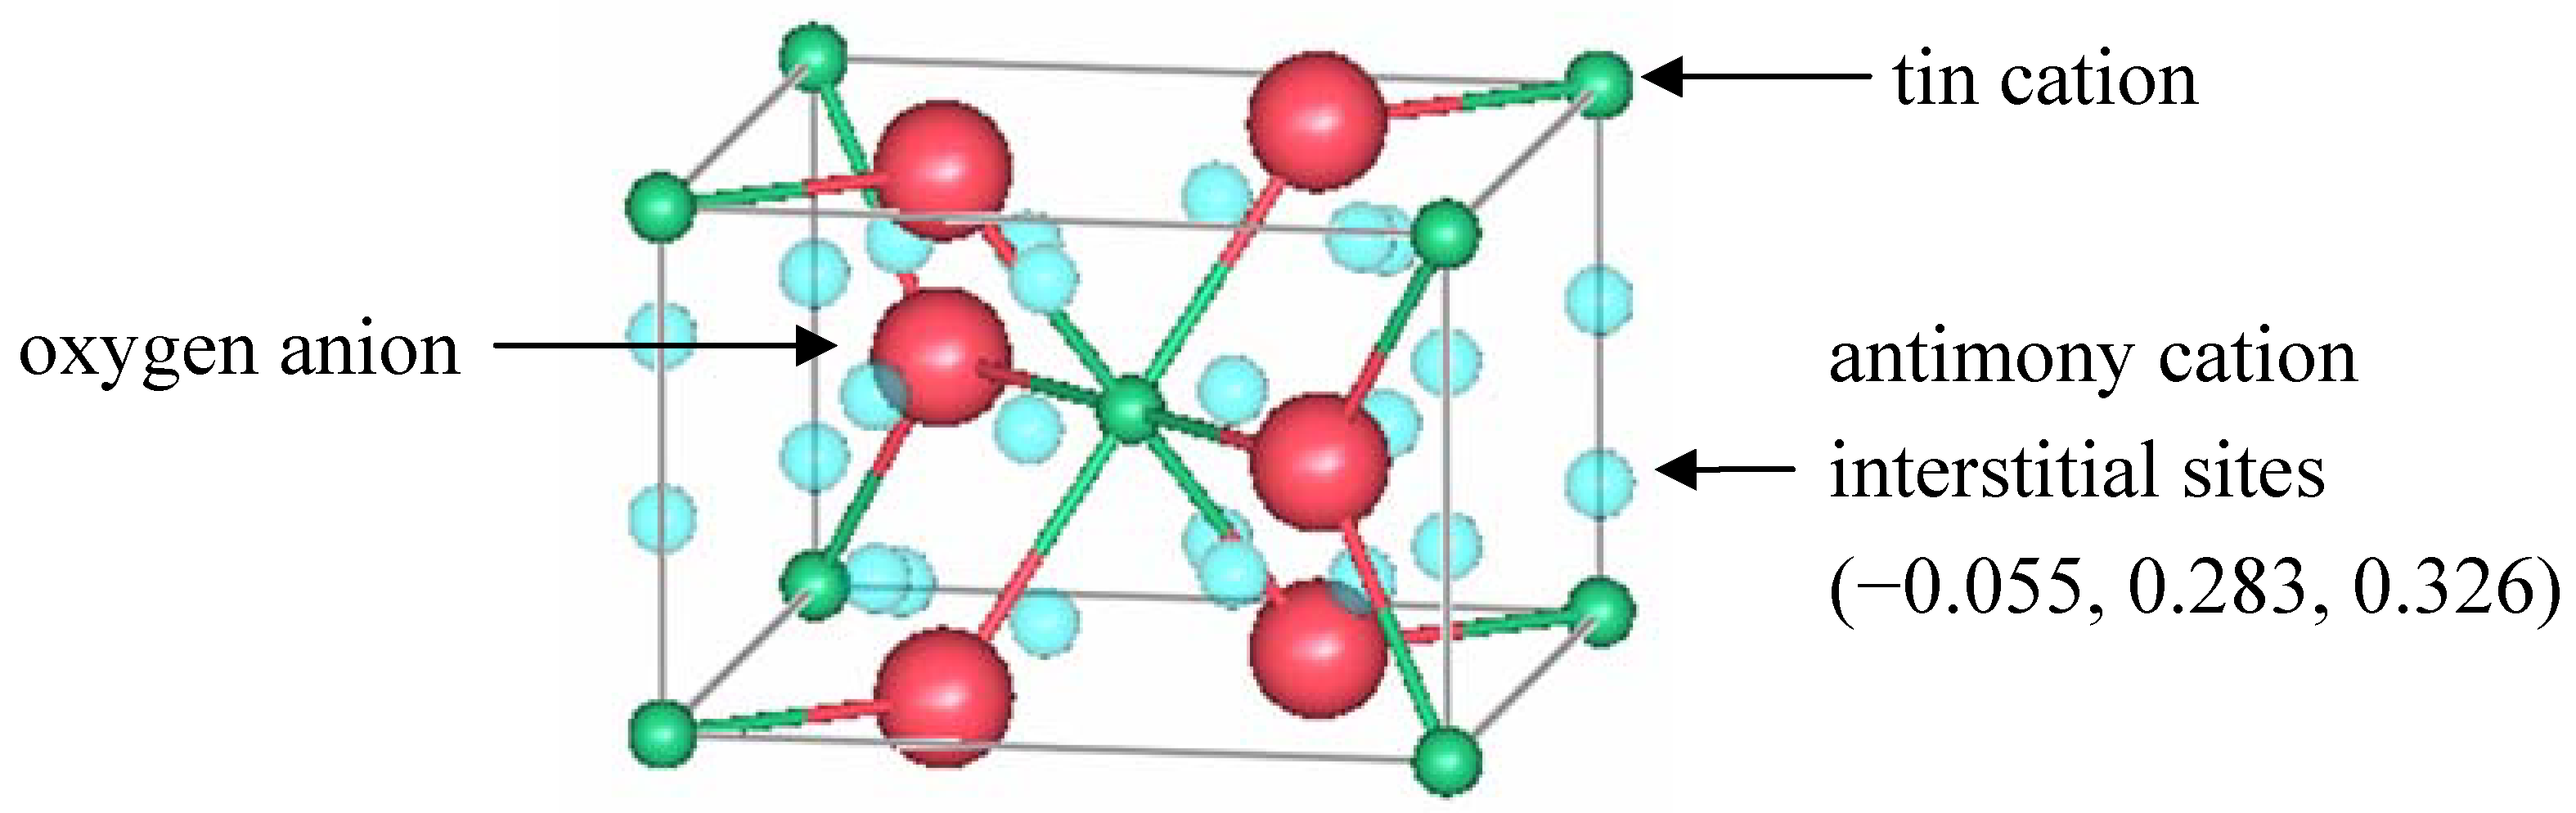
Berry and Greaves [
63] used neutron diffraction to investigate the defect structure of 10.6(3)% ATO with 14 nm crystallites. The measurements were performed at room temperature, using the PANDA diffractometer at ERE, Harwell. The neutron wavelength was 1.5397 Å, and the scattering lengths for tin, antimony, and oxygen were 6.1 fm, 5.6 fm, and 5.8 fm, respectively. The data were analyzed using the Rietveld method [
28]. Results included atomic positions, site occupancies, isotropic Debye-Waller factors, and lattice parameters. The cell parameters were
a =
b = 4.7373(5) Å and
c = 3.1816(5) Å. The best refinement scenario fixed the oxygen occupancy to 2.0 atoms/cell and refined the tin occupation in the
a site to 0.918(7). The model also included the presence of Sb in an interstitial position (
k site) with an occupation of 0.11(1). The interstitial antimony was initially placed at
x = 0,
y =
z = 0.5, the vacant octahedral sites of the rutile structure. The refined positions were actually shifted by 1.2 Å from these octahedral sites to
x = −0.055,
y = 0.283,
z = 0.326 atomic coordinates.
Figure 4 shows the location of those sites in rutile.
Figure 4.
A unit cell of rutile SnO
2 showing the location of interstitial antimony refined by Berry and Greaves [
63].
Figure 4.
A unit cell of rutile SnO
2 showing the location of interstitial antimony refined by Berry and Greaves [
63].
Berry and Greaves proposed a defect model that also includes oxygen vacancies to maintain charge balance and explain the n-type conductivity. For refinement purposes, the occupation of one species is always fixed and the rest of the sites are refined with respect to it. In the model, both cation and anion vacancies were proposed, so the relative occupancy ratios were maintained, but the absolute values were adjusted. The model then consisted of 1.90(1) O2− anions, 0.871(7) Sn4+ cations, and 0.10(1) Sb3+ cations. The refined position of the antimony interstitial was in close proximity to anion vacancies. Such a Sb3+-Vö pair would have a net charge of 5+, which could then balance the charge of negatively charged tin vacancies.
Rockenberger
et al. [
64] measured XANES and EXAFS on samples with 9.1 and 16.7 at% antimony, with particle sizes ranging from 2 to 6 nm. The samples were prepared by a co-precipitation method, and two different antimony chlorides were used SbCl
5 and SbCl
3 to study their effect on the antimony oxidation state distribution. XANES experiments were performed in transmission at the Sb
L1-edge at room temperature, while EXAFS measurements at the Sb
K-edge were conducted at 5 K, at the E4 beamline of the DORIS synchrotron at HASYLAB, DESY. XANES spectra were compared to Sb
2O
3 (Sb
+3) and Sb
2O
5 (Sb
+5) reference materials to determine the oxidation state. The authors found that the ratio of Sb
3+/Sb
5+ decreased with room temperature “aging”, if the samples were dried only at 100 °C. These samples were non conductive and had a brownish, yellowish color. For the 9% Sb
3+ sample, after 1 week at room temperature the Sb
3+/Sb
5+ ratio was 35/65, and it decreased to 22/78 after sitting at room temperature for 6 months. For the 17% Sb
3+ sample, the corresponding ratios were 50/50 and 21/79; while for the 17% Sb
5+ sample, the ratio was 9.91 (and not reported after 6 months). If the samples were dried at 500 °C, then the ratios after 1 week and 6 weeks remained the same, their n-type conductivity increased and their color changed to blue. The ratios for the 9% Sb
3+, 17% Sb
3+, and 17% Sb
5+ samples were: 28/72, 23/77 and 24/76, respectively, which were all very close to 1/3.
The EXAFS results by Rockenberger
et al. [
64] showed that the bond lengths did not change with sample composition or with drying processes. The bond lengths were: 2.00(2) Å, 3.20(2) Å and 3.71(2) Å, for the first shell (Sb-O), second shell (Sb-Sn/Sb), and third shell (Sb-Sn/Sb), respectively. These values were close to the 2.05 Å, 3.19 Å and 3.71 Å lengths in SnO
2. The coordination numbers changed slightly with sample composition and with anneals at 100 °C and 500 °C, however most of the changes were within one standard deviation. The first coordination numbers ranged from 4.1(3) to 5.4(4). The second shell coordination numbers ranged from 0.7(4) to 1.1(5). The third shell coordination numbers ranged from 1.3(6) to 2.4(10). The authors explained that the incorporation of antimony into the rutile tin oxide lattice of their co-precipitated samples using a two-step process. During the first step at low temperatures (100 °C), the stoichiometry of the non-conductive samples was given by
. This composition required the metal: oxygen ratio to deviate from 1:2; and their results indeed ranged from 1:2.0 to 1:2.05. Upon annealing at 500 °C, the samples became conductive and their stoichiometry was either
neglecting oxygen vacancies, or
, where
represented the number of conduction band electrons, and the number of oxygen vacancies per cell was given by
δ. Since the samples were prepared in air, such oxidizing conditions would probably not produce a substantial population of oxygen deficiencies. However, the proposed models could not be confirmed due to the typical uncertainties associated with coordination number determinations using only EXAFS results.
Geraldo
et al. [
65] also investigated the incorporation of antimony in the rutile tin oxide lattice using EXAFS and XANES. The samples were nanocrystalline powders with compositions 0%, 1.5%, 3%, 4%, 9%, and 16% Sb obtained via a xerogel process followed by drying and heat treatment at 200 °C for 30 min or at 550 °C for 1 h. XANES spectra were collected at the Sb
L1-edge at station E4 of HASYLAB and compared to reference powders Sb
2O
3 (for Sb
3+) and FeSbO
4 (for Sb
5+) to determine the oxidation state. EXAFS spectra were collected in transmission mode at the Sn
K-edge and Sb
K-edge on the ROMO II station at HASYLAB. XANES signals were fit using a linear combination of Sb
3+ and Sb
5+ dopants. The Sb
3+/Sb
5+ ratios of all the samples at 200 °C were smaller than the ratios after treatment at 550 °C. For the 3, 4, 9, and 16% samples, the reported ratios were: 10/90 and 0/100, 15/85 and 7/93, 55/45 and 13/87, and 70/30 and 15/85. These results differed from the 1:3 ratios reported by Rockenberger
et al. [
64] for 9% and 17% samples; and the discrepancy was attributed to a rearrangement of antimony distributions arising from different preparation routes.
EXAFS results at the Sn K-edge indicated that for all the low-temperature samples, the intensity of the Sn–Sn/Sb shell was reduced, probably due to the small crystallite size, which ranged from 1.1(1) nm to 1.5(1) nm. After annealing at 550 °C, the grains for most doped samples grew to 2.0(2) to 2.8(4) nm while the intensities from the Sn–Sn/Sb shell got stronger. The weakest intensities were observed for the undoped and heavily doped samples, which maintained a small crystallite size (1.4(1) nm for undoped and 1.6(2) nm for 16% Sb-doped). The bond lengths for all samples were approximately the same, within experimental uncertainty: 2.06(1) Å, 3.21(1) Å, and 3.73(1) Å for the first, second, and third shells, respectively. For all samples and temperatures the coordination number for the first shell remained constant and ranged from 5.9(2) to 6.3(1). For the second shell, after the low temperature anneal, the number of neighbors ranged from 1.2(1) to 1.4(1). After the high temperature anneal, the numbers remained the same for the undoped and heavily doped samples, but it increased to up to 1.7(1) for the other samples. The third shell exhibited more differences. The coordination numbers ranged from 2.8(2) for undoped-SnO2 to 3.6(2) for doped samples at low temperatures. At high temperatures, the values ranged from 3.4(2) to 5.2(3), with the undoped and heavily doped samples exhibiting the smallest numbers. The results indicated that for samples with ≤4 at.%, Sb was mostly in the Sb5+ oxidation state, and it favored crystallite growth resulting in stronger Sn- cation contributions that approached the behavior of bulk SnO2.
The environment around Sb exhibited more dramatic differences among samples and thermal treatments. The intensities for the first and second shells continuously decreased with increasing doping after both annealing treatments; however as observed before, the intensity of the cation-cation shells got stronger after heating to 550 °C. The Sb-O bond length was 1.98(1) Å for all samples. The coordination number for this shell was 5.4(5) for the 1.5% Sb sample and continuously decreased with doping to 3.9(2) for the 16% Sb sample at 200 °C. This heavily doped sample looked similar to a SbIII-grafted SnO2 xerogel where the Sb3+ species are chemically adsorbed at the surface, and the coordination number is 3.1(3). At this low temperature, the authors proposed that antimony occupied superficial sites. At 550 °C, the corresponding coordination numbers ranged from 5.7(8) to 5.3(3), which approached the value of 6 for the Sn-O bond, therefore suggesting a more homogeneous incorporation of antimony in the lattice. The authors proposed that the Sb EXAFS data could be fit using a linear combination of grafted Sb3+ and Sb5+ species. For low doping levels below 4%, the treatment at 200 °C resulted in more than 85% of the Sb3+ species oxidizing to Sb5+. As the doping increased, less than 50% of the Sb3+ species oxidized. At 550 °C, the Sb5+ species dominated and decreased with antimony content ranging from 100% to 85%.
3.6. F-Doped SnO2
Fluorine-doped tin oxide (FTO) shows improved n-type conductivity and higher mobilities compared to pure TO and ATO [
1]. FTO also exhibits good chemical stability making it suitable for applications in harsh environments. At low doping levels, the incorporation of fluorine results in increased conductivity, however at higher doping levels, the conductivity decreases. Theoretical calculations by Fantini and Torriani proposed that fluorine atoms occupy substitutional oxygen sites [
66] and act as a donor species providing free carriers. Due to the weak x-ray scattering of fluorine and oxygen, such data could not be used to reliably obtain fractional occupancies of these light elements in the lattice. However XRD can be used to obtain lattice parameters and to study structural changes in a semi-quantitative manner. Several structural reports [
67,
68,
69,
70] have investigated the effect of fluorine doping tin oxide.
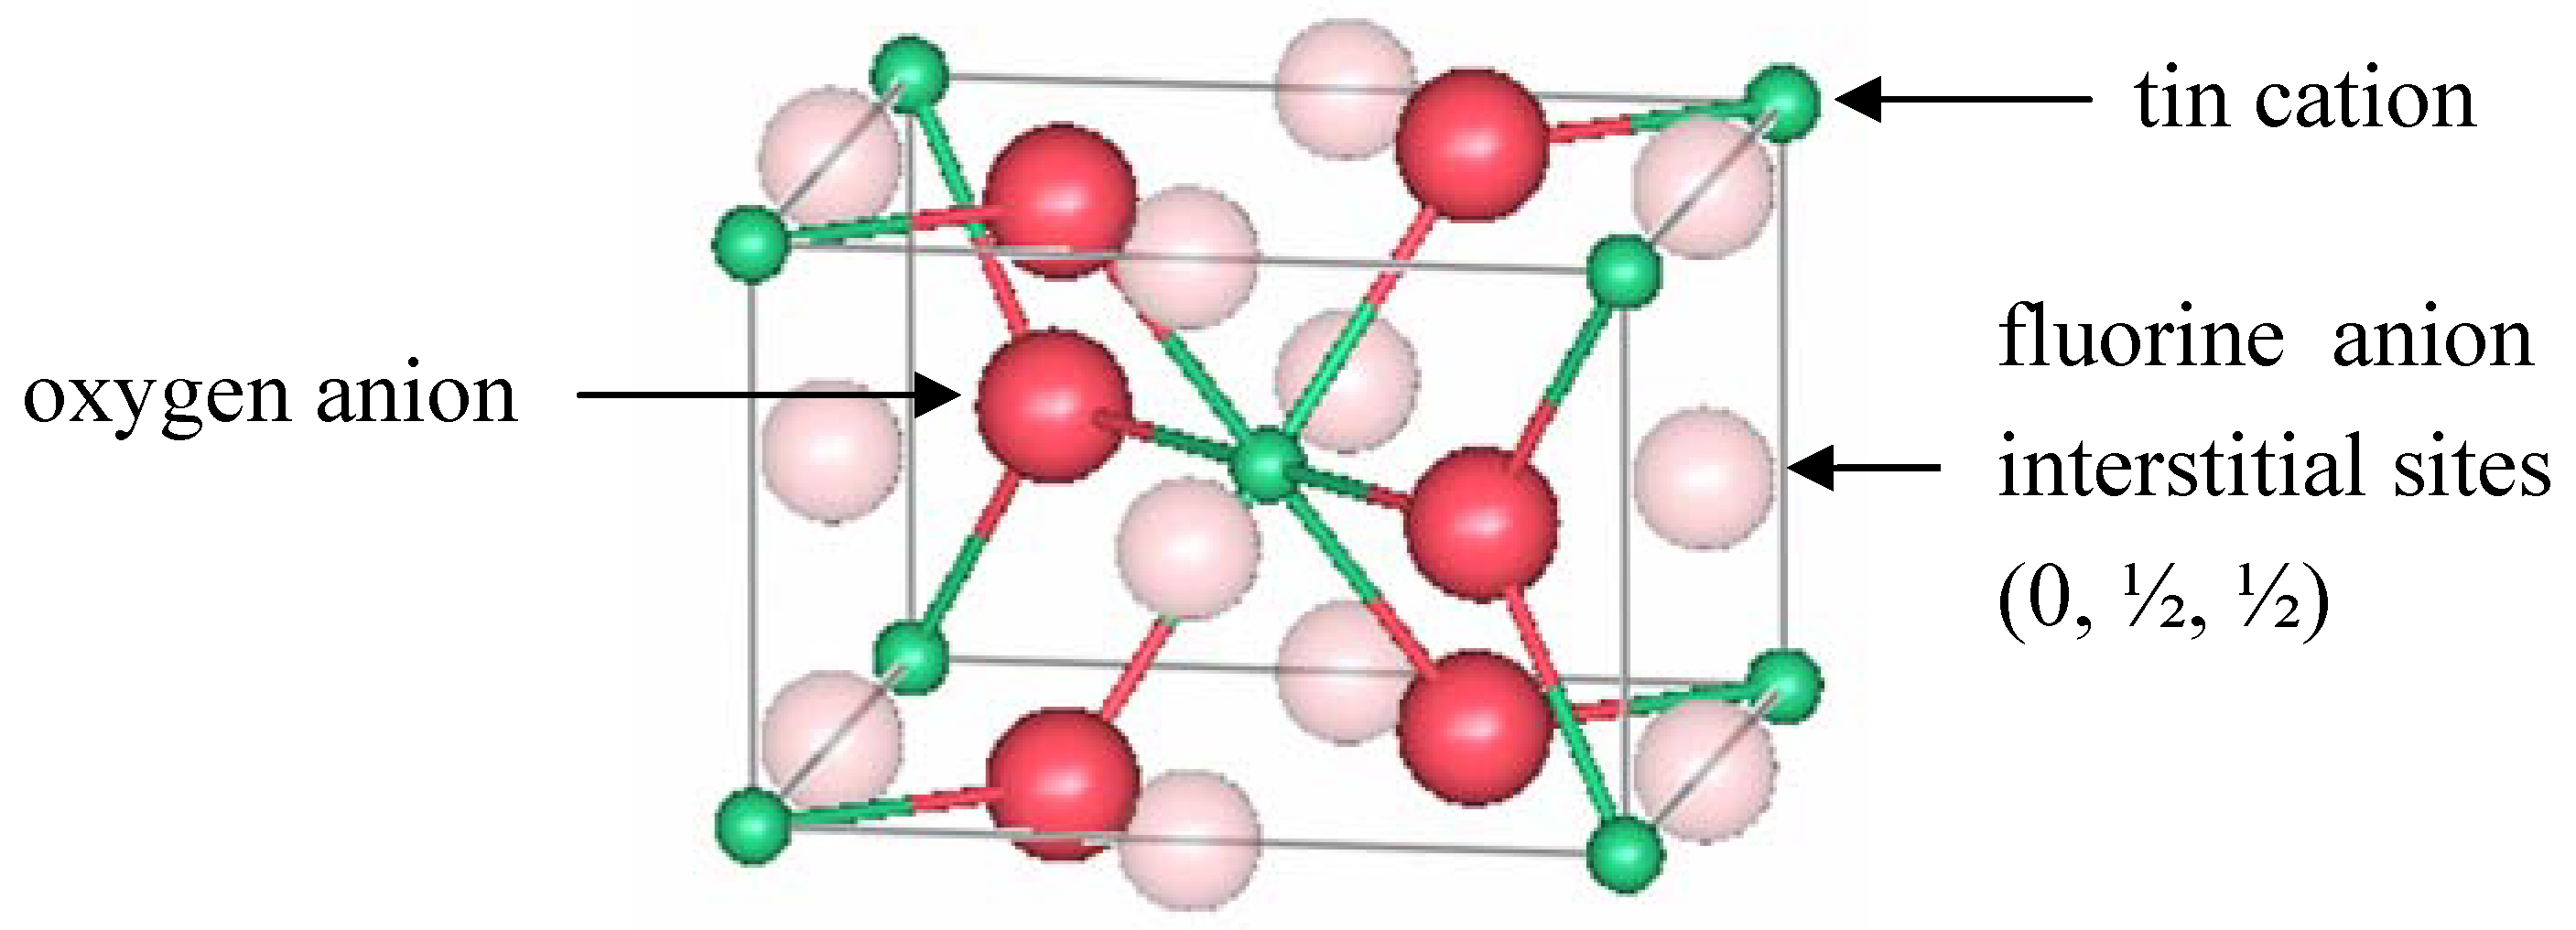
Canestrato
et al. [
67] prepared undoped, doped (FTO with 0.7% F) and heavily fluorine-doped SnO
2 (hFTO with 1.3% F) thin films which were characterized using atomic force microscopy (AFM), XRF, and XRD. The electrical and optical properties of the samples were also measured and correlated to the doping content. The resistivity of the TO sample was 32(12) × 10
−4 Ω cm. It decreased to 6(1) × 10
−4 Ω cm for FTO, and increased to 25(8) × 10
−4 Ω cm for hFTO, however the carrier concentration remained approximately the same (~ 6 × 10
20 cm
−3) for both doping levels. Doping decreased the transmittance of the films in the IR region due to conduction electrons, affecting more the hFTO samples. XRD measurements were conducted using a Cu
Kα source. Based on the intensities of several diffraction peaks, the authors concluded that F occupied both interstitial (at 0, ½, ½) and substitutional sites for both FTO and hFTO; but at higher doping levels, the occupation of the interstitial site was enhanced.
Figure 5 shows the location of these interstitial sites.
Figure 5.
A unit cell of rutile SnO
2 showing the location of interstitial fluorine proposed by Canestrato
et al. [
67].
Figure 5.
A unit cell of rutile SnO
2 showing the location of interstitial fluorine proposed by Canestrato
et al. [
67].
For hFTO, shifts in the Bragg angles were also consistent with the presence of interstitial atoms that caused slight distortion in the lattice. In the rutile structure, the interstitial fluorine species would act as acceptors leading to a decrease in n-type carriers. However while the conductivity decreased for hFTO, the carrier concentrations for the doped samples remained the same implying that the mobilities changed with doping. AFM showed that the morphologies for FTO and hFTO samples were comparable, ruling out the decrease in mobility due to grain boundary scattering. The authors concluded that mobility was reduced due to a combination of lattice distortion and carrier-impurity scattering, which increased with F concentration.
In a latter study, Canestrato
et al. [
68] developed a theoretical model for FTO that considered F on oxygen sites (F
O), F on interstitial sites (F
i) and neutralizing F
O-F
i defect complexes. The authors proposed that for low doping levels, F on oxygen sites created shallow donors that increased the conductivity, while F
i might be present but inactive. However for high doping levels, F
i species were present acting as compensating acceptors. Furthermore, in heavily doped FTO, the formation of F
O-F
i pairs was energetically favorable. In this complex defect, the acceptor role of F
i species resulted in a decrease in electrical conductivity.
Suffner
et al. [
69] studied the properties of nanocrystalline FTO using XRD, TEM, x-ray photoelectron spectroscopy (XPS), and Fourier-transformed infrared spectroscopy (FTIR). XRD patterns were collected using a Cu
Kα source, and the data were analyzed using the Rietveld method [
28] to determine particle size and cell parameters. The average particle size of the samples was approximately 7 nm from XRD, and 5 nm from TEM measurements. The doping concentrations determined by XPS were F/Sn = 0.109 and 0.271, which translated to F/O ratios of 1:15 and 1:6. The cell volumes obtained from XRD were 71.76 Å
3, 71.62 Å
3, and 71.70 Å
3 for the undoped TO, 0.109 and 0.271 FTO samples, respectively. The Sn/O ratio for pure TO was 1.80, and it decreased to 1.65 and then to 1.63 with increasing fluorine doping. These results supported the anion substitutional model, where fluorine gets incorporated on oxygen lattice sites. Because the Sn/O ratio did not change with increasing fluorine content and the volume of the cell increased, the authors proposed that at higher concentration, fluorine occupies an interstitial oxygen site. Theoretical calculations were performed to determine defect volumes of fluorine point defects and compare them with the XRD results. The calculated defects were F
O (fluorine on a lattice oxygen site), F
i (fluorine on an interstitial site) and an associate F
O-F
i defect (F
O, ap) that was proposed by Canestraro
et al. [
68]. Because the radius of fluorine is smaller compared to oxygen, it was expected that the lattice contracted with substitutional incorporation, as observed for the low doping sample. The model of isolated interstitial fluorine would lead to an overall increase in volume, while the associated defect configuration would lead to only a small cell expansion. Therefore, the authors concluded that at low doping levels, fluorine substituted for oxygen on a lattice site; and at high concentrations, the dopants went also into interstitial sites creating F
O-F
i defects.
A recent study by Chinnappa
et al. [
70] also investigated the effect of doping level on the structural and electrical properties of FTO films prepared via a spray technique. The films were prepared from a low concentration (0.1 M NH
4F, referred to as LC) and a high concentration (0.9 M NH
4F, referred to as HC) precursor, and the atomic percentage doping levels obtained were 0, 10, 20, 30, 40, and 50. XRD, energy-dispersive x-ray analysis (EDAX), and FTIR techniques were used to characterize the polycrystalline films. From the intensity of several Bragg reflections, the authors concluded that for LC heavily doped samples, substantial F
i species were present, while for HC films, the population of F
i species was not as pronounced even for high doping levels. These results correlated well with electrical measurements. For LC films, the conductivity and carrier concentration increased with increasing doping content but after 30% F, the samples became more resistive due to decreased electron concentration. This behavior could be explained by the increasing presence of F
i acceptor species. For HC samples, the carrier concentration and resistivity did not change much with doping level, therefore it seemed like the F
i population also remained unchanged. This suggested that not only doping level, but the preparation process had an effect on the electrical properties and the fluorine doping mechanism in rutile tin oxide.
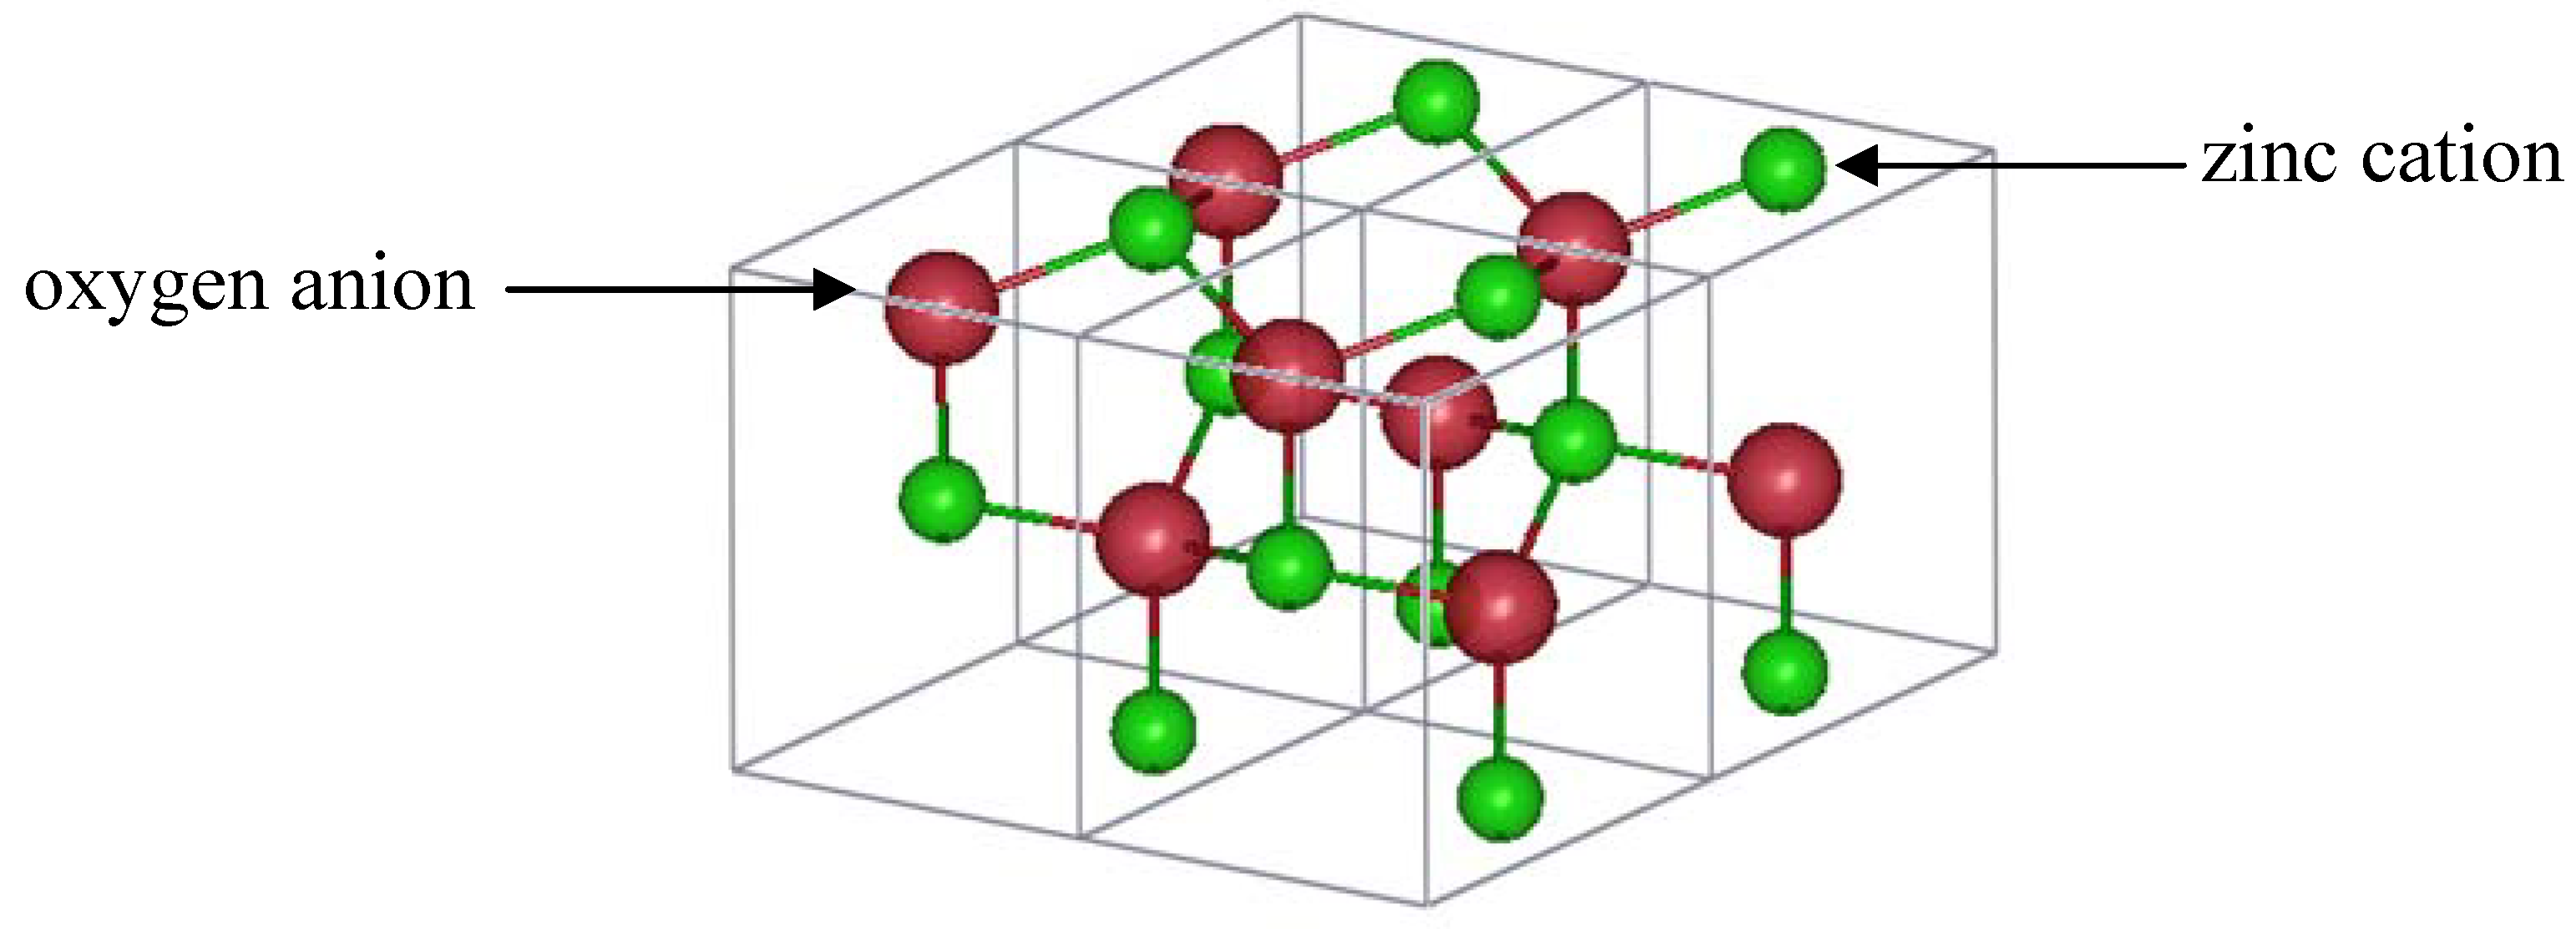
3.7. Wurtzite Zinc Oxide (ZnO)
Zinc oxide has attracted much attention from the scientific community for several reasons: zinc is non-toxic, abundant, and less expensive than indium, making it an attractive substitute to indium-based TCOs. In the last ten years, recent efforts have also focused on achieving significant p-type doping [
2,
71,
72,
73,
74,
75], which is advantageous for commercial applications. Furthermore, ZnO exhibits green luminescence, which makes it even more desirable for industrial uses. Zinc oxide crystallizes in the hexagonal wurtzite structure with space group P6
3mc (number 186) [
76,
77]. As shown in
Figure 6, one unit cell has a total of two zinc and two oxygen ions. Zinc is tetrahedrally coordinated to oxygen. Three Zn-O bond lengths are 1.98 Å and the fourth length is 1.99 Å. Oxygen anions also exhibit tetrahedral coordination to zinc cations. The lattice parameters of pure ZnO at room temperature are
a =
b = 3.2249 Å, and
c = 5.2066 Å, resulting in a
c/a ratio of 1.602. The atomic lattice has enough space to accommodate interstitial defects.
Figure 6.
ZnO wurtzite structure (four unit cells are shown).
Figure 6.
ZnO wurtzite structure (four unit cells are shown).
The defect structure of ZnO remains a controversial topic due to experimental difficulties in providing conclusive support for different proposed defect models. Theoretical calculations have aimed at explaining the n-type conductivity of undoped ZnO using various defect models [
5,
6,
7,
8,
9,
78]. Zinc interstitials (Zn
i), oxygen interstitials (O
i), oxygen vacancies (V
O), zinc vacancies (V
Zn), zinc antisites (Zn
O), oxygen antisites (O
Zn), hydrogen impurities, and/or defect complexes (such as V
O-Zn
i) have all been considered as possible defects. Formation energies for different charged, neutral, isolated, and complex defects and their location in the energy bands have been reported.
Kohan
et al. [
9] suggested that both zinc and oxygen vacancies were the most abundant native defects whose populations depend on the zinc partial pressure, and that the green luminescence was due to transitions between electrons in the conduction band and zinc vacancy levels and the presence of oxygen vacancies. On the other hand, Lany and Zunger [
5] predicted that V
O was the major defect resulting in non-stoichiometry in equilibrium-grown ZnO, while Zn
i species had large formation energies. Van de Walle proposed that none of the native defects were responsible for the conductivity, but that the dominant defect consisted of H
+ impurities usually incorporated unintentionally during synthesis on interstitial sites [
6]. Janotti and Van de Walle [
78] concluded that zinc vacancies were deep acceptors with low formation energies that can act as compensating defects in n-type ZnO. Furthermore, their calculations indicated that oxygen vacancies were deep donors with high formation energies but donor impurities such as substitutional hydrogen (on an oxygen site) were most likely responsible for the n-type conductivity. Experimental reports [
79,
80,
81,
82] have pursued the idea of H as a cause of n-type conductivity in both intentionally hydrogen “doped” specimens and in samples without an external hydrogen source.
Lee
et al. [
83] proposed and calculated the formation energies of different types of oxygen interstitials. Erhart
et al. [
7,
8] further investigated these defects that were predicted to exist under oxygen-rich conditions in the lower half of the band gap. The defects were referred to as octahedral interstitial (O
i, oct), and oxygen dumbbell interstitials (or split interstitial defects). The dumbbell configurations can be regular (O
i, db) or rotated (O
i, rot-db). The two oxygen atoms in the regular dumbbell defect had an oxidation state of −1 and occupied an oxygen lattice site. The defect was amphoteric acting as a donor and acceptor located at a deep state. Erhart
et al. [
7] proposed that regular dumbbell configuration may compensate for p-type doping in oxidizing conditions while the rotated dumbbell defect may compensate in n-type ZnO. Also under oxygen-rich conditions, but in the upper half of the band gap, zinc vacancies were predicted to be energetically stable. While under zinc-rich conditions, oxygen vacancies would be favored.
Ischenko
et al. [
84] prepared nanoparticles and studied their defects using XRD, EXAFS, FTIR, electron paramagnetic resonance (EPR), photoluminescence (PL), and magic-angle spinning nuclear magnetic resonance (MAS-NMR). The samples were prepared from an organometallic precursor. EXAFS measurements were conducted at the Hasylab E4 station at the Zn
K edge in transmission mode. XRD measurements were performed using a conventional Cu
Kα source and a position-sensitive detector. The diffraction data were analyzed to obtain lattice parameters and anisotropic particle size and strain. At 150 °C, XRD and EXAFS measurements indicated that long-range order was absent due to the presence of nanosized crystallites. As the temperature increased up to 450 °C, the particles grew to 25 nm and the XRD peaks sharpened. Coordination numbers and bond lengths were not reported but the EXAFS spectra from low thermolysis temperatures were significantly attenuated compared to bulk samples, indicating the effect of defects. As the temperature was increased, the EXAFS approached the bulk behavior. The
c lattice parameter decreased almost linearly with annealing temperature, while the
a lattice parameter exhibited a non-linear increase. This effect was consistent with the anisotropy in both the grain morphology and microstrain.
Ischenko
et al. [
84] also utilized EPR spectroscopy to study the presence of impurities and oxygen vacancies in the samples. Two types of paramagnetic signals were observed. A low-field signal was attributed to an unpaired electron trapped on an oxygen vacancy site (
VO+), while the nature high-field signal was less clear. The authors proposed that the origin of the high-field signal was due to one electron weakly bound to ionized impurity atoms (e.g., C, Al, Ga, In). The authors also reported that under equilibrium conditions the predicted concentration of oxygen vacancies at 800 °C was extremely small, on the order of 10
−5 mol% (ZnO
0.99993). By increasing the thermolysis rates at which samples were prepared, both signals became stronger indicating the presence of more defects under non-equilibrium conditions. Annealing at up to 800 °C resulted in a reduction of defect population. An interesting observation was that when ZnO was annealed in Zn vapor at 850 °C or in vacuum, the signal attributed to impurities was present but the signal due to oxygen vacancies was absent. The authors suggested that the effect of high Zn-rich conditions was the creation of more Zn
i defects instead of oxygen vacancies, contrary to theoretical predictions. Vlasenko and Watkins [
85] created defects in ZnO by electron irradiation, and using optical detection of electron paramagnetic resonance (ODEPR) they detected the presence of Zn
i+ in ZnO as an isolated species and as a Frenkel pair with
VZn−. These zinc defects were introduced at 4.2 K and were highly mobile with temperature annealing; however they disappeared by 200 K and were not stable at room temperature. This ODEPR study also found that oxygen vacancies were deep level defects [
85,
86]. The photoluminescence of the different samples prepared by Ischenko
et al. [
84] depended on sample preparation conditions, and no direct correlation was found between green luminescence and the concentration of oxygen vacancies as proposed by Kohan
et al. [
9].
EXAFS and XANES studies on thin films and nano-powders of ZnO were investigated by several research groups [
87,
88,
89,
90]. Tran
et al. [
87] studied nanocrystalline thin films grown under different water conditions. EXAFS data were collected at the Australian National Beamline Facility using a fluorescence detector. The films ranged from amorphous to crystalline and highly textured at higher water pressures. For the crystalline films, the particle size was calculated by examining the XRD peaks, and ranged from 15 nm to 40 nm. XPS data showed that up to 10 at.% of carbon was present and increased with decreasing water pressures. For all films the Zn-O and Zn-Zn distances were 1.97(5) Å and 3.25 Å, respectively, which agreed with the values for bulk ZnO. In ideal ZnO, the first coordination shell has 4 neighbors and the second has 12. When allowing the coordination numbers to vary, the analysis resulted in very low coordination numbers: 1.5 to 2 for the first shell and 2 to 5 for the second shell. The authors attributed these low values to the presence of oxygen vacancies. If the Debye-Waller factors were varied while keeping the coordination numbers fixed to 4 and 12, the disorder in the films was also evident from EXAFS results.
Chiou
et al. [
88] conducted angle-dependent XANES measurements at the O
K, Zn
L3 and Zn
K edges to study nanorods. The samples were 250 nm long and 45 nm in diameter. The authors concluded that the tip surfaces of the ZnO nanorods were terminated by oxygen ions and that the nanorods were oriented along the [000ī] direction. Han
et al. [
89] also studied nanorods using orientation dependent EXAFS at the Zn
K edge. The length of the rods along the
c direction was 1 μm, while the diameters were 37(3) nm and 13(5) nm when grown at 500 °C and 800 °C, respectively. The
a lattice parameters contracted by 0.04 Å while the
c parameter expanded by 0.1 Å compared to bulk ZnO. The coordination numbers for the nanorods and the bond lengths for higher coordination shells were comparable to those of bulk. However the bond lengths for Zn-O differed from ideal ZnO. These authors concluded that the nanorods were terminated by oxygen, in agreement with the work of Chiou
et al. [
88].
Yu
et al. [
90] used angle-dependent XANES and EXAFS to study the local structure of ZnO thin films. XRD measurements were performed at the 10B X RS KIST-PAL beamline while EXAFS experiments were carried out at the 3 C1 beamline of the Pohang Light Source in Korea. The films were epitaxial, and strain decreased with increasing film thickness, up to 800 Å. The coordination numbers were fixed to ideal ZnO while bond lengths and Debye-Waller factors were refined. The first Zn-O coordination shells exhibited differences compared to bulk, while higher coordination shell bonds approached those of ideal ZnO. Also an increase in carrier concentration, Hall mobility and overall conductivity were measured as the films became thicker.
3.8. Aluminum-Doped Zinc Oxide (AZO)
Doped ZnO exhibits improved electrical properties compared to pure ZnO. Aluminum 3+ ions result in a higher electron concentration when they substitute for zinc 4+ ions. Electron concentrations on the order of 10
20 cm
−3 can be obtained [
73]. The binary Al
2O
3-ZnO phase diagram prepared by Hansson
et al. [
91] determined that the equilibrium solubility of aluminum in ZnO expressed as mol fractions were 0.002 at 1250 °C, 0.005 at 1400 °C, 0.010 mol 1550 °C and 0.089 at 1695 °C. However, for thin films and nanopowders it is possible to reach much higher doping levels due to metastable synthesis conditions. The purpose of hydrogen anneals in n-type TCOs, as mentioned before, is to increase the conductivity of the materials. In the case of ZnO, as described in the previous section, the role of hydrogen as a dopant has been proposed. In AZO, several reports have also suggested that hydrogen plays a major role in defect creation and in enhancing the n-type conductivity [
92].
Lany and Zunger [
5] found that substitutional Al
Zn species in ZnO
0.99Al
0.01O were shallow donors, which were expected to create free carrier due to their low formation energy. Theoretical calculations by Bazzani
et al. [
93] evaluated substitutional, interstitial and clusters of Al defects in AZO. For low doping levels, the Al-O bonds were on the order of 1.8 Å, close to the bond length in Al
2O
3. This length increased with doping. Their results proposed that up to 3% Al can be occupied in substitutional Zn sites. However, for higher doping concentrations, interstitial defects having large effective masses and low electron mobilities were expected to be significant and contribute to a decrease in conductivity. Also as the Al concentration increased, the Zn atoms were forced to move into interstitial positions changing the local coordination of the Zn-O bonds and resulting in inferior optical and electrical properties.
Brehm
et al. [
94] studied the local structure of Al-, Ga-, and In-doped nanocrystalline ZnO materials. XRD measurements were performed using a Cu
Kα source and the data were analyzed using the Rietveld method [
28] to obtain lattice parameters, microstrain, and grain size. EXAFS data were measured at the Zn, In, and Ga
K edges in transmission mode at beamlines A1 and X1 at HASYLAB. EXAFS measurements at the Al
K edge were not conducted but data from the Zn experiments were reported for AZO samples. EXAFS data were analyzed using a reverse Monte Carlo method that allows the simultaneous fit of spectra from two different absorbing elements [
95]. The pair distribution functions obtained by this technique were analyzed to extract coordination numbers and distances. The AZO samples had 0, 2, and 5% Al with a particle size of 25.2(4), 13.3(6) nm and 11.1(4) nm, respectively. The ionic radius of Al
3+ is smaller than that of Zn
2+ for both tetrahedral and octahedral coordination. The
a lattice parameter increased linearly with Al doping, while the
c parameter decreased. Similar doping effects in particle size [
96] and in the
c parameter have been reported for nanopowders with Al-doping levels up to 25% [
97]. The overall effect on doping was an increase in the volume of the lattice, a decrease in the
c/
a ratio, and an increase in microstrain probably due to the shortening of the Zn-O bond along the
c-axis direction. Pair distribution function data for AZO at the Zn edge were modeled assuming substitutional Al and resulted in a splitting of the first Al peak. The authors interpreted this result as an indication that Al did not substitute into the Zn sites but rather occupied octahedral interstitial sites.


