3.2. Polarization vs. Applied Electric Field
Polarization
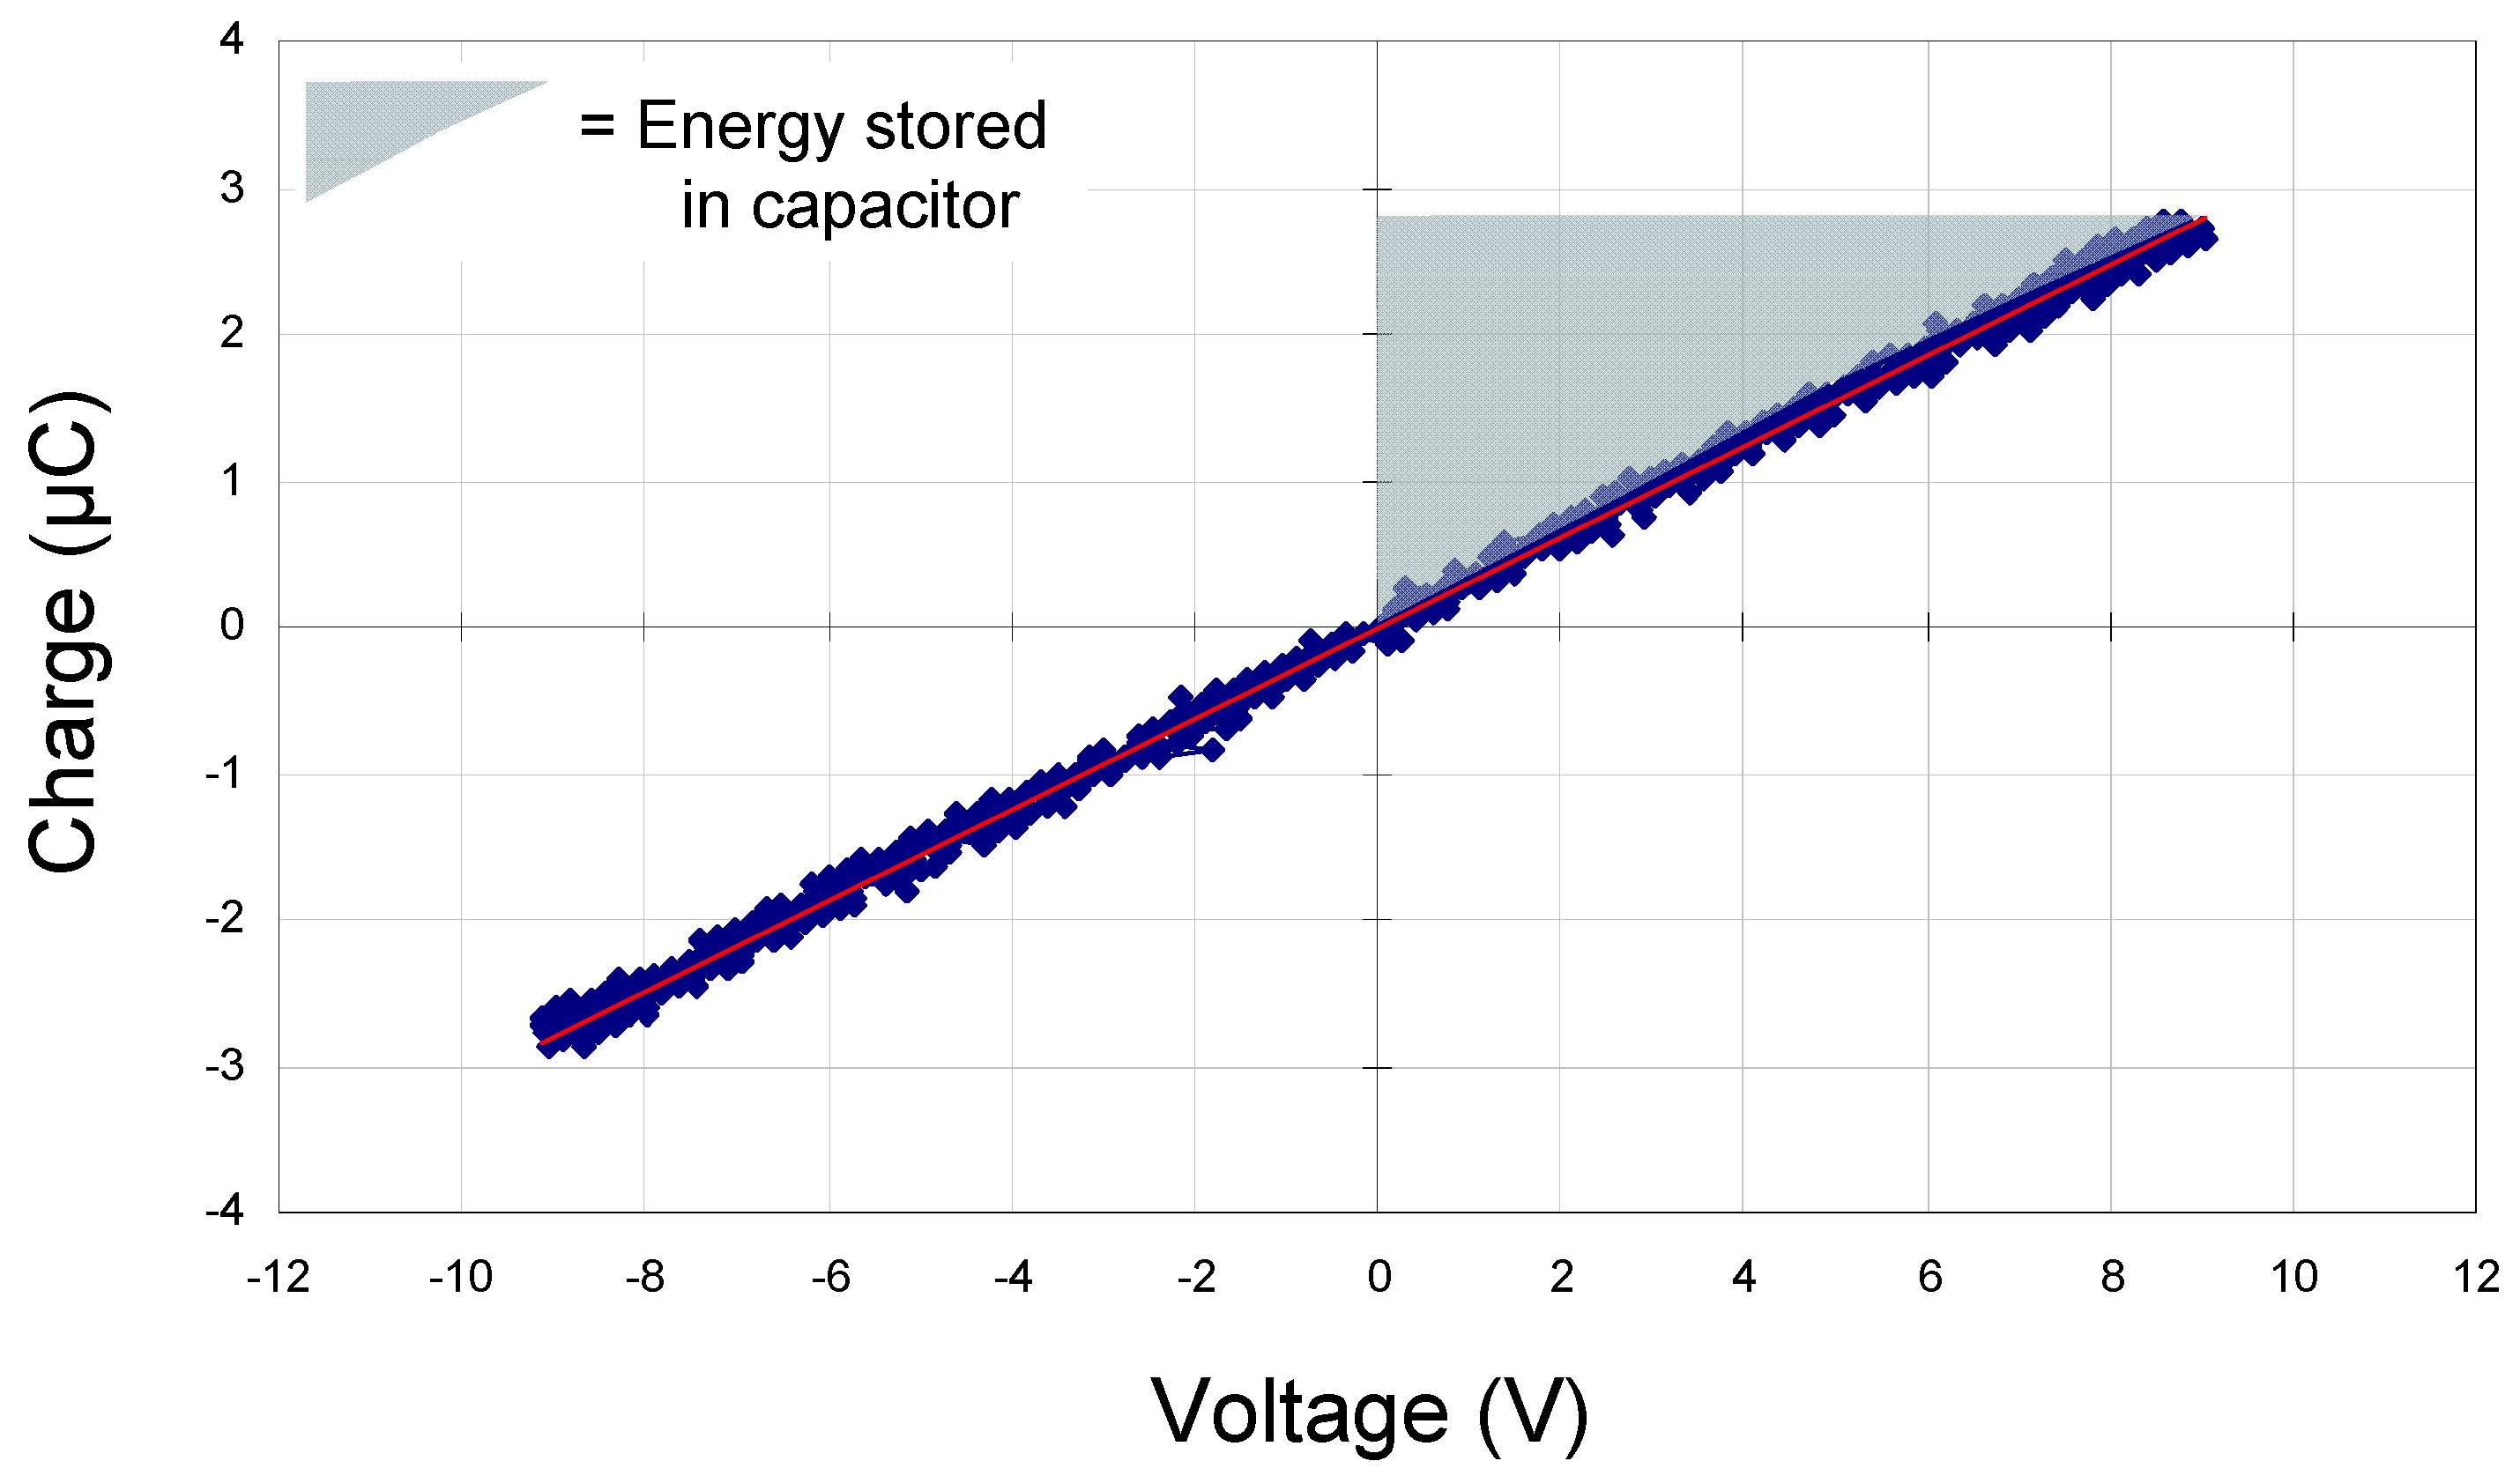
vs. electric field data were acquired at a frequency of 20 Hz using a home-built Sawyer Tower circuit. Prior to measuring our samples, we tested this using a standard 330 nF commercial capacitor (
Figure 2). The area of the shaded triangle shows the amount of energy that can be stored in the device,
ʃE·dq (since this is a standard commercial capacitor, the value is simply
½QVapp or
½CV2). Polarization
vs. electric field data for two thin-film capacitors with modified barium titanate dielectrics are illustrated in
Figure 3 and
Figure 4.
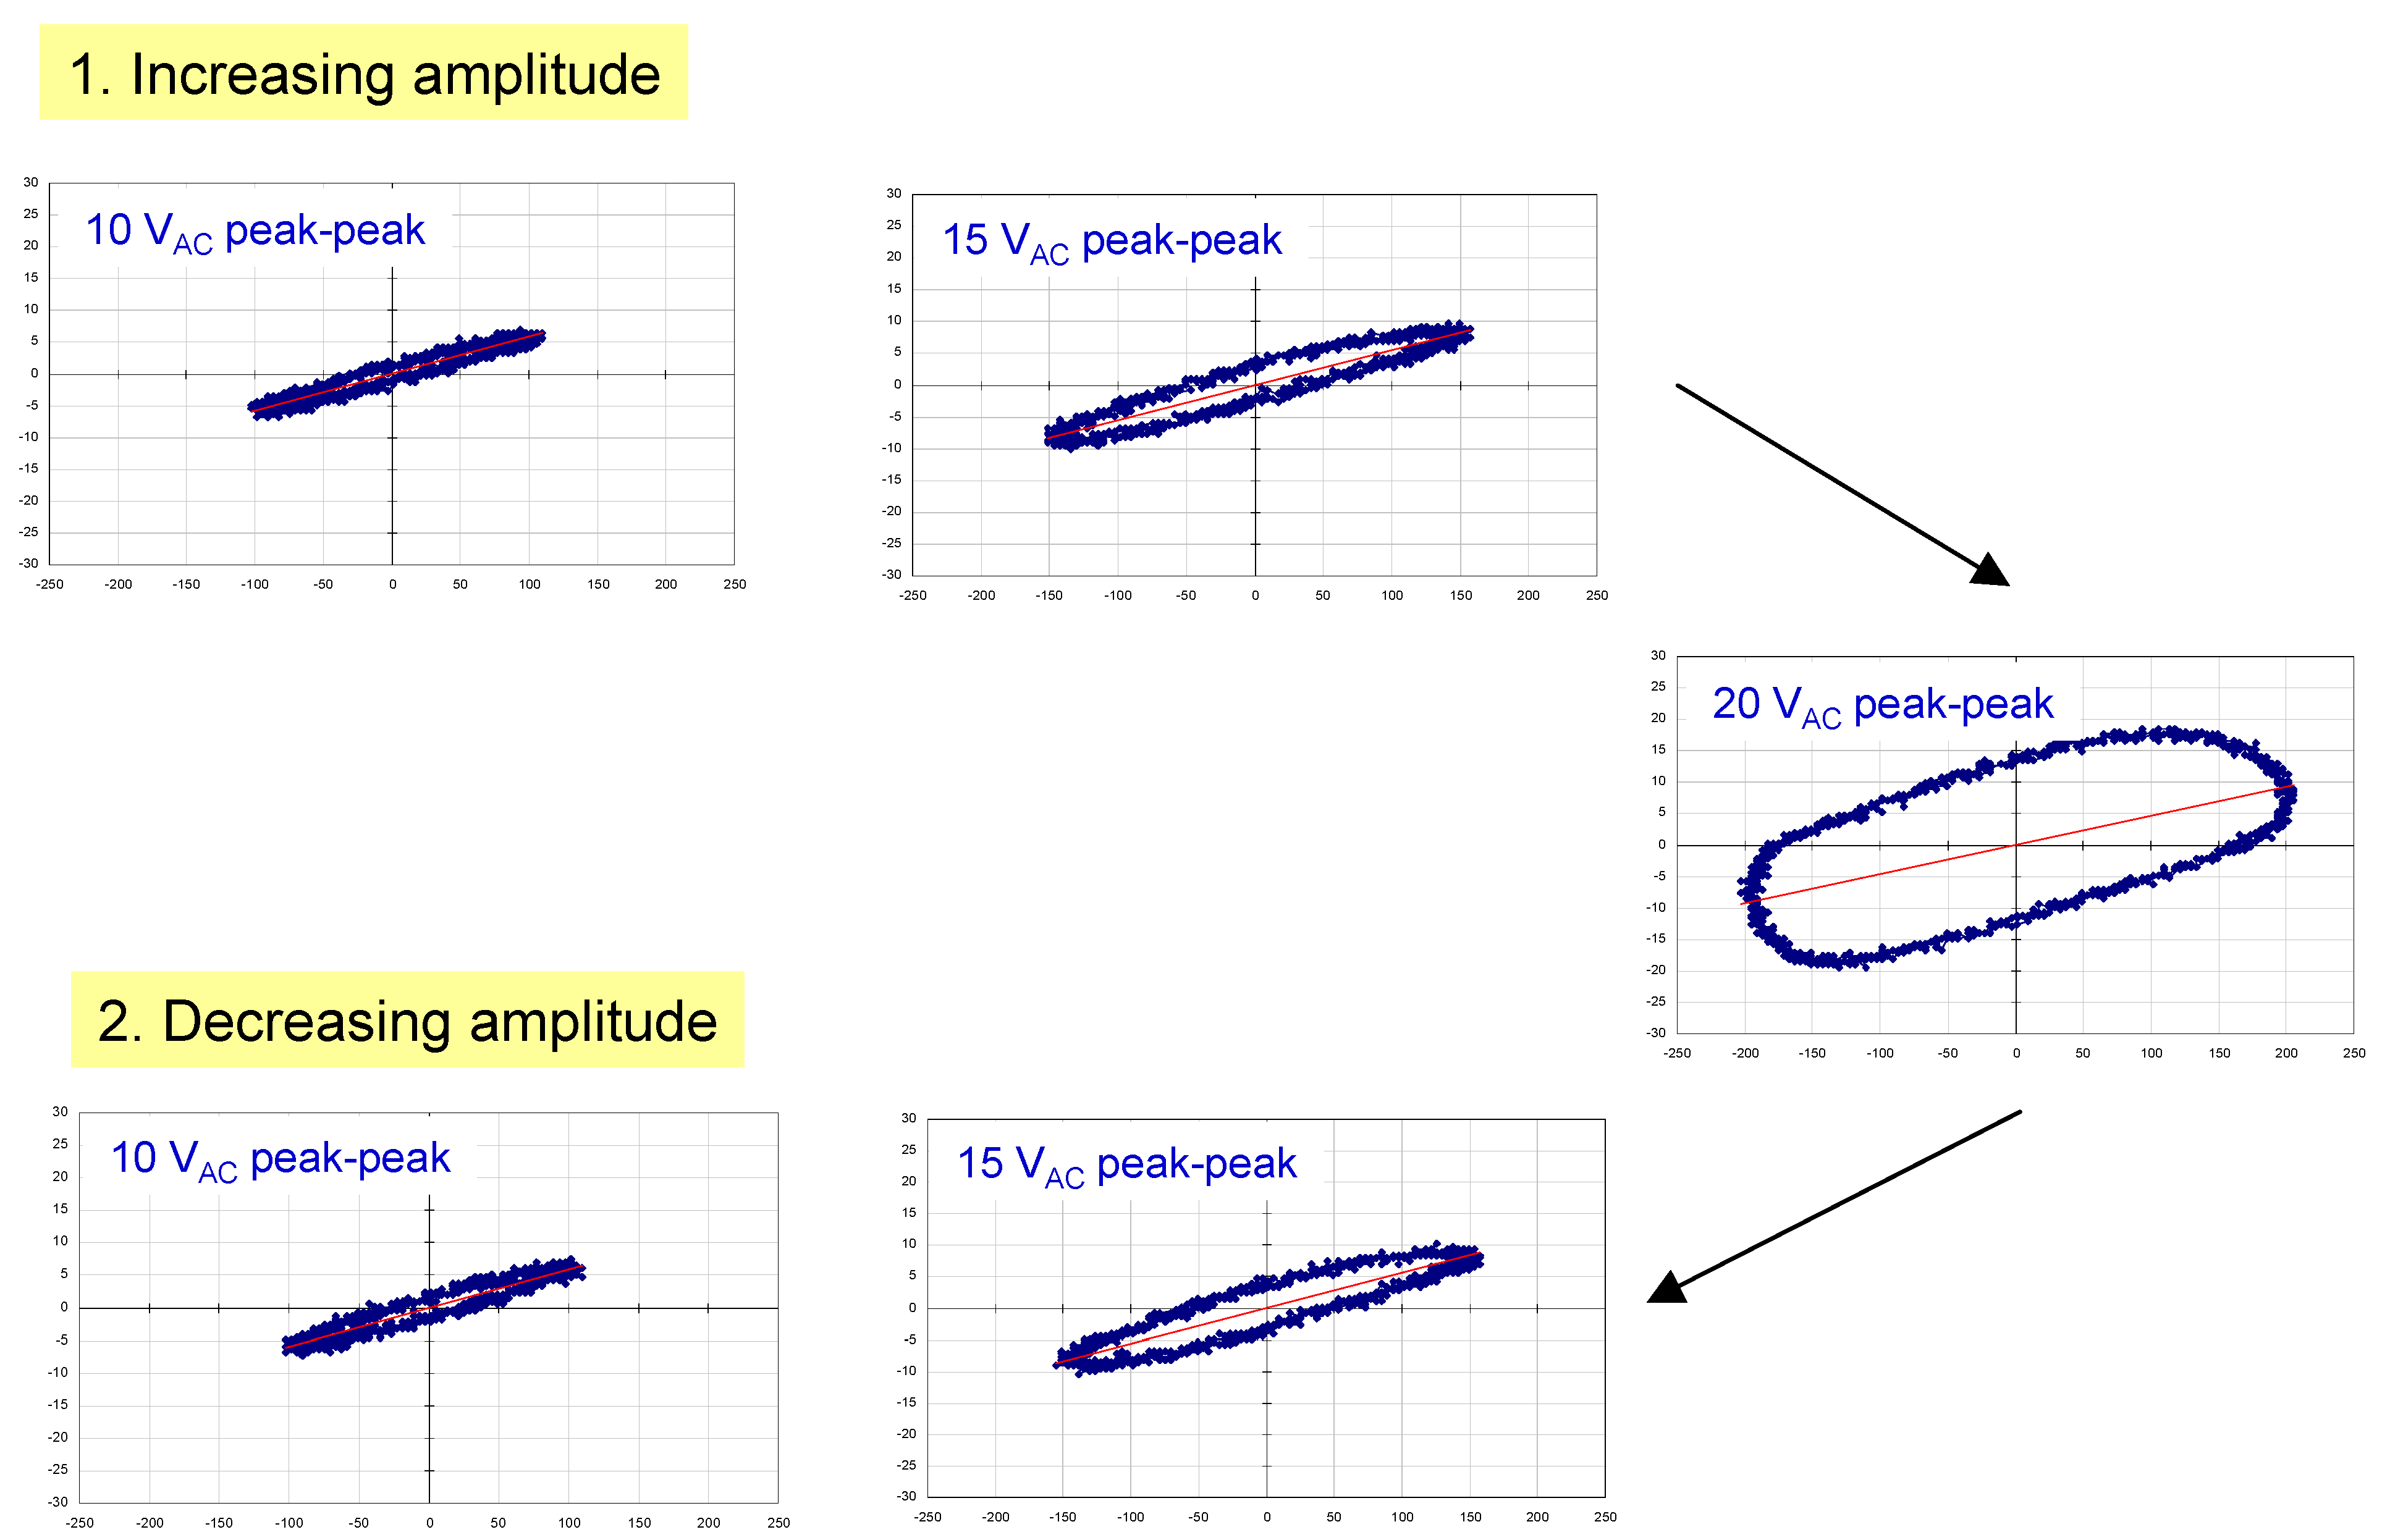
Figure 3 shows a family of hysteresis loops for a BCZTO sample with a Pt bottom electrode, a dielectric deposited at 700 °C, 10 mtorr pressure, a sputter gas mixture of 10% oxygen/90% argon, and a Ni top electrode. This capacitor exhibited higher dielectric loss than a similar capacitor where the dielectric was sputter deposited at 900 °C (see
Figure 1), especially at higher AC amplitudes, although dielectric breakdown was not observed up to 20 V peak-to-peak (for the ~500 nm thick dielectric, this represents a maximum electric field strength of ~200 kV/cm). On reducing the AC amplitude, the residual loss appeared to have increased: we hypothesize that the test current, though not sufficient to cause instant breakdown of the dielectric, did cause internal heating of the device—enough to cause some damage.
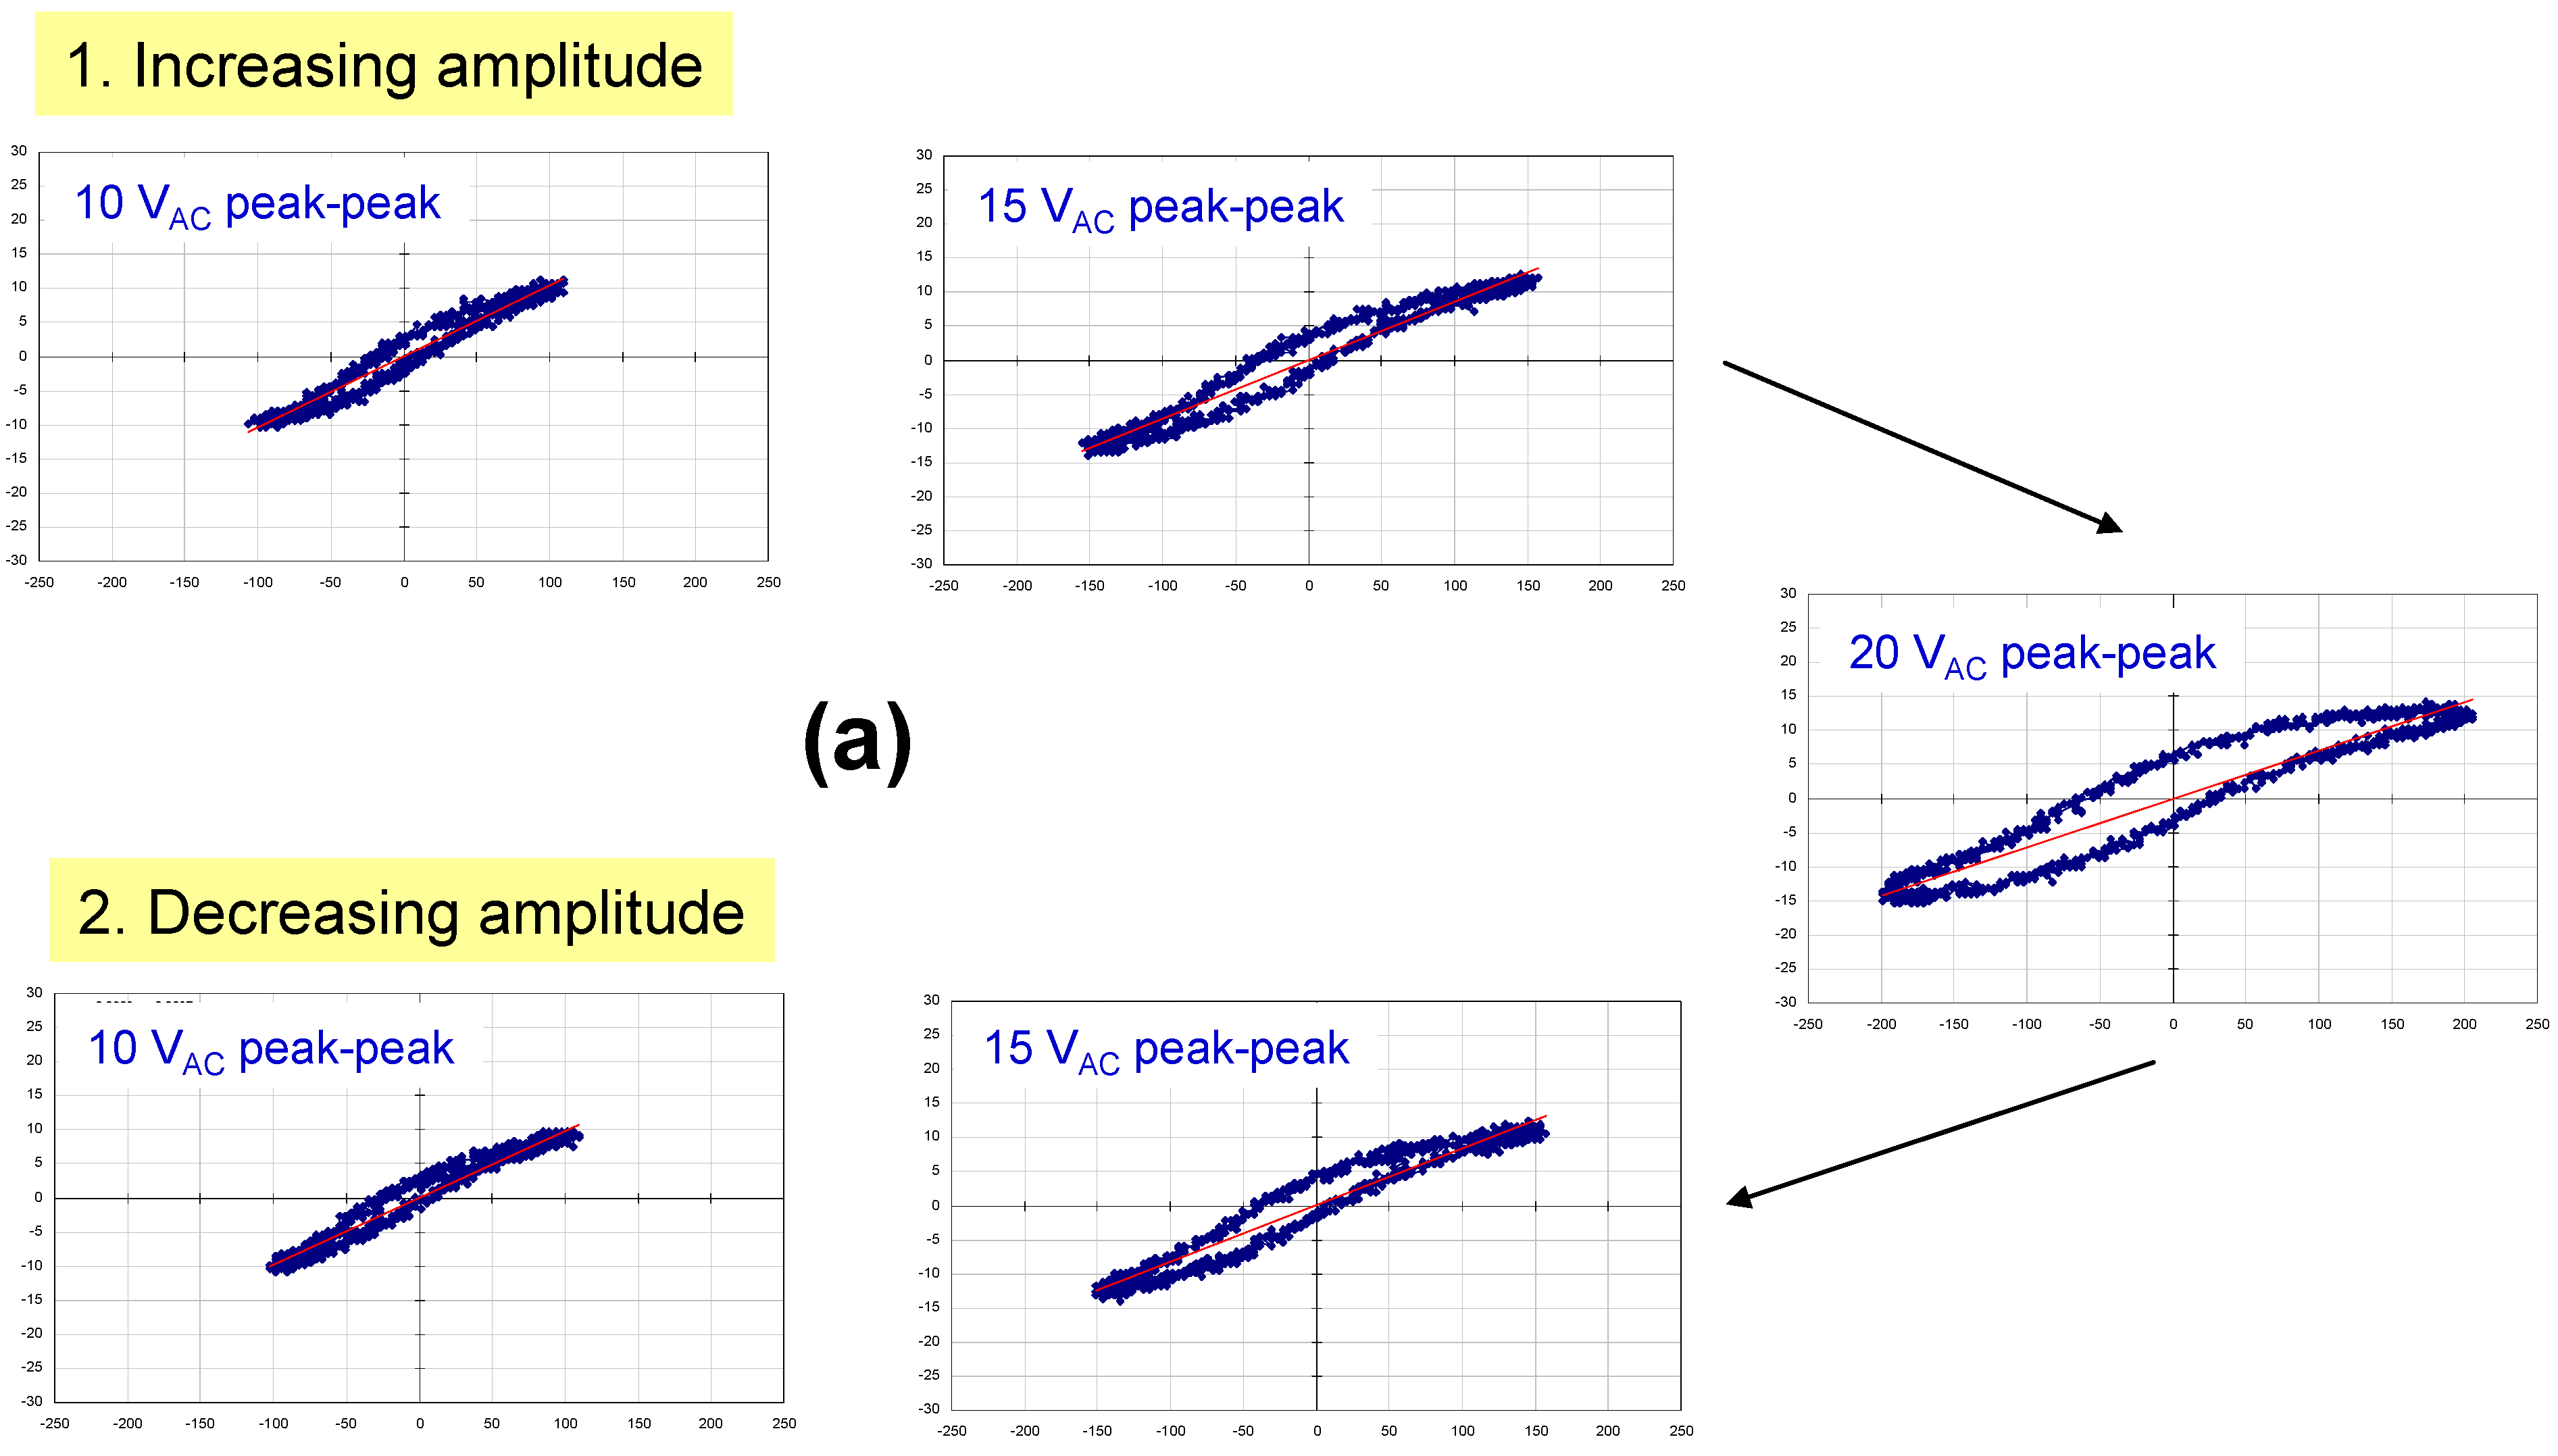
Figure 4a shows similar data for a capacitor with lower loss: in this case, the dielectric was deposited at 900 °C—all other parameters were identical to the sample of
Figure 3 (where the dielectric was deposited at 700 °C). We hypothesize that the quality of the BCZTO films was improved with higher deposition temperature. Higher oxygen partial pressures in the sputter ambient help to prevent the formation of large numbers of oxygen vacancies in the dielectric that in turn could lead to an increase in conductivity and loss.
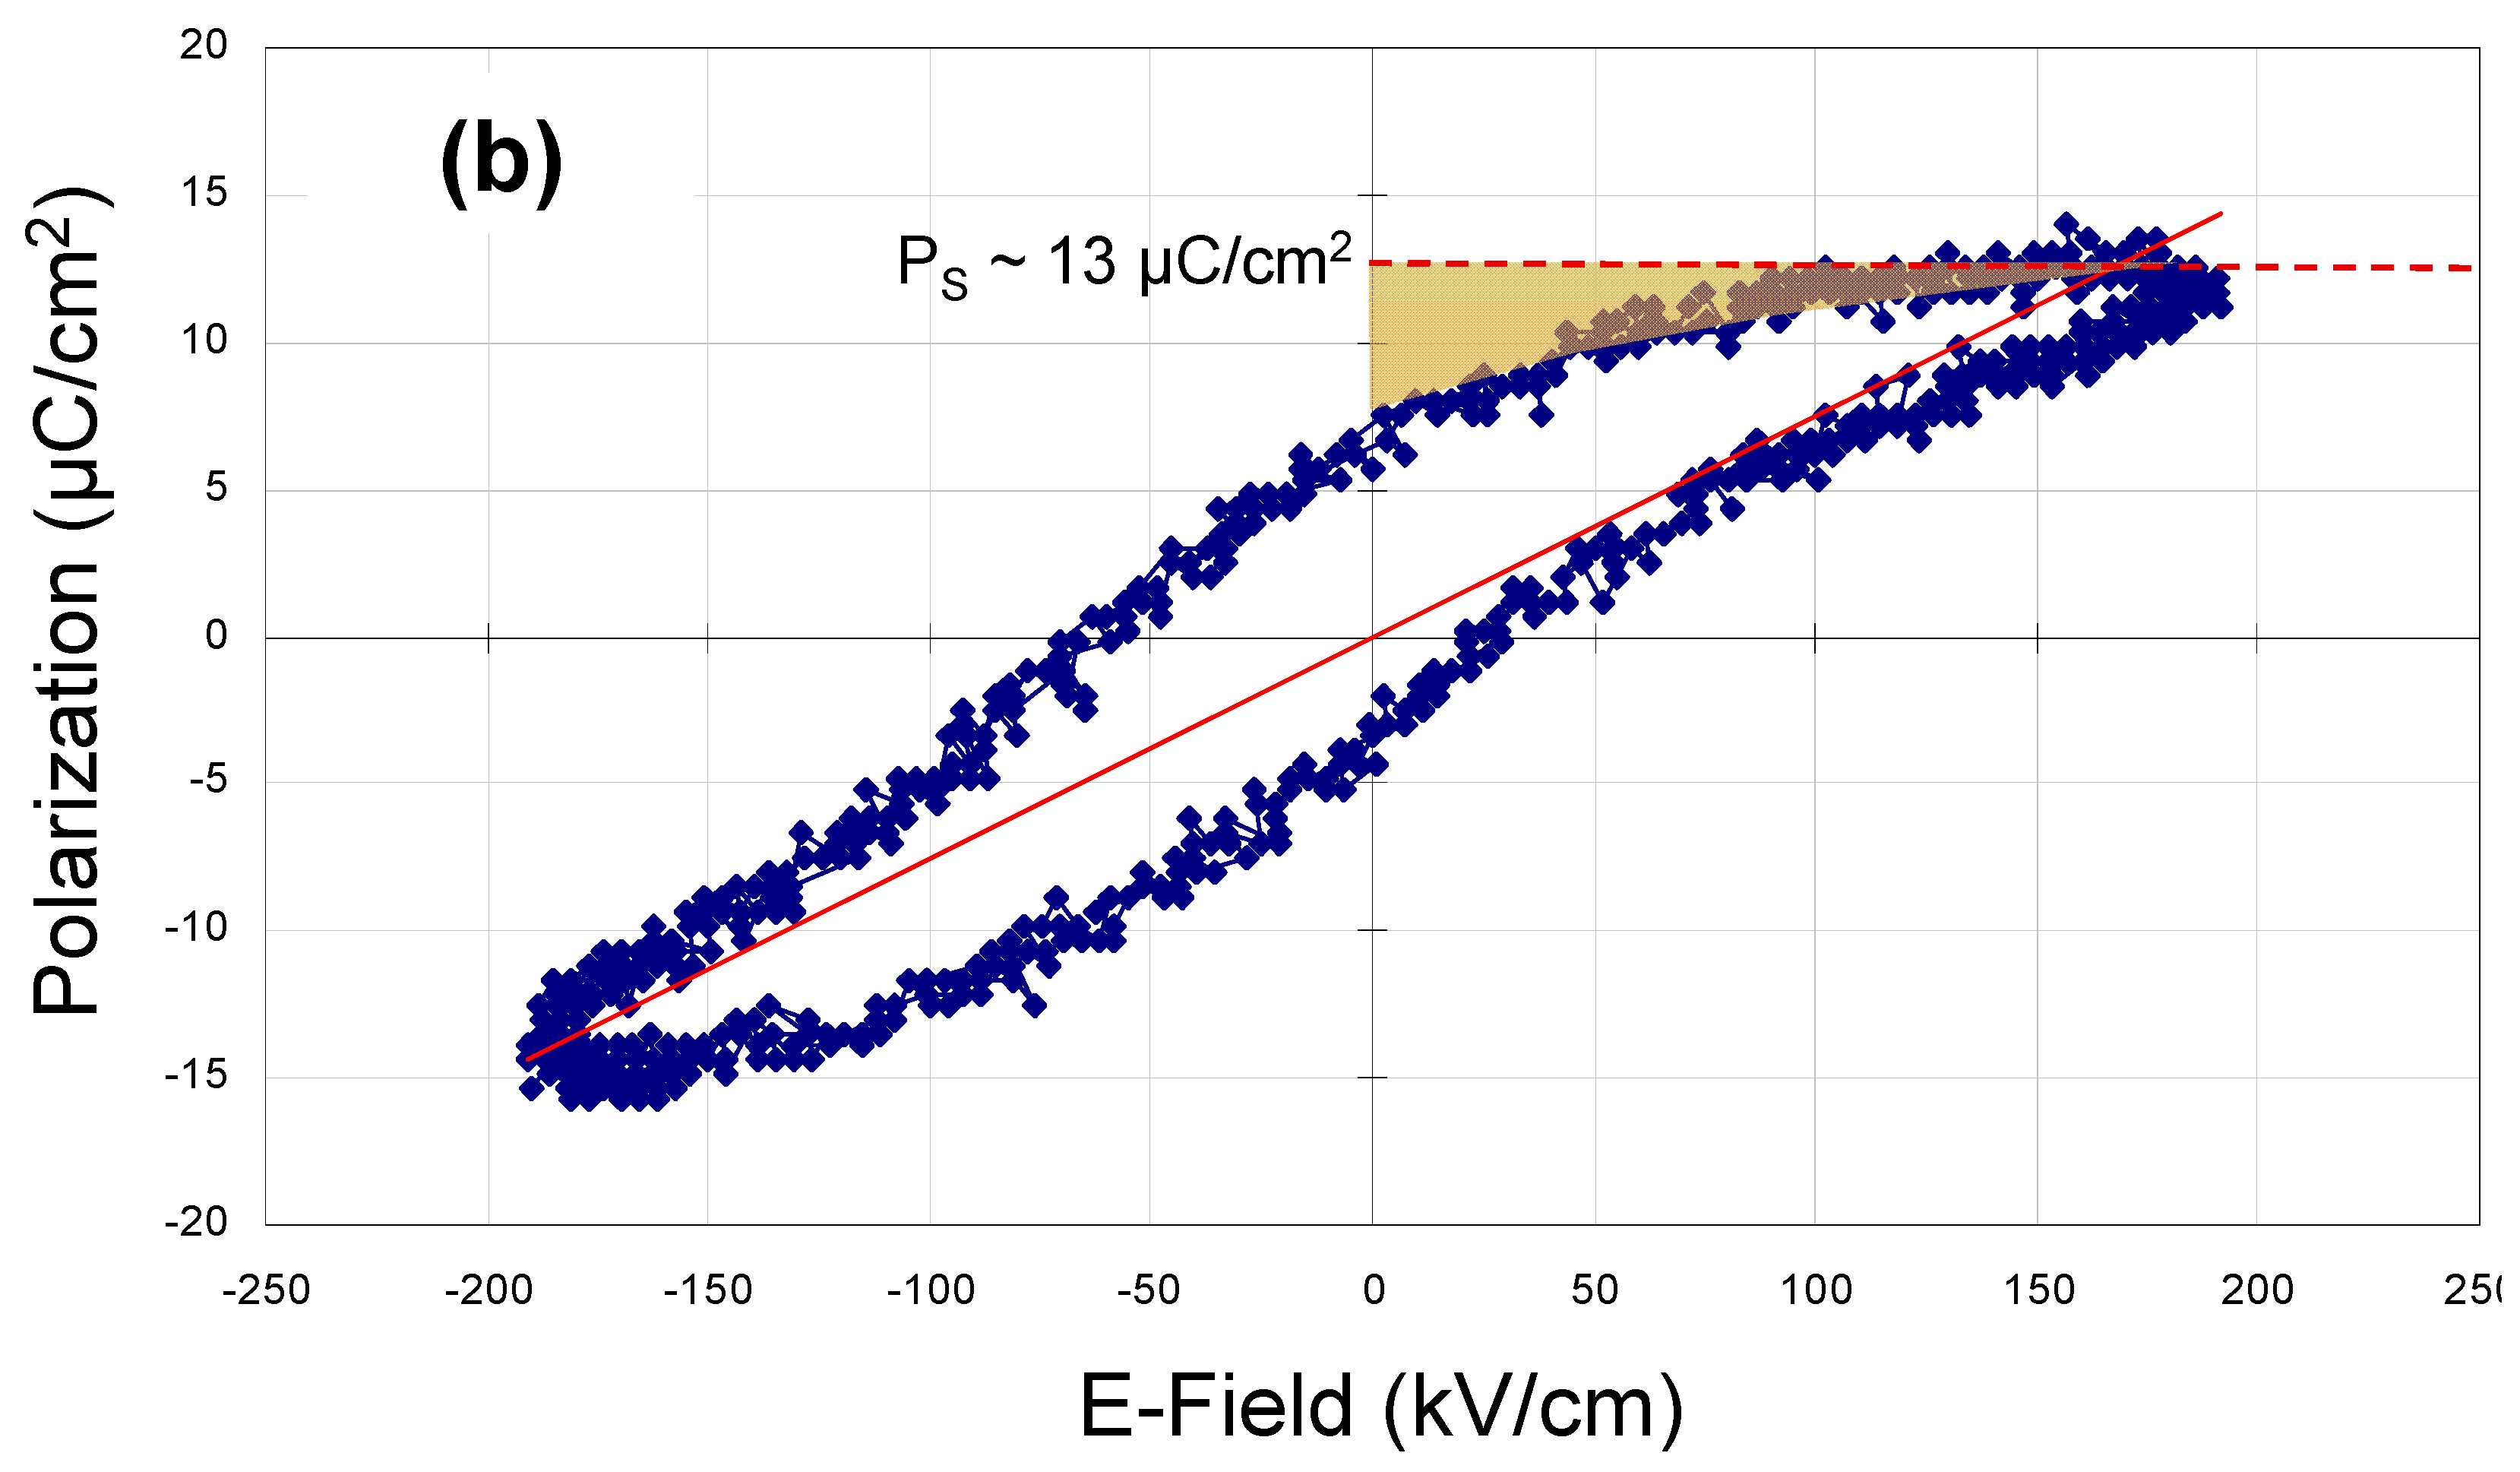
Figure 4b is a blow up of
Figure 4a at maximum applied AC amplitude (20 V peak-to-peak). It illustrates the onset of dielectric saturation at an applied field strength of ~100 kV/cm and also shows how hysteresis loop data can be used to measure the amount of electrical energy that can be stored in these thin-film capacitors (
ʃE·dq measured as the voltage across the capacitor is decreasing).
The saturated polarization of the sample of
Figure 4 (a capacitor with a Pt bottom electrode, a BCZTO dielectric deposited at 900 °C, 10 mtorr pressure, a sputter gas mixture of 10% oxygen/ 90% argon, and a Ni top electrode) was measured as ~13 μC/cm
2 at a field strength of ~190 kV/cm: this corresponded to a stored energy density of ~0.34 J/cm
3 or 9.4 × 10
−2 W-h/liter, calculated based on the volume of the dielectric material only. Using a theoretical bulk density of 6.02 g/cm
3 for barium titanate from the literature [
15], the calculated specific energy was ~1.6 × 10
−2 W-h/kg, again based on the estimated mass of the dielectric only.
Figure 2.
Charge vs. voltage for 330 nF standard commercial capacitor. The shaded triangle shows the amount of energy that can be stored in the device (ʃE·dq).
Figure 2.
Charge vs. voltage for 330 nF standard commercial capacitor. The shaded triangle shows the amount of energy that can be stored in the device (ʃE·dq).
Figure 3.
Polarization vs. applied voltage hysteresis loops measured at 20 Hz for a capacitor with a Pt bottom electrode, a BCZTO dielectric deposited at 700 °C, 10 mtorr pressure, a sputter gas mixture of 10% oxygen/ 90% argon, and a Ni top electrode.
Figure 3.
Polarization vs. applied voltage hysteresis loops measured at 20 Hz for a capacitor with a Pt bottom electrode, a BCZTO dielectric deposited at 700 °C, 10 mtorr pressure, a sputter gas mixture of 10% oxygen/ 90% argon, and a Ni top electrode.
Figure 4.
(a) Polarization vs. applied voltage hysteresis loops measured at 20 Hz for a capacitor with a Pt bottom electrode, a BCZTO dielectric deposited at 900 °C, 10 mtorr pressure, a sputter gas mixture of 10% oxygen/ 90% argon, and a Ni top electrode; (b) Blow up of hysteresis loop in (a) at 20 V peak-to-peak.
3.3. DC Load/Unload Data
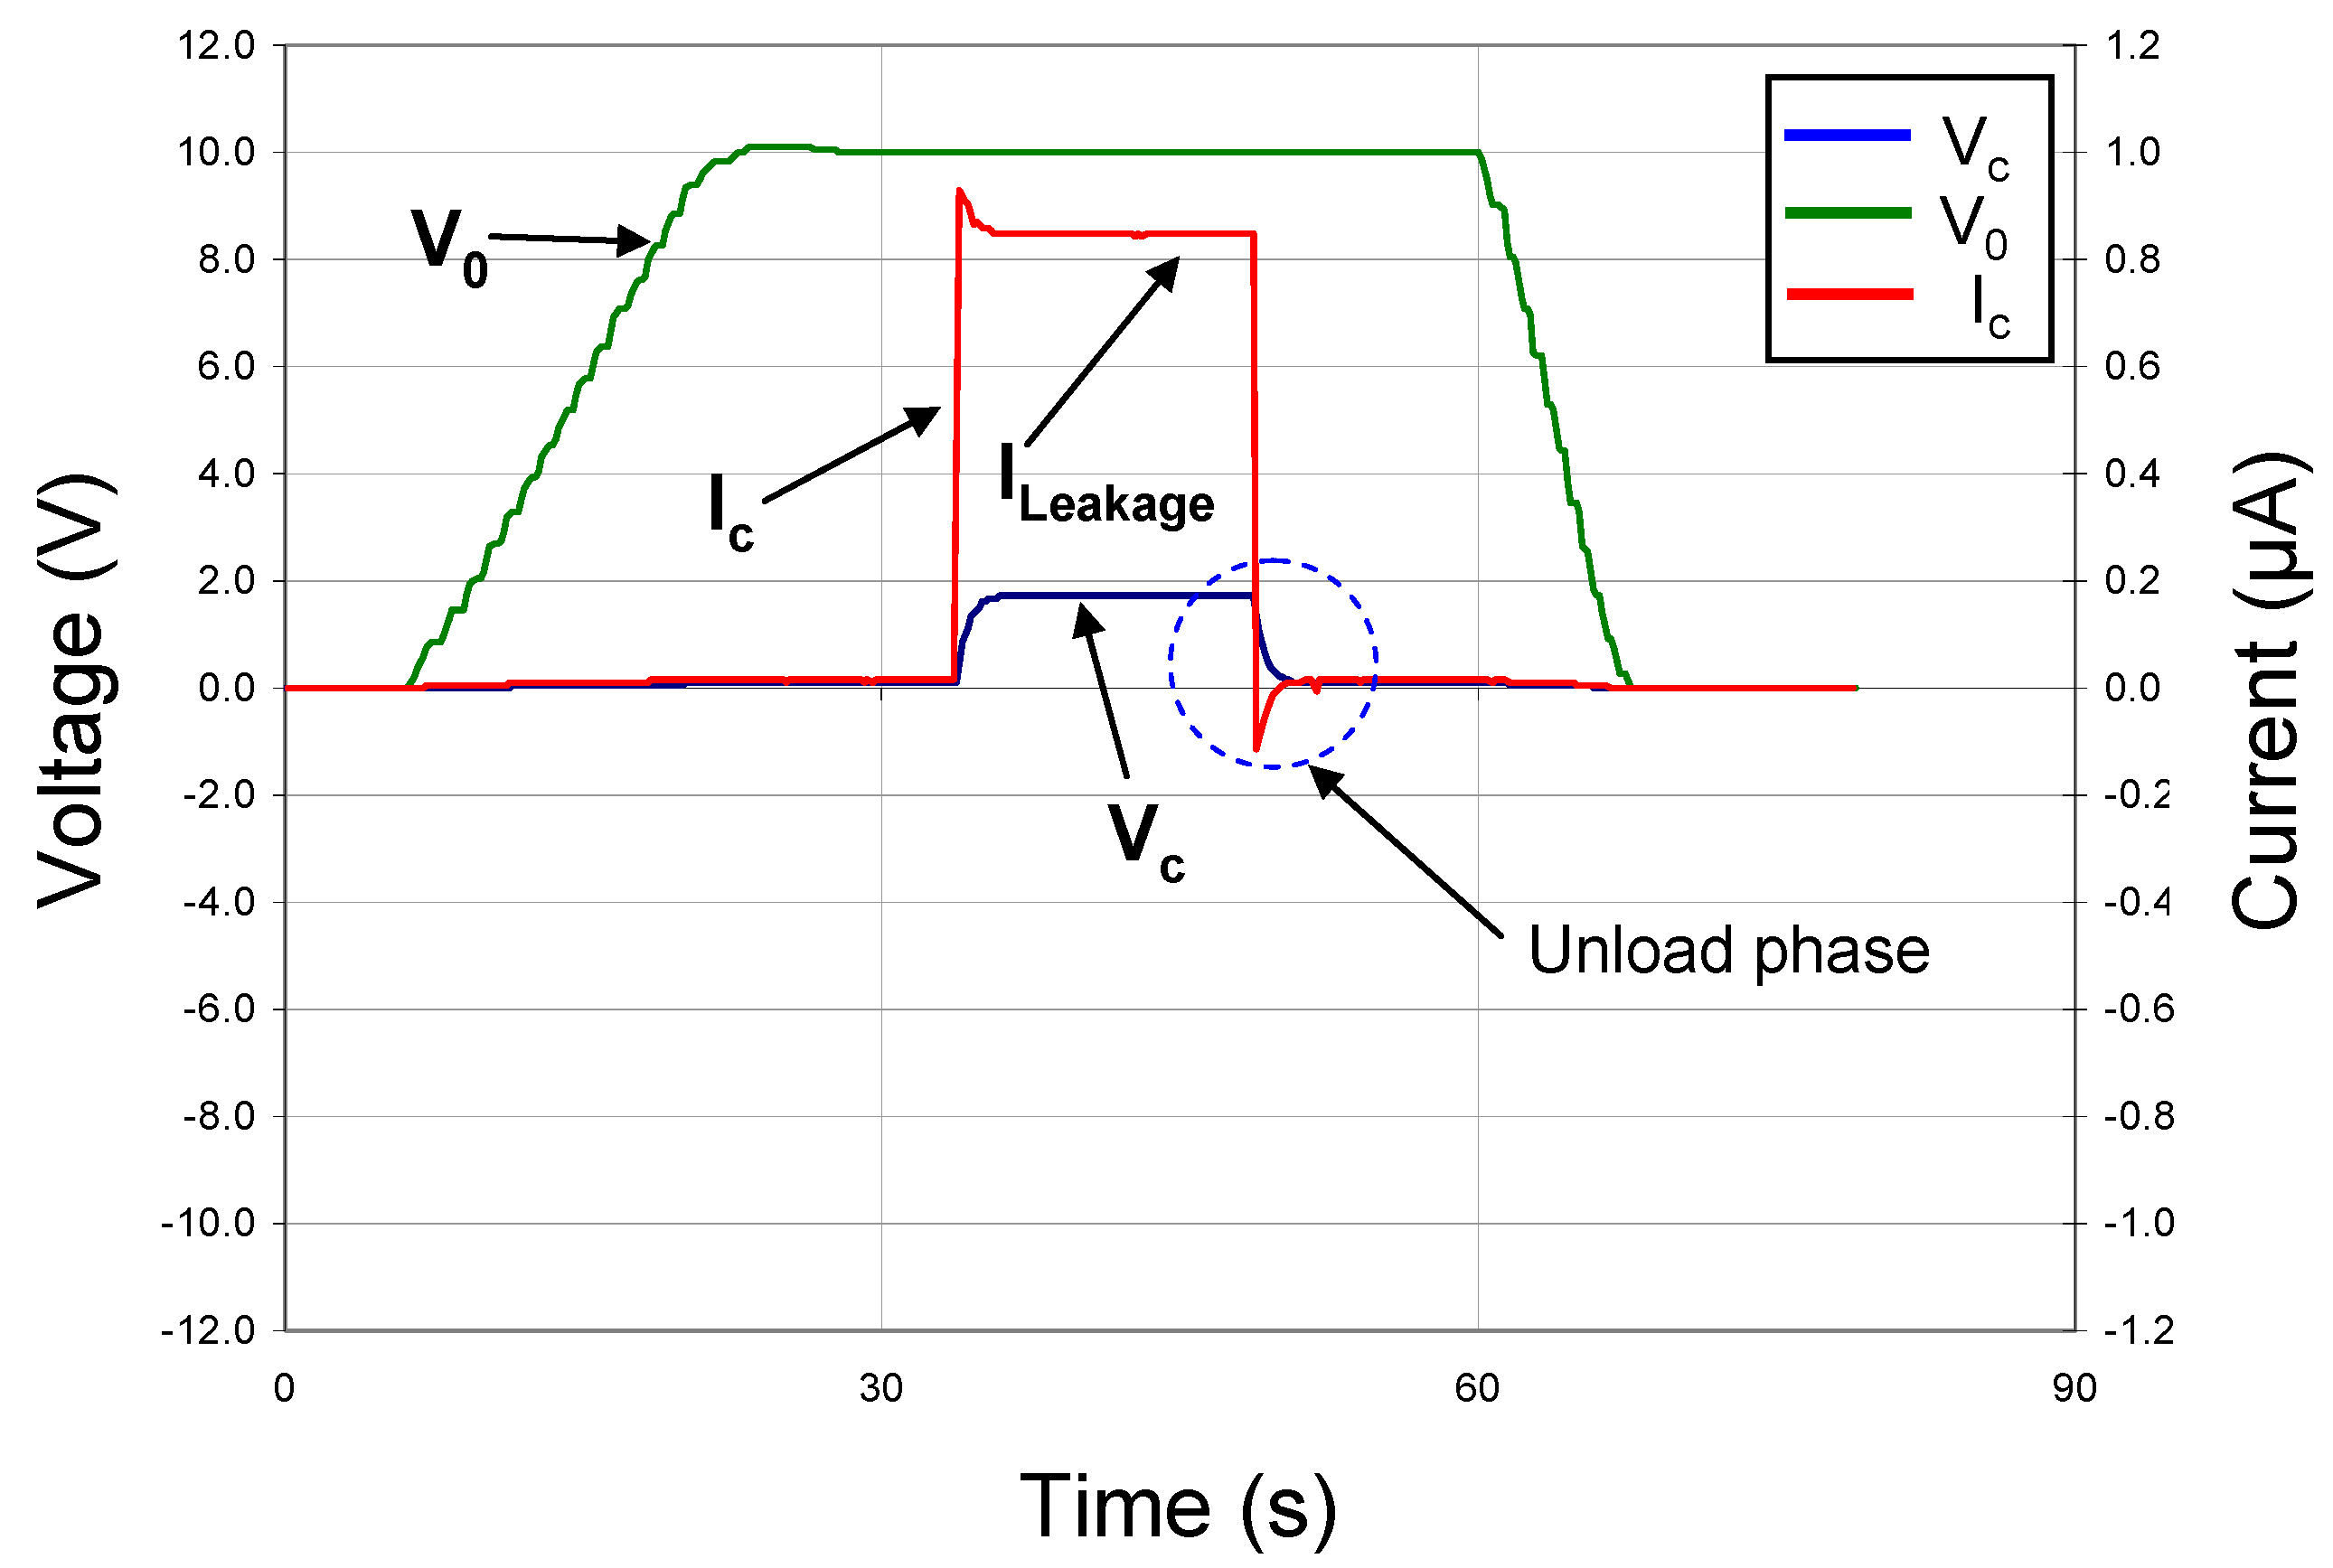
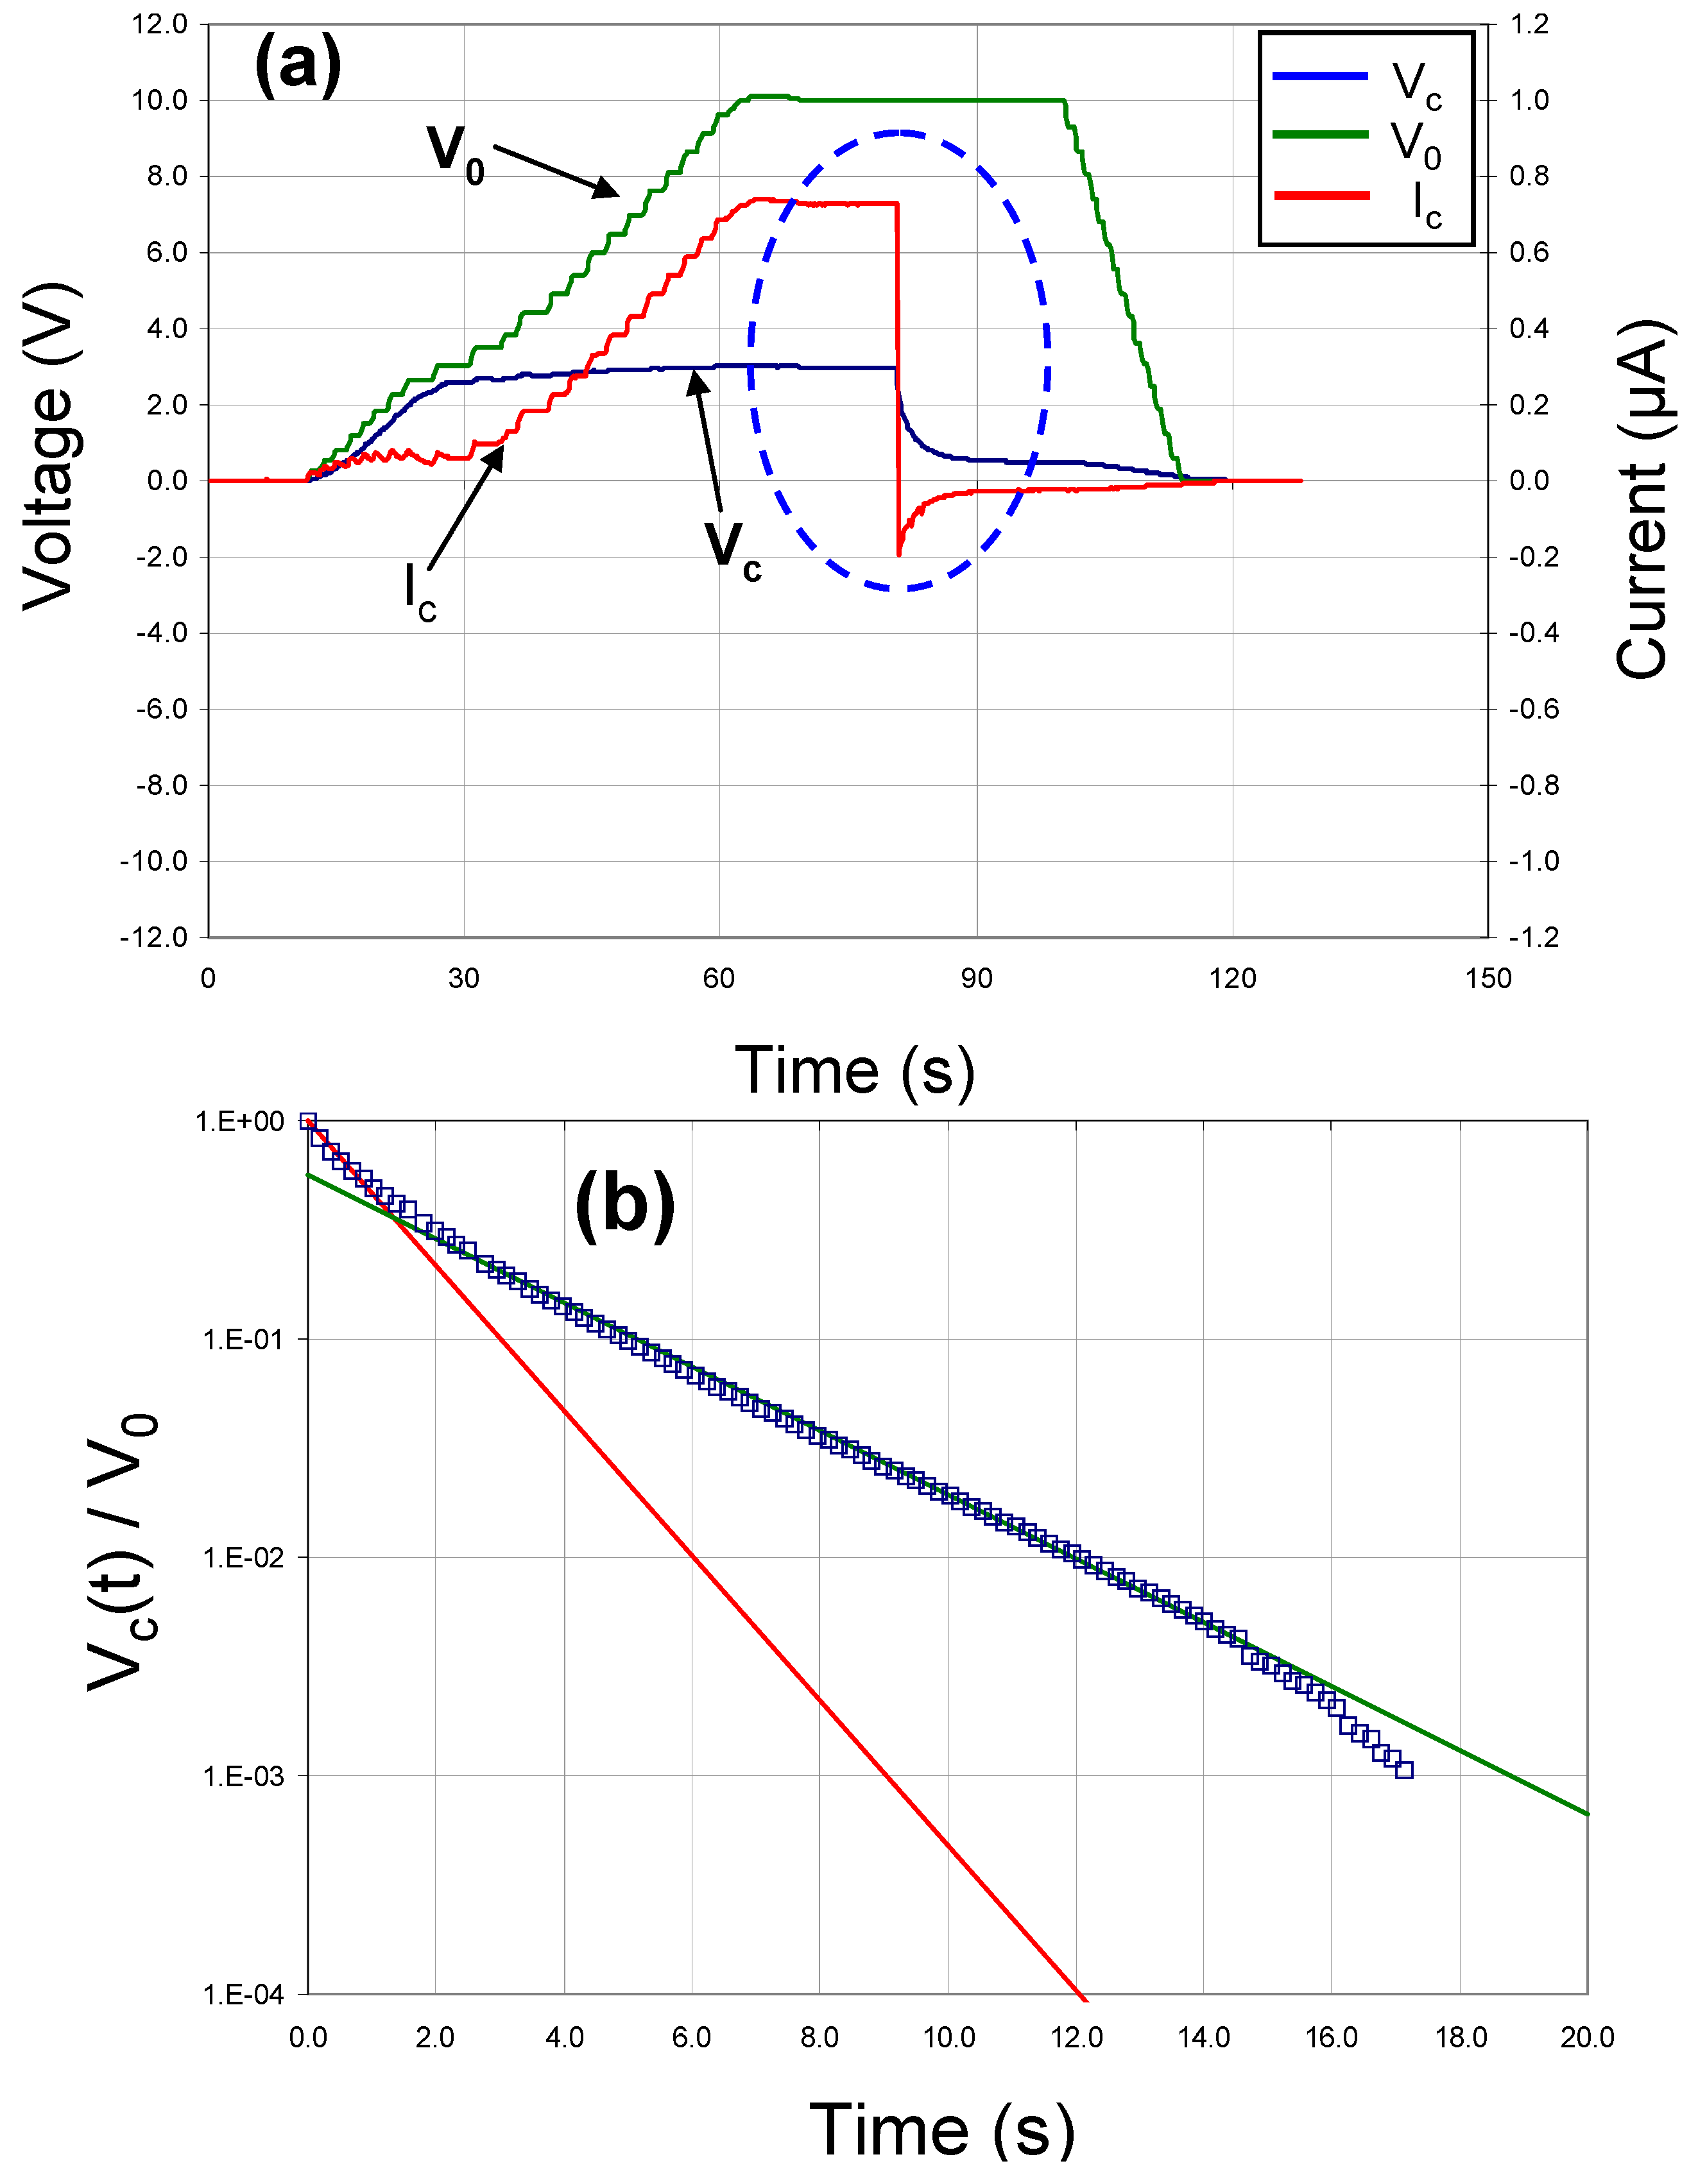
To function as an electronic battery, a capacitor must store and release energy under DC conditions. Consequently, we designed and built a circuit that allowed the device under test to be charged through a standard 10 MΩ resistor to a given voltage with a DC power supply. By monitoring the current in the circuit and the voltage drop across the plates of the capacitor, we were able to measure directly the useful energy stored in our thin-film devices. First, the circuit was tested with a standard 2 MΩ resistor and 330 nF capacitor in parallel to simulate the approximate equivalent circuit of our thin-film capacitors. The resulting DC load/unload data are shown in
Figure 5, where the green line represents V
0, the voltage from the DC power supply, the red line represents I
c, the current in the circuit and the blue line represents V
c, the voltage across the capacitor under test. V
0 was ramped up slowly and a double-throw switch actuated so that the voltage was applied to the capacitor. After an initial spike, I
c settled to a steady state value. The switch was then thrown, disconnecting the power supply from the test capacitor and allowing it to discharge through the standard resistor. In
Figure 5, this event shows as an instantaneously reversal of I
c, followed by a slow decay of I
c and V
c to zero. By integrating the product of V
c and I
c over time,
i.e.,
ʃVc(t)·Ic(t) dt, the energy stored in the capacitor was determined.
Figure 6a shows similar data for a test capacitor fabricated with a Pt bottom electrode, a Ni top electrode and a modified barium titanate dielectric deposited at 900 °C, 10 mtorr pressure and a sputter gas mixture of 10% oxygen/ 90% argon. It should be noted that the voltage across this capacitor did not decay exponentially to zero as expected, but rather it appeared that there were two separate discharge mechanisms involved with two different rates (see
Figure 6b). This was probably due to domain relaxation.
Figure 5.
DC charge/discharge test with C = 330 nF (commercial capacitor) & RLeakage = 2 MΩ.
Figure 5.
DC charge/discharge test with C = 330 nF (commercial capacitor) & RLeakage = 2 MΩ.
Figure 6.
(a) DC charge/discharge data and (b) voltage decay behavior for capacitor with a Pt bottom electrode, a BCZTO dielectric deposited at 900 °C, 10 mtorr pressure, a sputter gas mixture of 10% oxygen/ 90% argon, and a Ni top electrode.
Figure 6.
(a) DC charge/discharge data and (b) voltage decay behavior for capacitor with a Pt bottom electrode, a BCZTO dielectric deposited at 900 °C, 10 mtorr pressure, a sputter gas mixture of 10% oxygen/ 90% argon, and a Ni top electrode.
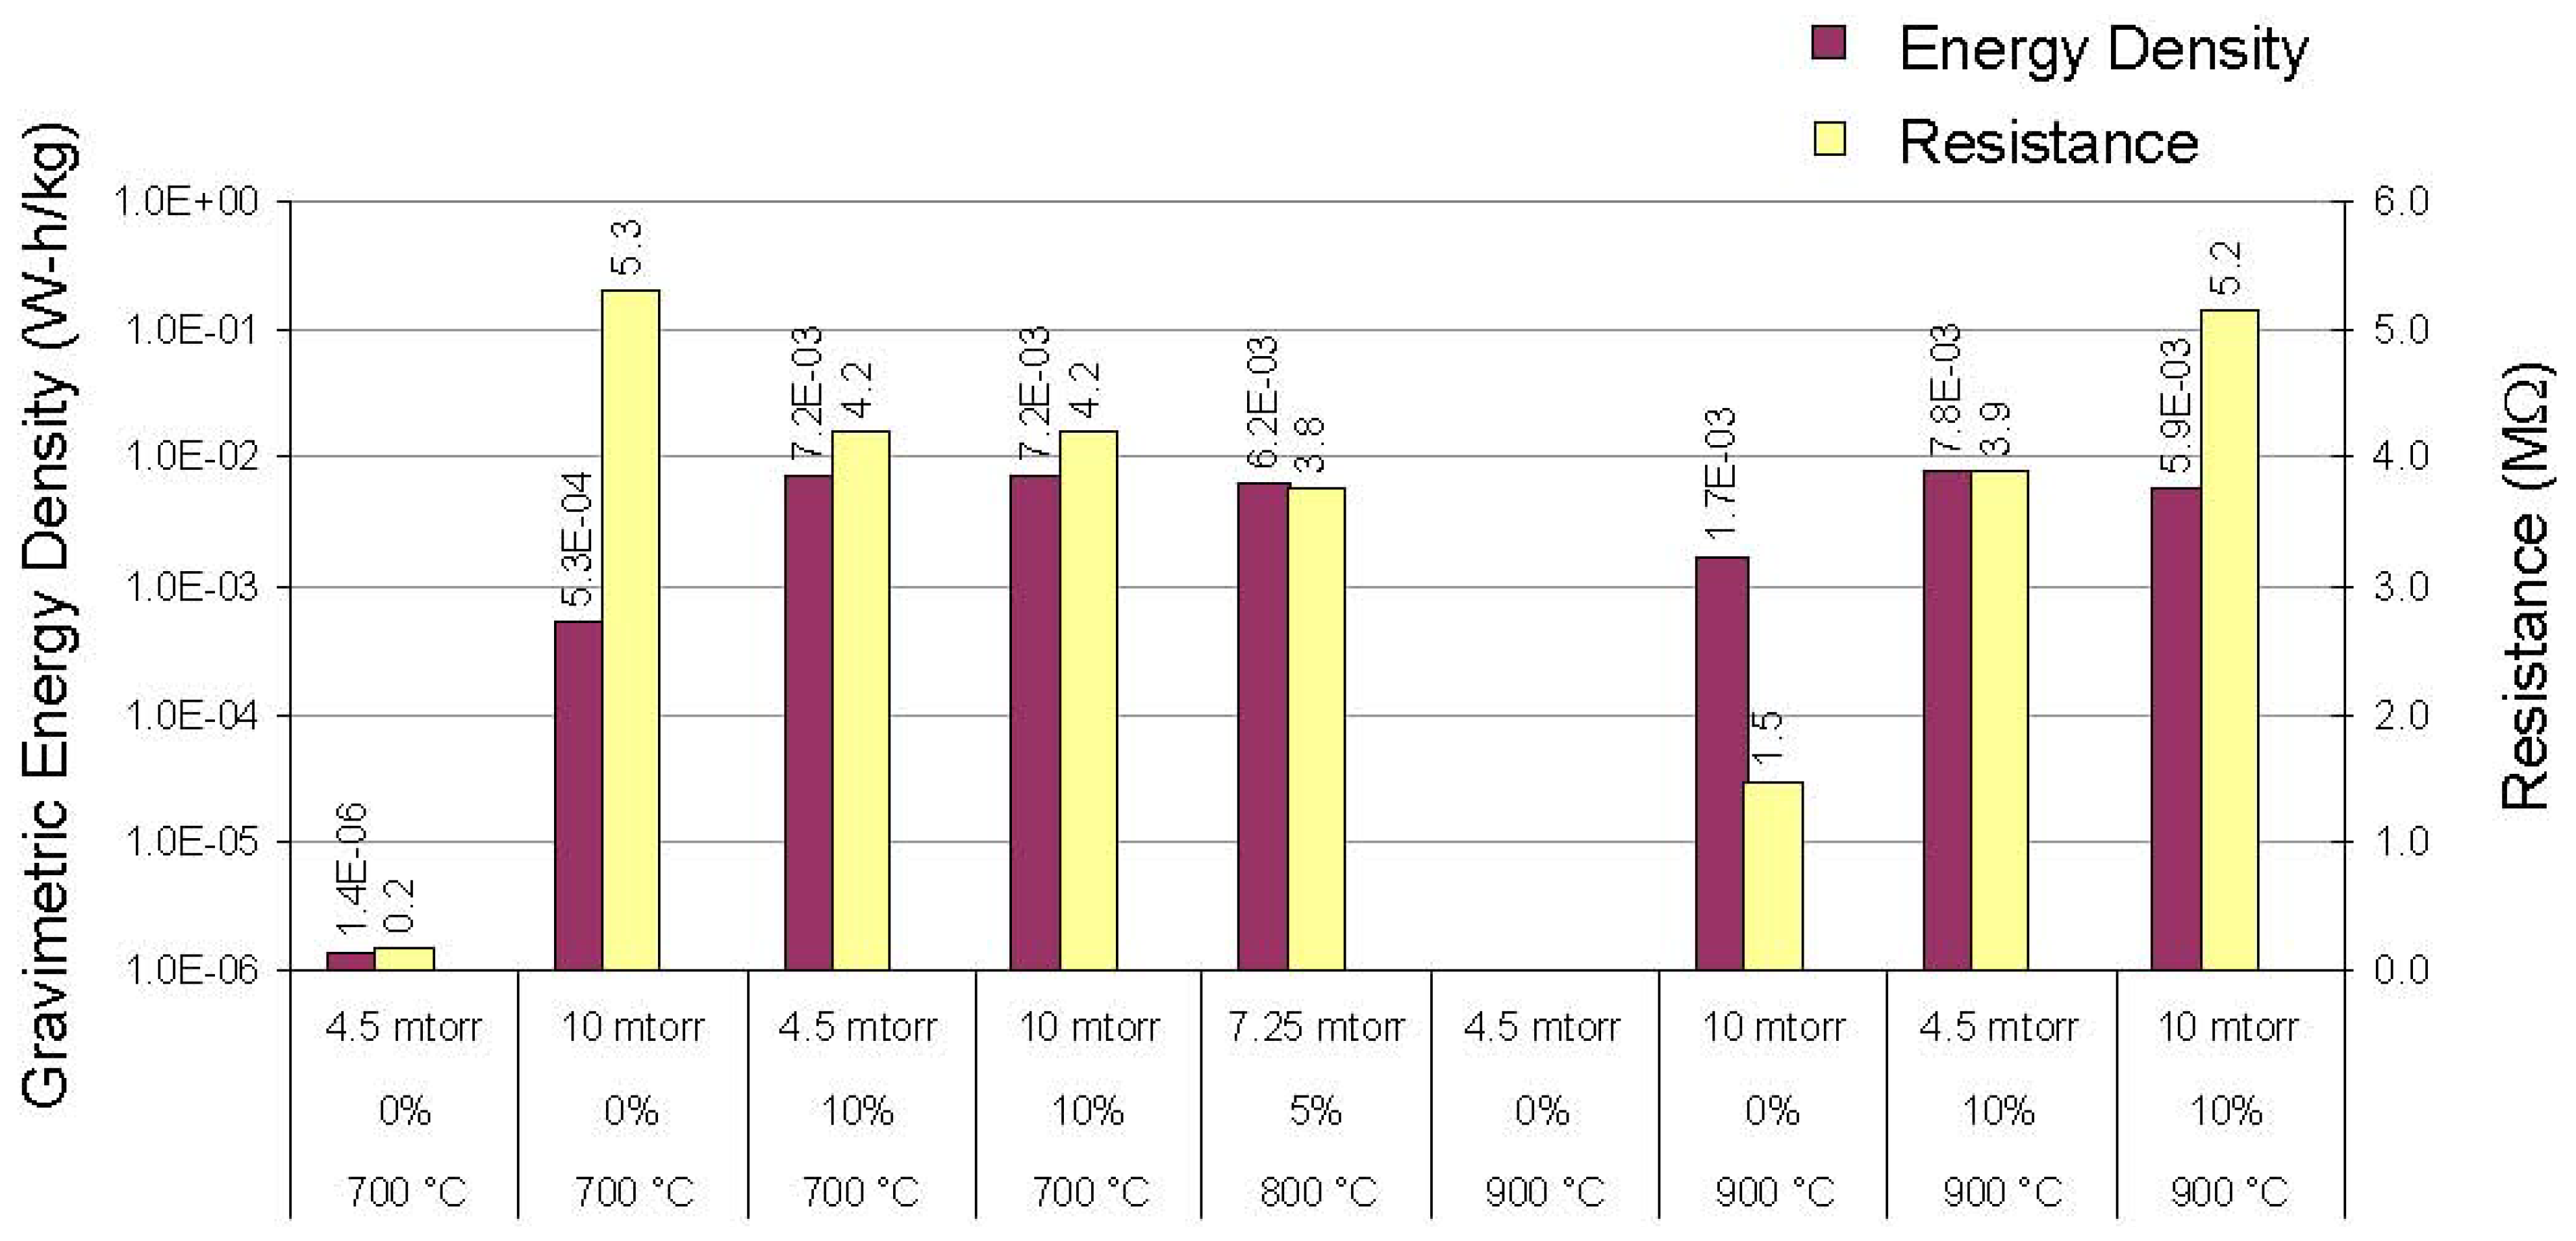
In all cases, the energy stored in the thin-film capacitors fabricated and tested in this work was very small: the maximum specific energy we observed was ~8 × 10
−3 W-h/kg (based on the estimated mass of the dielectric only), more than four orders of magnitude less than the values reported by Weir and Nelson. It should also be noted that even the best BCZTO capacitors we tested were too leaky electrically to have any real practical utility as electronic batteries: at an applied voltage of 10 V, leakage currents ranged from ~2–50 μA, corresponding to leakage current densities in the range 8–210 μA/cm
2, and the maximum internal electrical resistance we observed was ~5 MΩ. Specific energies (based on the estimated mass of the dielectric only) and internal resistances for capacitors with doped barium titanate thin-films deposited at a variety of sputtering conditions are illustrated in
Figure 7.
Figure 7.
Specific energy and internal resistance of thin-film capacitors vs. dielectric deposition conditions.
Figure 7.
Specific energy and internal resistance of thin-film capacitors vs. dielectric deposition conditions.
3.6. Discussion
Table I tabulates the specific energy calculated from DC load/unload data, the relative permittivity and resistivity of BCZTO from low frequency, small signal capacitance measurements and the dielectric deposition conditions. While higher partial pressures of oxygen in the sputter ambient typically increased the dielectric resistivity, these did not correlate with higher specific energies. Capacitors fabricated from BCZTO films sputtered with 10% oxygen in argon appeared to have the highest specific energies; process temperature in the range 700–900 °C and pressure in the range 4.5–10 mtorr appeared to have minimal effect.
Table 1.
Specific Energy (from DC load/ unload data), relative permittivity and resistivity (from low frequency, small signal capacitance) vs. deposition conditions for thin-film capacitors with sputtered BCZTO dielectric.
Table 1.
Specific Energy (from DC load/ unload data), relative permittivity and resistivity (from low frequency, small signal capacitance) vs. deposition conditions for thin-film capacitors with sputtered BCZTO dielectric.
| P (mtorr) | % O2 in Ar | 700 °C | 800 °C | 900 °C |
| Specific Energy (W-h/kg) | εr | R (MΩ) | Specific Energy (W-h/kg) | εr | R (MΩ) | Specific Energy (W-h/kg) | εr | R (MΩ) |
| 4.5 | 0% | 1.4 E-06 | 2,037 | 0.2 | | | | | | |
| 10% | 7.2 E-03 | 962 | 4.2 | | | | 1.7 E-03 | 1,660 | 1.5 |
| 7.25 | 5% | | | | 6.2 E-03 | 1,278 | 3.8 | | | |
| 10 | 0% | 5.3 E-04 | 1,018 | 5.3 | | | | 7.8 E-03 | 1,472 | 3.9 |
| 10% | 7.2 E-03 | 926 | 4.2 | | | | 5.9 E-03 | 1,489 | 5.2 |
To be effective as practical electronic batteries, electrical leakage is a key parameter: even the least leaky of the capacitors tested here discharged much too rapidly for use as a battery. However, it is conceivable that this could be addressed by one or more of several techniques. One possibility would be the addition of a very high resistivity material to the dielectric as advocated by Weir and Nelson. While this would drastically reduce the overall leakage, the disadvantage is that it would have the effect of adding a second capacitor in series, resulting in a drop in total capacitance and electrical energy stored. MLCCs are typically fired in oxygen-containing ambients to anneal out oxygen vacancies that act as electron donors and increase the conductivity of the dielectric films. Controlled addition of donor and/or acceptor atoms in the perovskite lattice can also serve to increase the resistivity. However, such methods typically do not permit MLCCs to retain a high state of charge for hours or days as would be required for them to function effectively in electronic battery applications.
The energy densities and specific energies measured for the thin-film capacitors fabricated in this work were small. Partly, this can be attributed to the fact that only relatively low electric fields were applied; though typically, breakdown strengths were above 200 kV/cm, films stressed at these fields appeared to degrade with repeated cycling. However, even at these relatively low field strengths, there was clear evidence for dielectric saturation in the doped barium titanate films that would serve to limit the maximum energies that could be stored in these devices. It could be argued that this behavior was an artifact peculiar to these sputtered thin-films. Subsequent work conducted at the University of Halle-Wittenberg on capacitors with dielectric composites similar to those reported by Weir and Nelson showed qualitatively similar saturation to the results reported here [
17]: a simple theoretical analysis can shed light on this phenomenon.
For a planar capacitor where the dielectric remains linear up its breakdown strength, the stored energy per unit volume of dielectric (expressed in Joules per cubic meter) is given by:
where ED is the volumetric energy density, ε
0 is the permittivity of free space (=8.854 × 10
−12 F/m), ε
r is the relative permittivity and V is the potential difference in volts across the capacitor plates. If ε
r remains linear up to the breakdown voltage of the dielectric, the maximum energy density (
i.e., energy per unit volume) that can be stored in such a capacitor is limited by the dielectric strength and is given by:
here, ED
max is the maximum volumetric energy density and V
bd is the breakdown voltage of the (linear) dielectric. For a given V
bd, the energy density of such a capacitor (with a linear dielectric) is directly proportional to ε
r. Most insulating materials have relative permittivities between 1 and 100. For thin-film capacitors with SiO
2 or Al
2O
3 dielectrics that are reported to have very high breakdown strengths (>5 MV/cm) this sets a practical upper limit on the energy density of 3.1 and 6.7 J/cm
3 for relative permittivities of 3.9 and 8.4, respectively, at an applied electric field strength of 3 MV/cm. Ta
2O
5, with a relative permittivity of 26, would have an energy density of 21 J/cm
3 if it could withstand a similar electric field. These energy densities correspond to 0.86, 1.86 and 5.83 W-h/liter, respectively. For a hypothetical dielectric with a relative permittivity of 100 that is linear up to an electric field strength of 3 MV/cm, the corresponding energy density would be 22.14 W-h/liter, substantially below the values claimed by Weir and Nelson [
3] for capacitors using doped barium titanate dielectrics with relative permittivities up to 33,500 and also significantly below the energy densities of rechargeable lithium-ion and thin-film lithium batteries [
18]. It is therefore instructive to consider how additional energy can be stored in polarizable materials such as barium titanate and its relatives with the perovskite structure.
In the cubic perovskite structure of barium titanate, the Ti4+ ion is situated on an octahedral site surrounded by six O2− ions. This site is slightly too large for the Ti4+ ion and consequently, it can move within this site. In contrast, Ba2+ and O2− ions remain essentially fixed in the crystal structure. Because the Ti ion carries a (positive) charge, it will move in response to an imposed external electric field; when the imposed electric field is removed, it will return to its equilibrium position. Below the Curie point where the Ti4+ ions are able to occupy more than one non-equivalent site in the oxygen octahedra, this phenomenon gives rise to the observed ferroelectric properties of barium titanate. Above its Curie point, barium titanate has a cubic perovskite structure and behaves as a dielectric with a very large relative permittivity. The cubic perovskite structure of barium titanate allows every Ti4+ ion to move a maximum of ~0.25 Å from its equilibrium position.
Using the well-known expression for the work (W) performed by a charged particle moving in an electric field (E):
where δ is the distance moved, it can be calculated that, for a field strength of 3 MV/cm given by Weir and Nelson [
3,
4], the maximum work associated with polarizing cubic barium titanate is ~2.9 kJ/mol. Using a theoretical density of 6.02 g/cm
3 for barium titanate from the literature [
15] and a relative molar mass of 233, we calculate a value of ~3.45 W-h/kg for the specific energy and a value ~21 W-h/liter for the energy density, based on the mass and volume, respectively, of the dielectric material only. If the polarization/depolarization process is 100% efficient and reversible, this figure represents the maximum amount of energy that can be stored in the dielectric due to polarization, absent any quantum mechanical effects. Note that this calculation does not consider the weight and volume of the electrodes, nor does it take into account any packaging that would be required to manufacture a practical device. Also note that this energy density is quantitatively similar to the amount of energy that would be stored in a capacitor with a linear dielectric of relative permittivity 100 at an electric field strength of 3 MV/cm. It cannot account for the large difference between the energy density calculated for a planar capacitor with a hypothetical dielectric that is linear up to 3 MV/cm and the values claimed by Weir and Nelson for their EESU [
3,
4,
5].
In order to increase the maximum amount of energy that can be stored by polarization of Ti
4+ in cubic barium titanate, it is necessary to increase the breakdown strength. While in the literature, there have been reports of dielectric breakdown strengths of 10 MV/cm and slightly above for some materials [
19], in general, applying an electric field that is close to its breakdown strength causes damage to a capacitor dielectric. Consequently, we hypothesize that it is not possible to achieve anywhere close to the specific energies of >300 W-h/kg at 3 MV/cm as claimed by Weir and Nelson for capacitors based on modified barium titanate. Indeed, it would appear that fundamental limitations (typically thought of as dielectric saturation) limit specific energies to approximately one order of magnitude less than these values.
As a general rule, capacitors fabricated with dielectrics that have the highest relative permittivities will not have the highest energy densities: this can only be achieved by matching ε
r and V
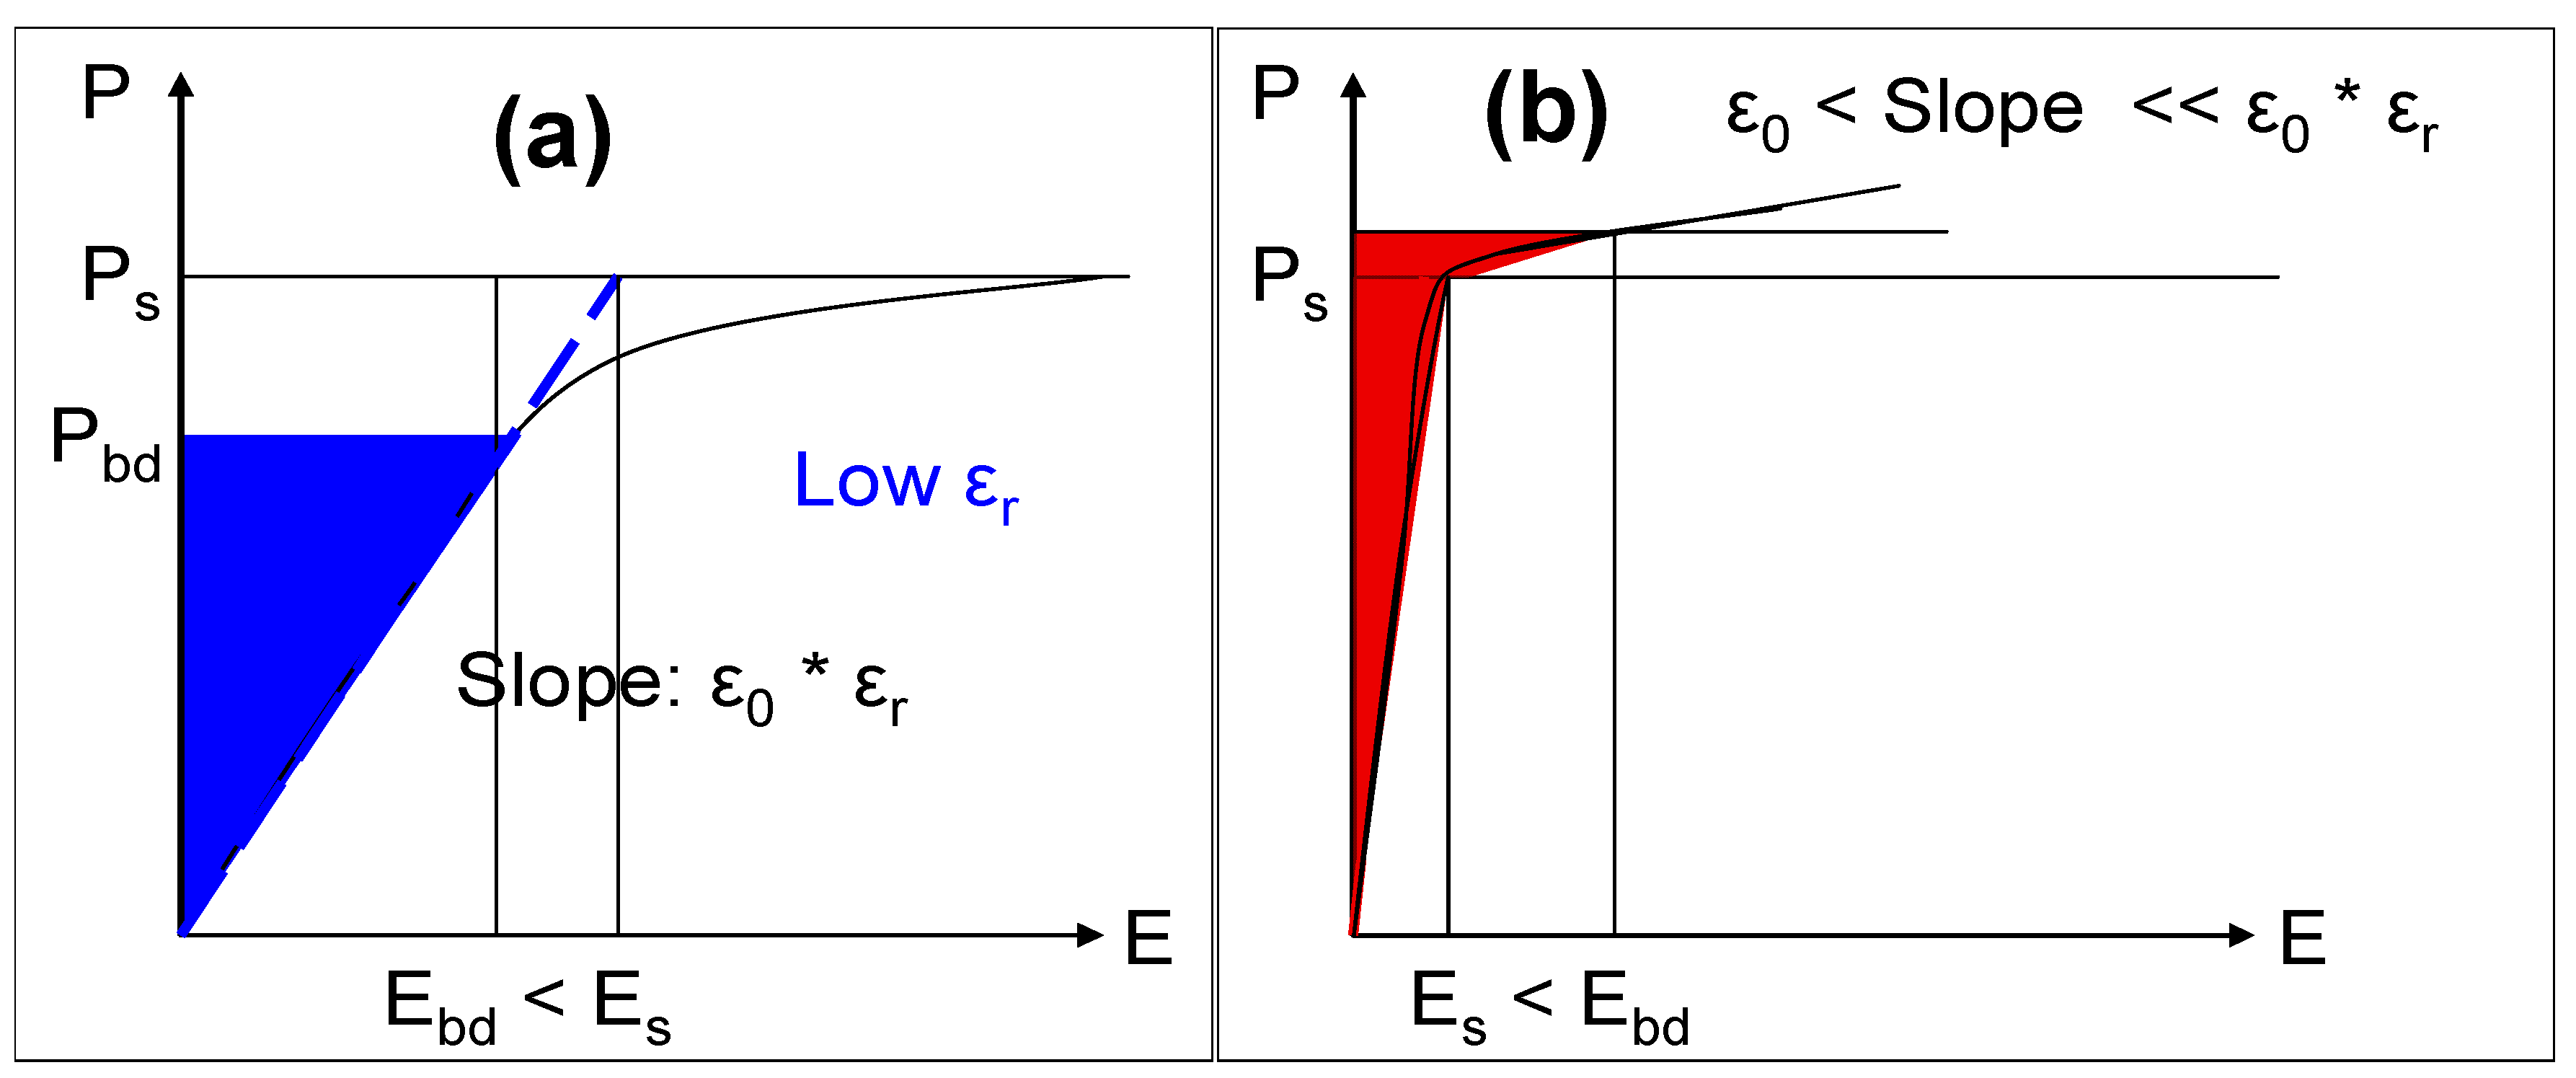
bd appropriately. Consider a planar capacitor with a hypothetical dielectric that is linear up to its breakdown field: a graphical representation of the polarization
vs. the electric field strength for such a device is shown schematically in
Figure 8a. Here, the maximum energy density of the capacitor can be calculated according to Equation (2). The case for a hypothetical dielectric where the relative permittivity is large and varies approximately linearly with applied electric field strength up to its saturation polarization and thereafter drops substantially until V
bd is reached, is shown schematically in
Figure 8b. In this case, the maximum energy density of the capacitor will be primarily constrained by the saturation polarization of the dielectric and thus, it is convenient to express the energy density of such a capacitor in terms of the polarization:
where P
s is the saturation polarization. Examining Equations (2) and (4), where the maximum energy density is limited by the breakdown voltage of the dielectric (Equation (2)), it is proportional to ε
r, the relative permittivity of the dielectric. However, where the maximum energy density is limited by the saturation polarization of the dielectric (Equation (4)), it is inversely proportional to ε
r. In this case, increasing the relative permittivity of the dielectric will result in a lower maximum energy density.
Figure 8.
(a) Schematic of polarization vs. electric field strength for case where stored energy (blue shaded area) limited by dielectric breakdown (Ebd < Es); (b) As for (a) but here stored energy (red shaded area) is limited by saturation polarization (Es < Ebd).
Figure 8.
(a) Schematic of polarization vs. electric field strength for case where stored energy (blue shaded area) limited by dielectric breakdown (Ebd < Es); (b) As for (a) but here stored energy (red shaded area) is limited by saturation polarization (Es < Ebd).
Usually, the higher the relative permittivity of a dielectric material, the more likely it is to saturate below its breakdown strength. Therefore Equation (2) will hold for relatively low ε
r materials while Equation (4) will apply to materials with large ε
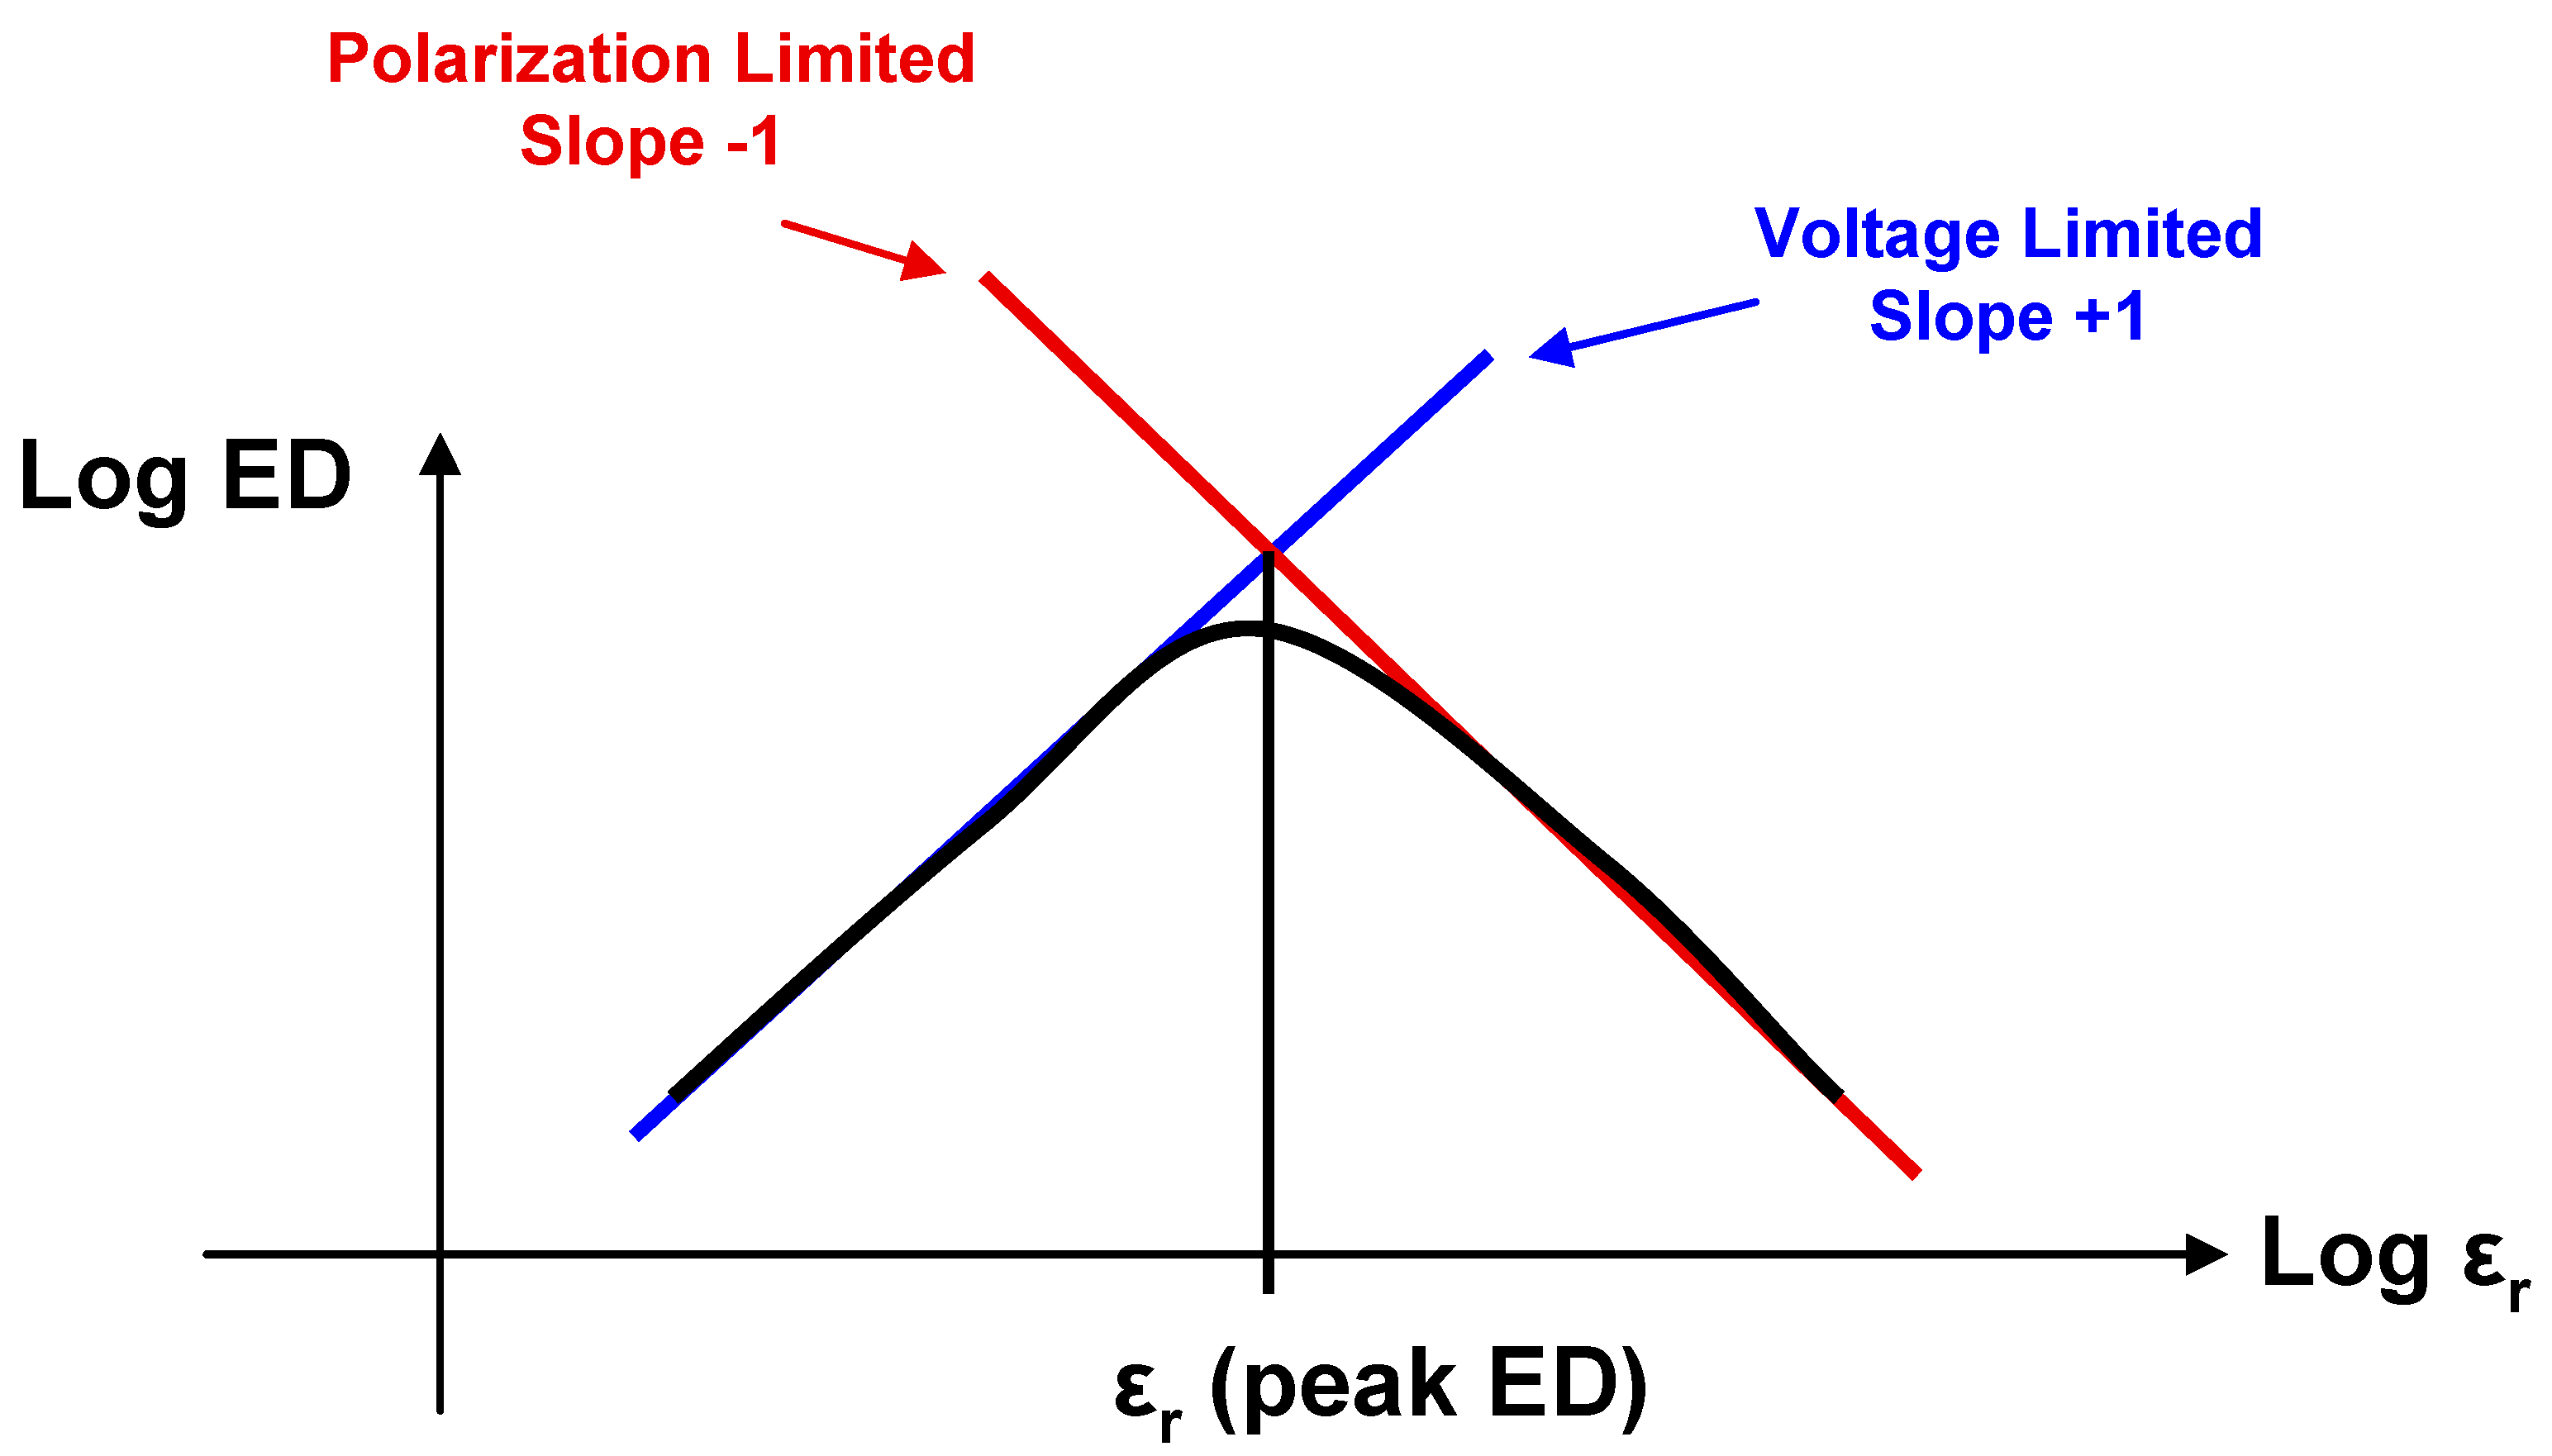
r. As a result of this analysis, we can therefore conclude that for a family of linear dielectric materials with a given breakdown voltage and polarization, the maximum energy density for a capacitor using these materials will occur where dielectric breakdown and saturation polarization coincide. This is shown schematically in
Figure 9, where the logarithm of the energy density of such a capacitor (
log ED) is plotted
vs. log ε
r. At low ε
r, the slope for
log ED vs. log ε
r is 1, while at high ε
r, the slope for
log ED vs. log ε
r is −1. At the point of intersection (at an intermediate value of ε
r)
log ED is a maximum.
Typical high-k materials are not linear and therefore this principle can only serve as an approximate guide when attempting to tailor εr to maximize the energy storage of a capacitor. However, it does highlight the fact that attempts to boost the maximum energy density of electrostatic capacitors by designing relaxor ferroelectric materials with extremely high relative permittivities are futile. Such materials would saturate at relatively low electric fields, well below the breakdown voltage of the dielectric. Once dielectric saturation has occurred, the rate at which stored energy increases with additional applied electric field strength across the capacitor is small.
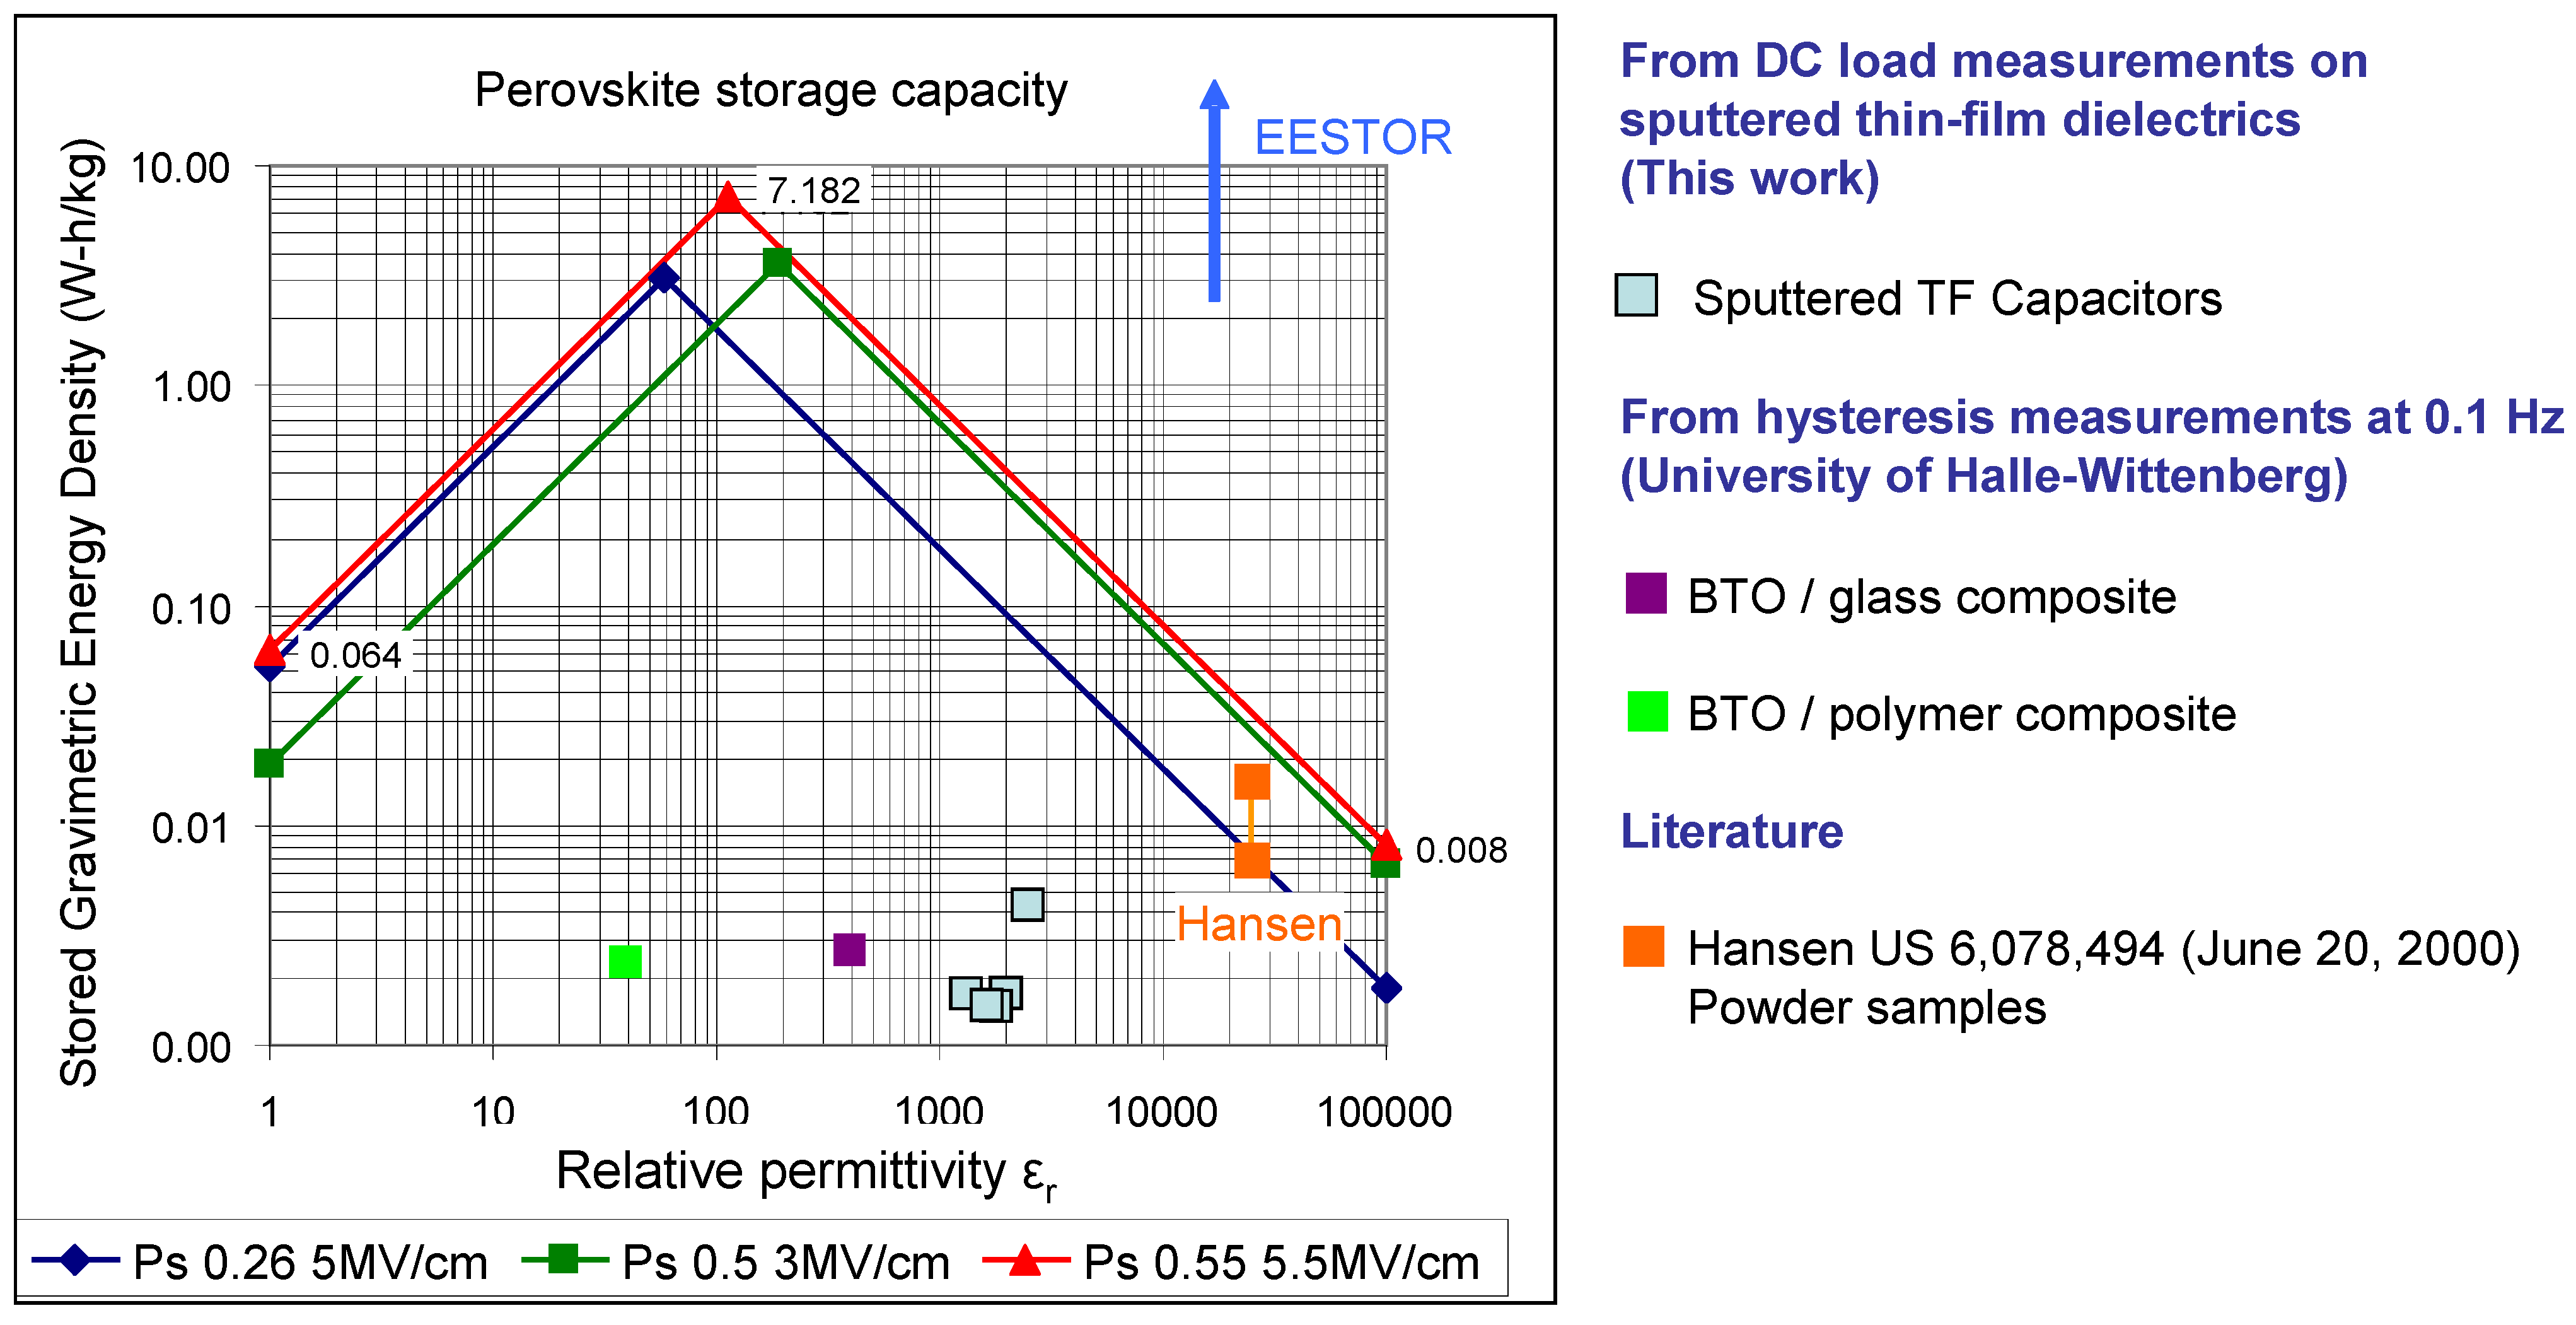
Figure 10 shows several plots for different assumed polarizations and breakdown strengths typical of barium titanate-based relaxor ferroelectrics. Also included in
Figure 10 are data measured in this work, by the University of Halle-Wittenberg [
17] and those of Hansen taken from the literature [
2]. As can be seen, the data claimed by Weir and Nelson [
3,
4,
5] are off the chart by over an order of magnitude. Referring to
Figure 10, in order to achieve the maximum specific energy in an electrostatic capacitor based on modified barium titanate dielectrics, the optimum relative permittivity is predicted to be in the range from ~60 to ~200. However, certain practical considerations dictate that the optimum ε
r should be higher for most applications. This is because when stressed at electrical field strengths close to breakdown, most dielectrics experience some slight damage; repeated cycling eventually causes breakdown at field strengths well below their rated dielectric strength. Typically, ceramic capacitors should be designed with a built-in safety factor and operated significantly below the maximum breakdown field of the dielectric [
20]. Consequently, the optimum energy storage characteristics of electrostatic capacitors based on modified barium titanate dielectrics will be at slightly higher relative permittivities than those predicted by
Figure 10. However, owing to the need to limit the electric field strength, the maximum practical specific energy and energy density that can be achieved in this family of capacitors will be lower (by between 10-100x) than the ~3.45 W-h/kg and ~21 W-h/liter quoted earlier for materials with breakdown strengths in the range 3–5 MV/cm; similar materials with breakdown strengths as high as 10 MV/cm have been reported in the literature [
19] but even these materials will likely have maximum practical and theoretical specific energies significantly below today’s lithium-ion batteries. It appears that, in the absence of some yet-to-be-discovered quantum effect, electrostatic capacitors based on relaxor ferroelectrics are not suitable replacements for electrochemical batteries in applications that primarily require high energy density.
Figure 9.
Plot of log energy density vs. log relative permittivity for a family of materials with a set polarization and breakdown voltage.
Figure 9.
Plot of log energy density vs. log relative permittivity for a family of materials with a set polarization and breakdown voltage.
Figure 10.
Plot of log energy density
vs. log relative permittivity for modified barium titanates with different assumed polarization (P
s) and breakdown voltages. Also shown are thin-film (TF) capacitor data measured in this work, barium titanate (BTO) composite data from the University of Halle-Wittenberg and data from the literature (Hansen [
2]).


