4.1. Light Transmission Through an Absorbing Birefringent Medium
Consider propagation of a linearly polarized monochromatic wave that is normally incident on a slab with unidirectionally aligned NRs. The optic axis is tilted with respect to the slab’s normal by an angle
. The wave splits into the ordinary and extraordinary waves with different indices of refraction
and
, and indices of absorption
and
, respectively. For the ordinary wave, the refractive and absorption indices do not depend on the orientation of the optic axis,
i.e.,
and
, where the subscript
means that the quantity was measured with the light polarized normally to the optic axis. For the extraordinary wave,
and
depend on
[
35,
36]:
where
and
correspond to the case when light propagates perpendicularly to the optic axis (
)
with polarization
E parallel to the optic axis.
To derive an expression for light transmittance through the slab of thickness
, viewed between two arbitrary oriented polarizers, we employ the formalism of Jones matrices. Let us choose a Cartesian coordinate system with the Z-axis directed along the wave vector of light. The polarizer P, slab and analyzer A, are perpendicular to the
Z-direction. The X–axis is chosen to be along the projection of the optic axis (specified by the long axes of Au NRs) onto the plane normal to Z. The transmission direction of the linear polarizer P is oriented at an angle
with respect to X, while the analyzer‘s direction A makes an angle
with X. The electric field
of the wave exiting the analyzer is related to the incoming electric field
through the product of Jones matrices:
where
is the Jones matrix of the analyzer,
is the Jones matrix for the slab with the average refractive index
and absorption coefficient
;
stands for the light wave exiting the analyzer, and
stands for the light wave passed through the polarizer. Note that by the last definition for
we effectively normalized the amplitude of the electric field exiting the polarizer by the amplitude
of the incoming electric field. In the definition of
, we introduce two new notations: the linear birefringence
and the linear dichroism
. For a uniformly aligned slab,
and
. For a general case, when the orientation of NRs changes with the coordinate
normal to the slab (and the director experiences splay and bend deformations but not the twist deformations), these quantities are represented by integrals:
The light transmittance through the system is
, where the *-symbol denotes a complex conjugate. Using Equation (7) for arbitrary
and
, we find:
For parallel polarizers
the transmission reads
The expression for
can be rewritten in terms of the transmittances
and
between parallel polarizers, corresponding to three different azimuthal orientations of the director,
and
, respectively:
Measuring
and
, one deduces the absorption indices
and
, dichroism
, and birefringence
, using the following relationships:
There is an alternative possibility to measure the phase retardation, by placing the sample between two crossed polarizers, in which case
, and the transmission reads
Note that Equation (14) contains three unknown parameters:
,
D and
R. Since we are mostly interested in determination of
R which is a measure of the field-induced birefringence in the dispersion of NRs, we need to exclude
and
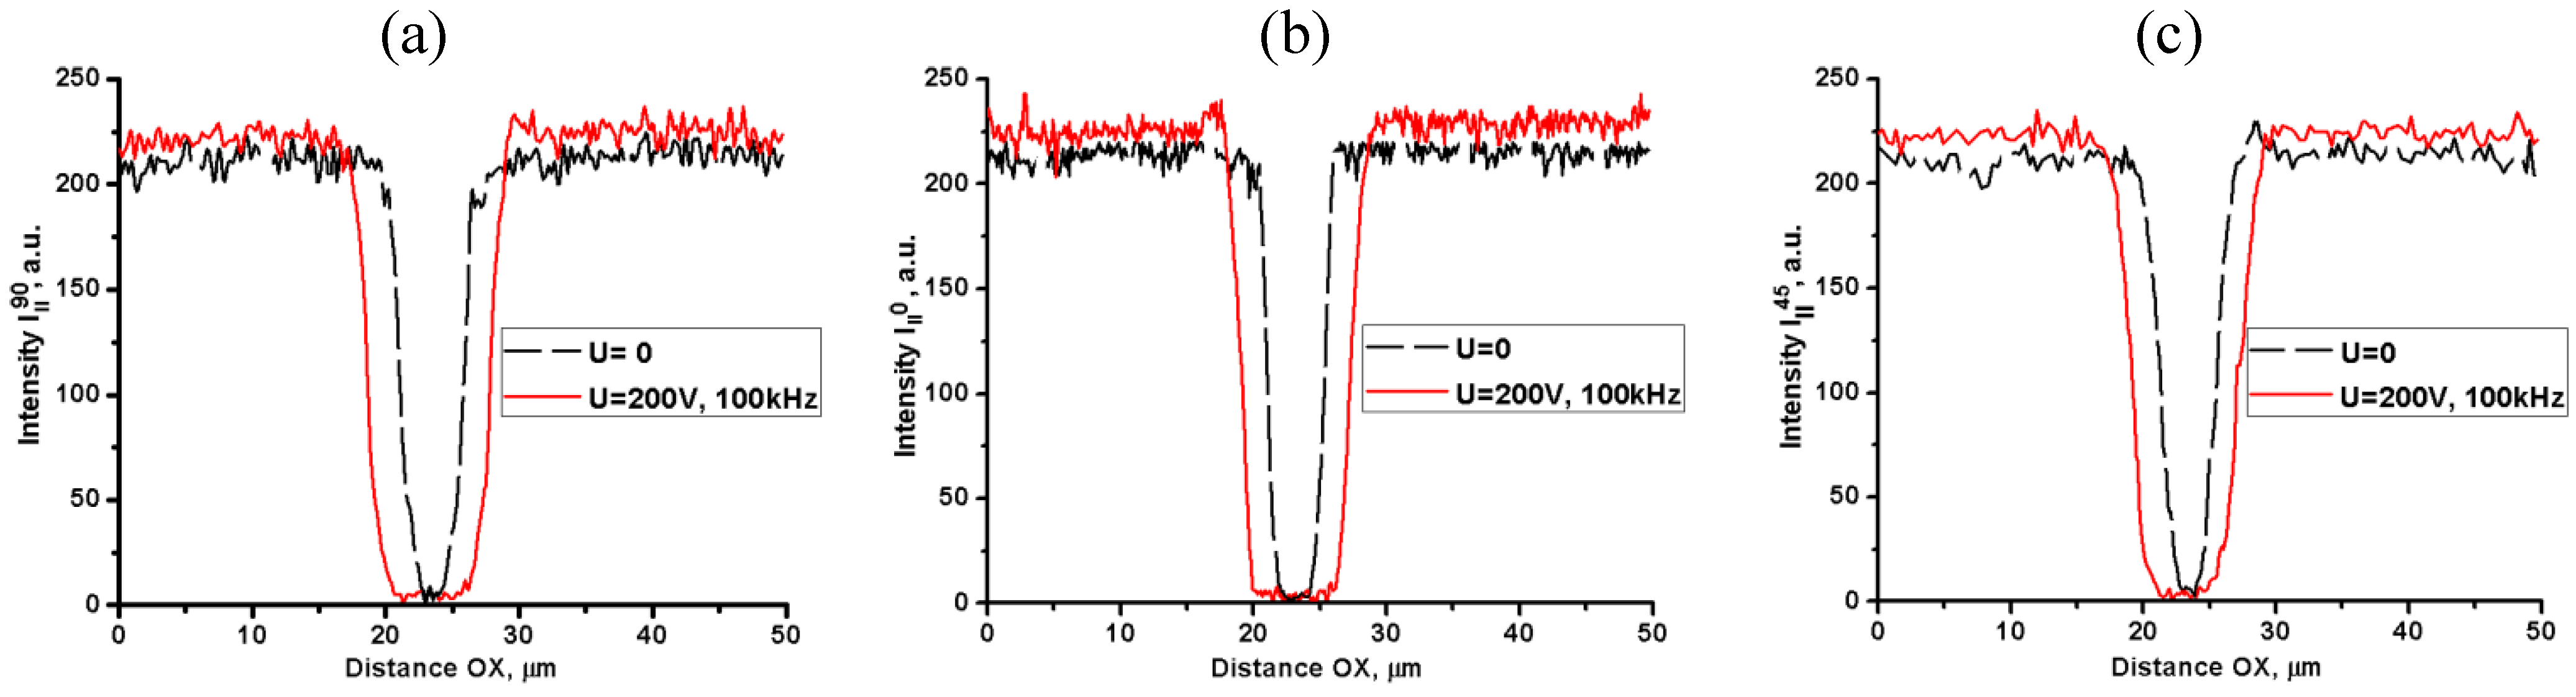
D from the consideration. This can be achieved, for example, by measuring three quantities, namely, transmittance
between crossed polarizers, for
;
determined with a pair of parallel polarizers,
= 0 and
for
.
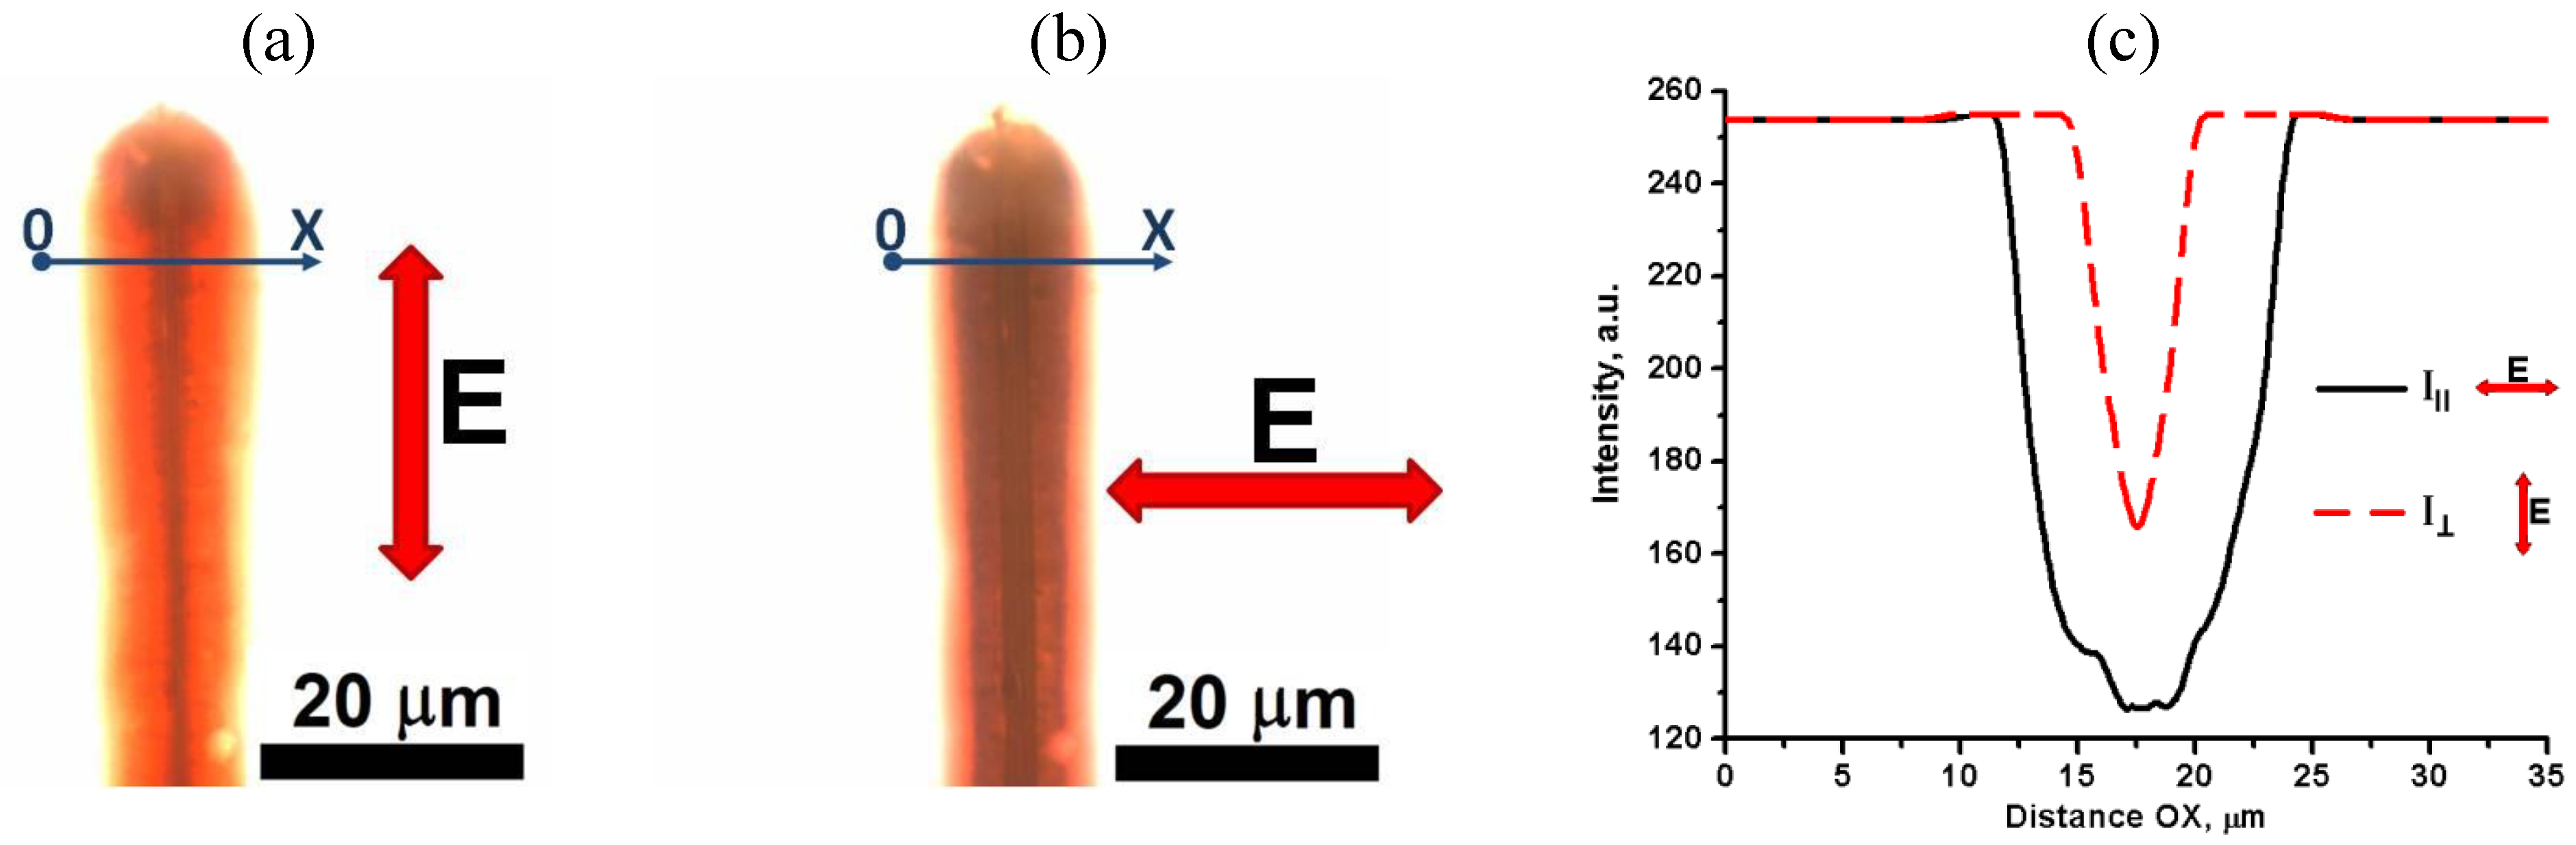
This is precisely the set of parameters that was measured in the experiments illustrated in
Figure 9 and
Figure 10. Equation (14) can be rewritten as
which leads to a straightforward expression to determine the field-induced birefringence
associated with the effective extraordinary index of refraction
:
Equation (16) is similar to Equation (13), as in both cases, the ratio
is nothing else but the ratio of the arithmetic
and geometric mean
for
and
. The only difference is that Equation (13) uses the quantity
, while Equation (16) deals with the quantity
; the latter might be more convenient to use as it can be measured more accurately, especially in weakly birefringent cases. We used both approaches to derive the map of spatial profile of the field-induced path difference
in the flat cells.
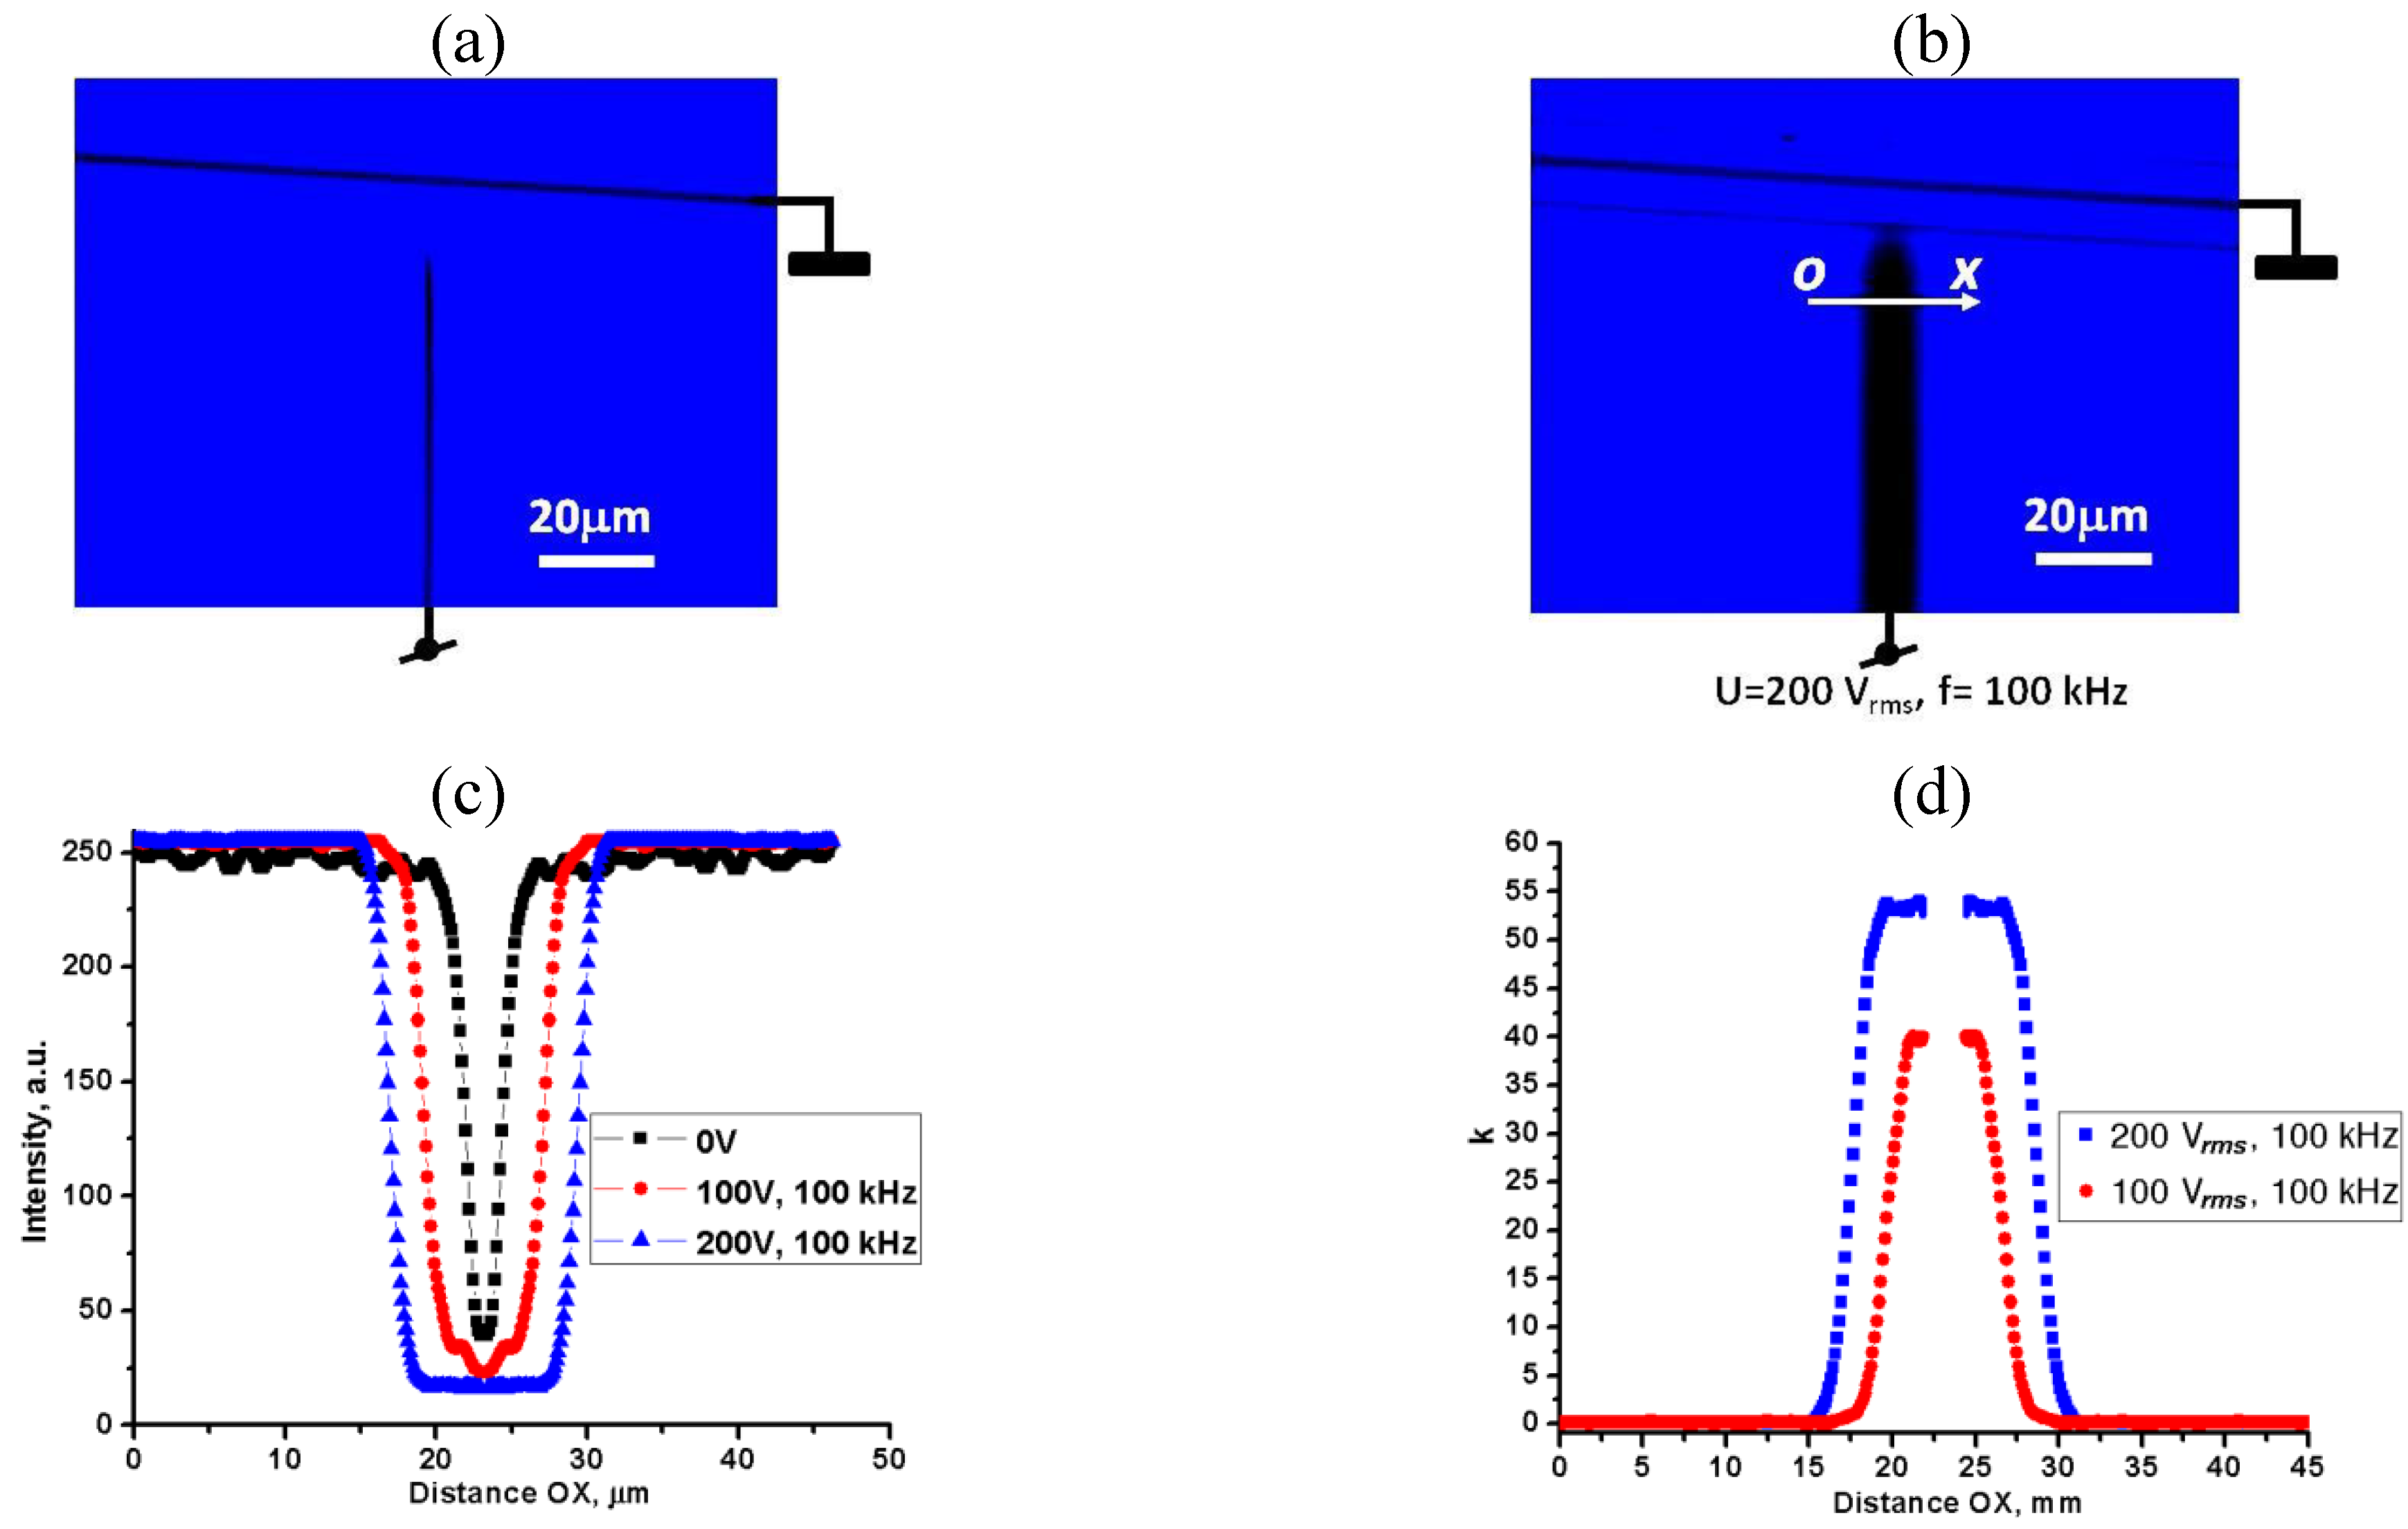
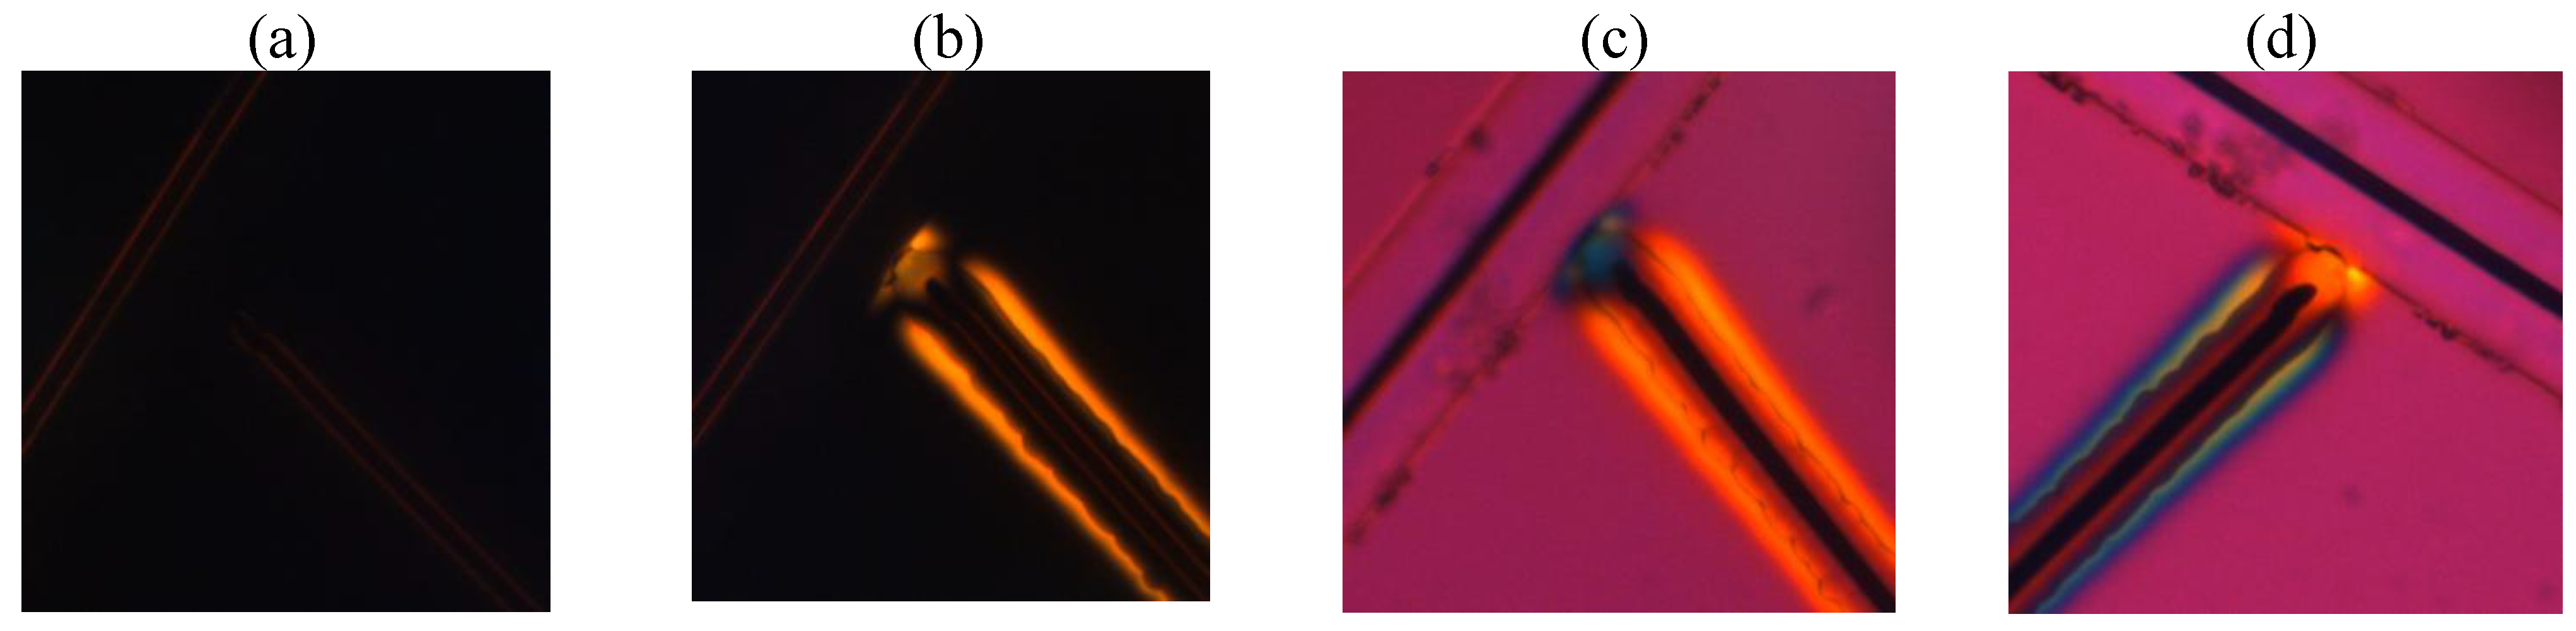
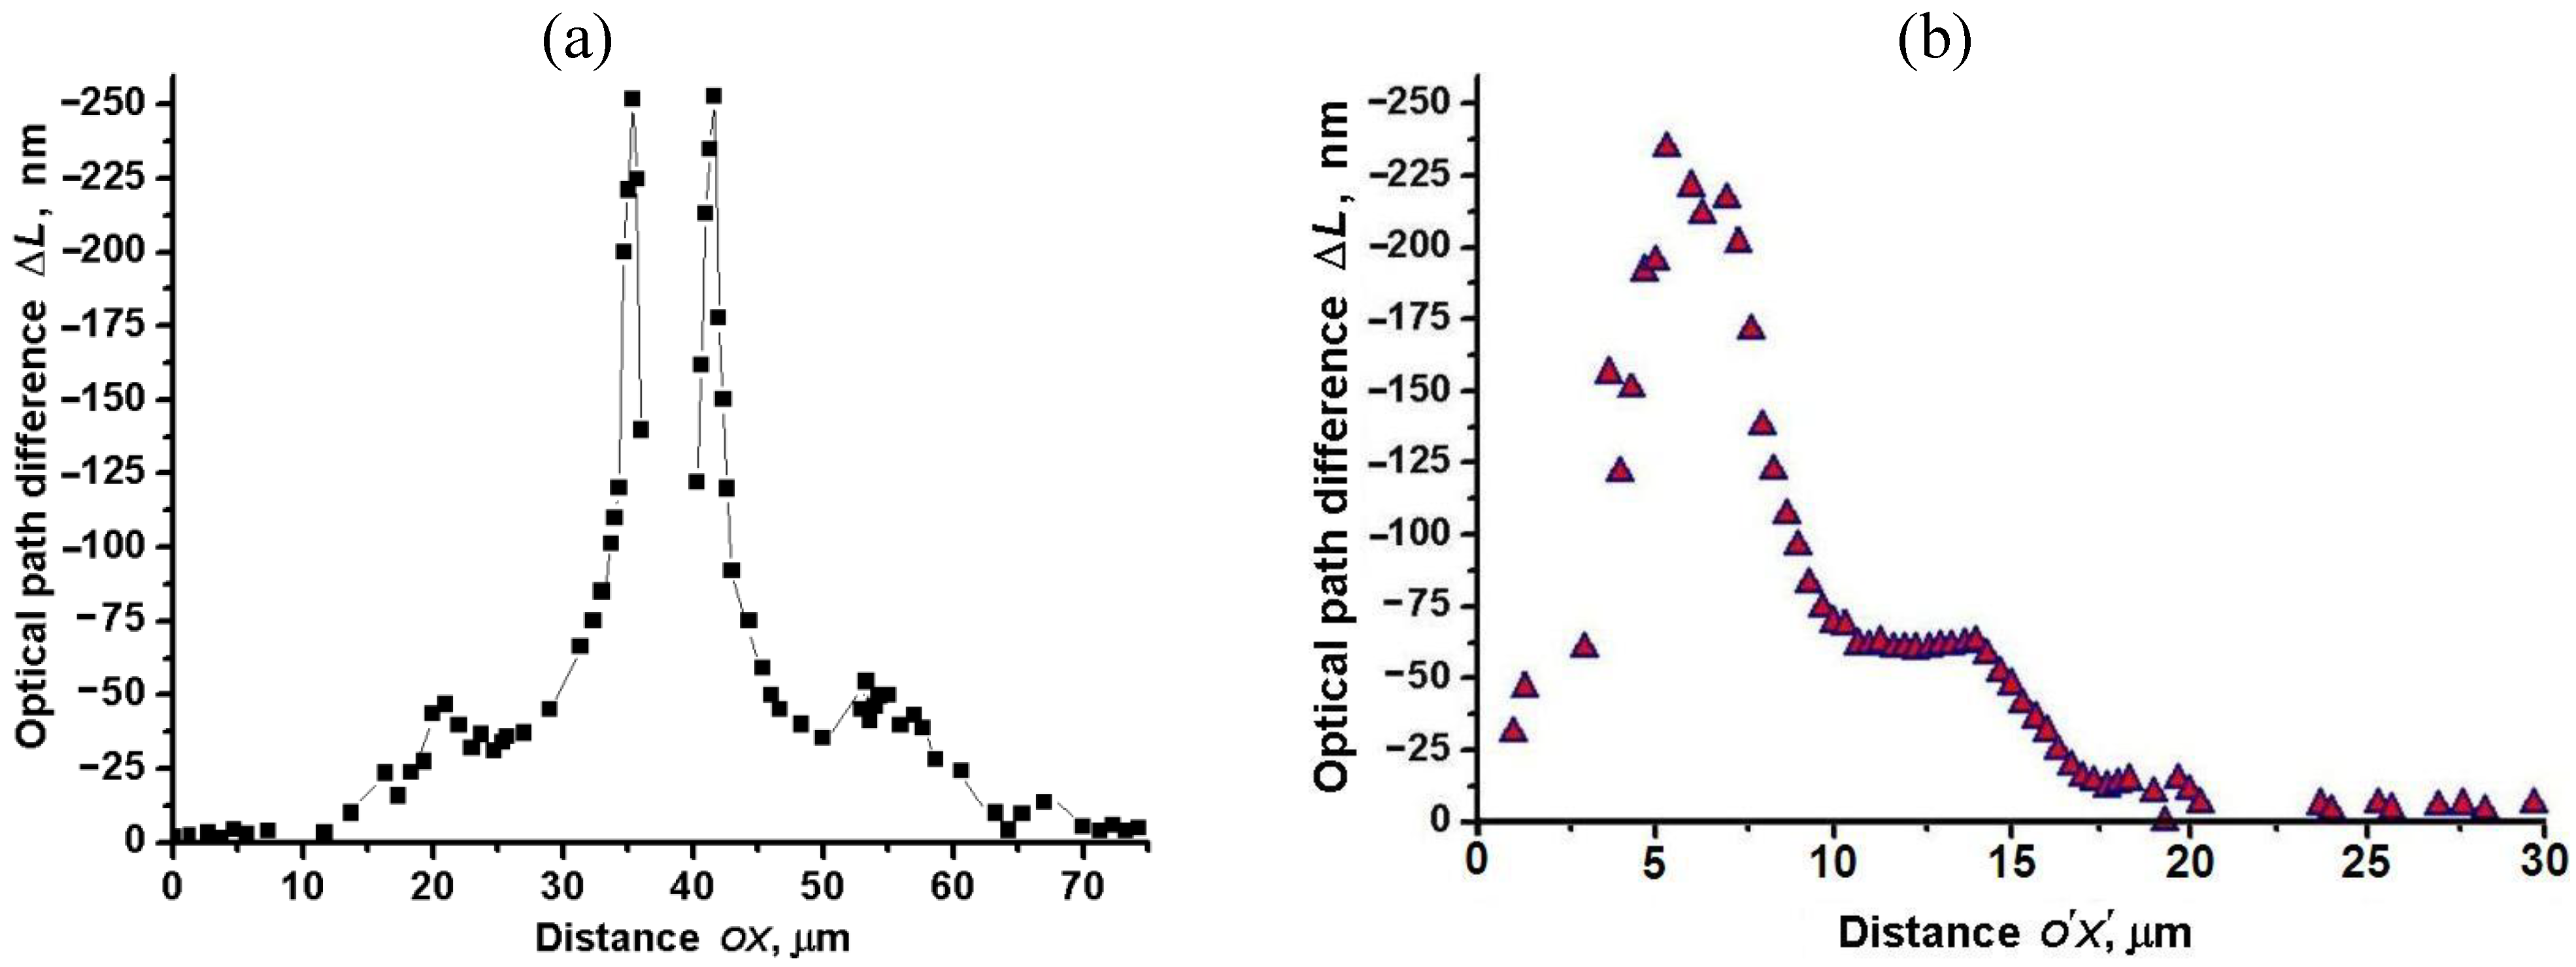
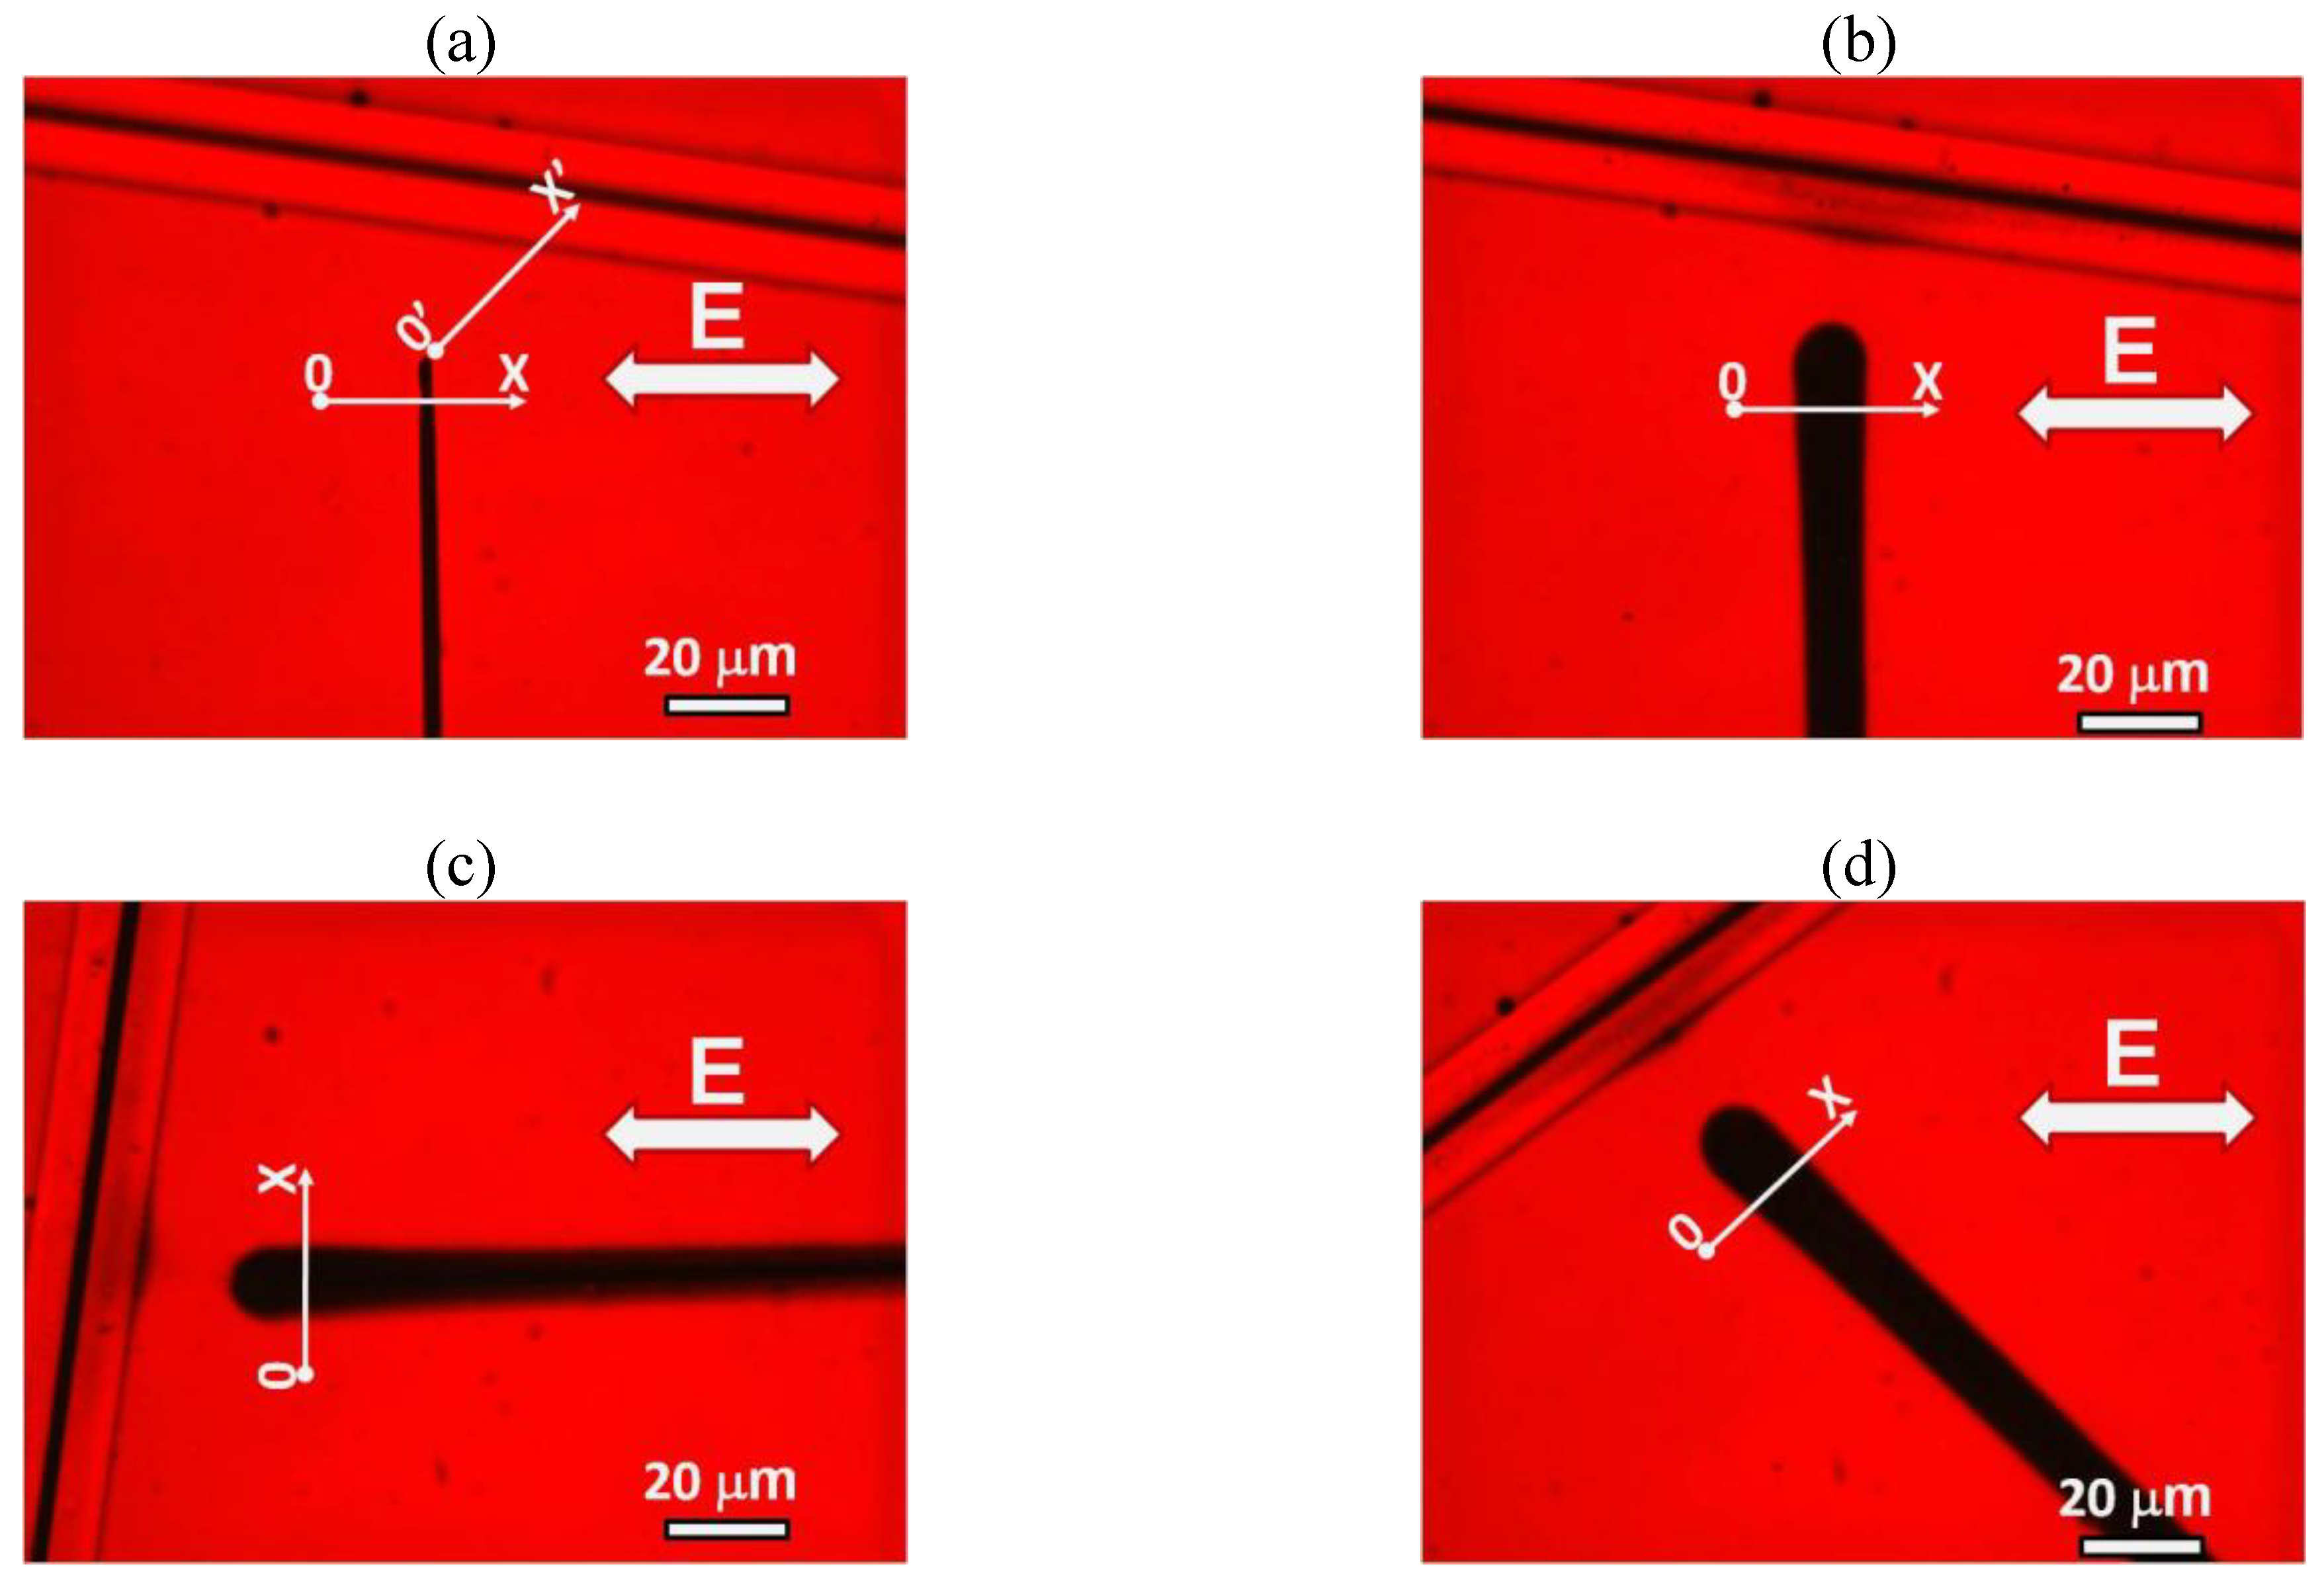
Figure 14(a) shows the profile of
along the direction OX in
Figure 8(b,c,d) across the central electrode, calculated using Equation (13).
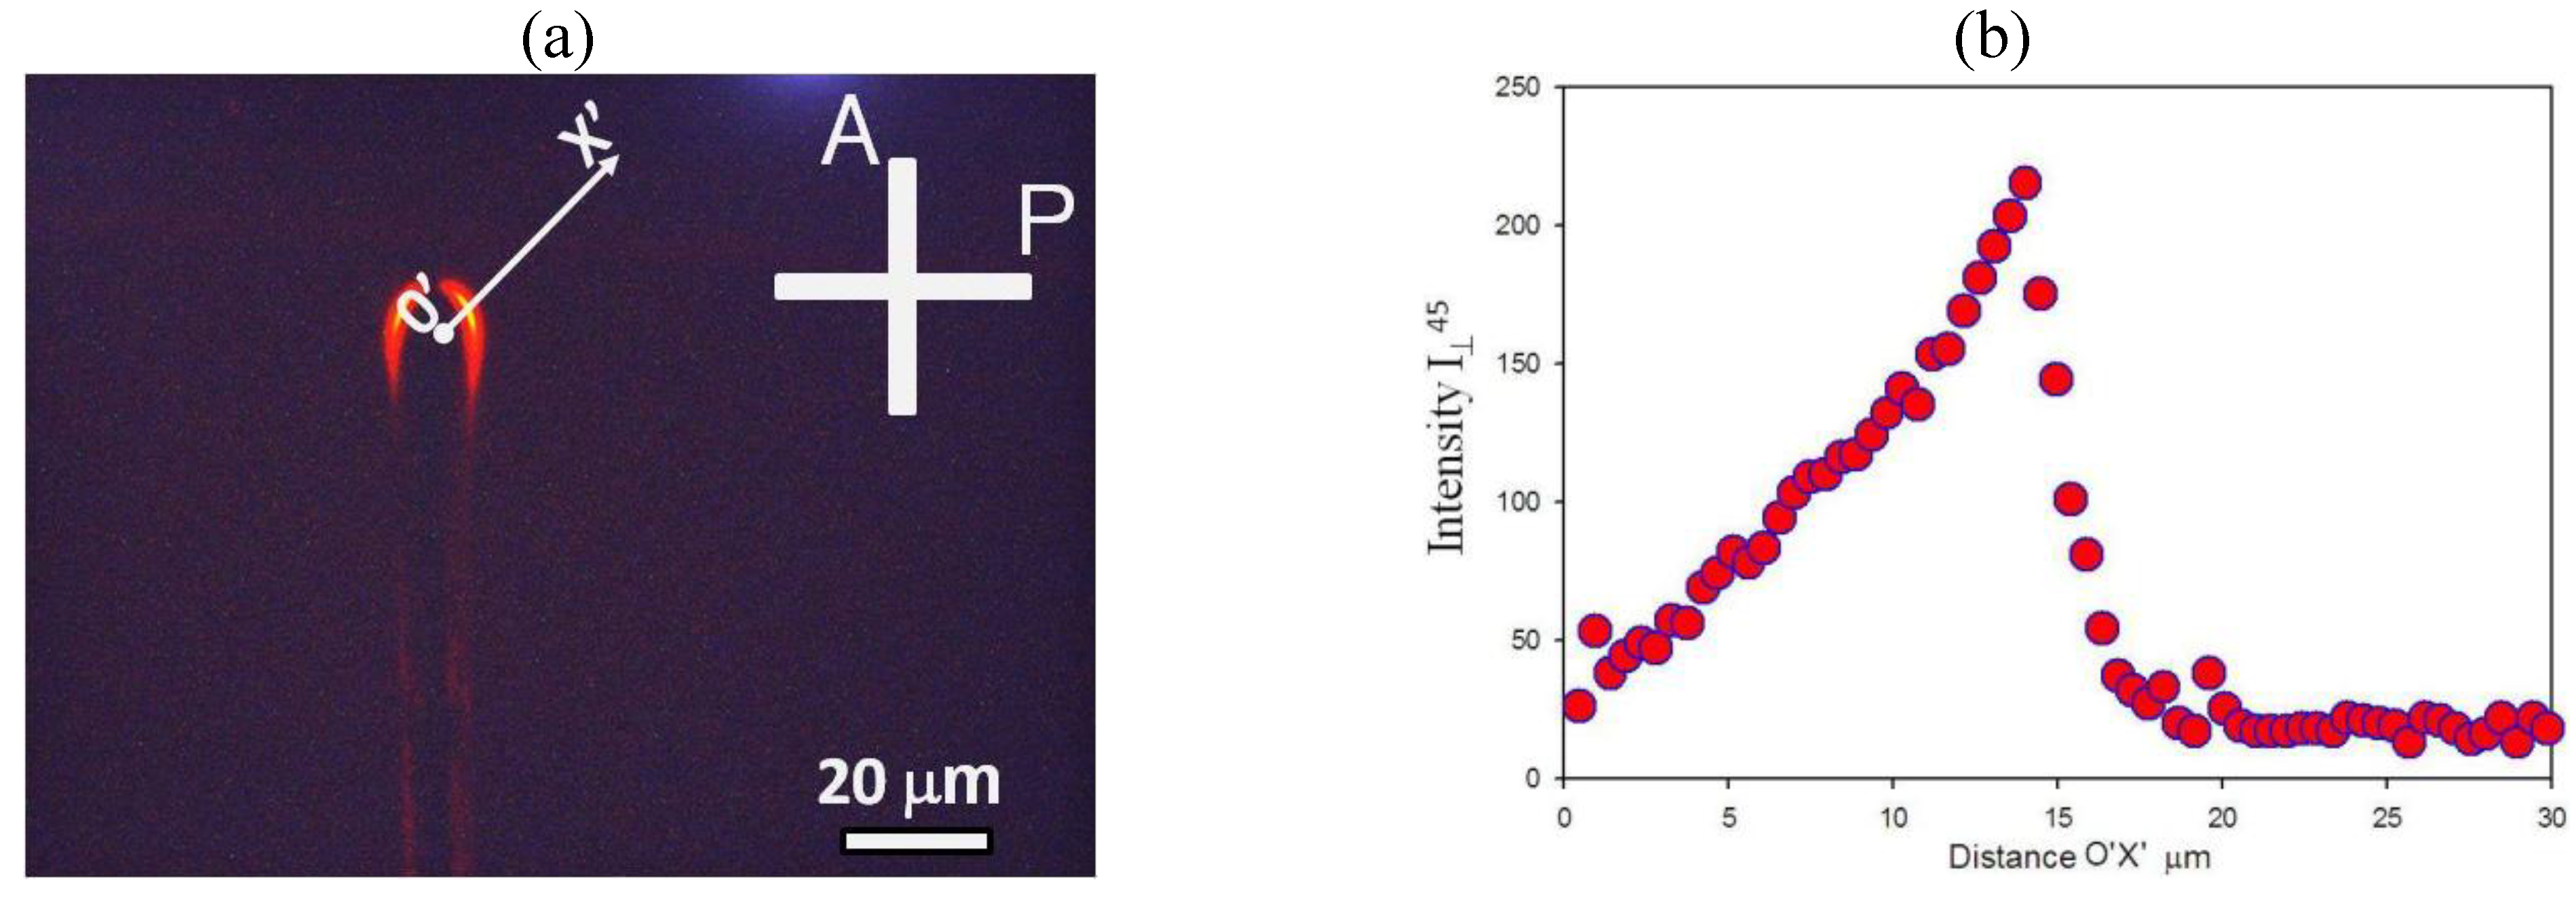
Figure 14(b) shows variation of
along the different direction O’X’ defined in
Figure 10(a); in mapping
, we used Equation (16) and the data shown in
Figure 10(b). Both approaches produce similar maps, demonstrating that the maximum field-induced optical path difference is about (-250) nm. The approach based on Equation (16) produces somewhat smoother features in the region of small path difference, apparently because of the higher accuracy in measuring
as compared to
.
Within the Au NRs cloud, concentration and orientation of the NRs vary along the Z direction. The local optical quantities such as
and
depend on these two and also on the degree of orientational order of NRs and thus also vary with Z. The simple relationship
thus produces only a rough estimate of the field-induced birefringence
. We can neglect the spatial variation of
, as light with polarization perpendicular to the optic axis “sees” only the circular cross-sections of NRs that occupy a relatively small fraction of space [
12]. Assuming for a moment that the thickness of a highly concentrated part of the Au NRs cloud is approximately equal to the diameter of electrode
, one can roughly estimate the maximum magnitude of field-induced birefringence in
Figure 14(a,b) as
. As we shall see in
Section 4.2 below, a more refined approach with numerical simulations of light transmittance through the flat cell produces a similar result.
Figure 14.
Optical path difference vs. distance OX calculated using Equation (13) (a) and Equation (16) (b). All data correspond to the toluene dispersion of “short/thin” Au NRs, , applied voltage U = 200 Vrms, f = 100 kHz.
Figure 14.
Optical path difference vs. distance OX calculated using Equation (13) (a) and Equation (16) (b). All data correspond to the toluene dispersion of “short/thin” Au NRs, , applied voltage U = 200 Vrms, f = 100 kHz.
4.2. Light Transmission through Flat Samples with NR Dispersions
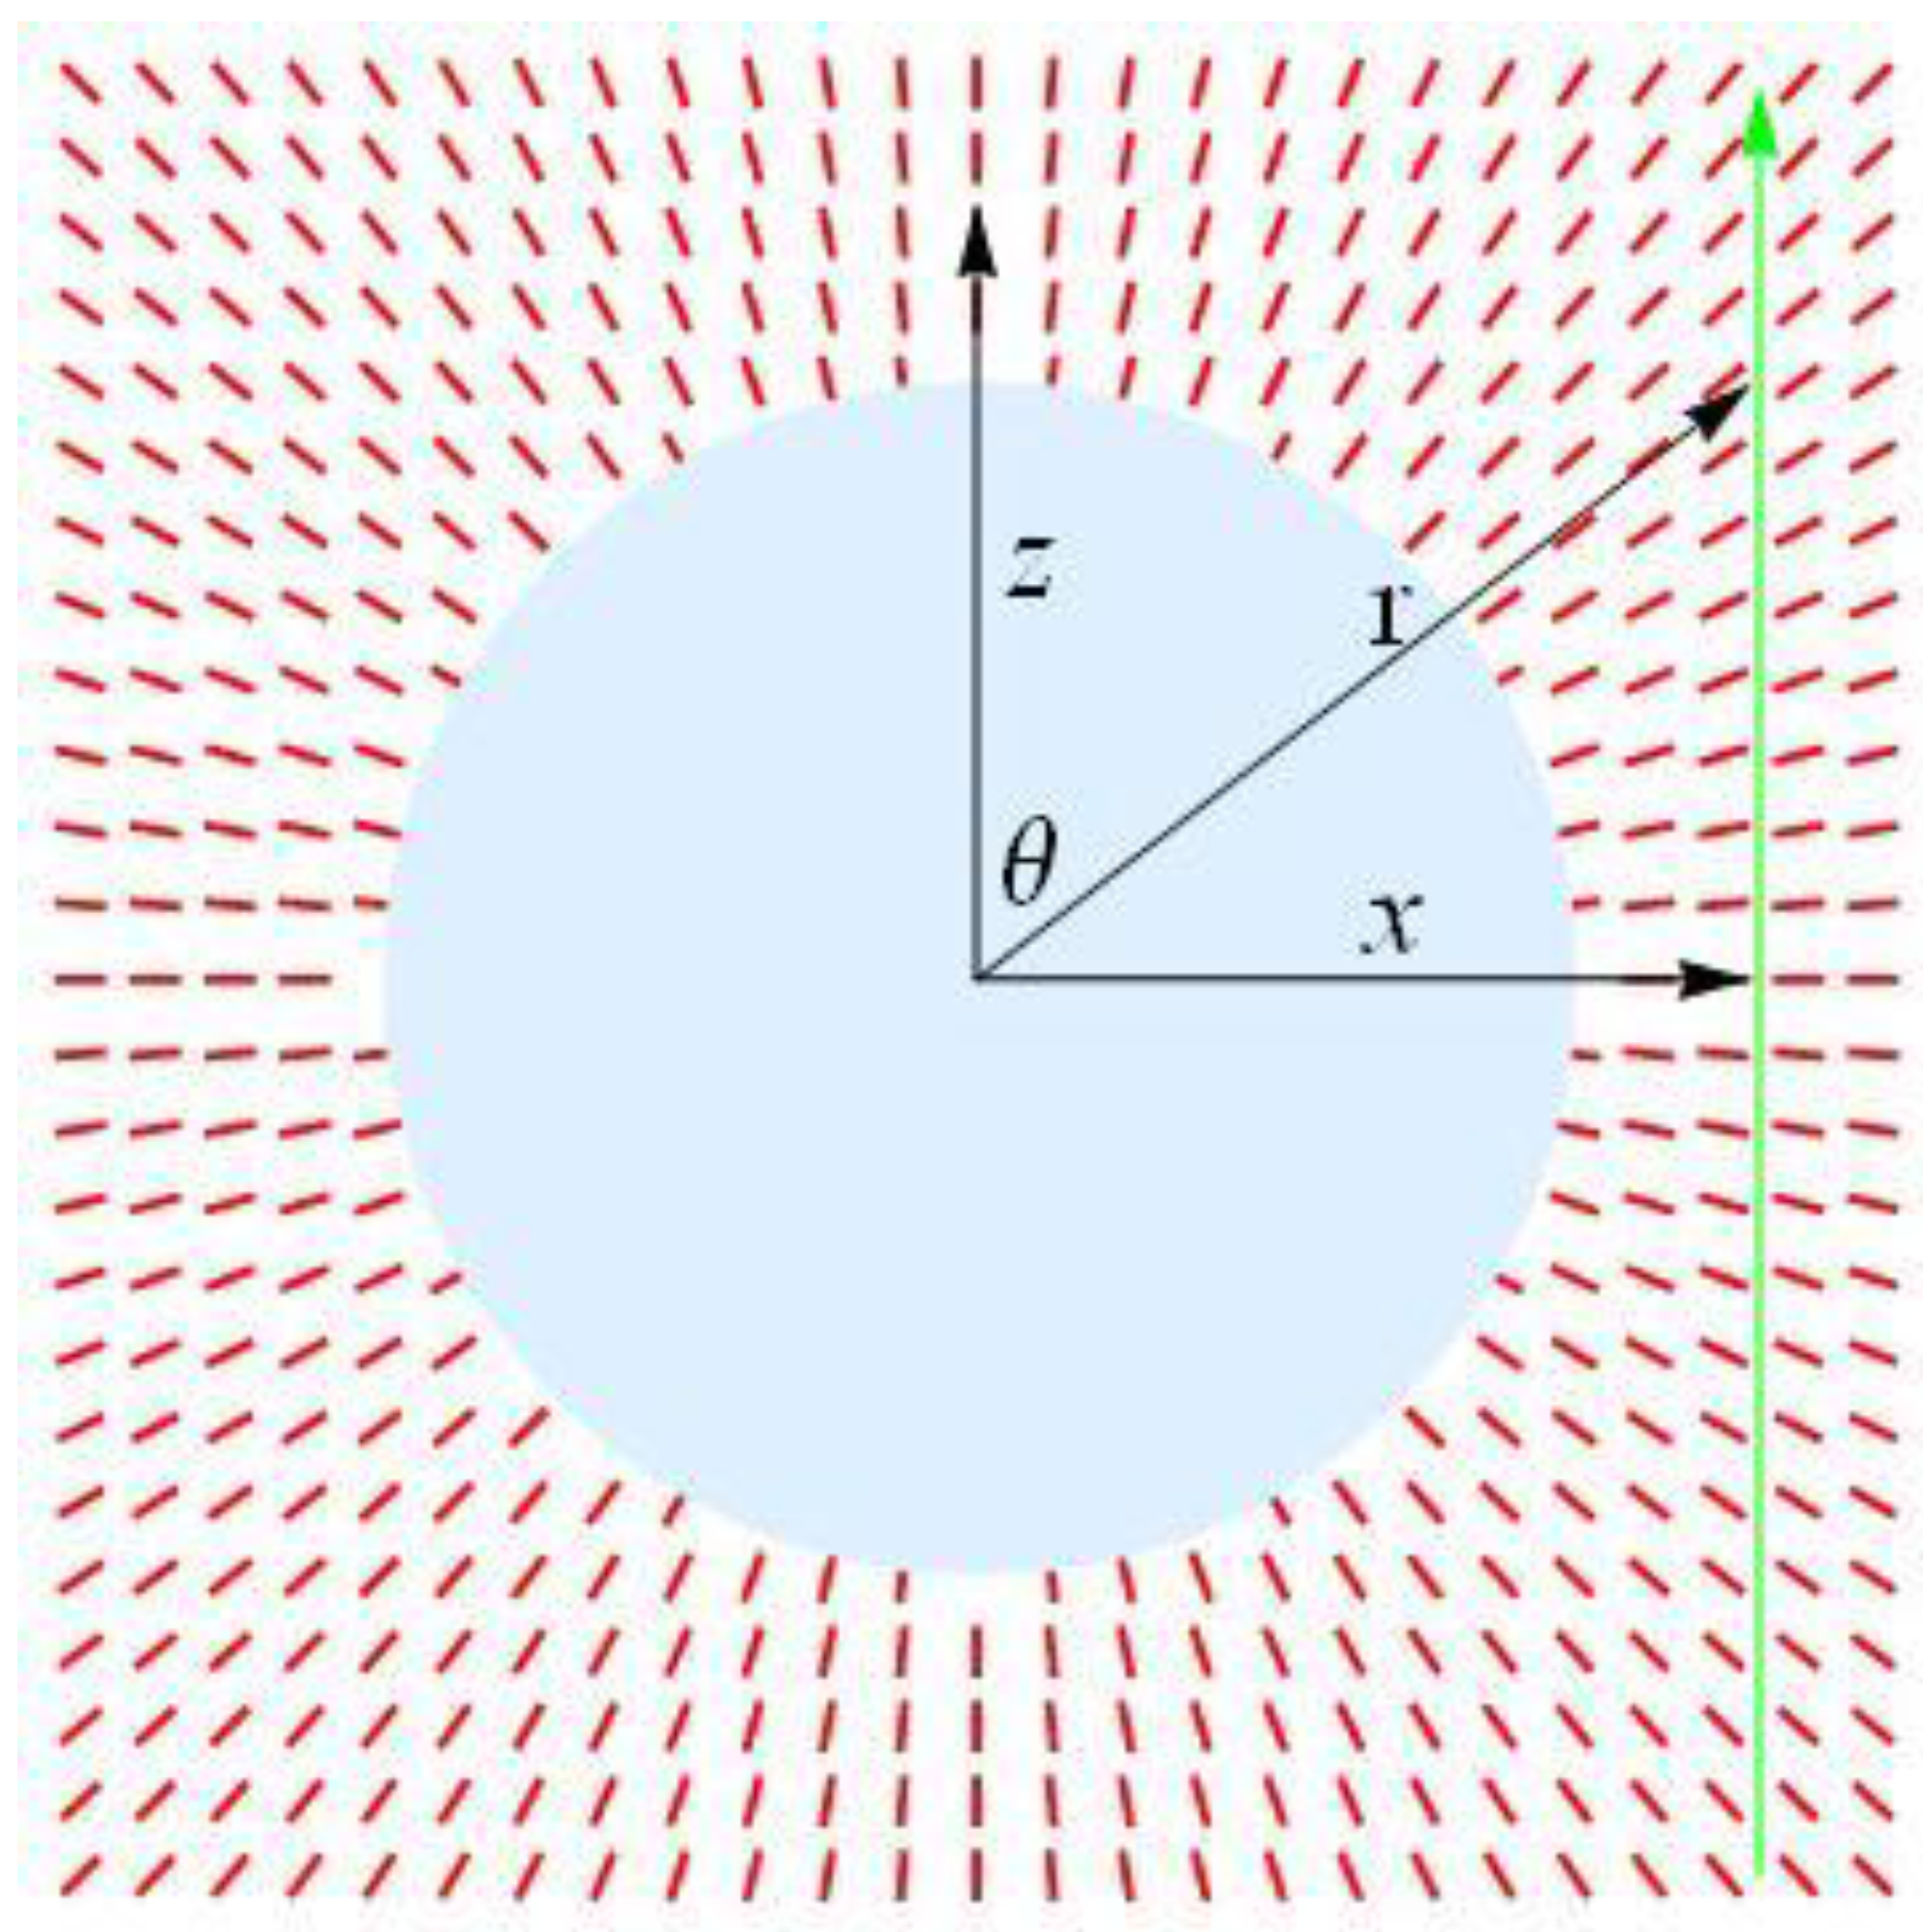
To get a better insight into the magnitude and spatial distribution of the field-induced optical properties of the switchable metamaterial, we need to consider the radial configuration of the optic axis and account for the fact that the system is spatially limited. We calculate light transmission through the sample of thickness
, placed between two crossed polarizers. We choose the Cartesian coordinate system
with the origin at the wire axis, direct the
z-axis normal to the substrates, and the
y-axis along the wire. We assume that the dielectric tensor at optical frequencies is uniaxial with radial (
) dependence of the ordinary
and extraordinary
refractive indices and that the optic axis
is normal to the wire,
, where
,
Figure 15. In such a medium, light propagates along the
z-axis as an ordinary wave with the refractive index
and an extraordinary wave with the effective refractive index
where
Here the expansion parameter is
, because
, and
Figure 15.
Light propagation (vertical green arrow on the right hand side) in a medium with radial configuration of the optic axis (red bars) around the wire (grey circle).
Figure 15.
Light propagation (vertical green arrow on the right hand side) in a medium with radial configuration of the optic axis (red bars) around the wire (grey circle).
Our goal is to recover
from the experimentally measured optical path difference
shown in
Figure 14(a) (the data in
Figure 14(b) produce similar results). Considering
small, we calculate
We represent
as an inverse power series
.
Then,
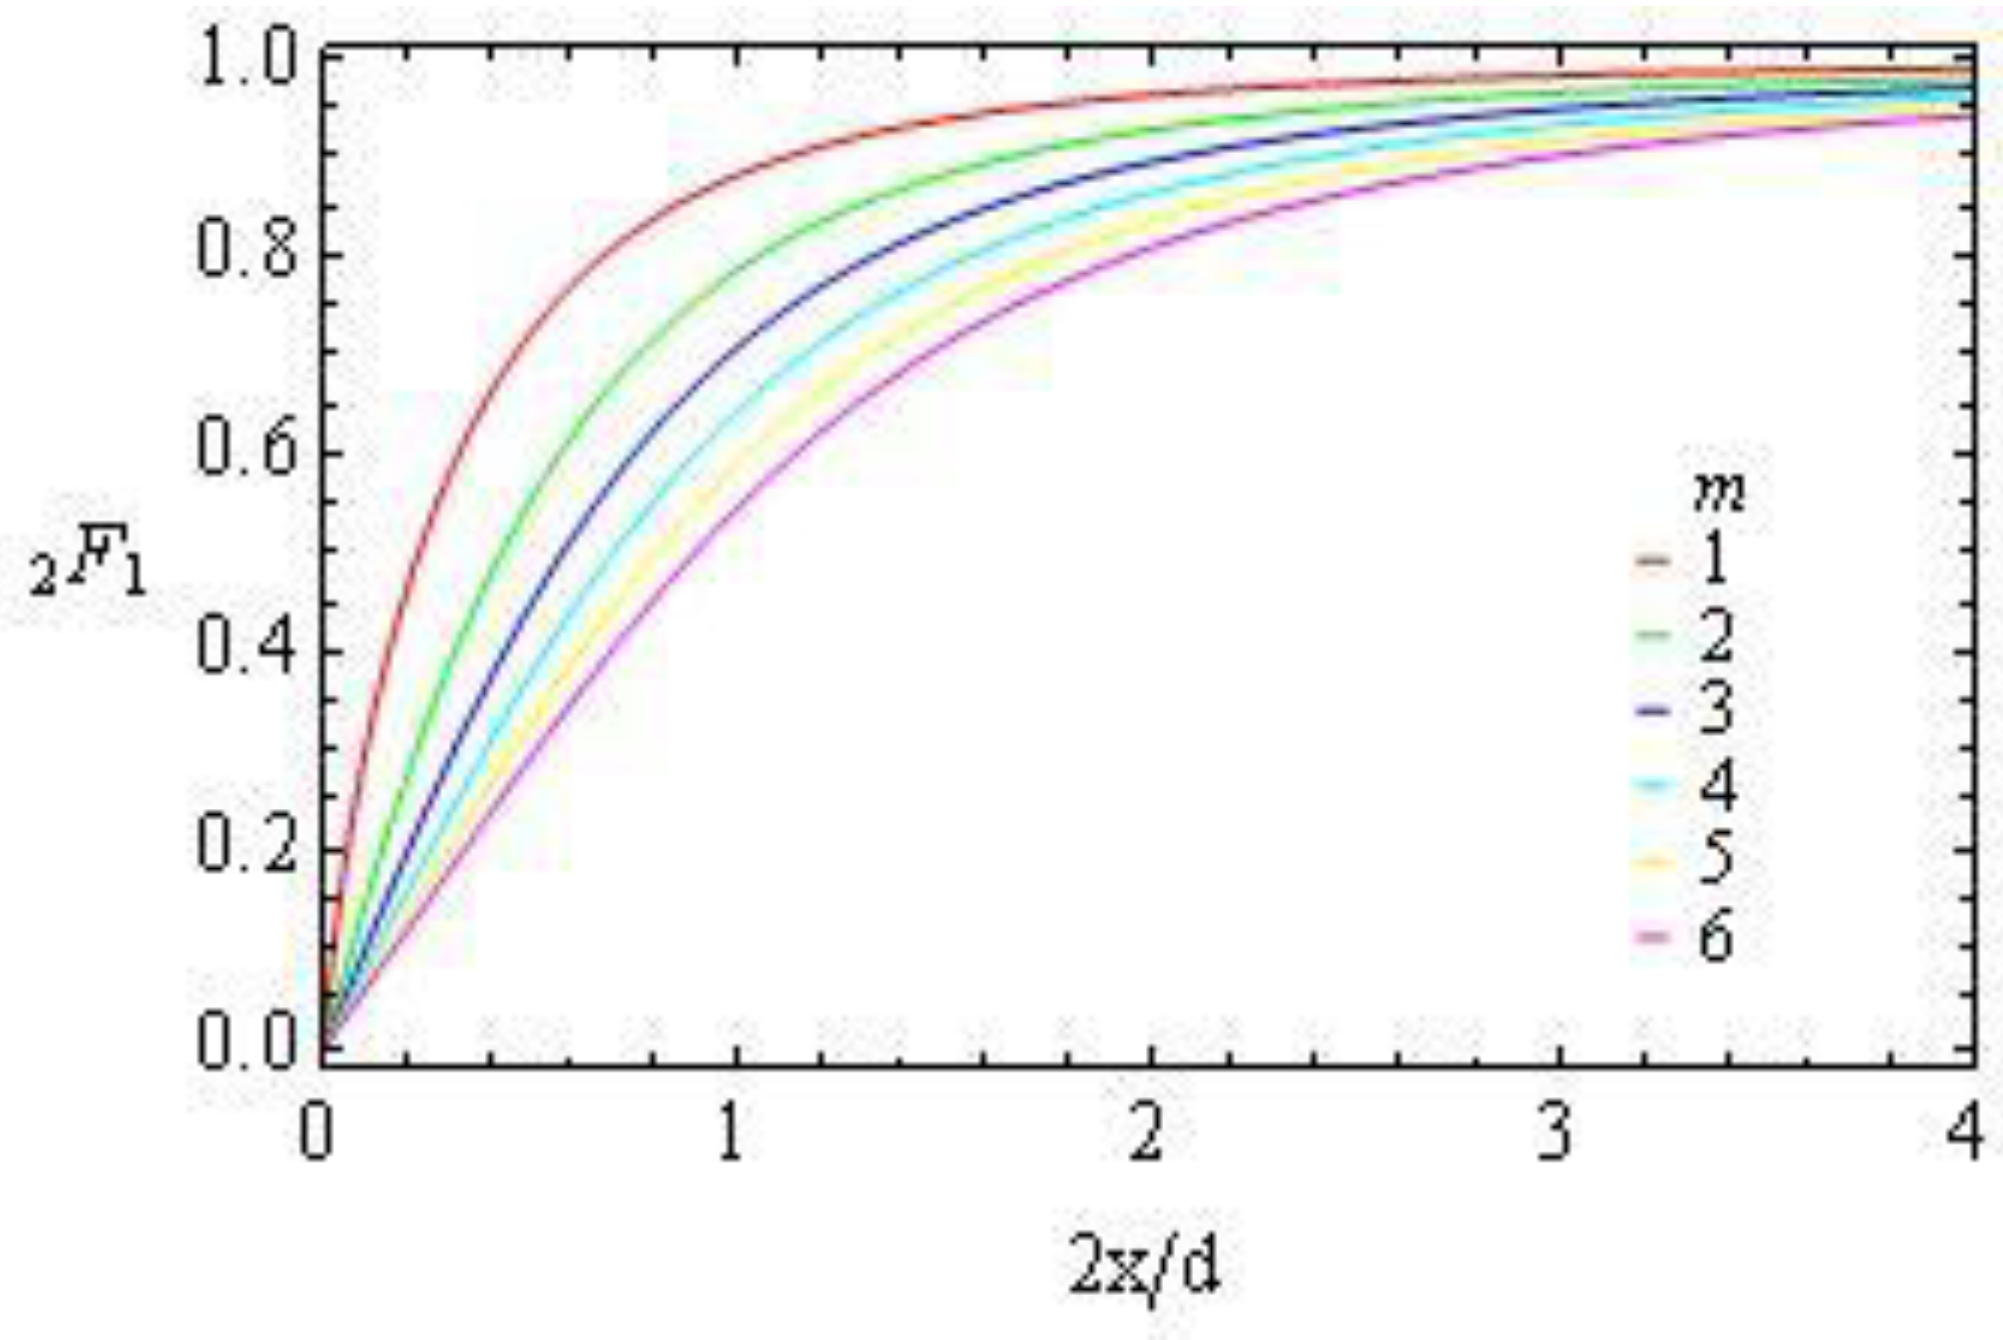
Here
are the Gauss hypergeometric functions,
Figure 16, that are linear for small
and saturate to 1 for large
,
where
is the gamma function.
Figure 16.
The Gauss hypergeometric functions vs. for different m.
Figure 16.
The Gauss hypergeometric functions vs. for different m.
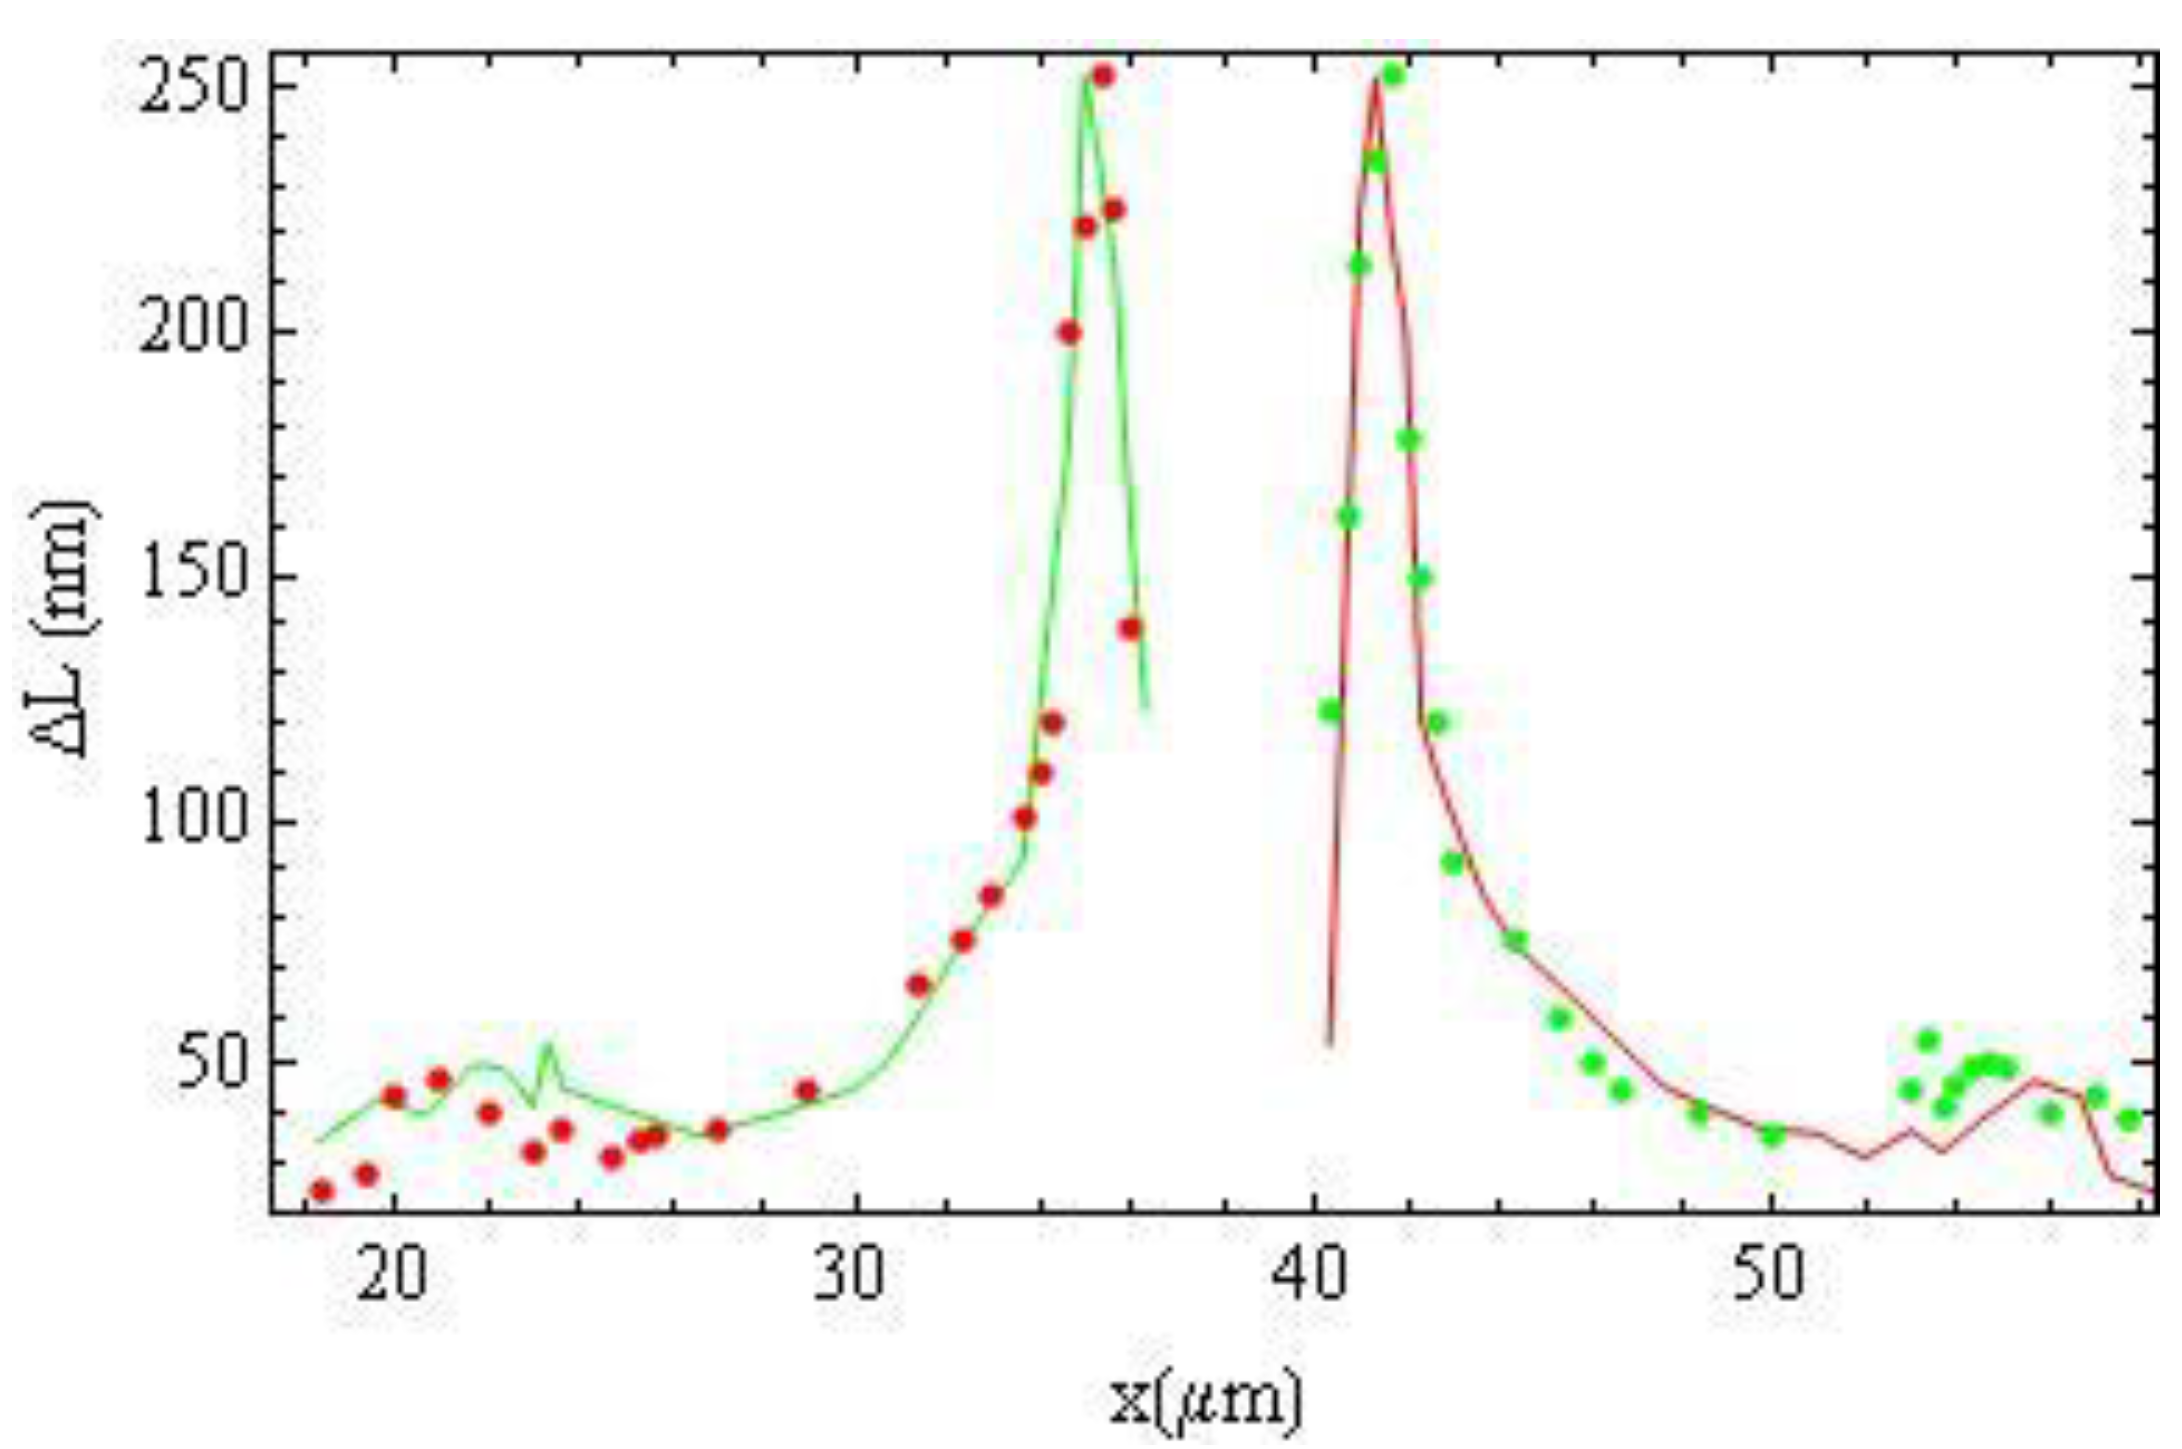
We start the analysis of experimental data with the determination of the center of wire
by fitting the left wing of the experimental plot in
Figure 14(a) with an interpolation from the right wing and
vice versa,
Figure 17. Then we combine both wings in
Figure 14(a) using
as an origin,
Figure 18 and
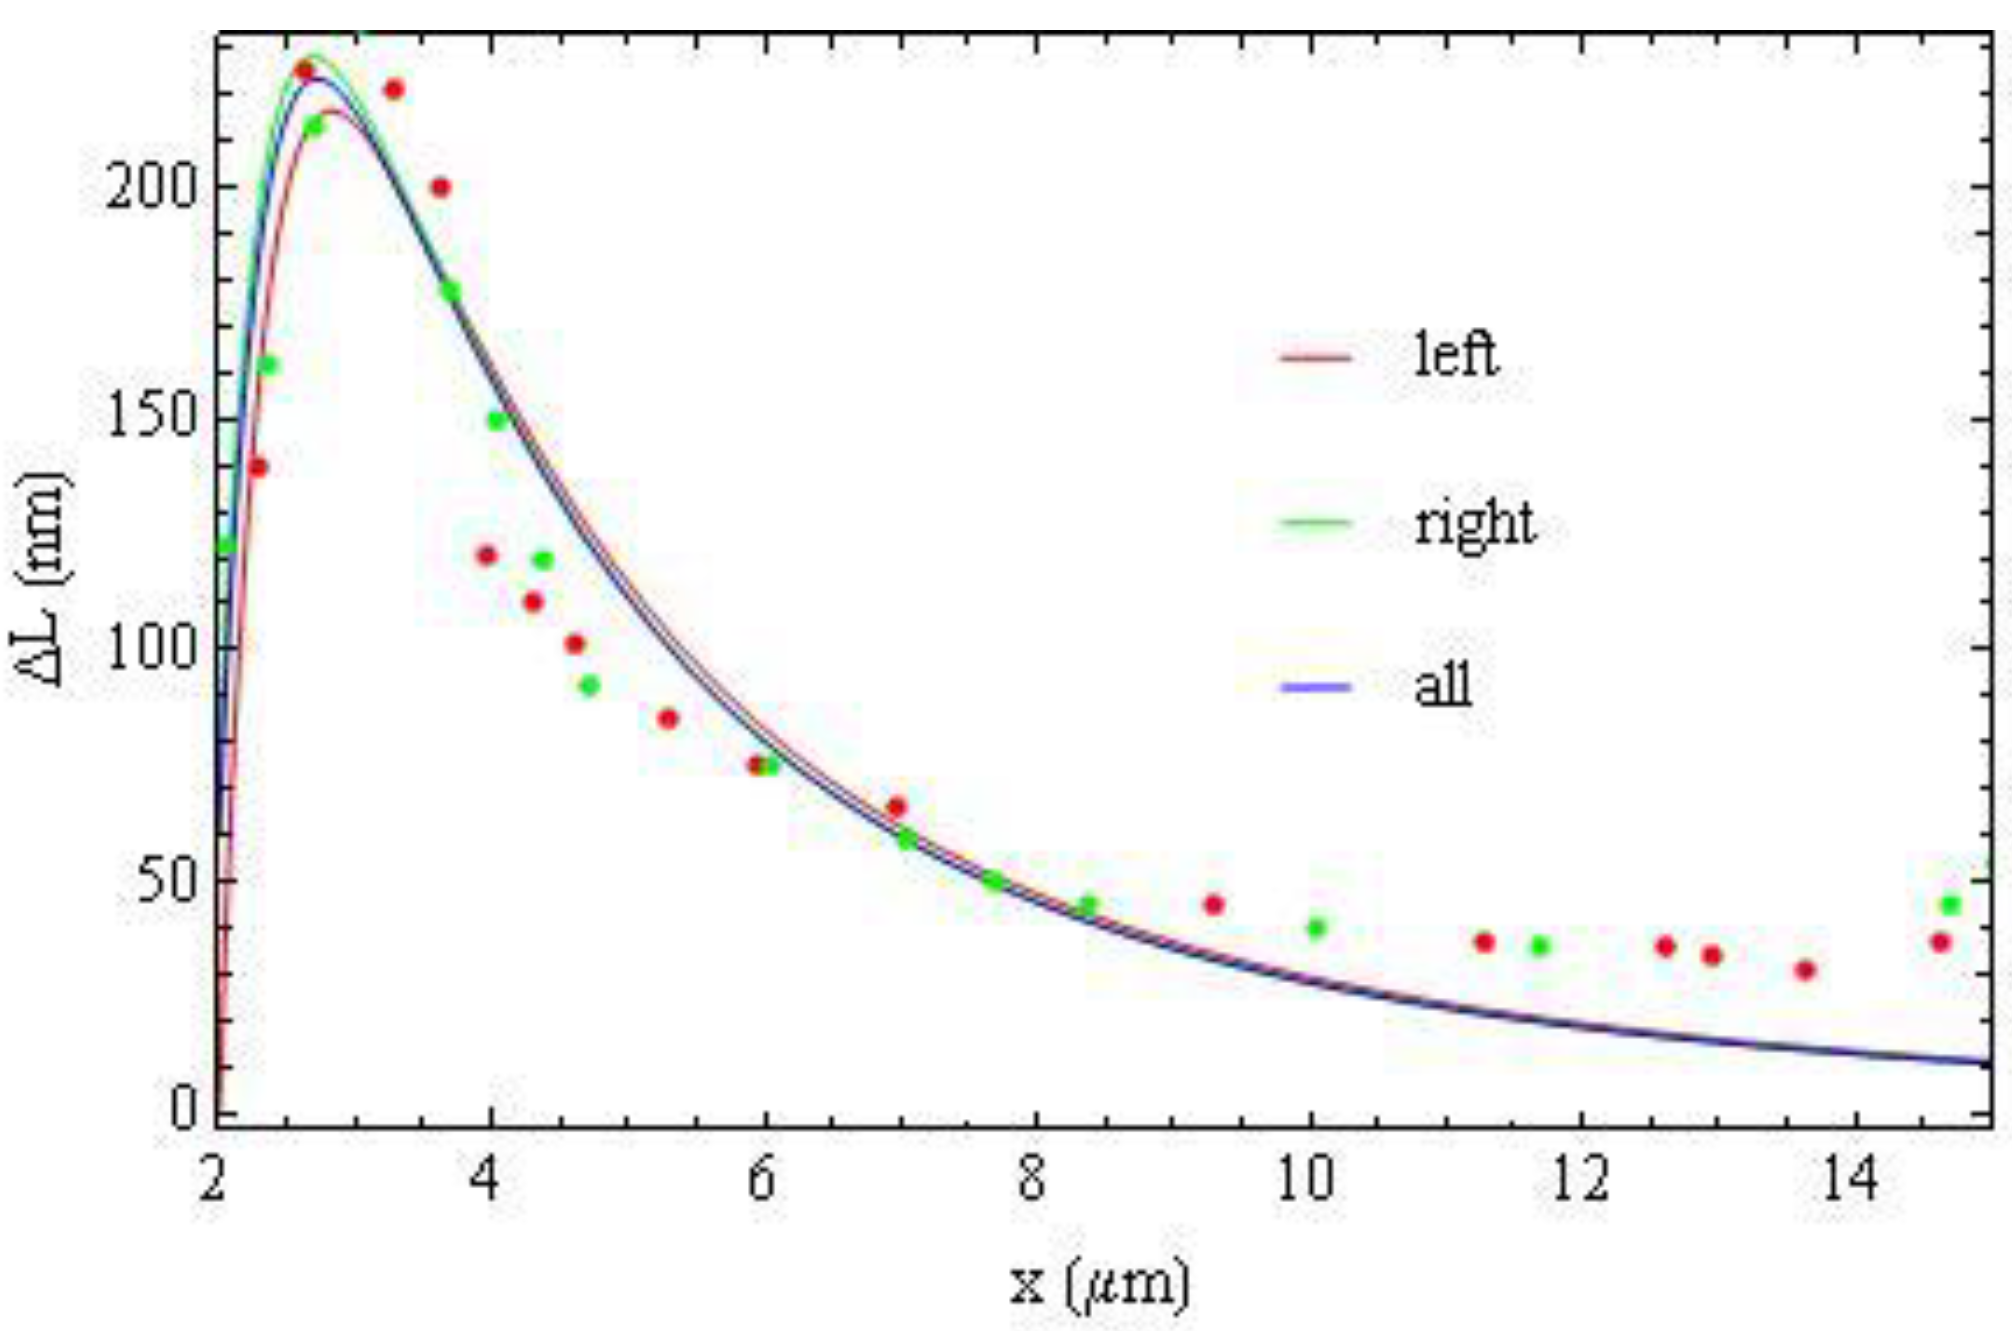
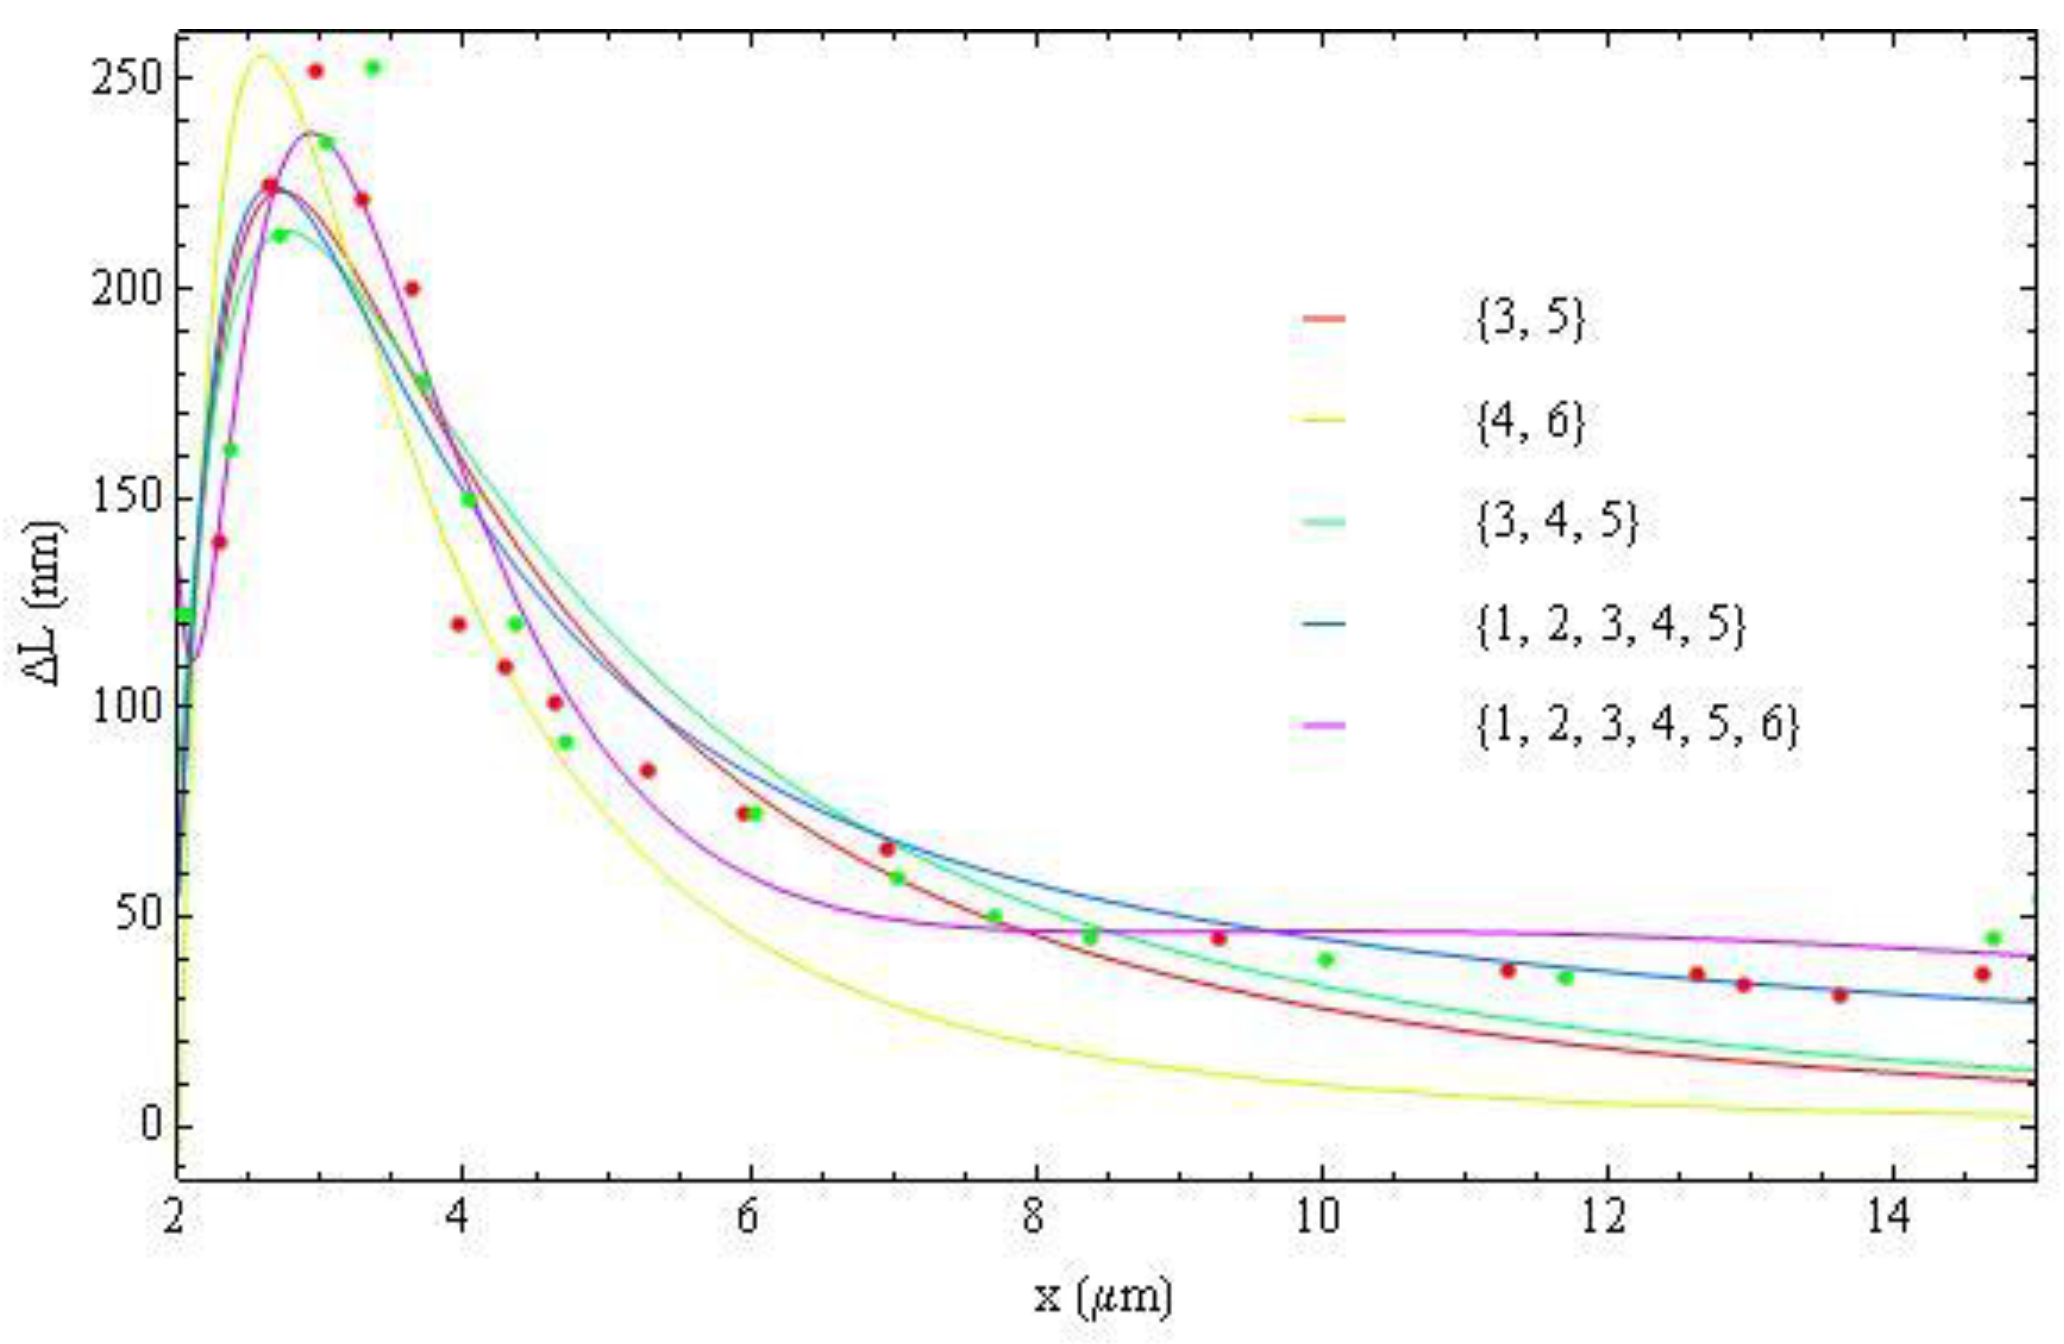
Figure 19, and fit the optical phase retardation profile using different sets of terms in Equation (20).
Figure 18 demonstrates that fitting the left wing (red), right wing (green) and all experimental data (blue) with
m = 3 and
m = 5 from Equation (20) results in almost the same interpolation curves.
Figure 17.
Fitting the left wing (red) of
Figure 14 (a) with interpolation from the right wing (green) and
vice versa allows us to determine the center of wire
.
Figure 17.
Fitting the left wing (red) of
Figure 14 (a) with interpolation from the right wing (green) and
vice versa allows us to determine the center of wire
.
Figure 18.
Fitting the left part (red), right part (green) and all experimental data (blue) with Equation (20) with m = 3 and m = 5 results in almost the same interpolation curves.
Figure 18.
Fitting the left part (red), right part (green) and all experimental data (blue) with Equation (20) with m = 3 and m = 5 results in almost the same interpolation curves.
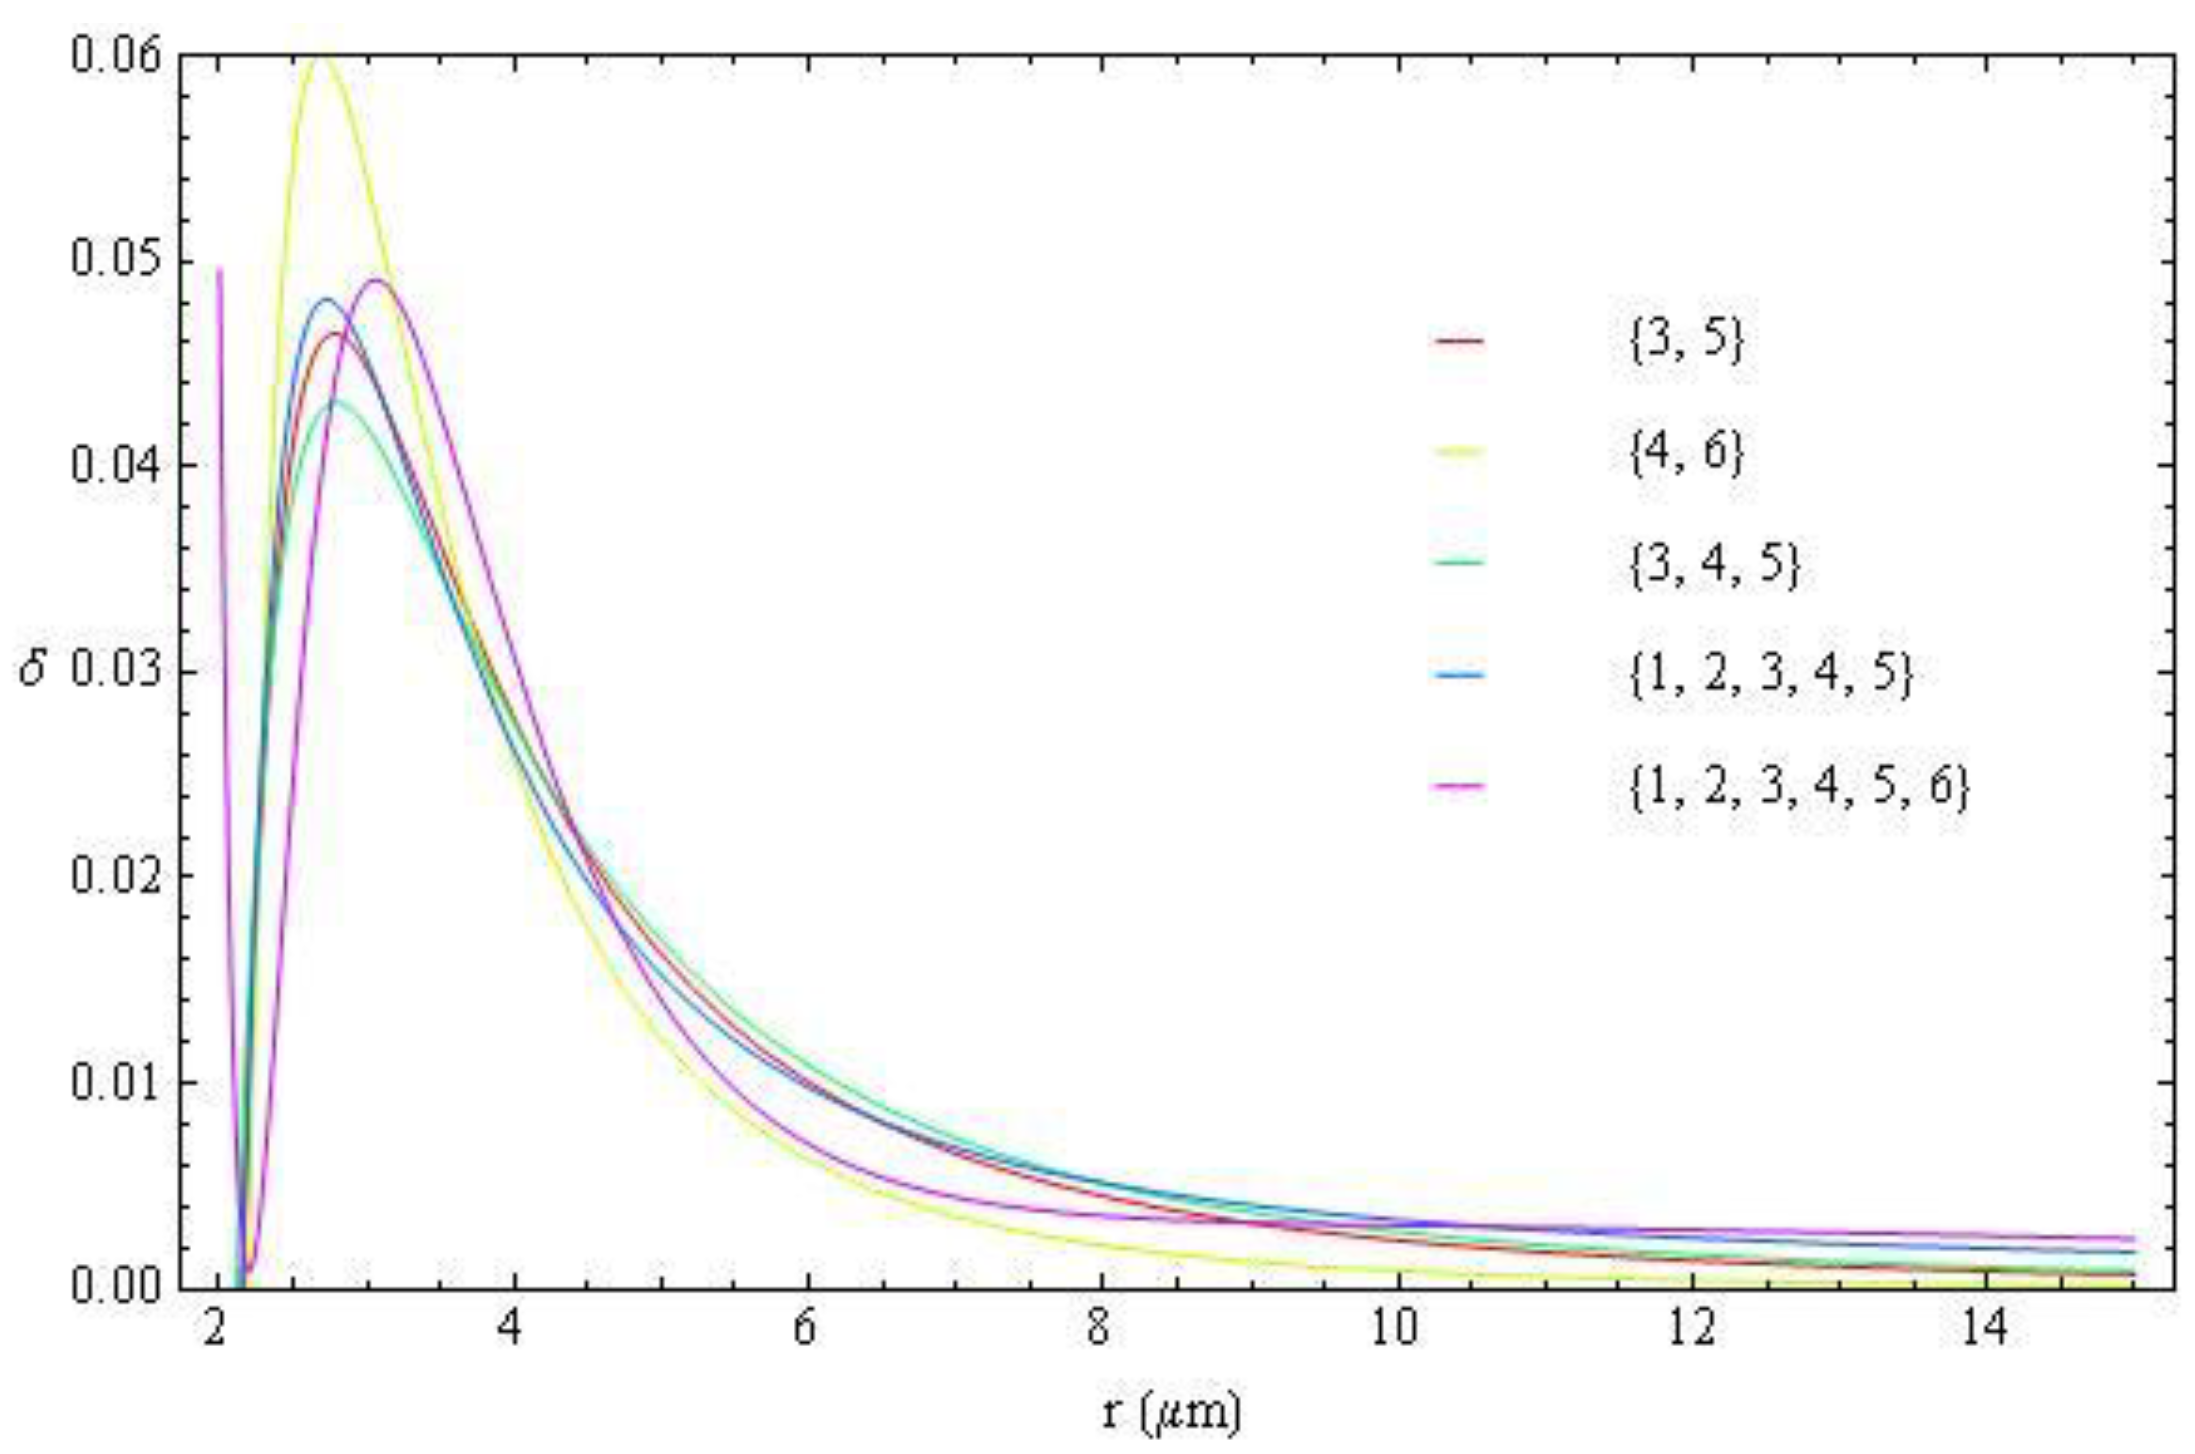
Figure 19.
Fitting (all) experimental data with Equation (20) with different sets of m, shown in the legend.
Figure 19.
Fitting (all) experimental data with Equation (20) with different sets of m, shown in the legend.
Figure 20.
Radial dependence of the birefringence parameter
, Equation (18), obtained from the fittings shown in
Figure 19.
Figure 20.
Radial dependence of the birefringence parameter
, Equation (18), obtained from the fittings shown in
Figure 19.
With
Figure 19, we produce the fitting of the birefringence parameter
, Equation (18), using different sets of
m,
Figure 20. The fitting curves for different approaches are very close to each other, signaling that the data on
are robust. Apparently, the set
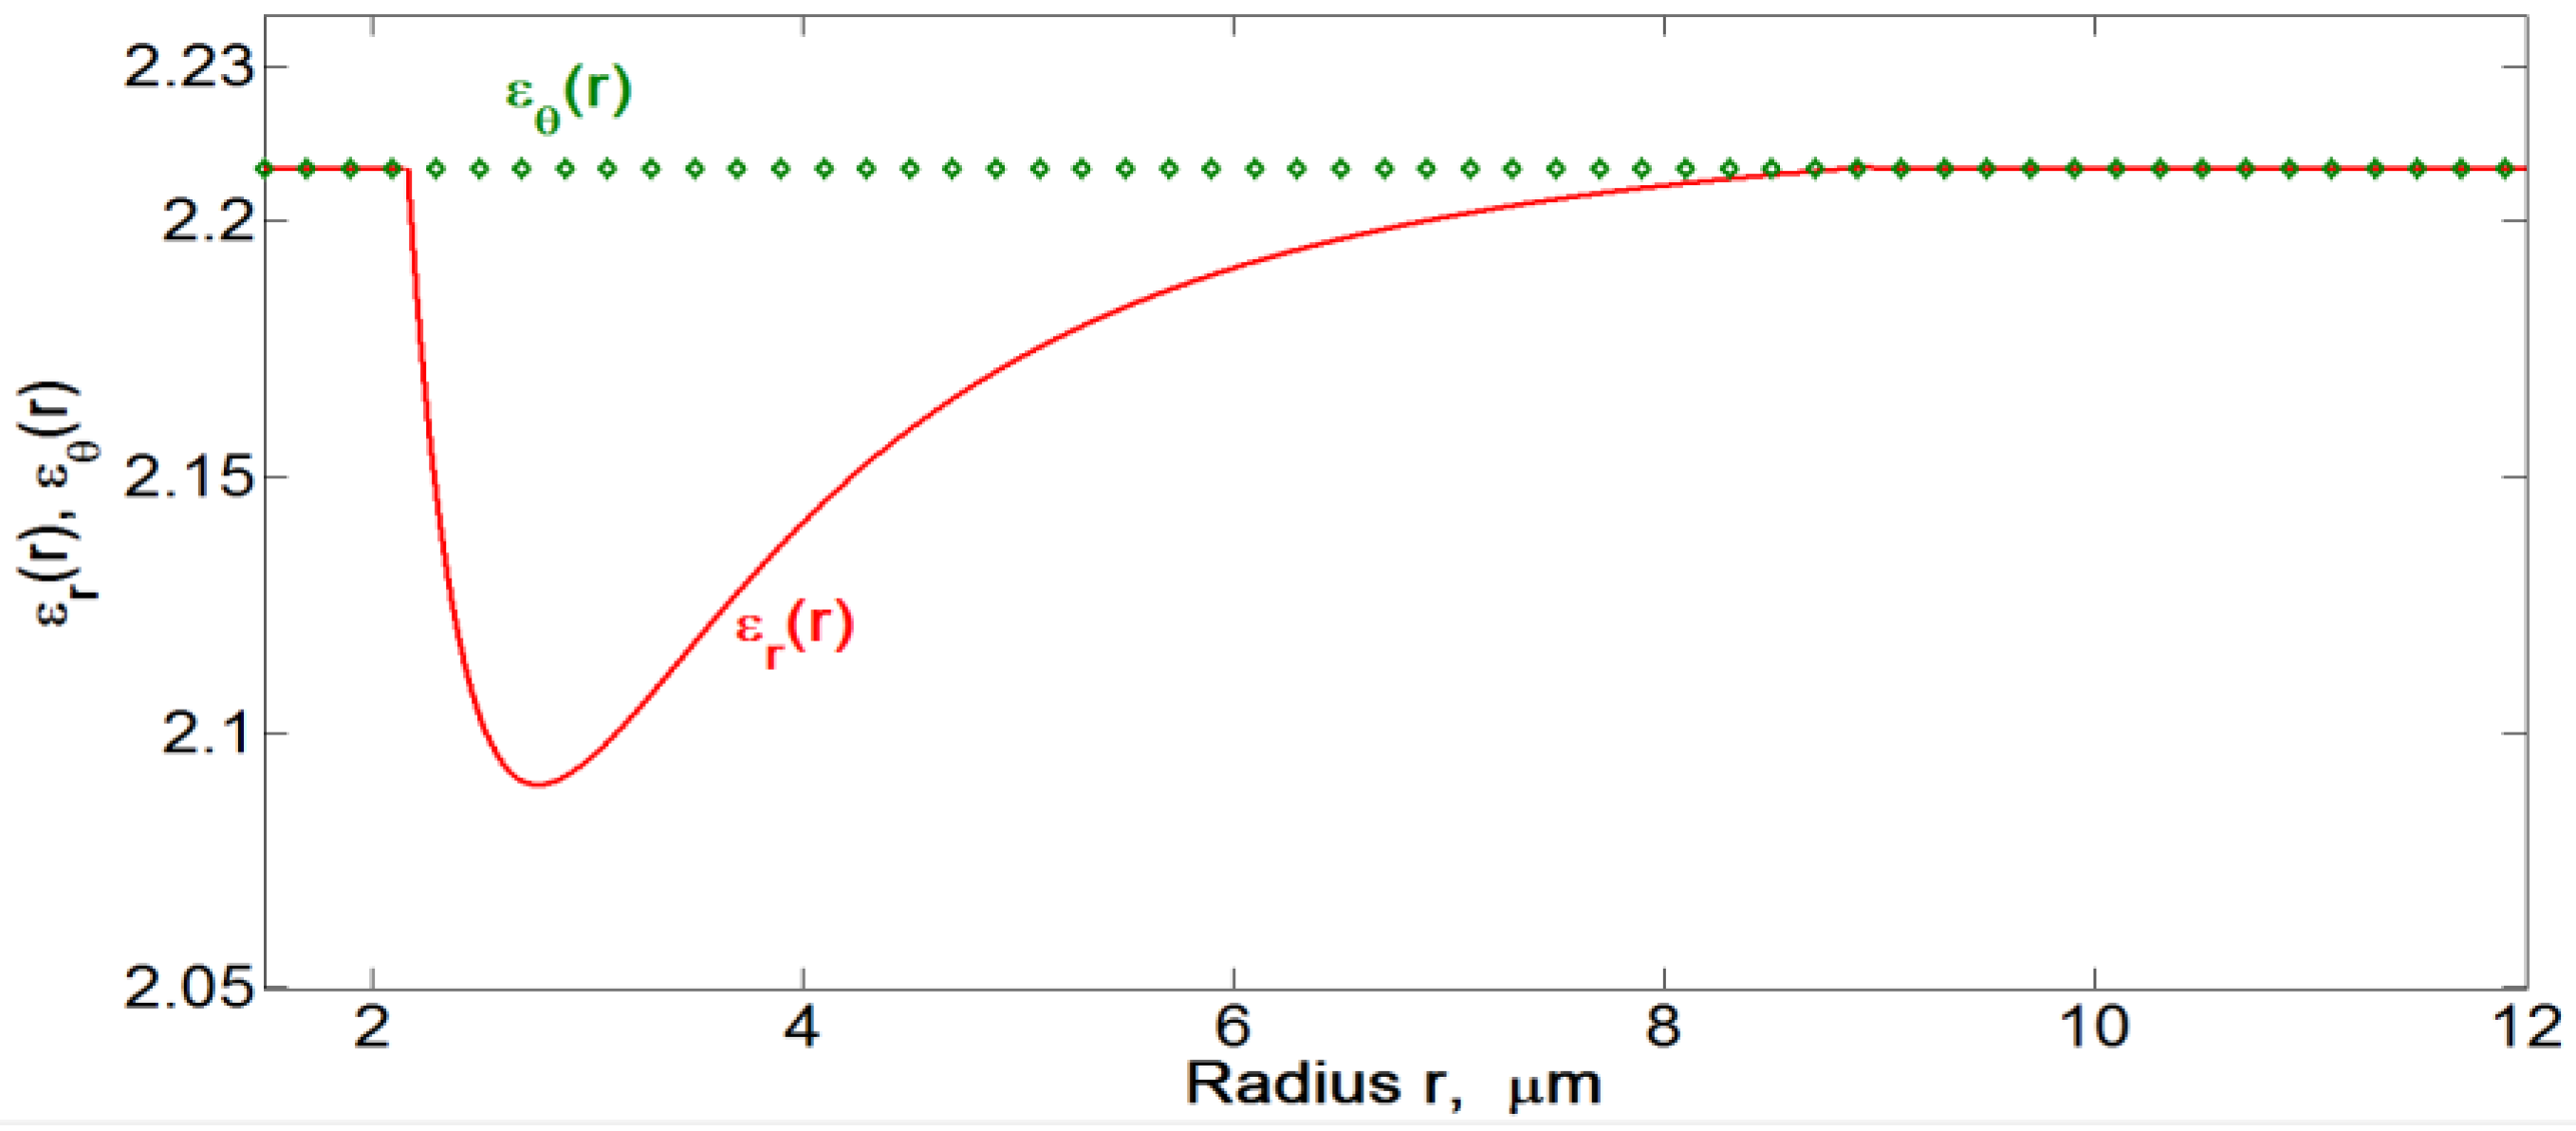
m = {3,5} provides the most reliable fitting because further expansion of the basis of fitting functions does not improve the result substantially. Thus for this set we calculate the radial dependence of permittivity
,
Figure 21, assuming that the ordinary refractive index
is constant across the capillary and equal to the refractive index of toluene
, so that
. The spatial distribution of the radial and azimuthal components of dielectric permittivity (refractive indices) induced by the gradient electric field (
U = 200 V
rms,
f = 100 kHz) in a flat cell shown in
Figure 21 is one of the major results of this work. These dependences will be used in the numerical simulations of light propagation through the Au NRs dispersion in cylindrical cells,
Section 4.3.
Figure 21.
Radial dependence of
, obtained from Equation (18) and
for
m = {3,5} shown in
Figure 20, with
. The data correspond to the toluene dispersion of “short/thin” Au NRs in the flat cell,
,
U= 200 V
rms,
f = 100 kHz, see
Figure 14(a).
Figure 21.
Radial dependence of
, obtained from Equation (18) and
for
m = {3,5} shown in
Figure 20, with
. The data correspond to the toluene dispersion of “short/thin” Au NRs in the flat cell,
,
U= 200 V
rms,
f = 100 kHz, see
Figure 14(a).
The field
-dependent
can be estimated independently by considering the dispersion as a dielectric of permittivity
pierced with parallel NRs of permittivity
with the field-dependent volume fraction
:
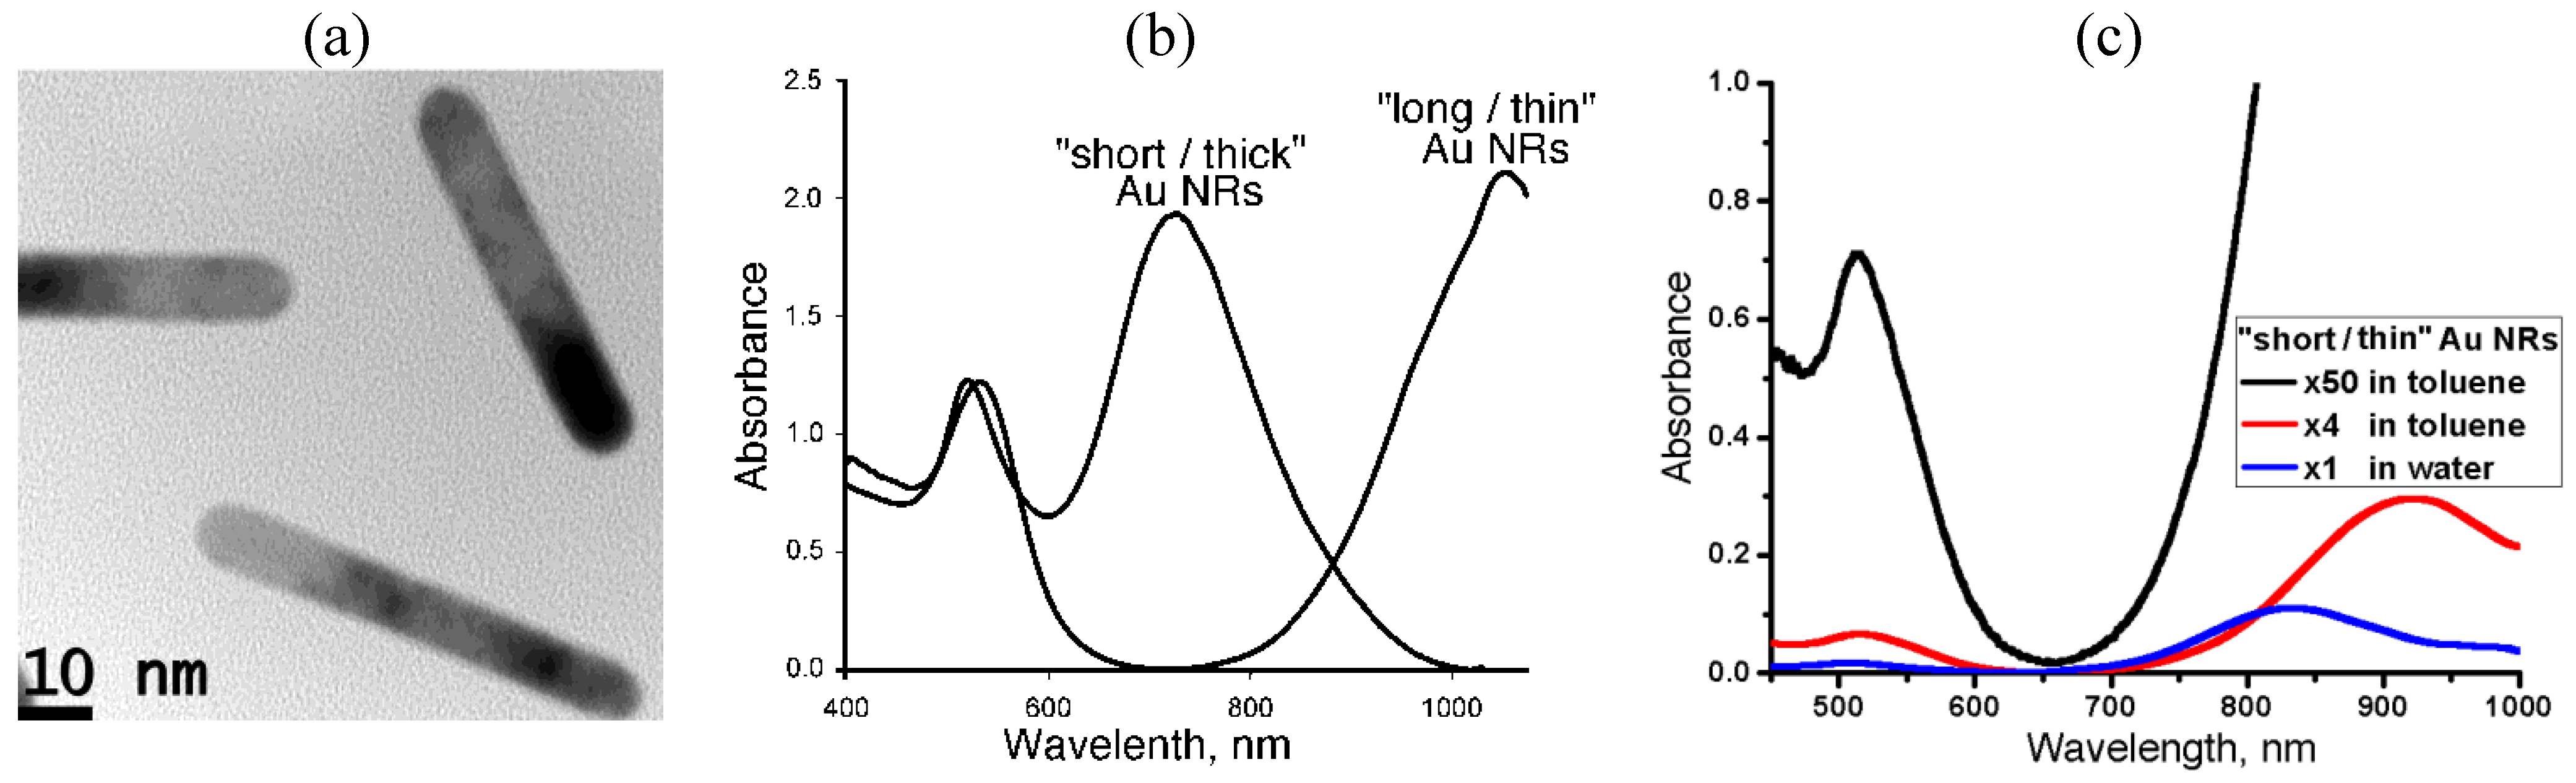
For the experimentally determined (from light absorption data in
Section 3.1)
, and for
at 656 nm [
34], one finds
and thus
, the same order of magnitude as other estimates above.
Birefringence of the NRs cloud reflects the cumulative effect of the Au NRs and their polystyrene (PS) coatings. The contribution of PS to the refractive index depends on the configuration of polymer chains covalently grafted to the Au NRs. Birefringence of stretched polystyrene is negative with the refractive index along the PS chain being smaller than the refractive index perpendicular to the chain [
37]. Therefore, if the PS chains are directed normally to the NR surface, they will diminish the birefringence effect introduced by alignment of Au NRs; parallel arrangement would enhance the effect of NRs. The experimentally measured birefringence of mechanically stretched PS is
at 700 nm [
37]. Therefore, if we assume that in flat cells the entire gap
is filled with such a birefringent PS, the total optical path difference between the extraordinary and ordinary waves
would be about 12 nm only,
i.e., an order of magnitude smaller than the experimental value of
. The estimate suggests that the main contribution in the field-induced modification of the optical properties of the metamaterial in question is produced by the Au NRs themselves.
4.3. Simulations of Optical Effects Caused by NR Redistribution in Cylindrical Samples
We use a commercial Finite Element Package of COMSOL Multiphysics with Radio Frequency module version 4.0a to simulate the electromagnetic wave propagation in the cylindrical cell filled with toluene dispersion of “short/thin” Au NRs. In simulations of the “cloak on” regime,
Figure 22(a), we used the dielectric permittivity profile shown in
Figure 21, around the central copper electrode of the diameter
. Note that the permittivity profile in
Figure 22 was obtained for the flat cell but in
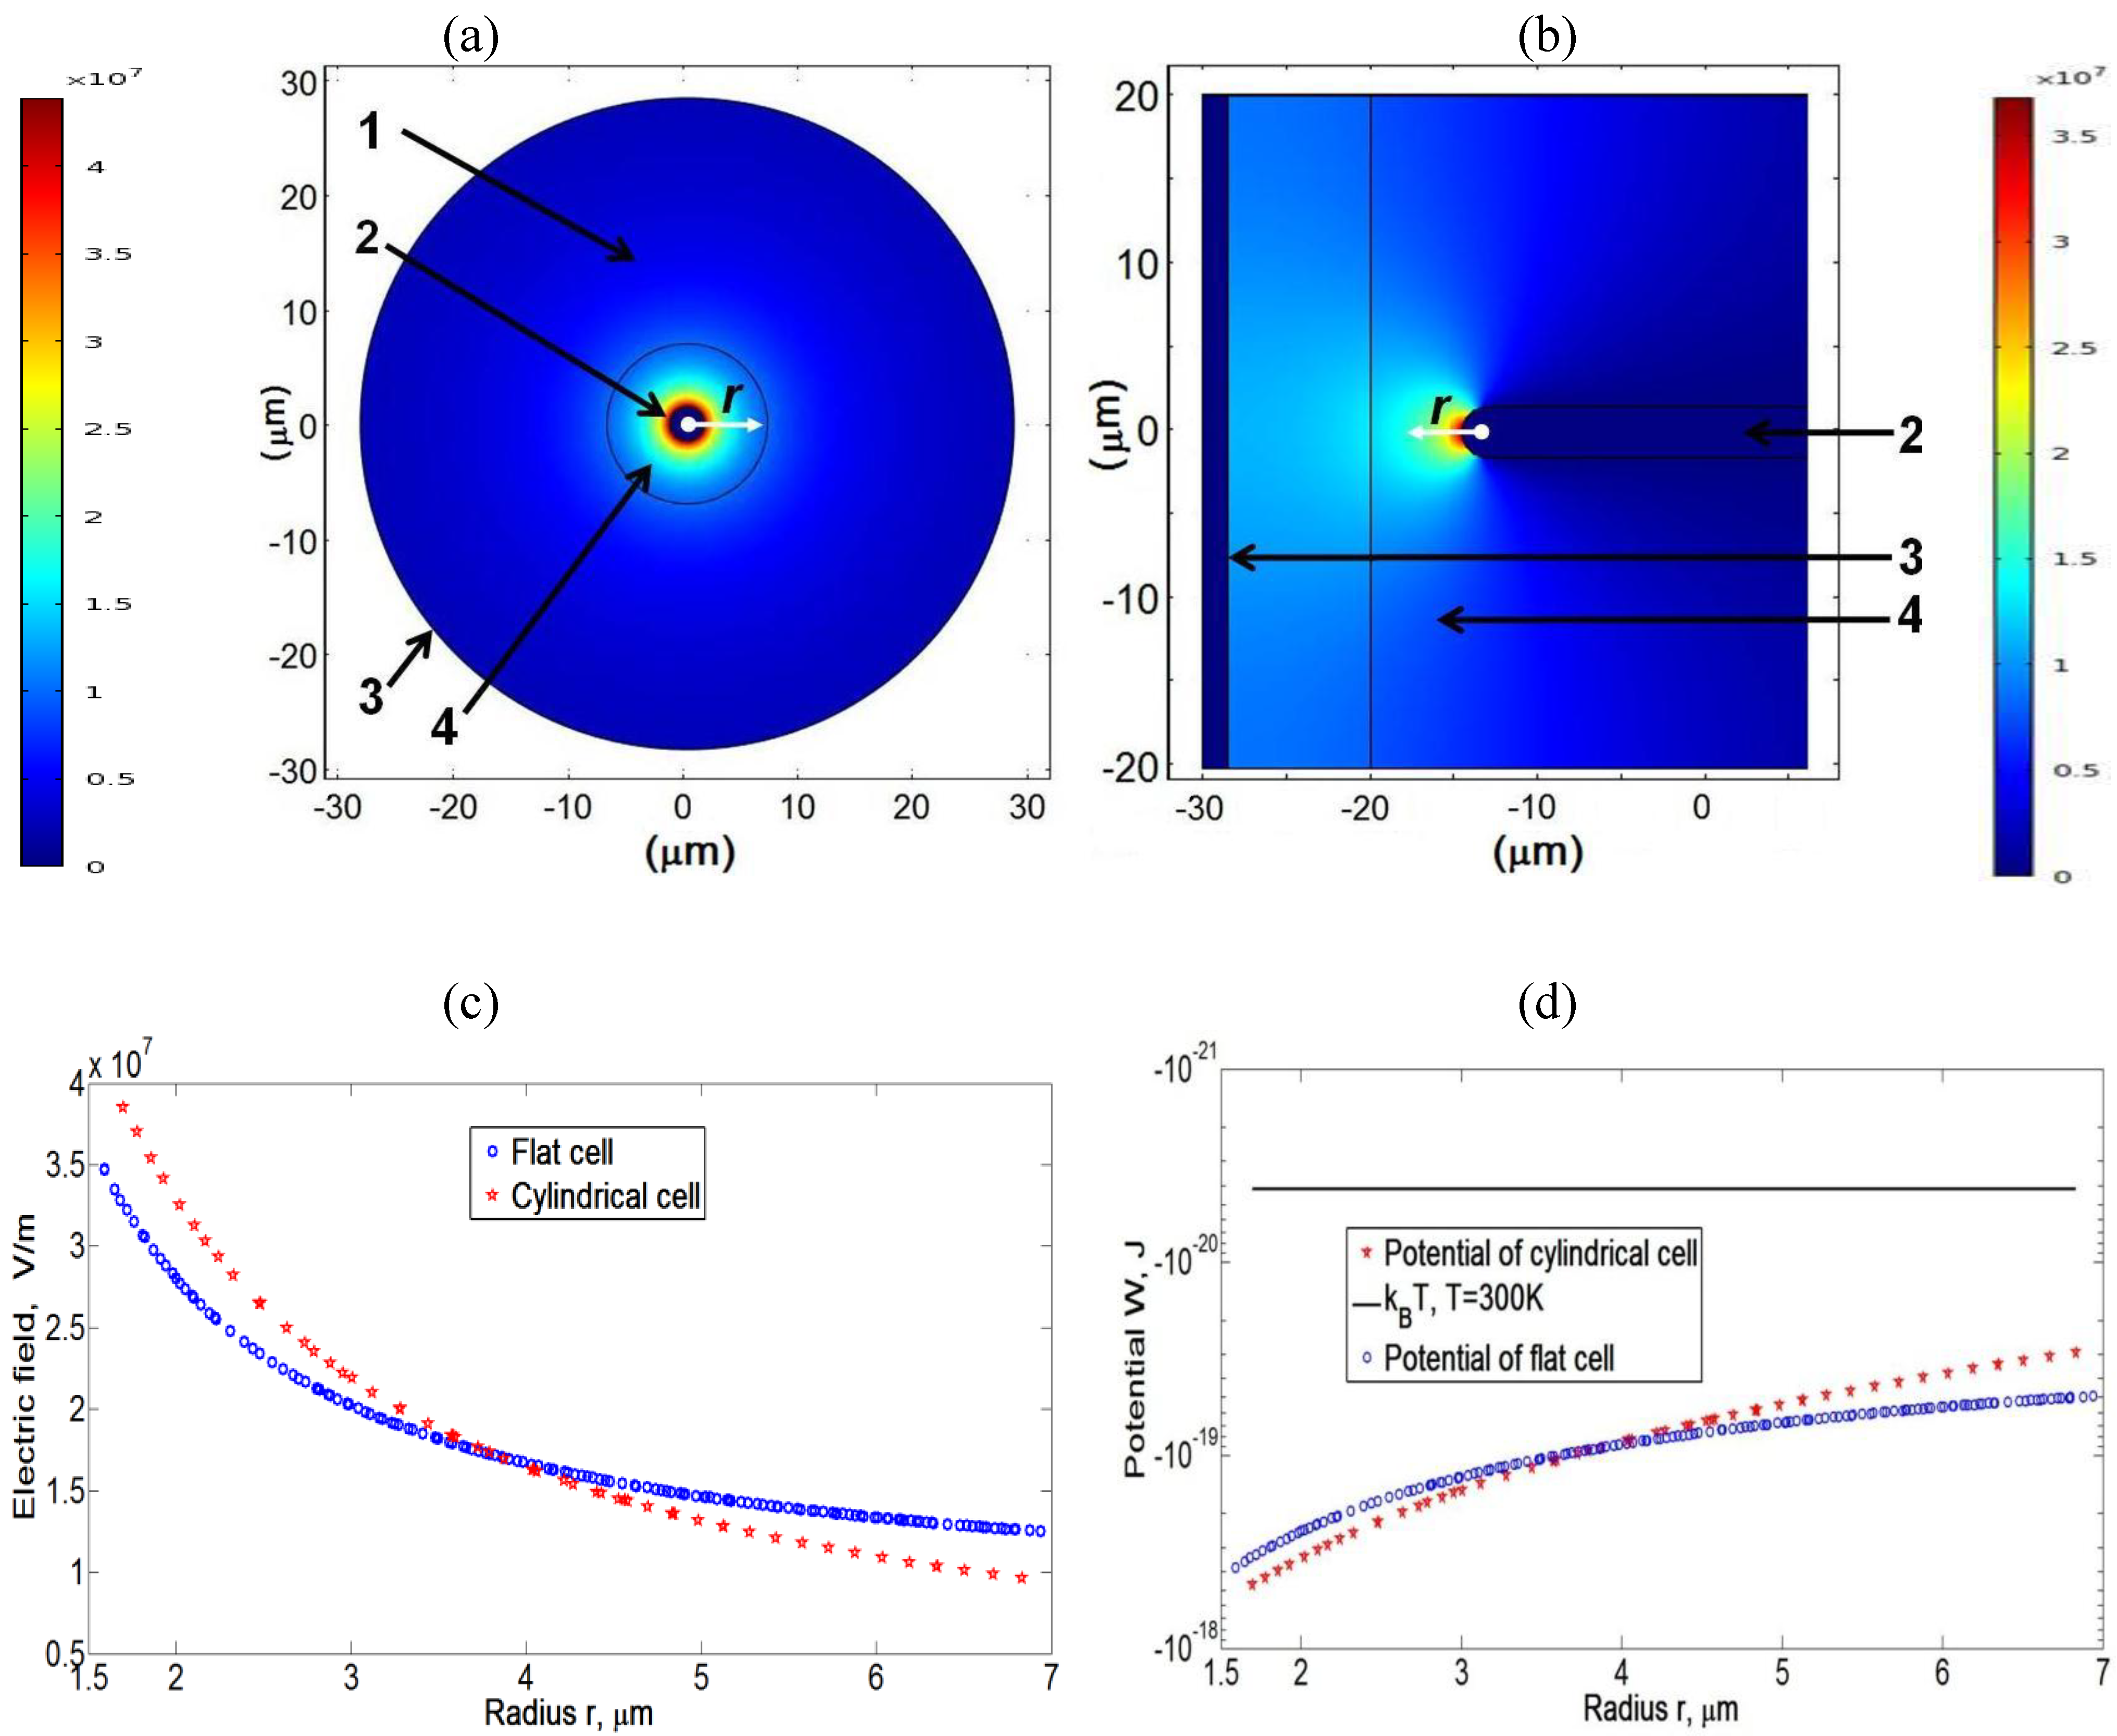
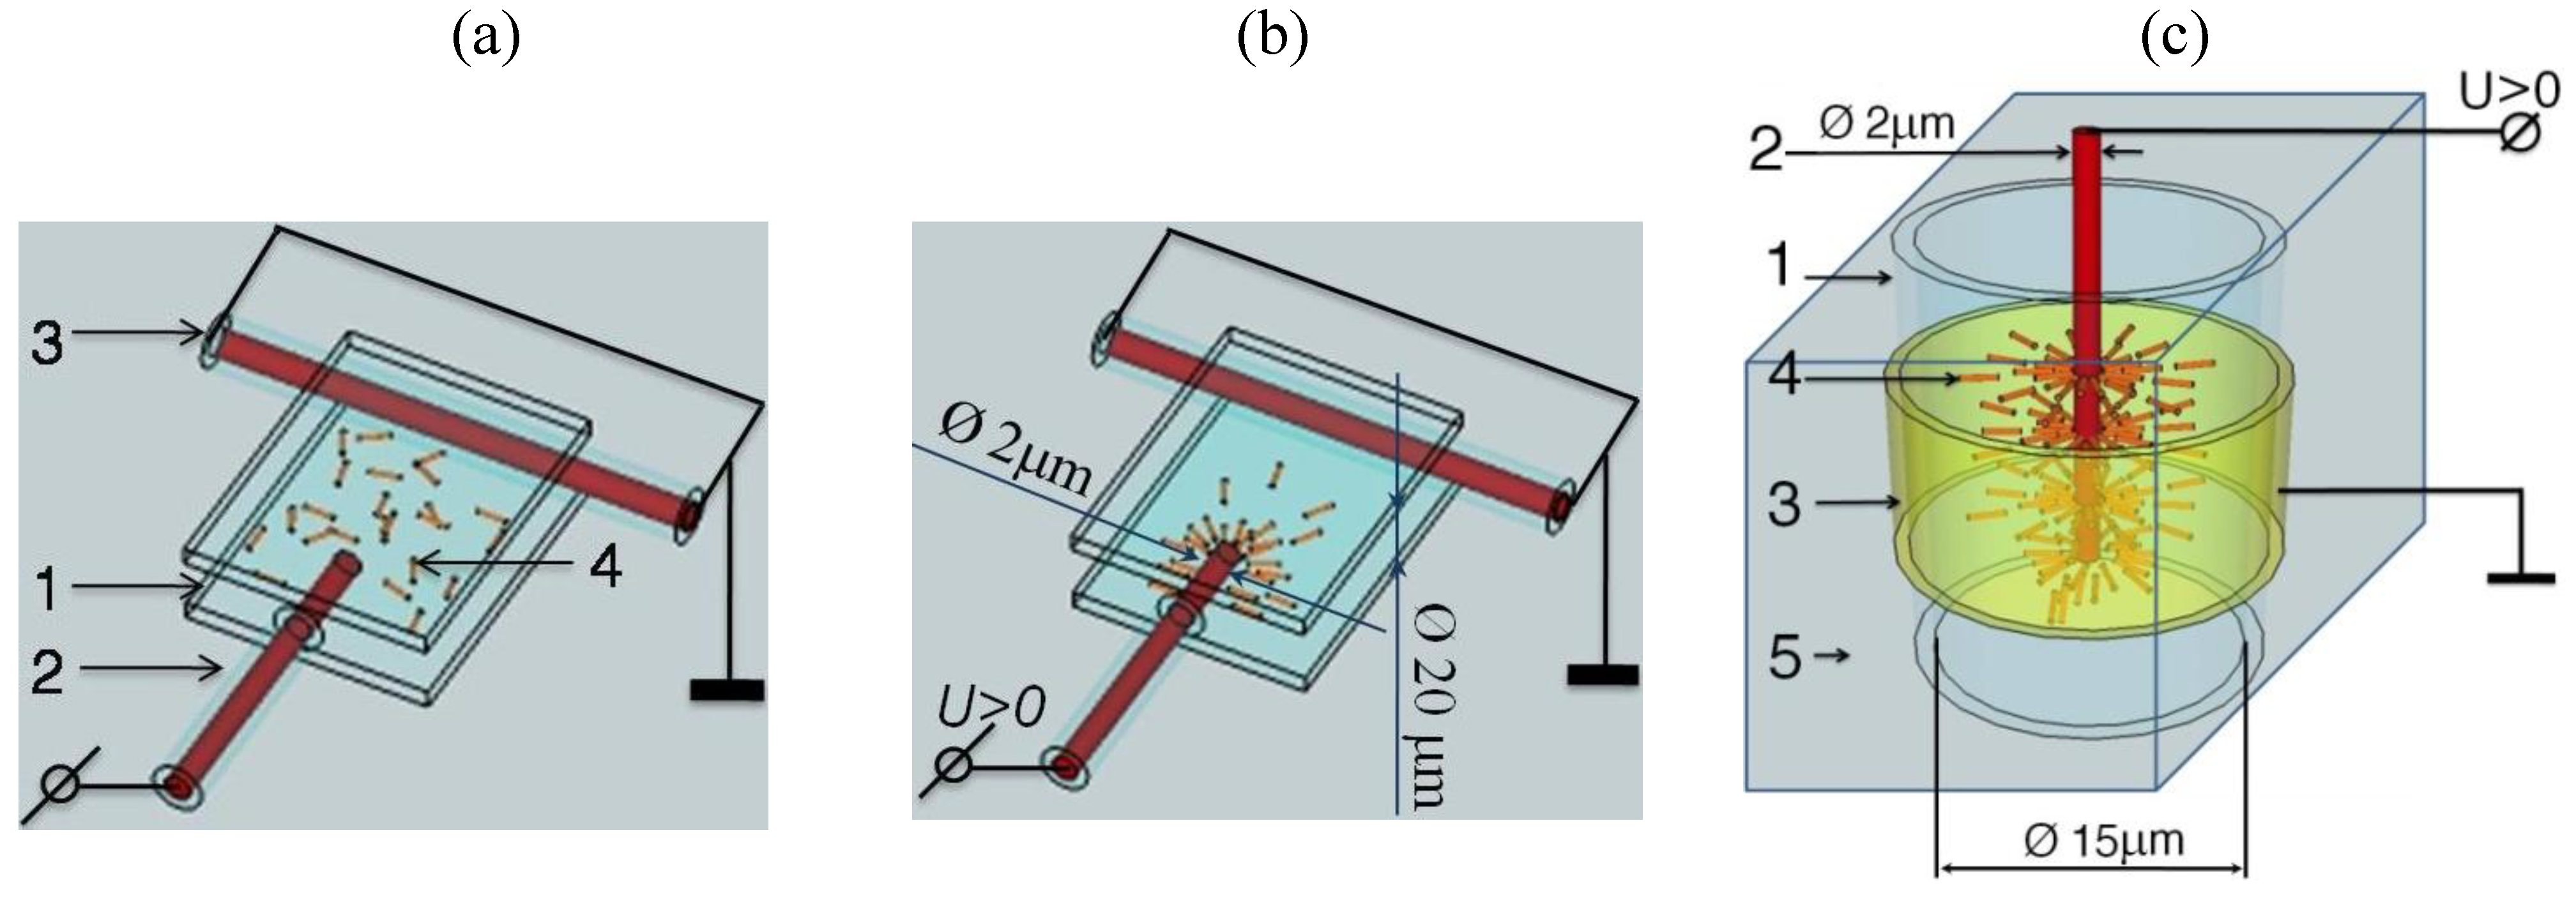
Figure 22(a) it is used to simulate the optical performance of the cylindrical cell. This approximation is justified by the fact that the geometries of gradient electric fields and the dielectrophoretic potentials in flat and cylindrical cells are similar,
Figure 3. Both parts of
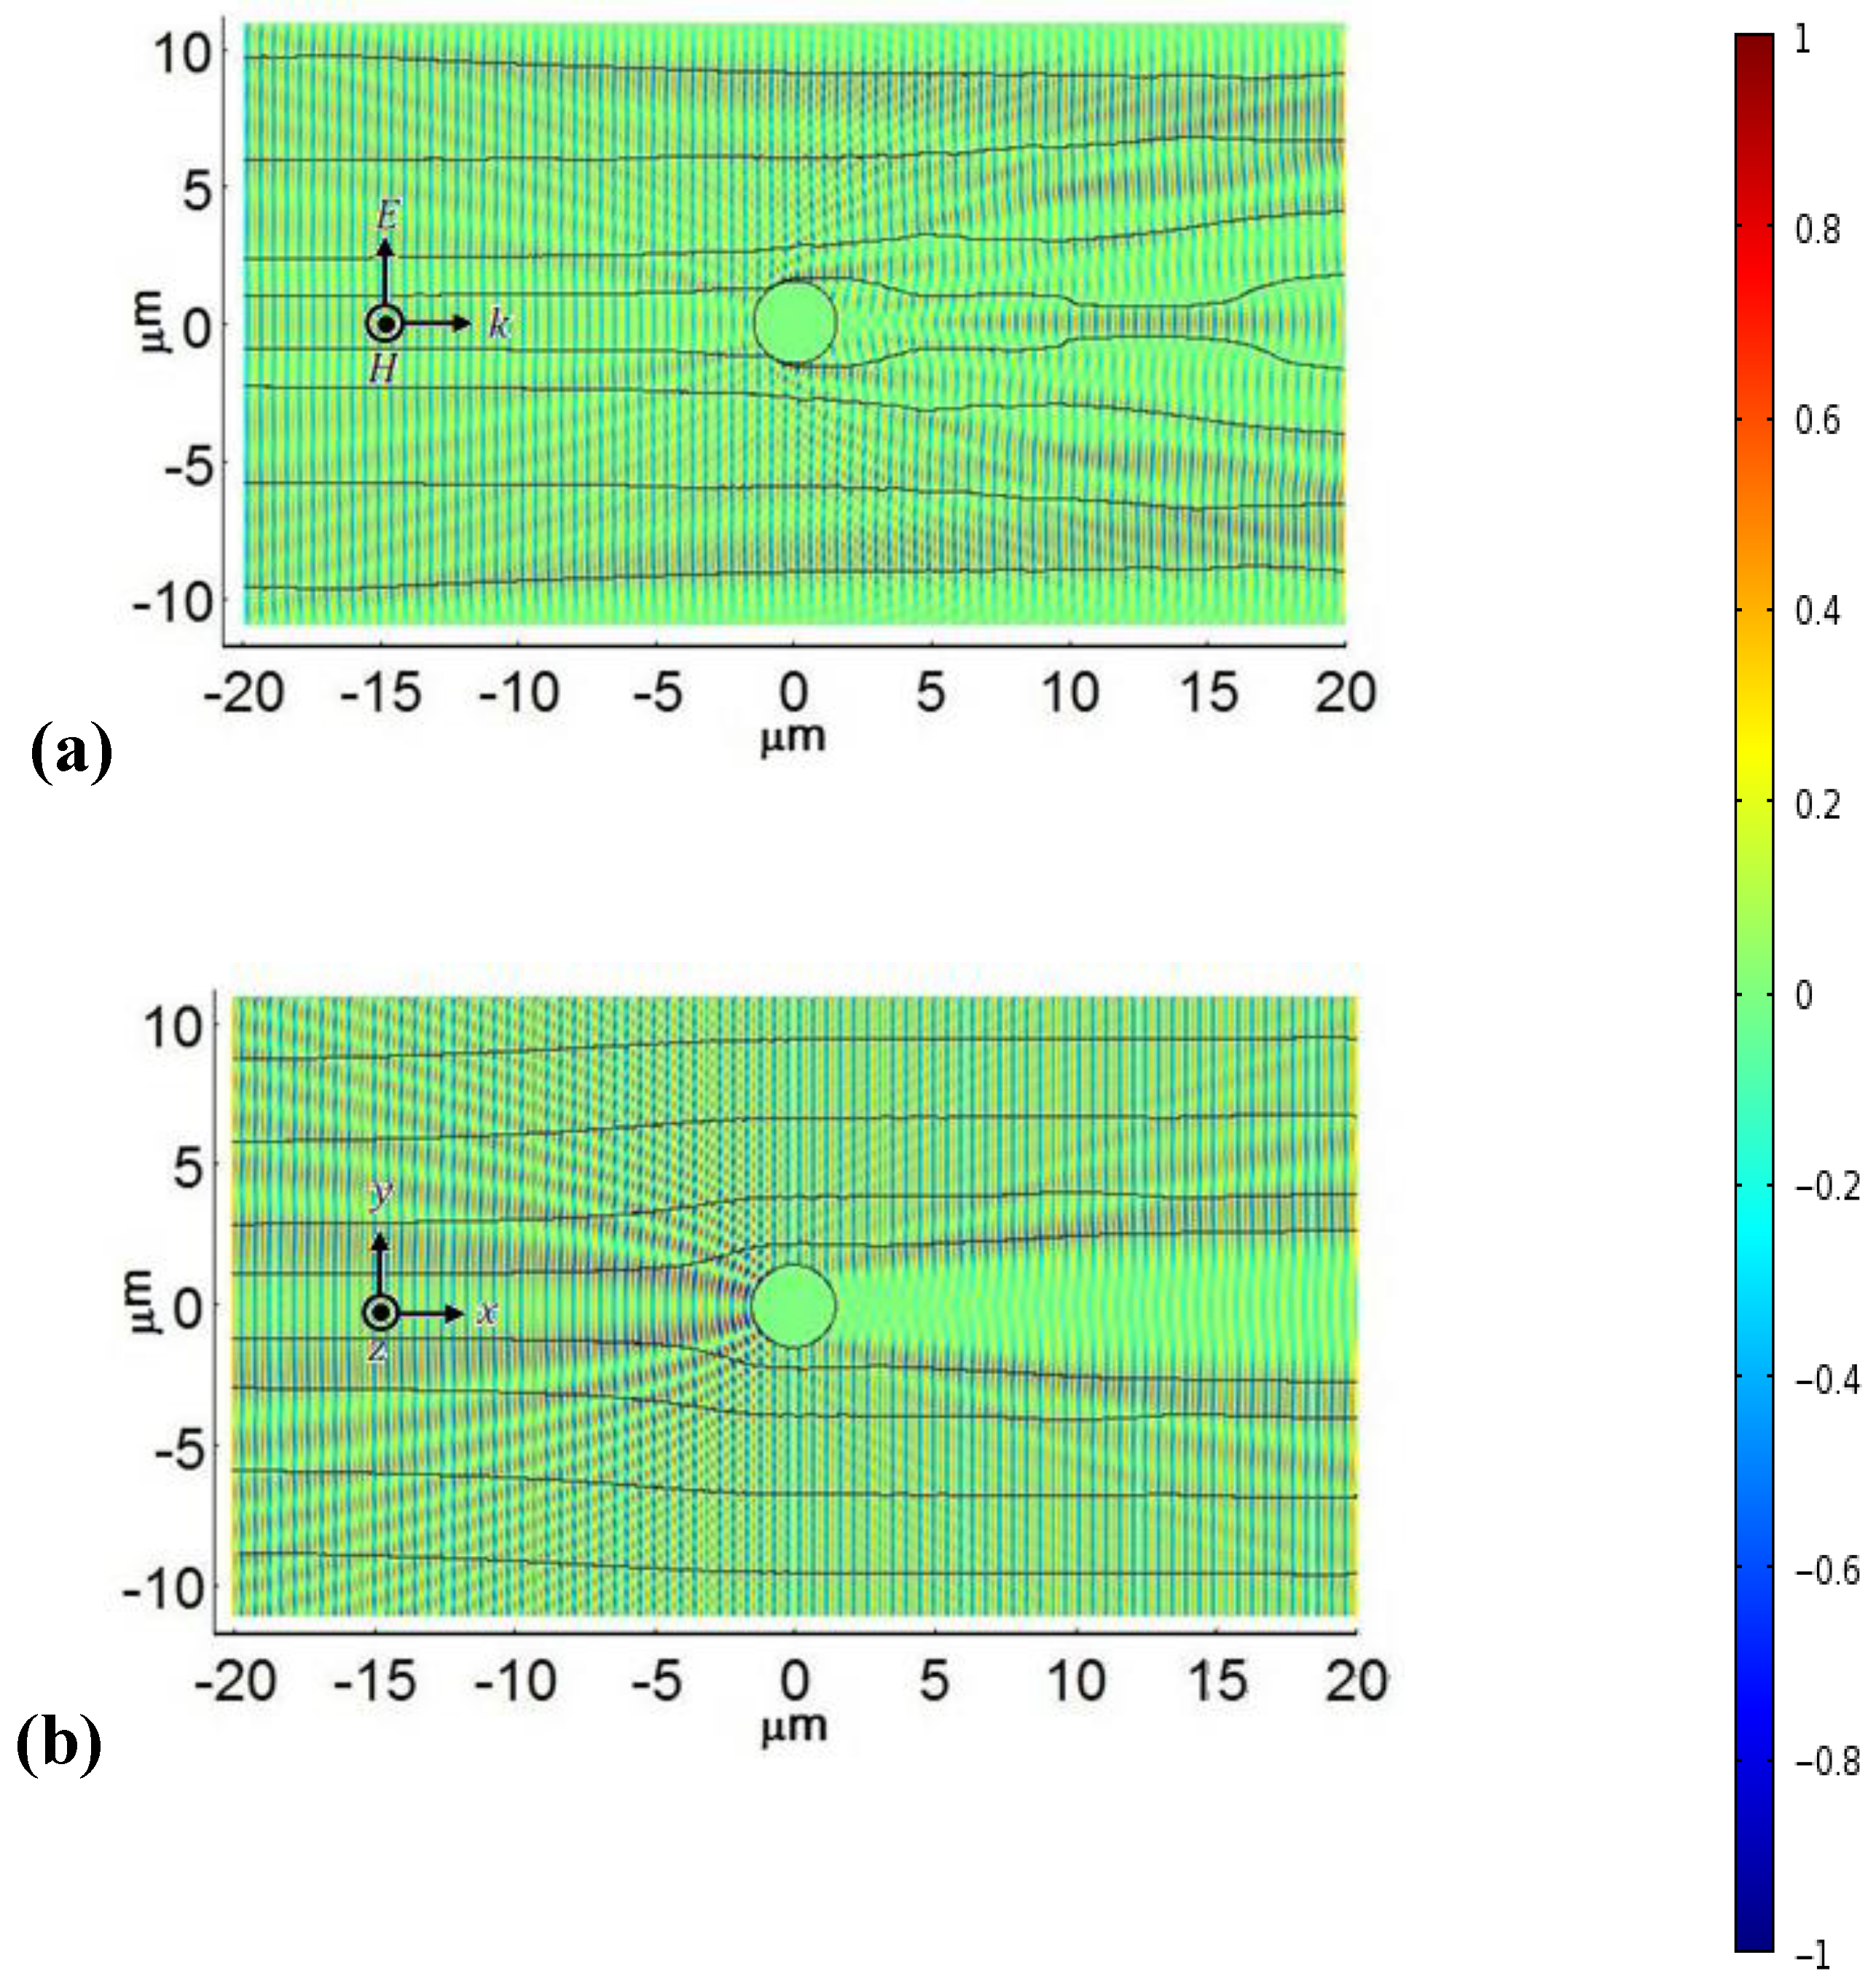
Figure 22 show the simulated magnetic-field component of the wave propagating throughout the cylindrical shell; the black trajectories show the power flow.
Figure 22 illustrates that when the electric field creates a cloud of Au NRs around the central electrode,
Figure 22(a), the shadow of this electrode is mitigated as compared to the case when the electric field is off and the Au NRs are distributed randomly in the cylindrical cavity,
Figure 22(b). The power flow near the electrode is bent towards the middle plane of the figure. The effect is the result of the reduced refractive index
near the central electrode. Of course, the decrease in
is modest, about 5% of what is used in the theoretical cloak [
12], so that the cloaking effect is far from being perfect. However, the very fact that the electric field gradients are capable of aligning and condensing Au NRs to the extent that the system acquires easily detectable optical anisotropy and variation of the refractive index is very encouraging for future developments of reconfigurable and switchable optical metamaterials based on dielectrophoretic effects in dispersions of NRs.
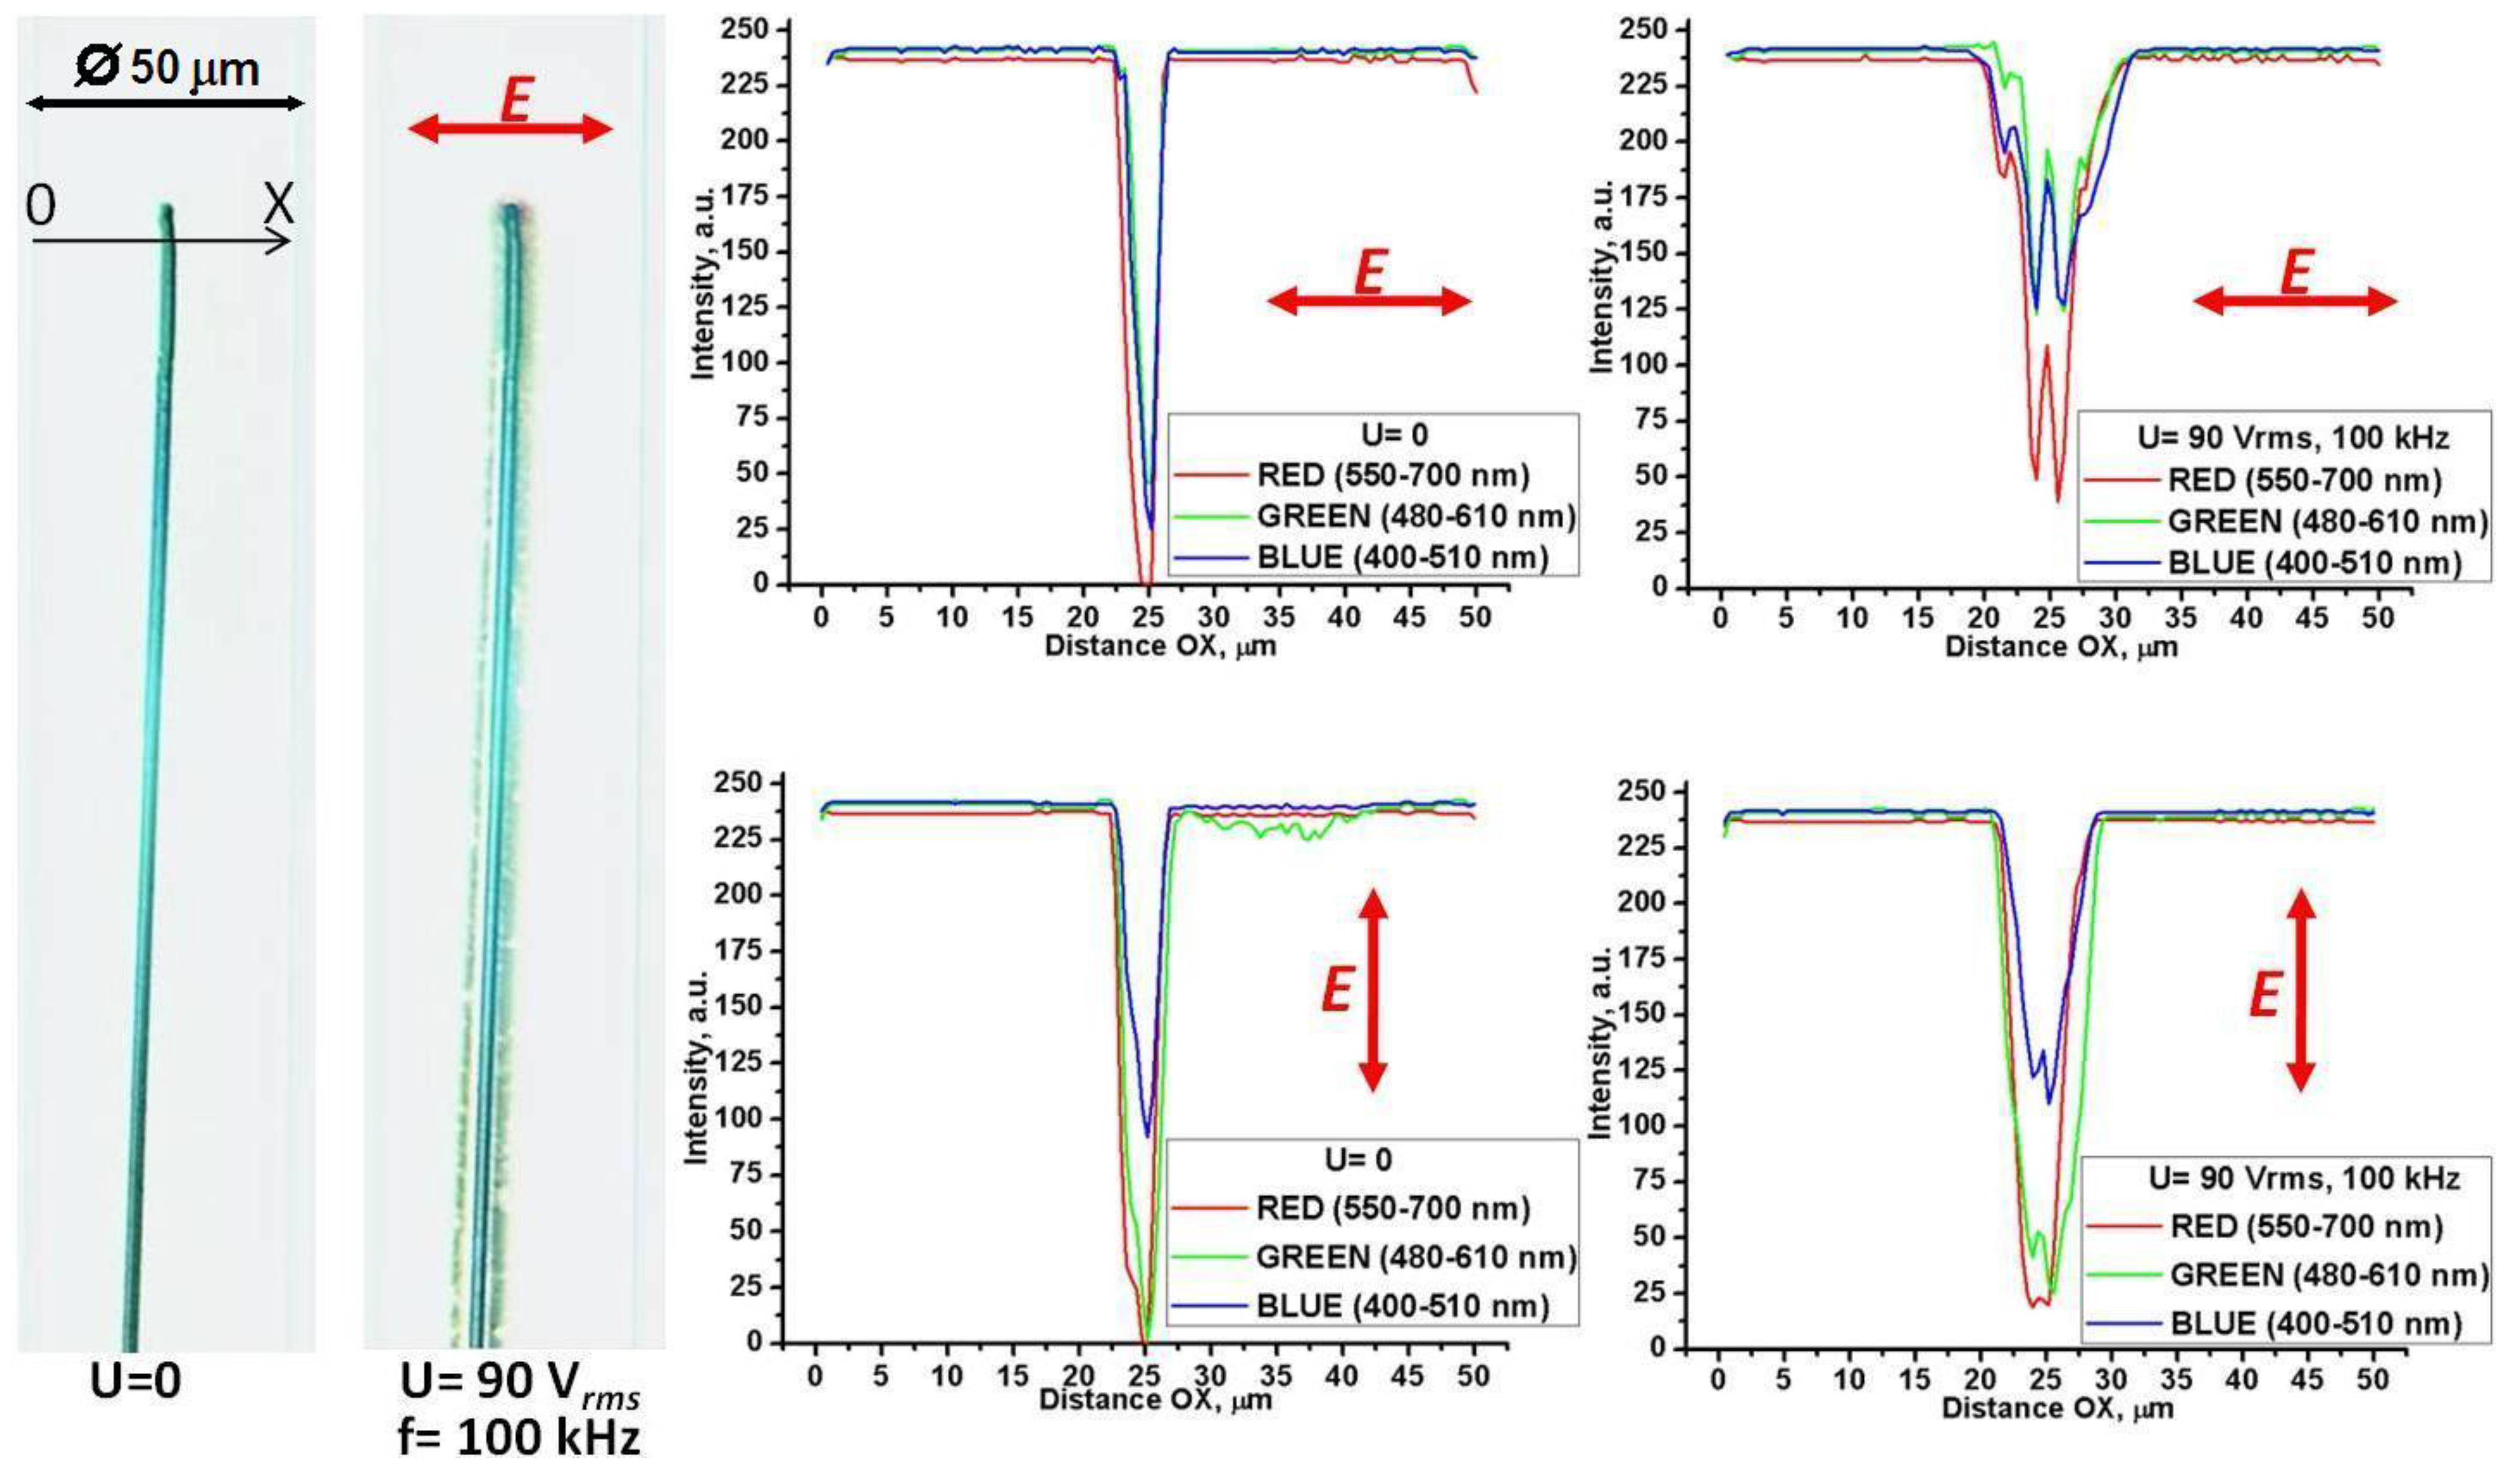
Figure 23 demonstrates a similar comparison of the “cloak on” and “cloak off” regimes when the light intensity is measured at some distance from the electrode, after the wave travelled to the right, about
from the electrode. The system parameters are the same as in
Figure 22. The plots show transmitted light intensity as a function of the vertical coordinate OY. All plots are normalized by the intensity of the incident TM plane wave. Note that light intensity in the centre of the expected shadow is much higher when the field is on as compared to the case when the field is off, reflecting the bending effect of the Au NRs clouds near the central electrode on the light trajectories. These simulated intensities are similar to the intensity profiles of the red component of RGB signal measured in the experiments with Au NRs,
Figure 13.
Figure 22.
Simulated light propagation in a cylindrical cell with TM illumination at . The applied voltage 200 Vrms induces the radial profile of the extraordinary refractive index around central electrode and bends the trajectories of power flow around the electrode, mitigating its shadow (a). At zero voltage, the cell has a spatially uniform refractive index (of toluene) and the electrode shadow is well pronounced (b). The color represents the amplitude of magnetic field; see the scale on the right hand side.
Figure 23.
Normalized intensities of incident TM plane wave before the central electrode (red stars), TM wave behind the central electrode with the electric field-induced variation of the extraordinary refractive index (empty blue dots), and TM wave behind the central electrode when the electric field is switched off (solid black line). In the center of shadow, near OY = 0, the light intensity in the “field on” case is higher than in the “field off” case.


