3.2.1. Single phase cubic Ti0.45Al0.55N
XRD patterns of c-Ti
0.45Al
0.55N in the as deposited state and after annealing to T
a are presented in
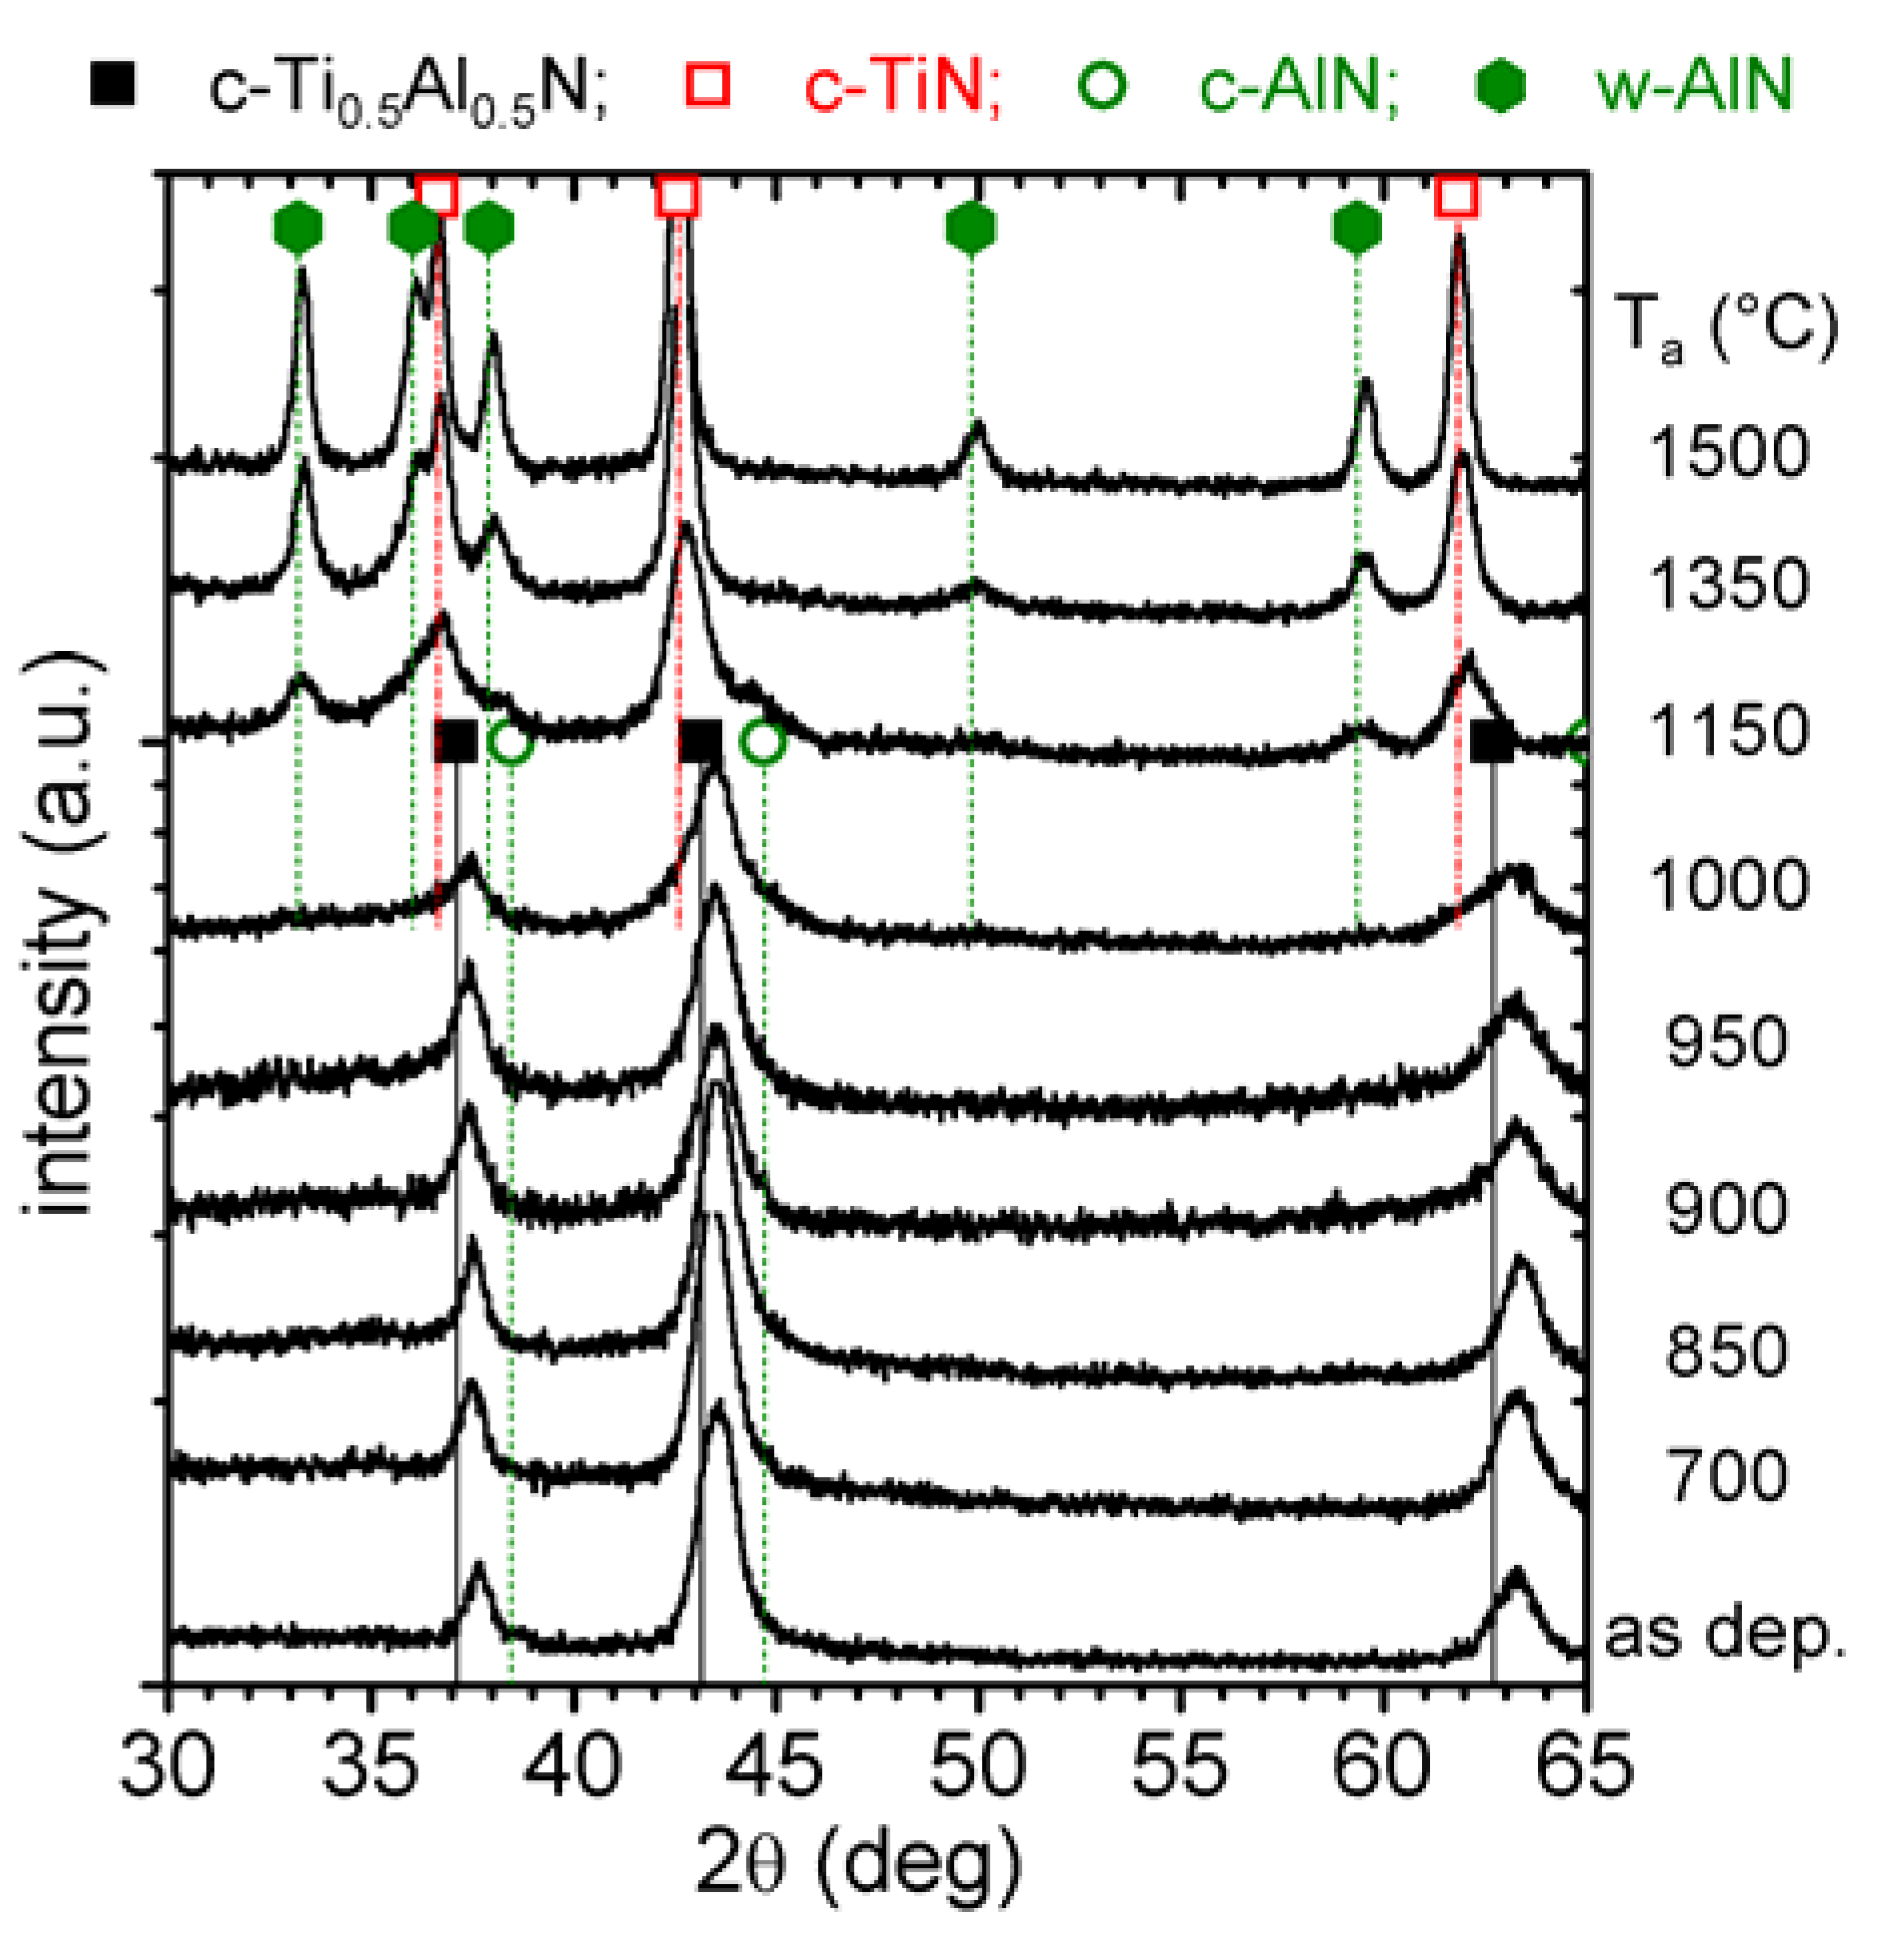
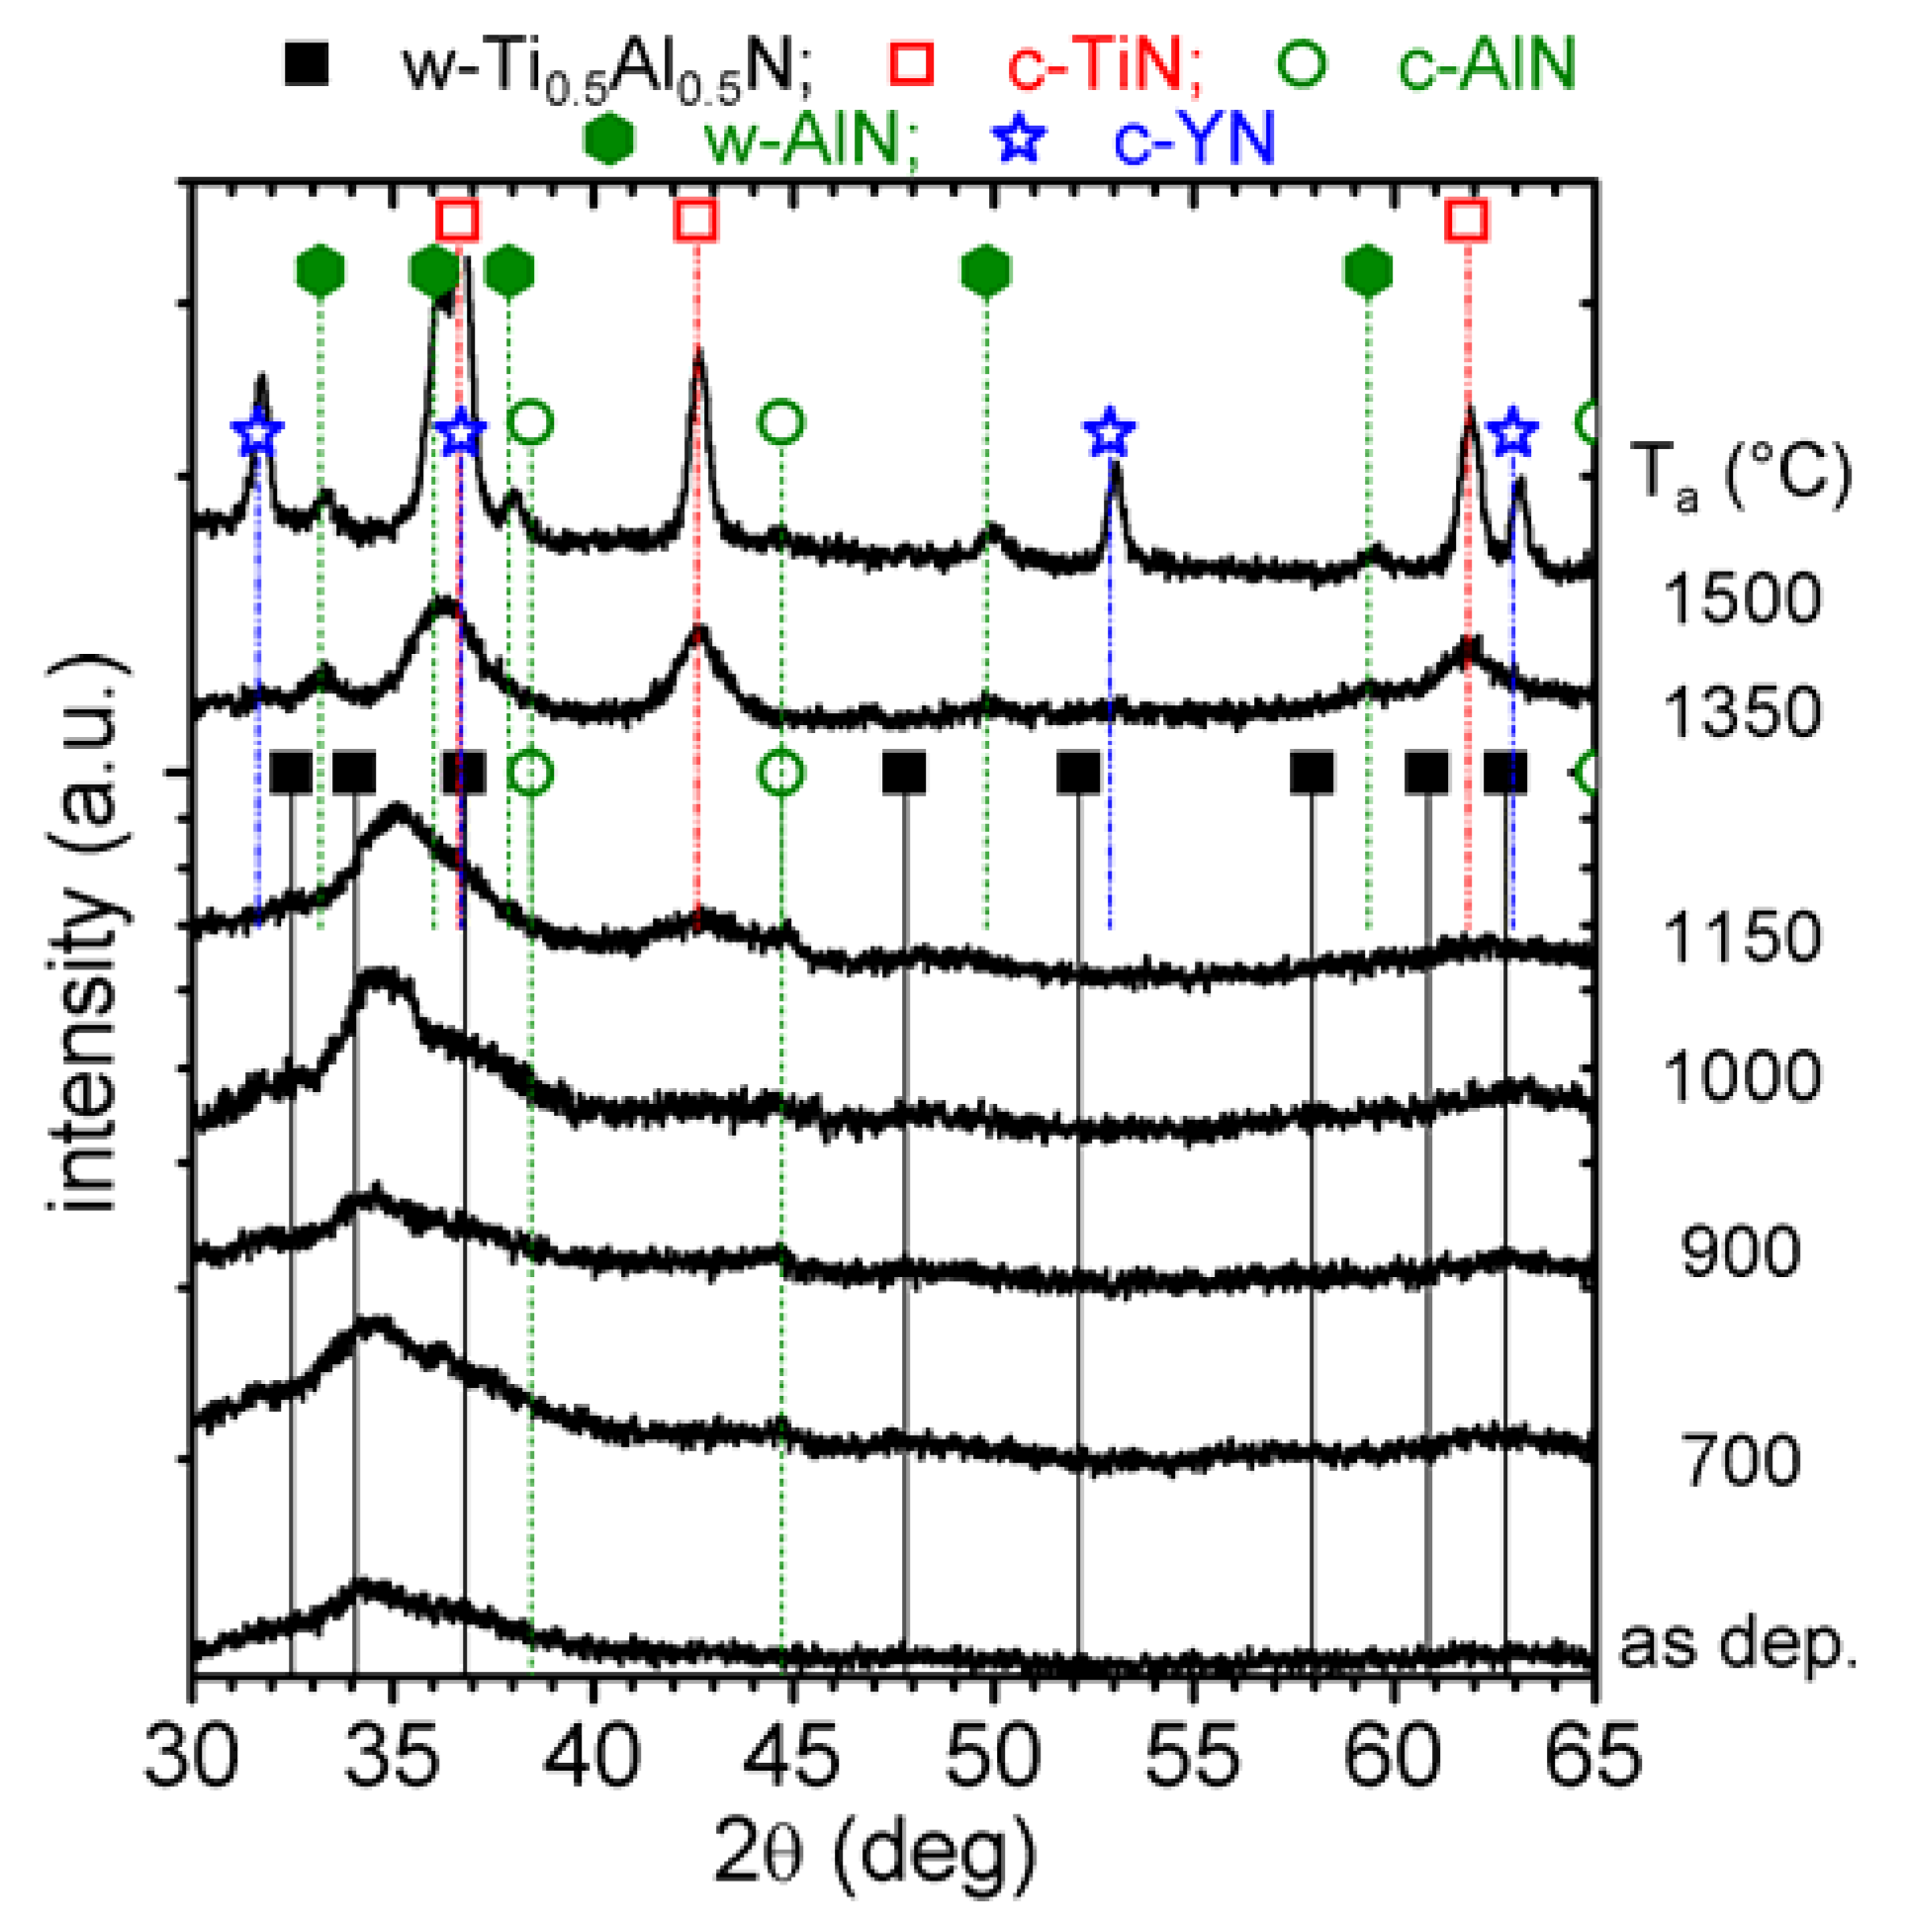
Figure 2. The as deposited film has a single cubic phase with a lattice parameter
a of ~4.178 Å [
26]. The XRD pattern obtained after annealing to 700 and 850 °C exhibit no major changes to the as deposited state with comparable 2θ positions, intensities, and widths of the XRD peaks. Therefore, the exothermic DSC feature in the temperature range 500−850 °C is attributed to recovery processes of deposition-induced defects, which generally result in stress relaxation as described in [
9,
11]. The XRD pattern of the 900 °C annealed coating reveals a decrease in peak intensities but an increase in peak broadening of the cubic Ti
1-xAl
xN reflexes. This indicates grain refinement and probably also an increase in microstresses due to spinodal decomposition [
16,
32].
Figure 2.
XRD evolution of c-Ti0.45Al0.55N (0 mol % YN) with annealing temperature Ta up to 1500 °C.
Figure 2.
XRD evolution of c-Ti0.45Al0.55N (0 mol % YN) with annealing temperature Ta up to 1500 °C.
In the Ti
1-xAl
xN system a characteristic sign for spinodal decomposition is a shoulder formation on both sides—
i.e., higher and lower diffraction angles—of the cubic matrix XRD reflections. This can especially be observed in the 2θ range 41–47 deg (around the (200) reflex), since here the individual standard positions of c-TiN, c-AlN, and w-AlN do not interfere, see
Figure 2. After annealing to 900 °C, the XRD patterns exhibit these shoulders on both sides of the cubic reflexes and hence they provide a clear evidence for spinodal decomposition of the cubic Ti
0.45Al
0.55N solid-solution, as proven by various calculations and experiments [
6,
11,
16,
32]. A broad x-ray diffraction response in the 2θ range 32−36 deg indicates the formation of the wurtzite phases.
When the coating is further annealed, the cubic solid-solution matrix XRD reflexes decrease in intensity and shift to lower 2θ diffraction angles (which can especially be seen for the peak at ~63 deg) for temperatures > 950 °C. Simultaneously, the shoulders on both sides of the cubic matrix peak, indicating the formation of cubic Al- and Ti-rich domains, become more pronounced. The XRD pattern of the coatings after annealing at 1000 °C clearly shows this shoulder formation, i.e., the spinodal decomposition.
After annealing the coating to 1150 °C, strong reflexes for c-TiN and w-AlN can be detected by XRD at the expense of the cubic solid-solution matrix. In addition, the XRD pattern exhibits evidence for remaining c-AlN phases at this annealing stage. The XRD pattern of the 1350 and 1500 °C annealed samples reveal a fully decomposed microstructure, where the individual peaks fit to c-TiN and w-AlN, only traces of c-AlN can be detected. In addition, the XRD peaks sharpened, indicating the growth of the recrystallized grains and change in texture.
The morphological changes in c-Ti
0.45Al
0.55N due to the annealing treatment and the observed structural changes were investigated by TEM, see
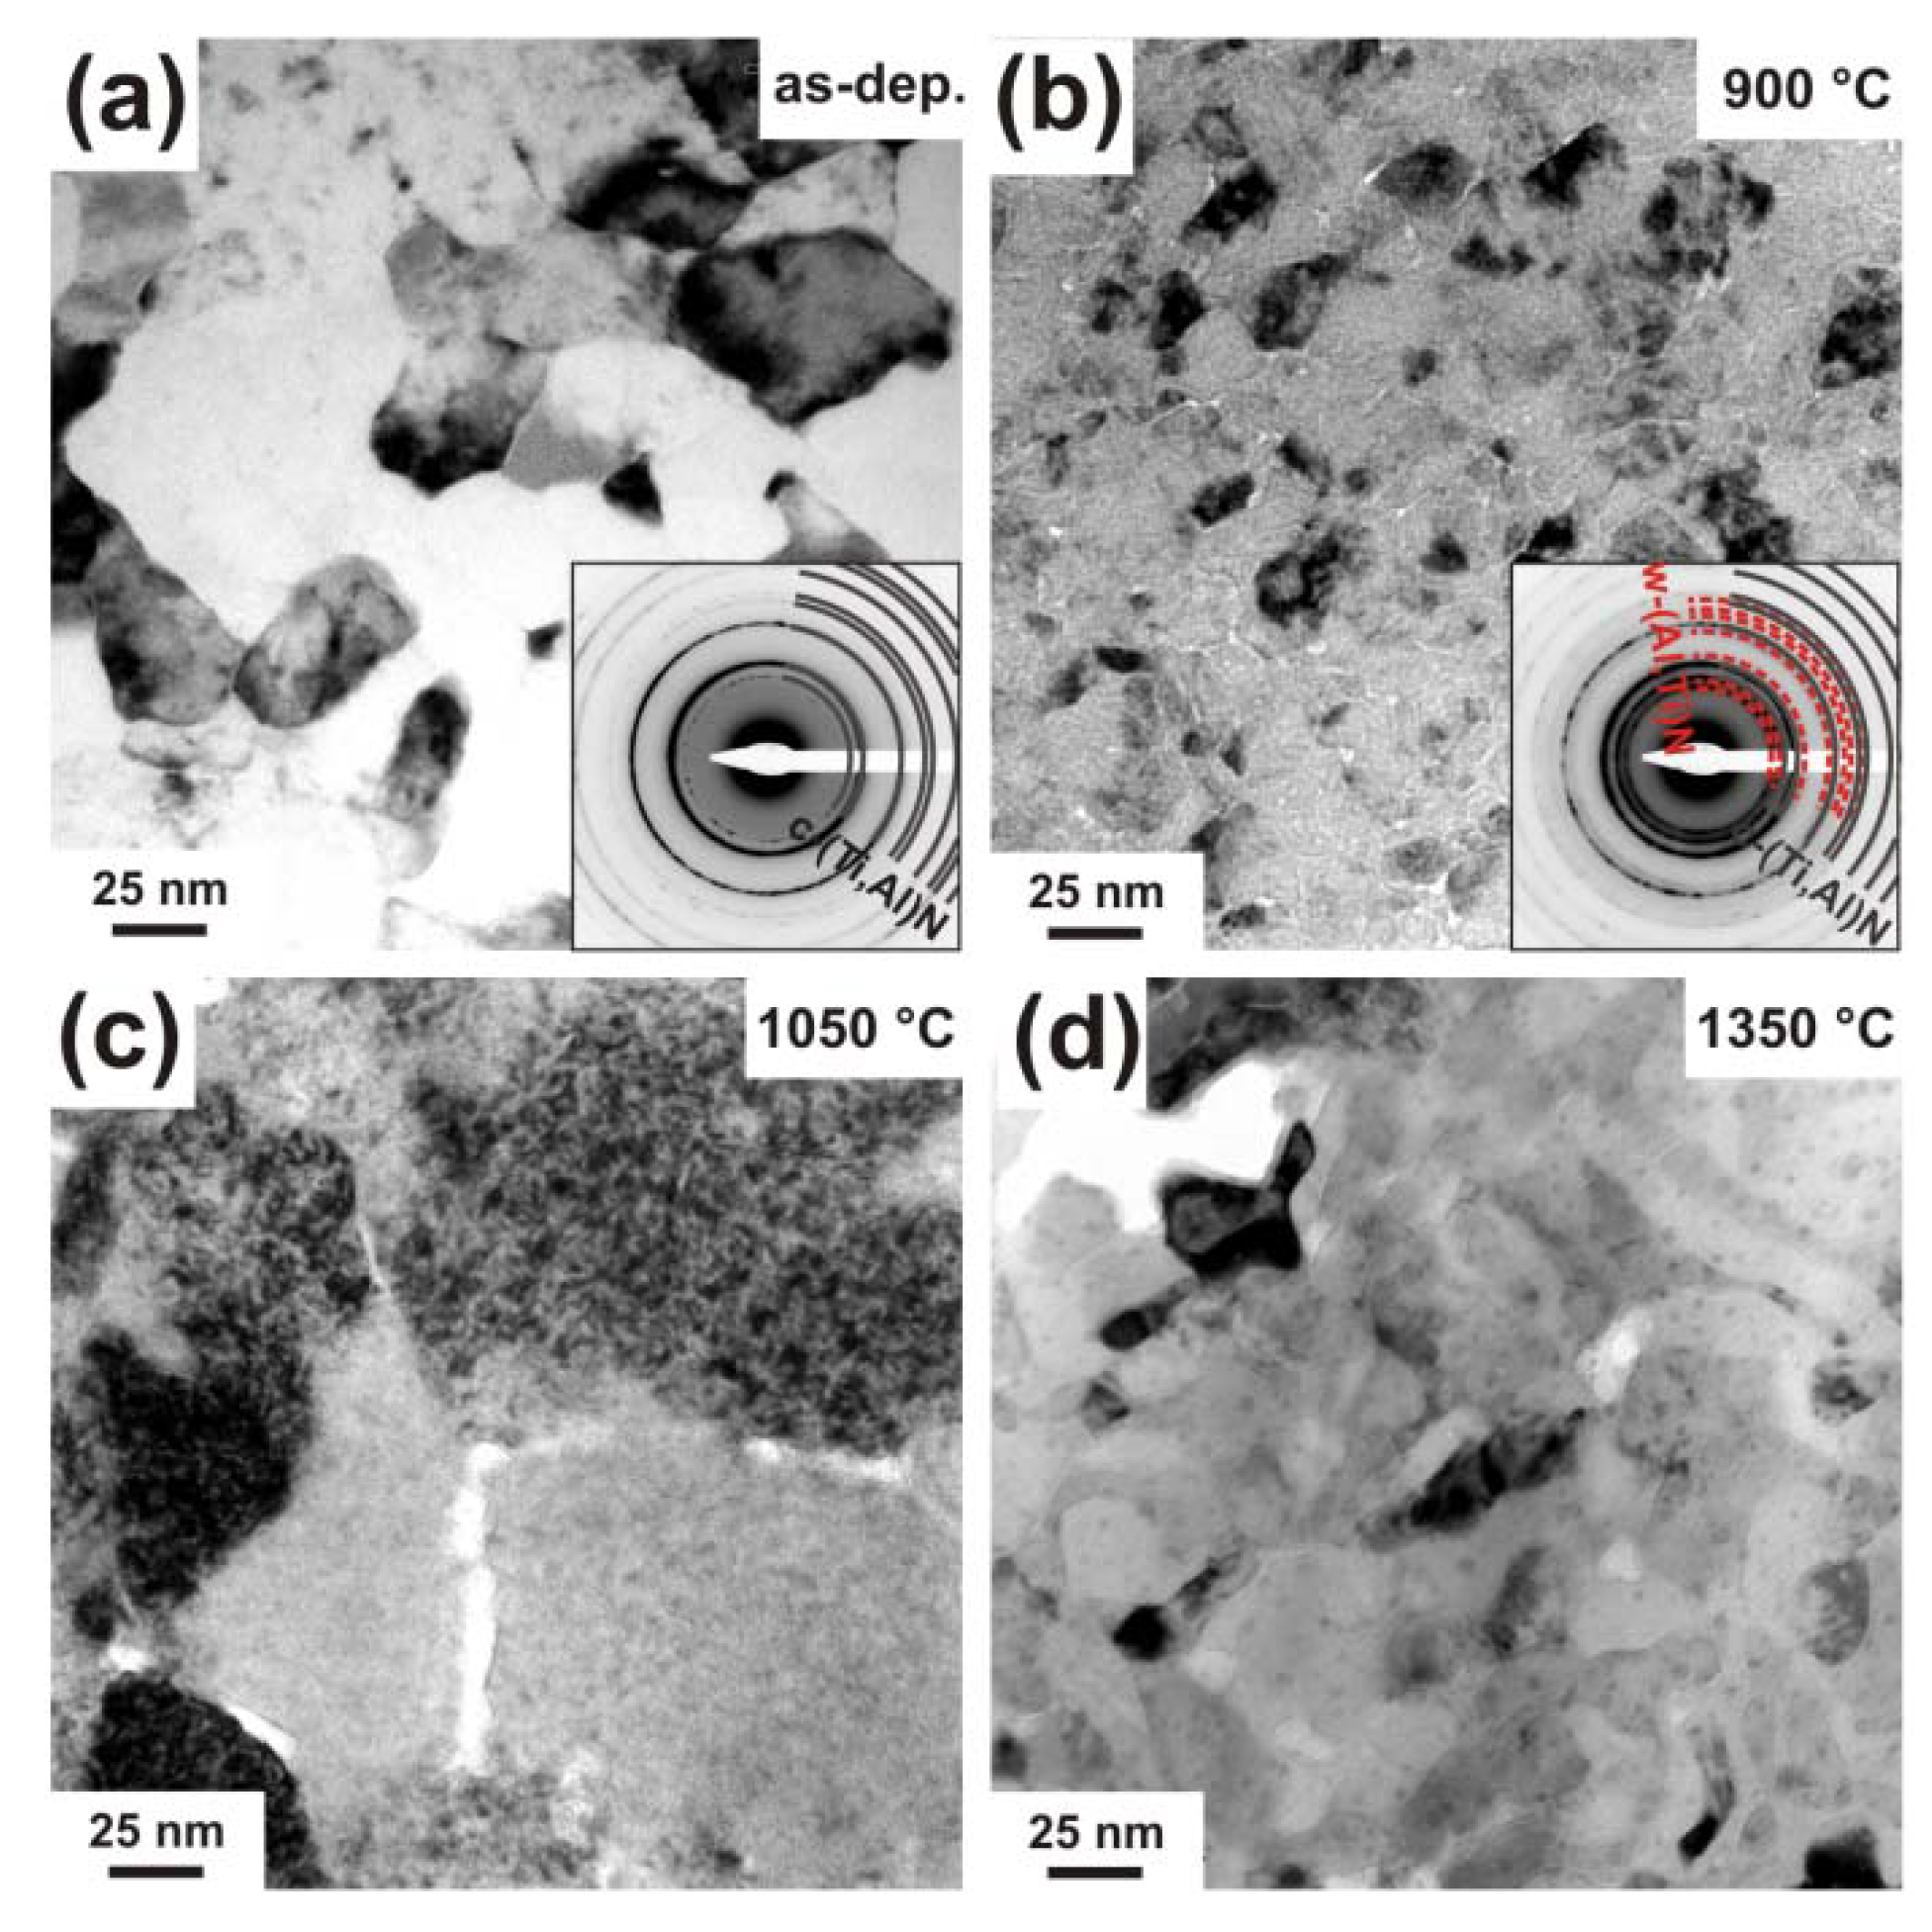
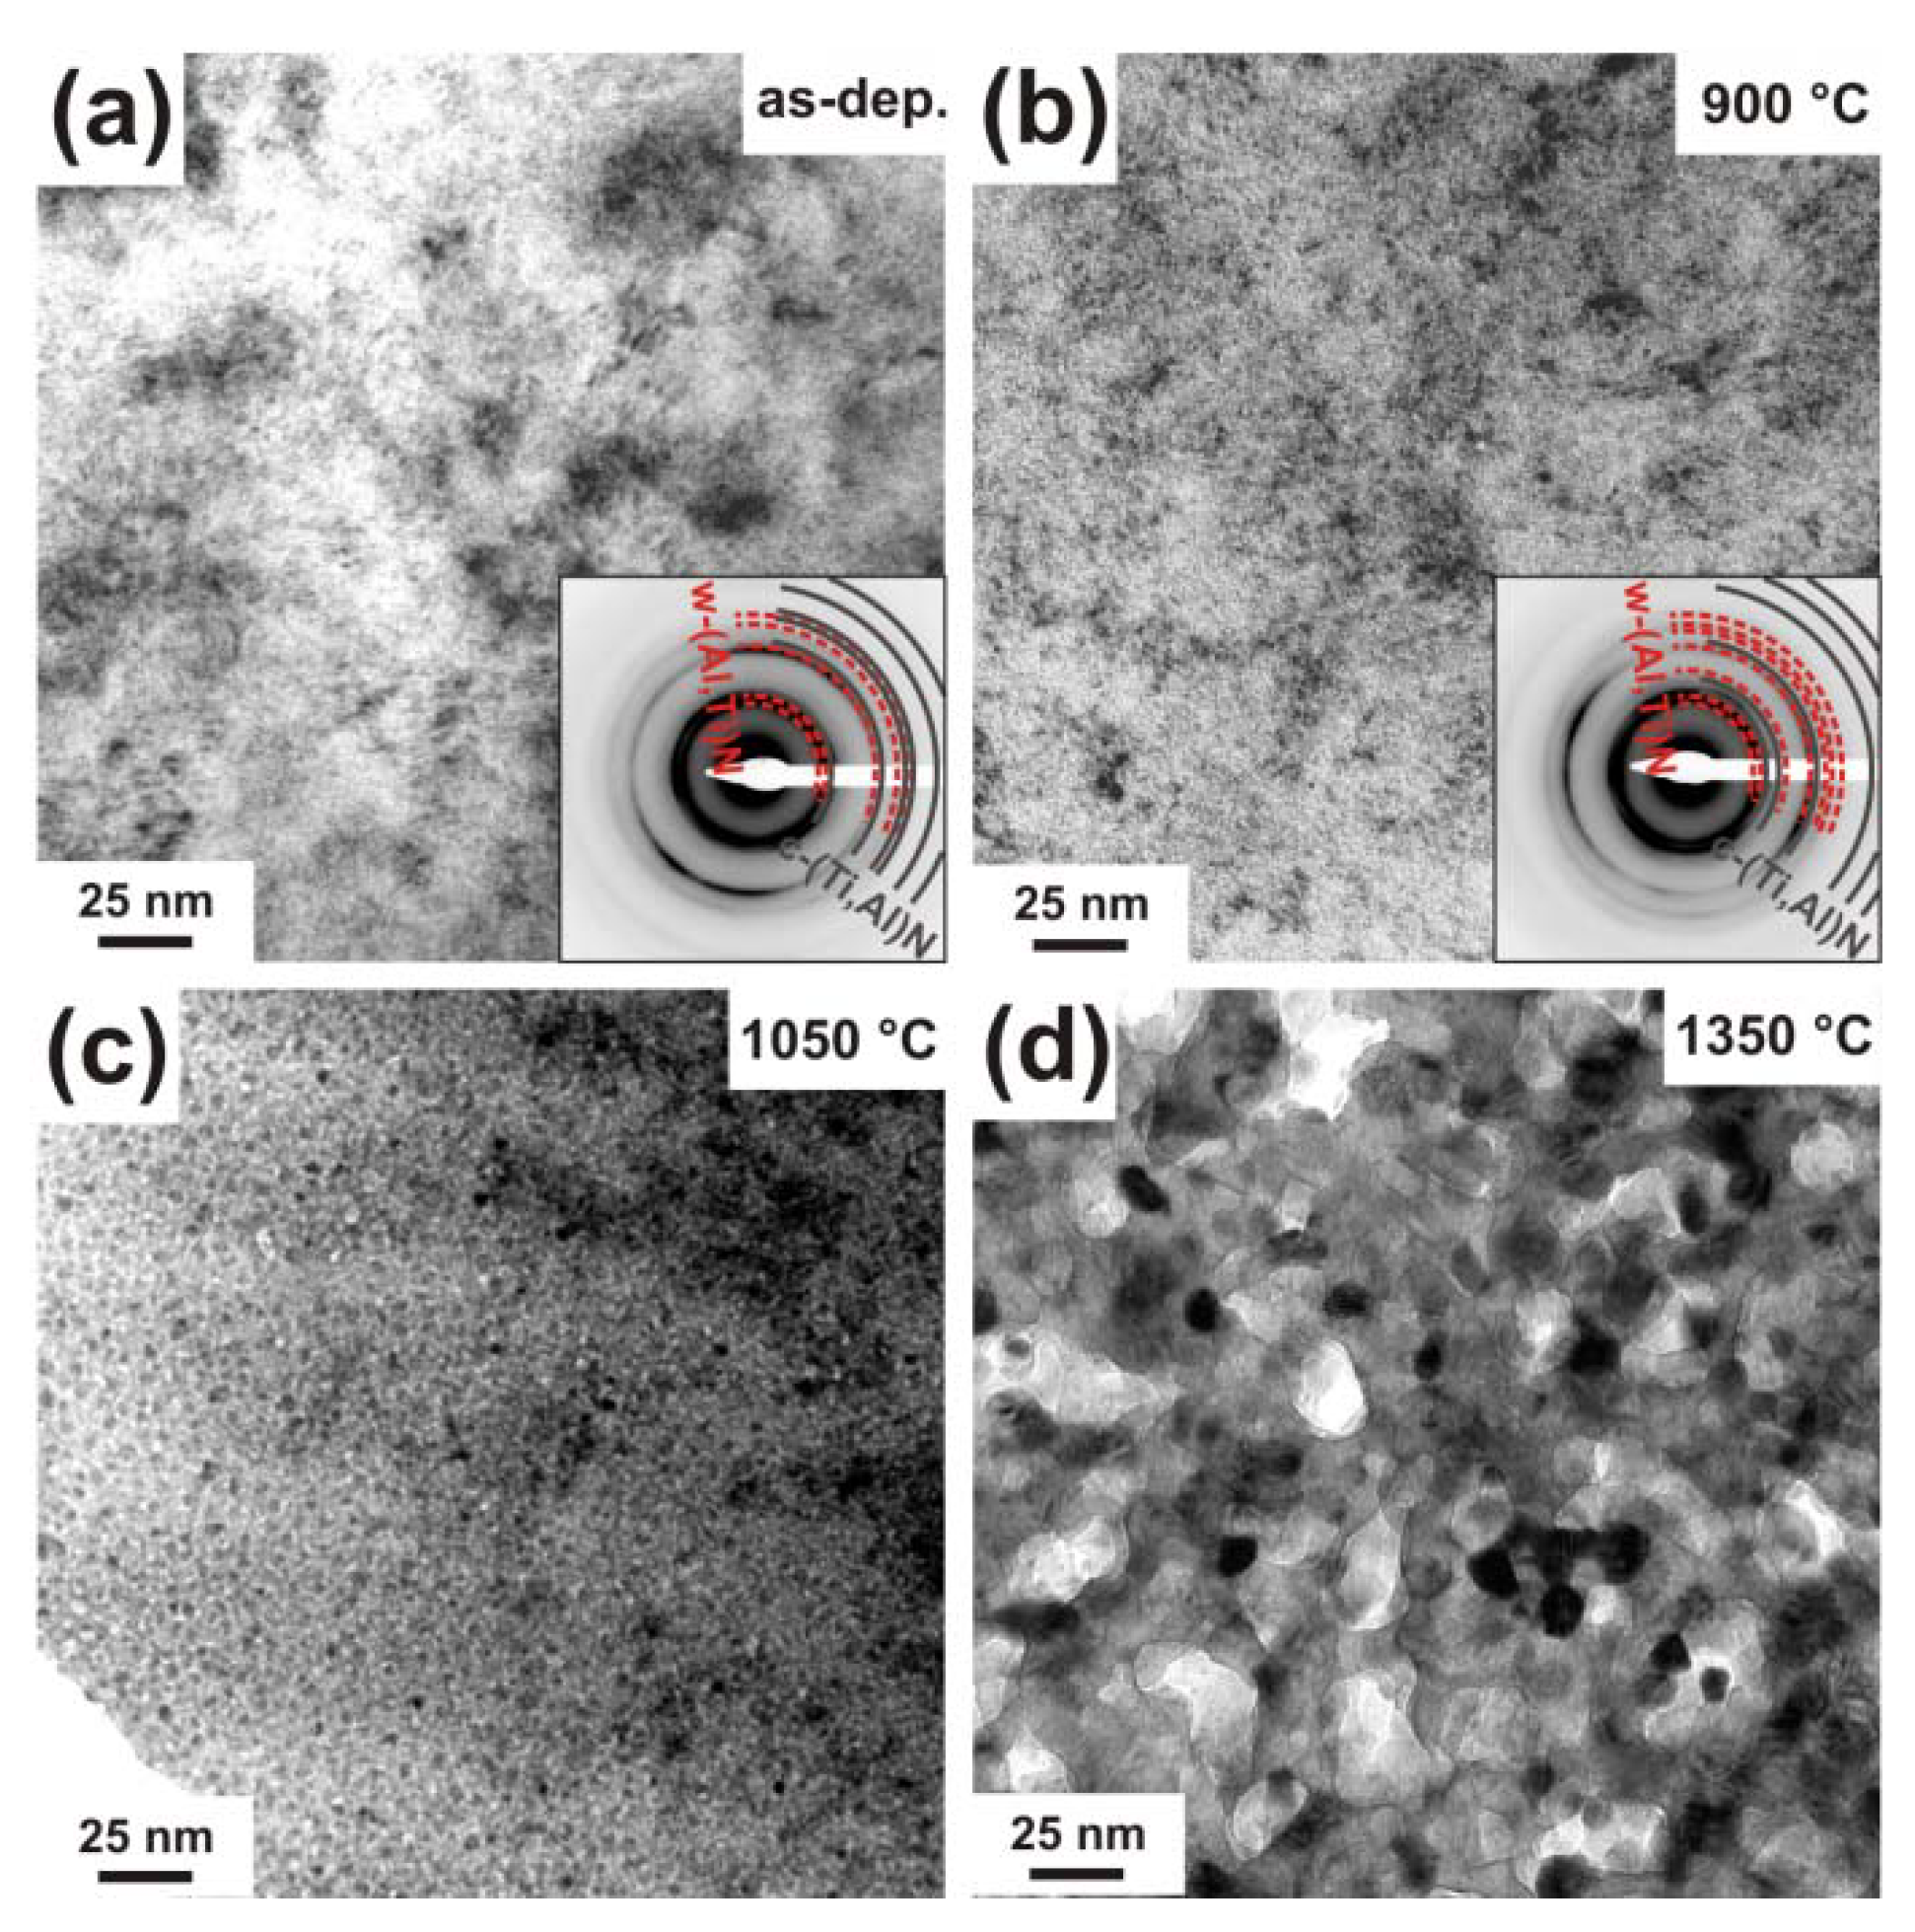
Figure 3. The as deposited film (
Figure 3a) has a dense columnar microstructure (as proven by earlier studies, see [
26,
27]) with relatively large column diameters of ~100 nm, and the corresponding selected area electron diffraction pattern (SAED, inset in
Figure 3a) confirms the single-phase cubic structure observed by XRD. TEM investigations of the coating after annealing to 900 °C,
Figure 3b, suggest an average grain size of ~30 nm. In a recent investigation on the thermal decomposition of Ti
1-xAl
xN by atom probe tomography, clustering of Al-rich and Al-depleted Ti
1-xAl
xN solid-solution areas within the c-Ti
1-xAl
xN matrix grains was observed after annealing to 900 °C [
19]. In addition to these results, we showed that the spinodal decomposition to form alternating Al- and Ti-rich domains can also be connected with the formation of an incoherent, wurtzite AlN-rich phase at the grain boundary.
Figure 3.
Plan view TEM micrographs of c-Ti0.45Al0.55N in the (a) as deposited state and after annealing to (b) 900 °C, (c) 1050 °C, and (d) 1350 °C. The small insets in (a) and (b) show their corresponding SAED patterns.
Figure 3.
Plan view TEM micrographs of c-Ti0.45Al0.55N in the (a) as deposited state and after annealing to (b) 900 °C, (c) 1050 °C, and (d) 1350 °C. The small insets in (a) and (b) show their corresponding SAED patterns.
The TEM investigation of a sample annealed to 1050 °C (
Figure 3c) reveals a microstructure composed of domains with ~150 nm in diameter and a grain boundary phase with >10 nm in thickness. The recrystallized coating structure after annealing at 1350 °C is shown in the TEM plan-view micrograph in
Figure 3d. The image exhibits an interlinked network of >100 nm sized elongated, vermicular shaped grains and <10 nm sized precipitates within the domains. Such interconnected microstructures are typical for spinodally decomposed materials and are described in literature theoretically and experimentally [
33,
34,
35]. A corresponding interlinked three-dimensional network has recently been presented by atom probe investigations of 1350 °C annealed Ti
1-xAl
xN [
19]. The decrease in grain size from the 1050 °C annealed sample to the 1350 °C annealed sample is due to the formation of new phases, compare
Figure 2.
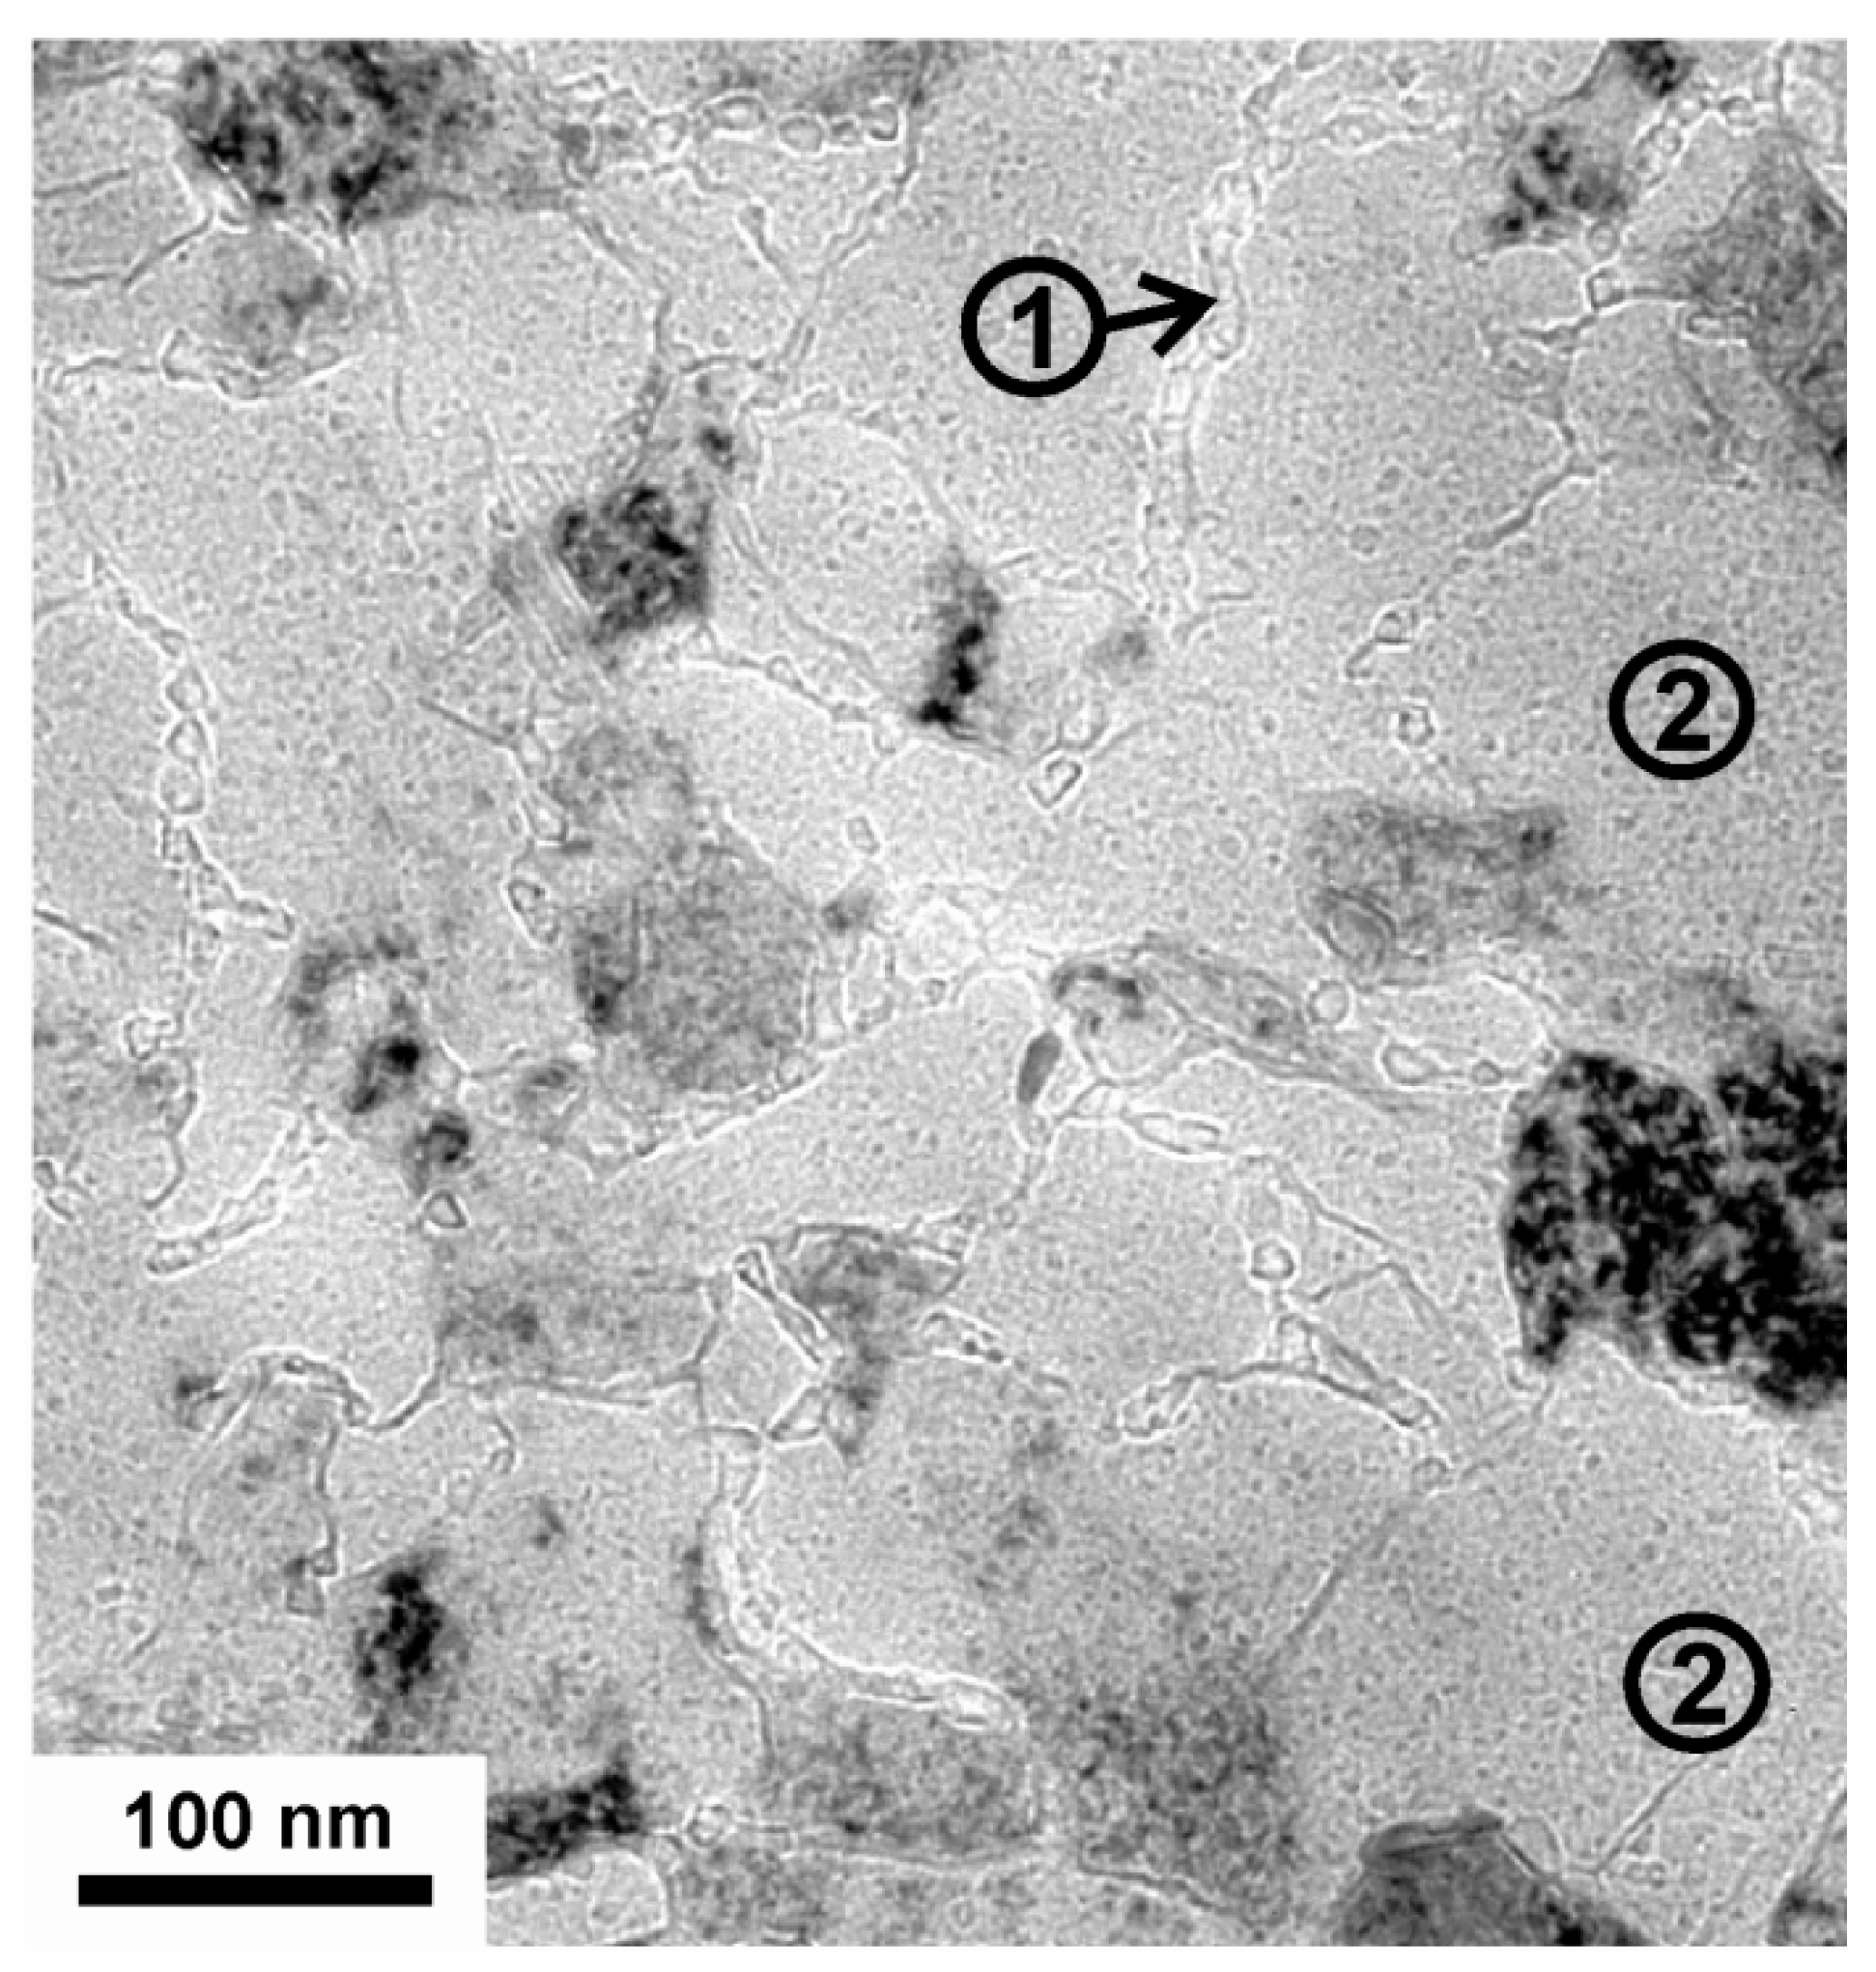
Detailed plan-view TEM investigations of the 1050 °C annealed coatings are presented in over-focus condition in
Figure 4. Along with the large grains, which hint a still existing columnar microstructure, the grain boundary phase is visible, see the area labeled with (1) in
Figure 4. Also, precipitates with average sizes of ~7 nm diameter within the large domains can be identified, see e.g., the areas labelled with (2) in
Figure 4. Domain sizes around 6 nm in diameter of 1050 °C annealed Ti
0.5Al
0.5N coatings were also detected by small angle neutron scattering [
16].
Figure 4.
Over-focused plan view TEM micrograph of c-Ti
0.45Al
0.55N after annealing to 1050 °C taken at a lower magnification than in
Figure 3. The grain boundary phase is indexed with (1) and the formation of nm-size precipitates within the grains are indexed with (2).
Figure 4.
Over-focused plan view TEM micrograph of c-Ti
0.45Al
0.55N after annealing to 1050 °C taken at a lower magnification than in
Figure 3. The grain boundary phase is indexed with (1) and the formation of nm-size precipitates within the grains are indexed with (2).
Generally, spinodal decomposition of the cubic solid-solution Ti
1-xAl
xN can be expected at temperatures above 850 °C [
9,
11,
20,
22] which allow for the required kinetic conditions. The spinodal decomposition is a spontaneous process where a cluster or concentration fluctuation amplifies to the equilibrium concentration through diffusion up the concentration gradient [
36], when the kinetic requirements allow for it. Therefore, spinodal decomposition will take place within the domains or grains of a solid-solution. In recent years, the effect of grain boundaries and inner surface on spinodal decomposition was investigated and it was found that these surfaces can also stimulate the appearance of concentration waves. Such surface-initiated or directed spinodal decomposition leads to domains repeating the grain boundary geometry [
34,
35,
37].
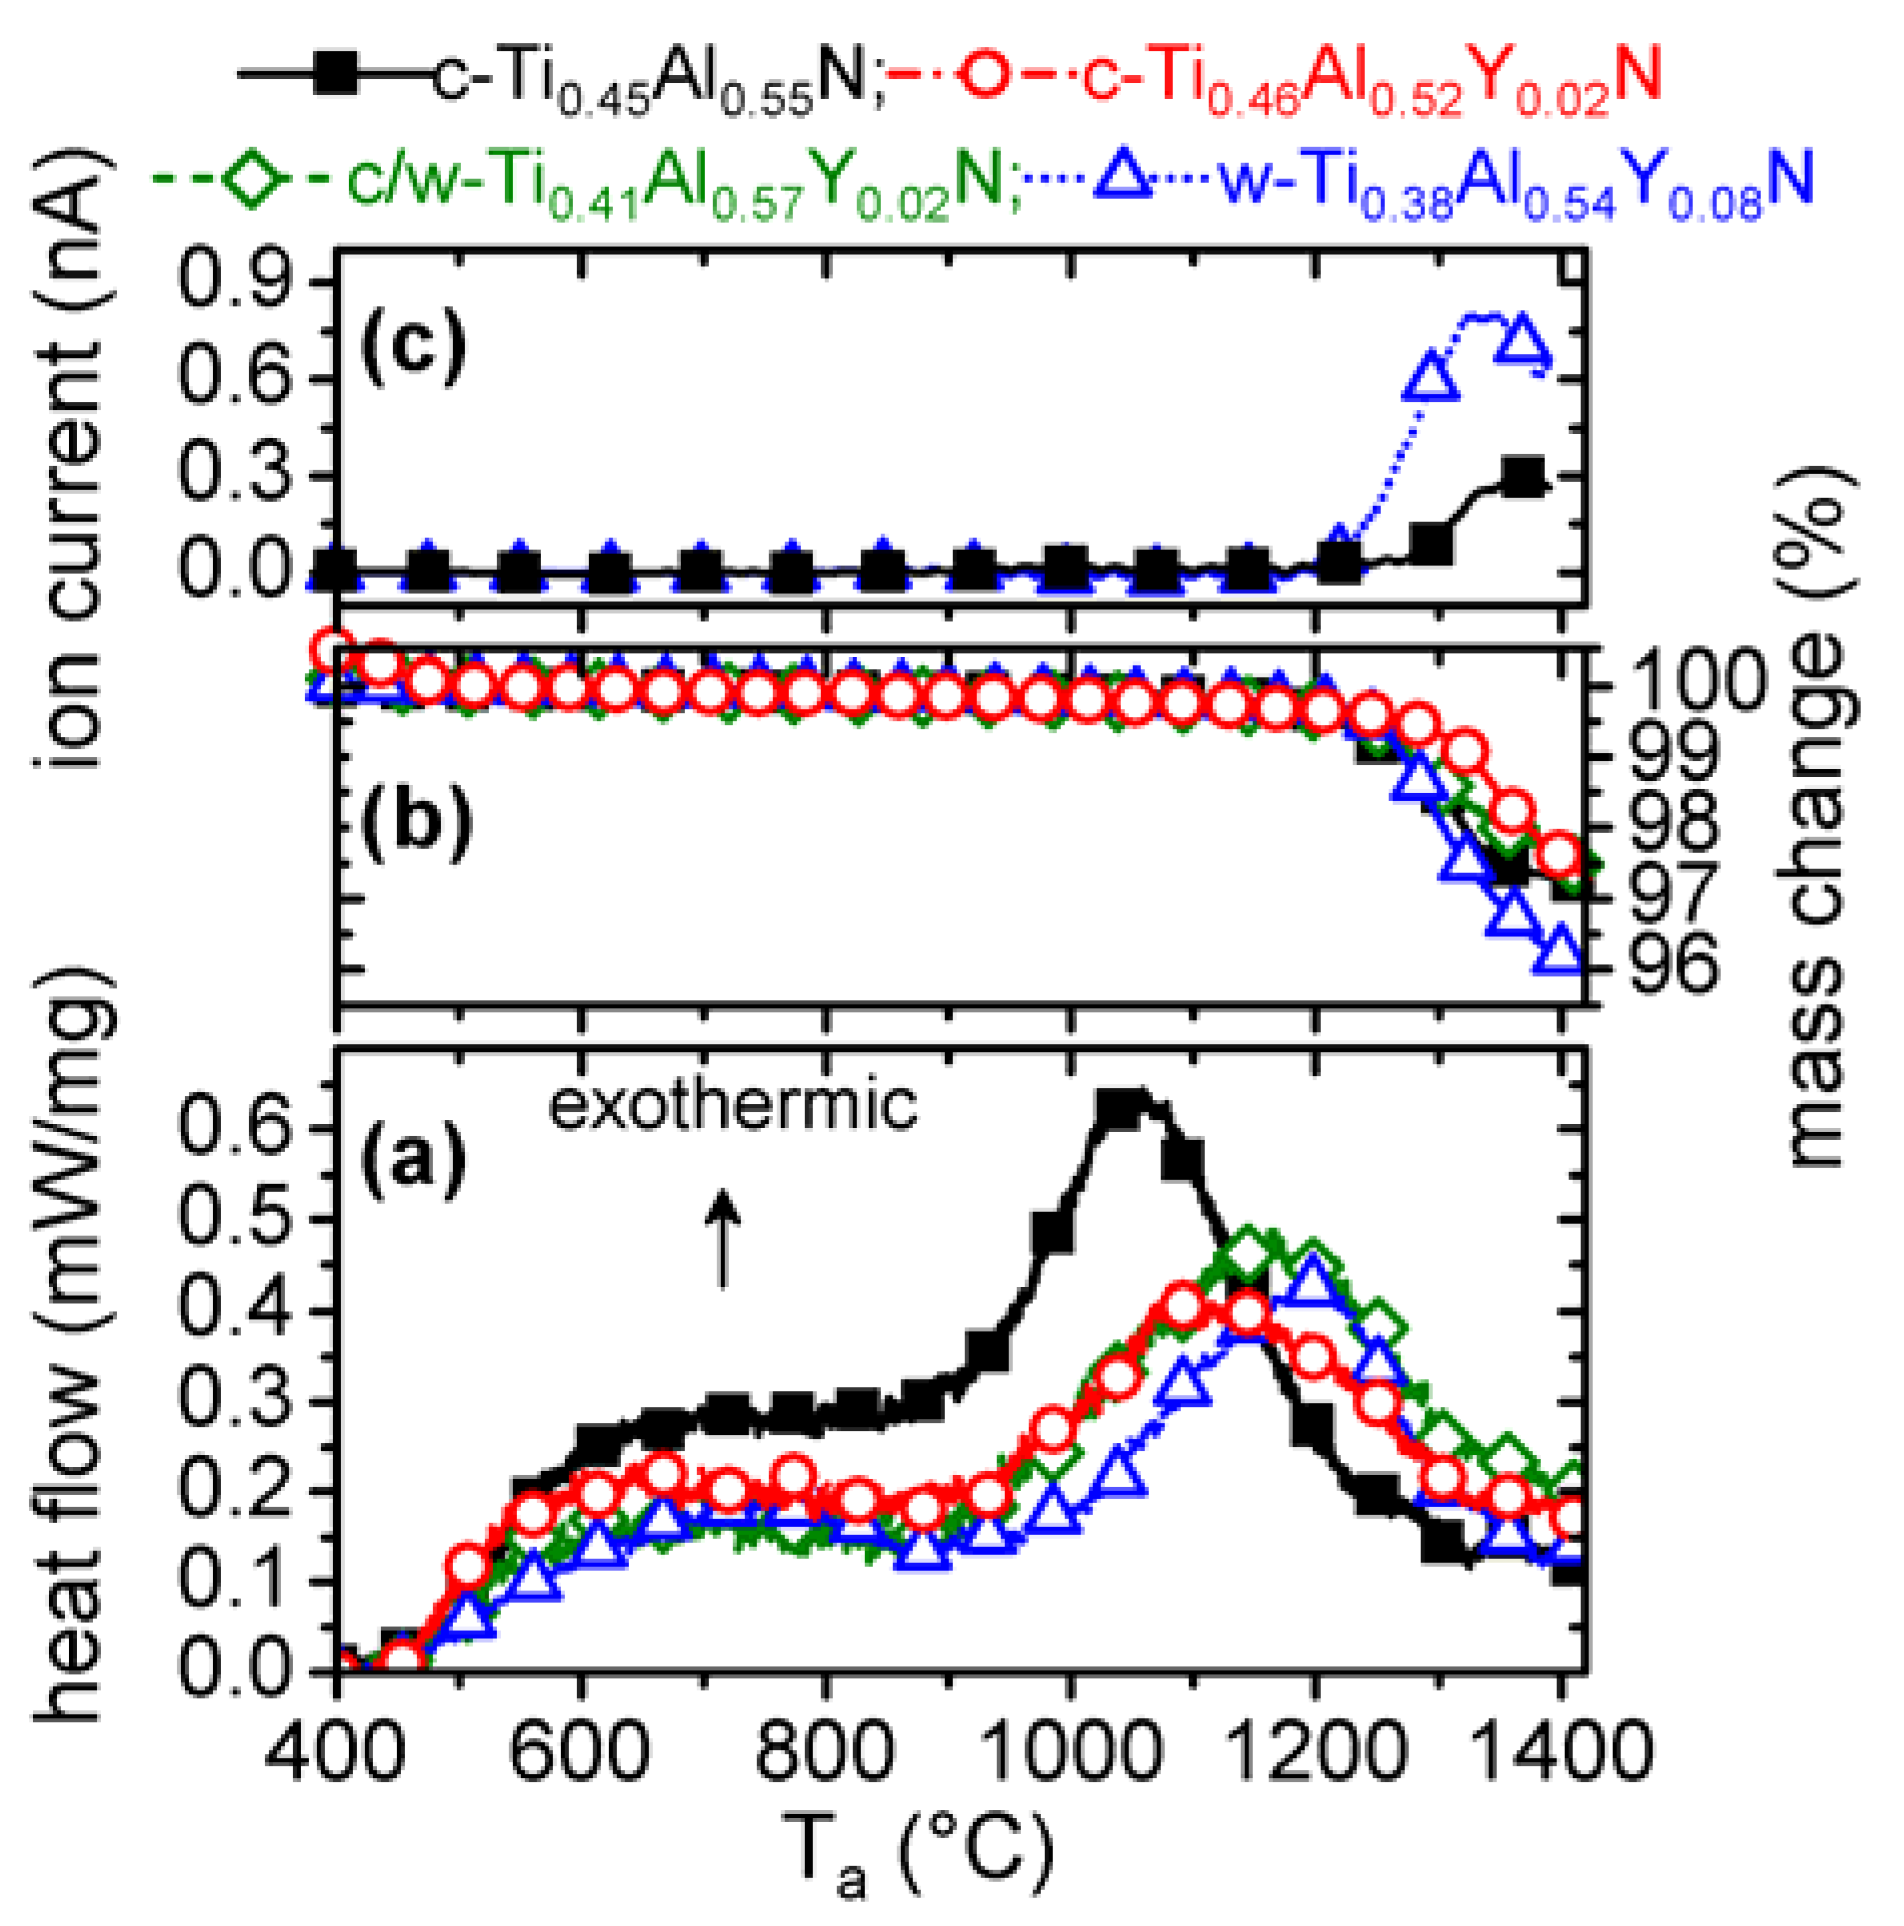
With the above described changes in structure and morphology the detected features during DSC (
Figure 1a) can be interpreted. Starting from temperatures slightly above the deposition temperature, recovery processes are responsible for the detected DSC signal, where also the formation of w-AlN for T
a ≥ 700 °C and cubic Ti- and Al-rich domains contribute. The pronounced exothermic feature between 910 and 1300 °C includes ongoing spinodal decomposition and formation of w-AlN. For T
a ≥ 1150 °C, the Ti
0.45Al
0.55N thin film is largely decomposed into the stable constituents c-TiN and w-AlN. With increasing temperature T
a the fraction of c-AlN decreases. For T
a ≥ 1350 °C, recrystallization and coarsening are responsible for the detected DSC features. These exothermal processes may be superimposed by endothermic contributions resulting from nitrogen release observed for T
a ≥ 1140 °C (
Figure 1b and c).
In general, the decomposition process found for the herein investigated Ti
0.45Al
0.55N differs by the early formation of the wurtzite phase from the decomposition route described in [
9,
11] for single phase cubic Ti
1-xAl
xN. The decomposition reactions, especially the transformation of c-AlN to stable w-AlN, occurs at lower temperatures. Nevertheless, the overall energy input for the decomposition,
i.e., the integrated area under the entire DSC curve, is 35.3 kJ mol
-1 comparable to the 36.2 kJ mol
-1 reported in [
16] for the decomposition of Ti
0.5Al
0.5N.
3.2.2. Single phase cubic Ti0.46Al0.52Y0.02N
The XRD patterns of powdered 2 mol % YN containing Ti
1-xAl
xN (removed from their low alloy steel substrates) in their as deposited state and after annealing at T
a are presented in
Figure 5. These films are prepared by reactive pulsed DC magnetron sputtering using a Ti
0.49Al
0.49Y
0.02 target, see
experimental section, and exhibit a cubic stabilized structure with a chemical composition of c-Ti
0.46Al
0.52Y
0.02N [
27]. The strong (200) reflex as well as the smaller (111) reflex for a cubic phase indicate solid-solution.
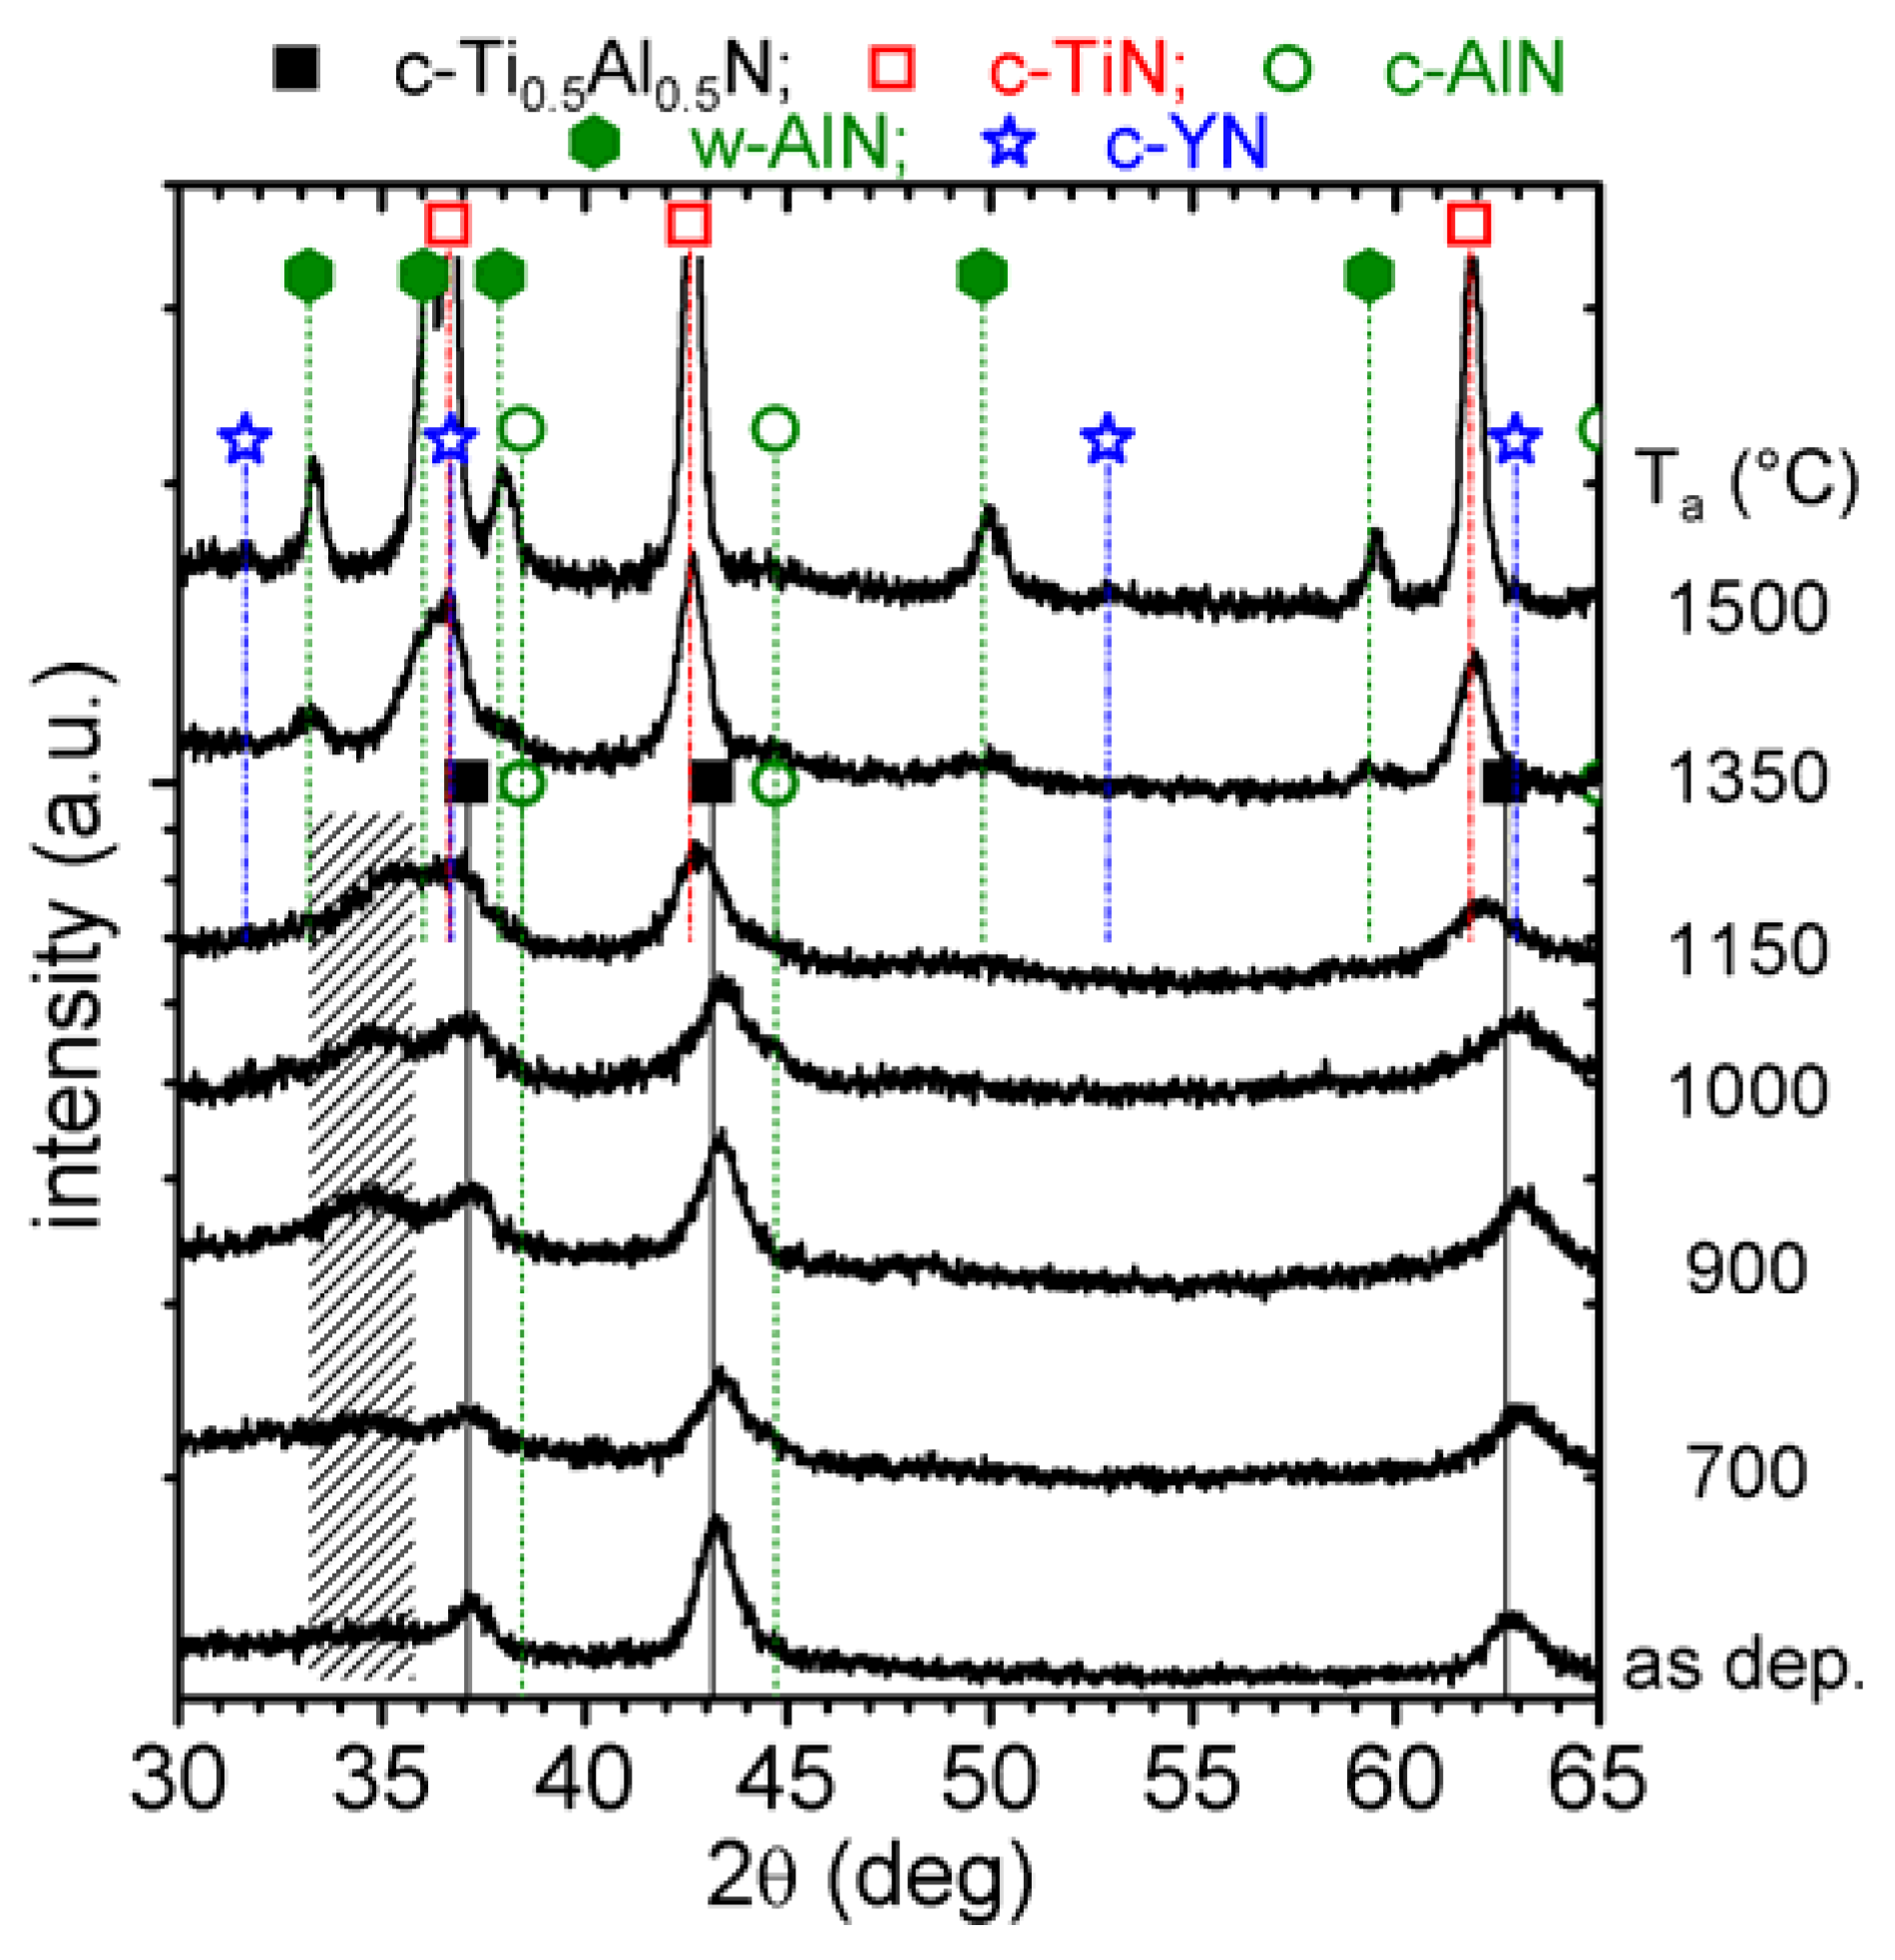
Figure 5.
XRD evolution of single-phase c-Ti0.46Al0.52Y0.02N with annealing temperature Ta up to 1500 °C.
Figure 5.
XRD evolution of single-phase c-Ti0.46Al0.52Y0.02N with annealing temperature Ta up to 1500 °C.
Upon annealing to 700, 900, and 1000 °C, decreasing intensities of these cubic solid-solution matrix-reflexes are observed. The shoulder-formation on both sides of these reflexes, characteristic for cubic Al- and Ti-rich domains (as these would have smaller and larger lattice parameters, respectively) can already be detected for T
a = 700 °C,
i.e., ~200 °C earlier than for the c-Ti
0.45Al
0.55N film, compare
Figure 2. The XRD pattern of c-Ti
0.46Al
0.52Y
0.02N annealed at 1150 °C still exhibits the presence of cubic solid-solution matrix, along with c-TiN, small fractions of c-AlN, and w-AlN. The formation of c-YN precipitates is suggested by a small XRD response at ~31.6 deg. The observed retarded decomposition of the c-Ti
0.46Al
0.52Y
0.02N solid-solution as compared to c-Ti
0.45Al
0.55N, where at 1150 °C the XRD peaks are already close to the positions of the stable constituents, is attributed to Y induced effects as observed also for Cr-Al-Y-N [
18,
38]. After annealing at T
a = 1350 °C, the XRD pattern indicates only reflexes that can be assigned to the stable phases c-TiN, c-YN, and w-AlN, with only minor indications for c-AlN (
Figure 5). When the film is further annealed to 1500 °C, only pronounced high intensity XRD peaks can be detected with 2θ−values corresponding to c-TiN, c-YN, and w-AlN indicating recrystallization and coarsening of the decomposed material.
The morphological evolution with annealing temperature of this c-Ti
0.46Al
0.52Y
0.02N coating is investigated by plan view TEM, see
Figure 6.
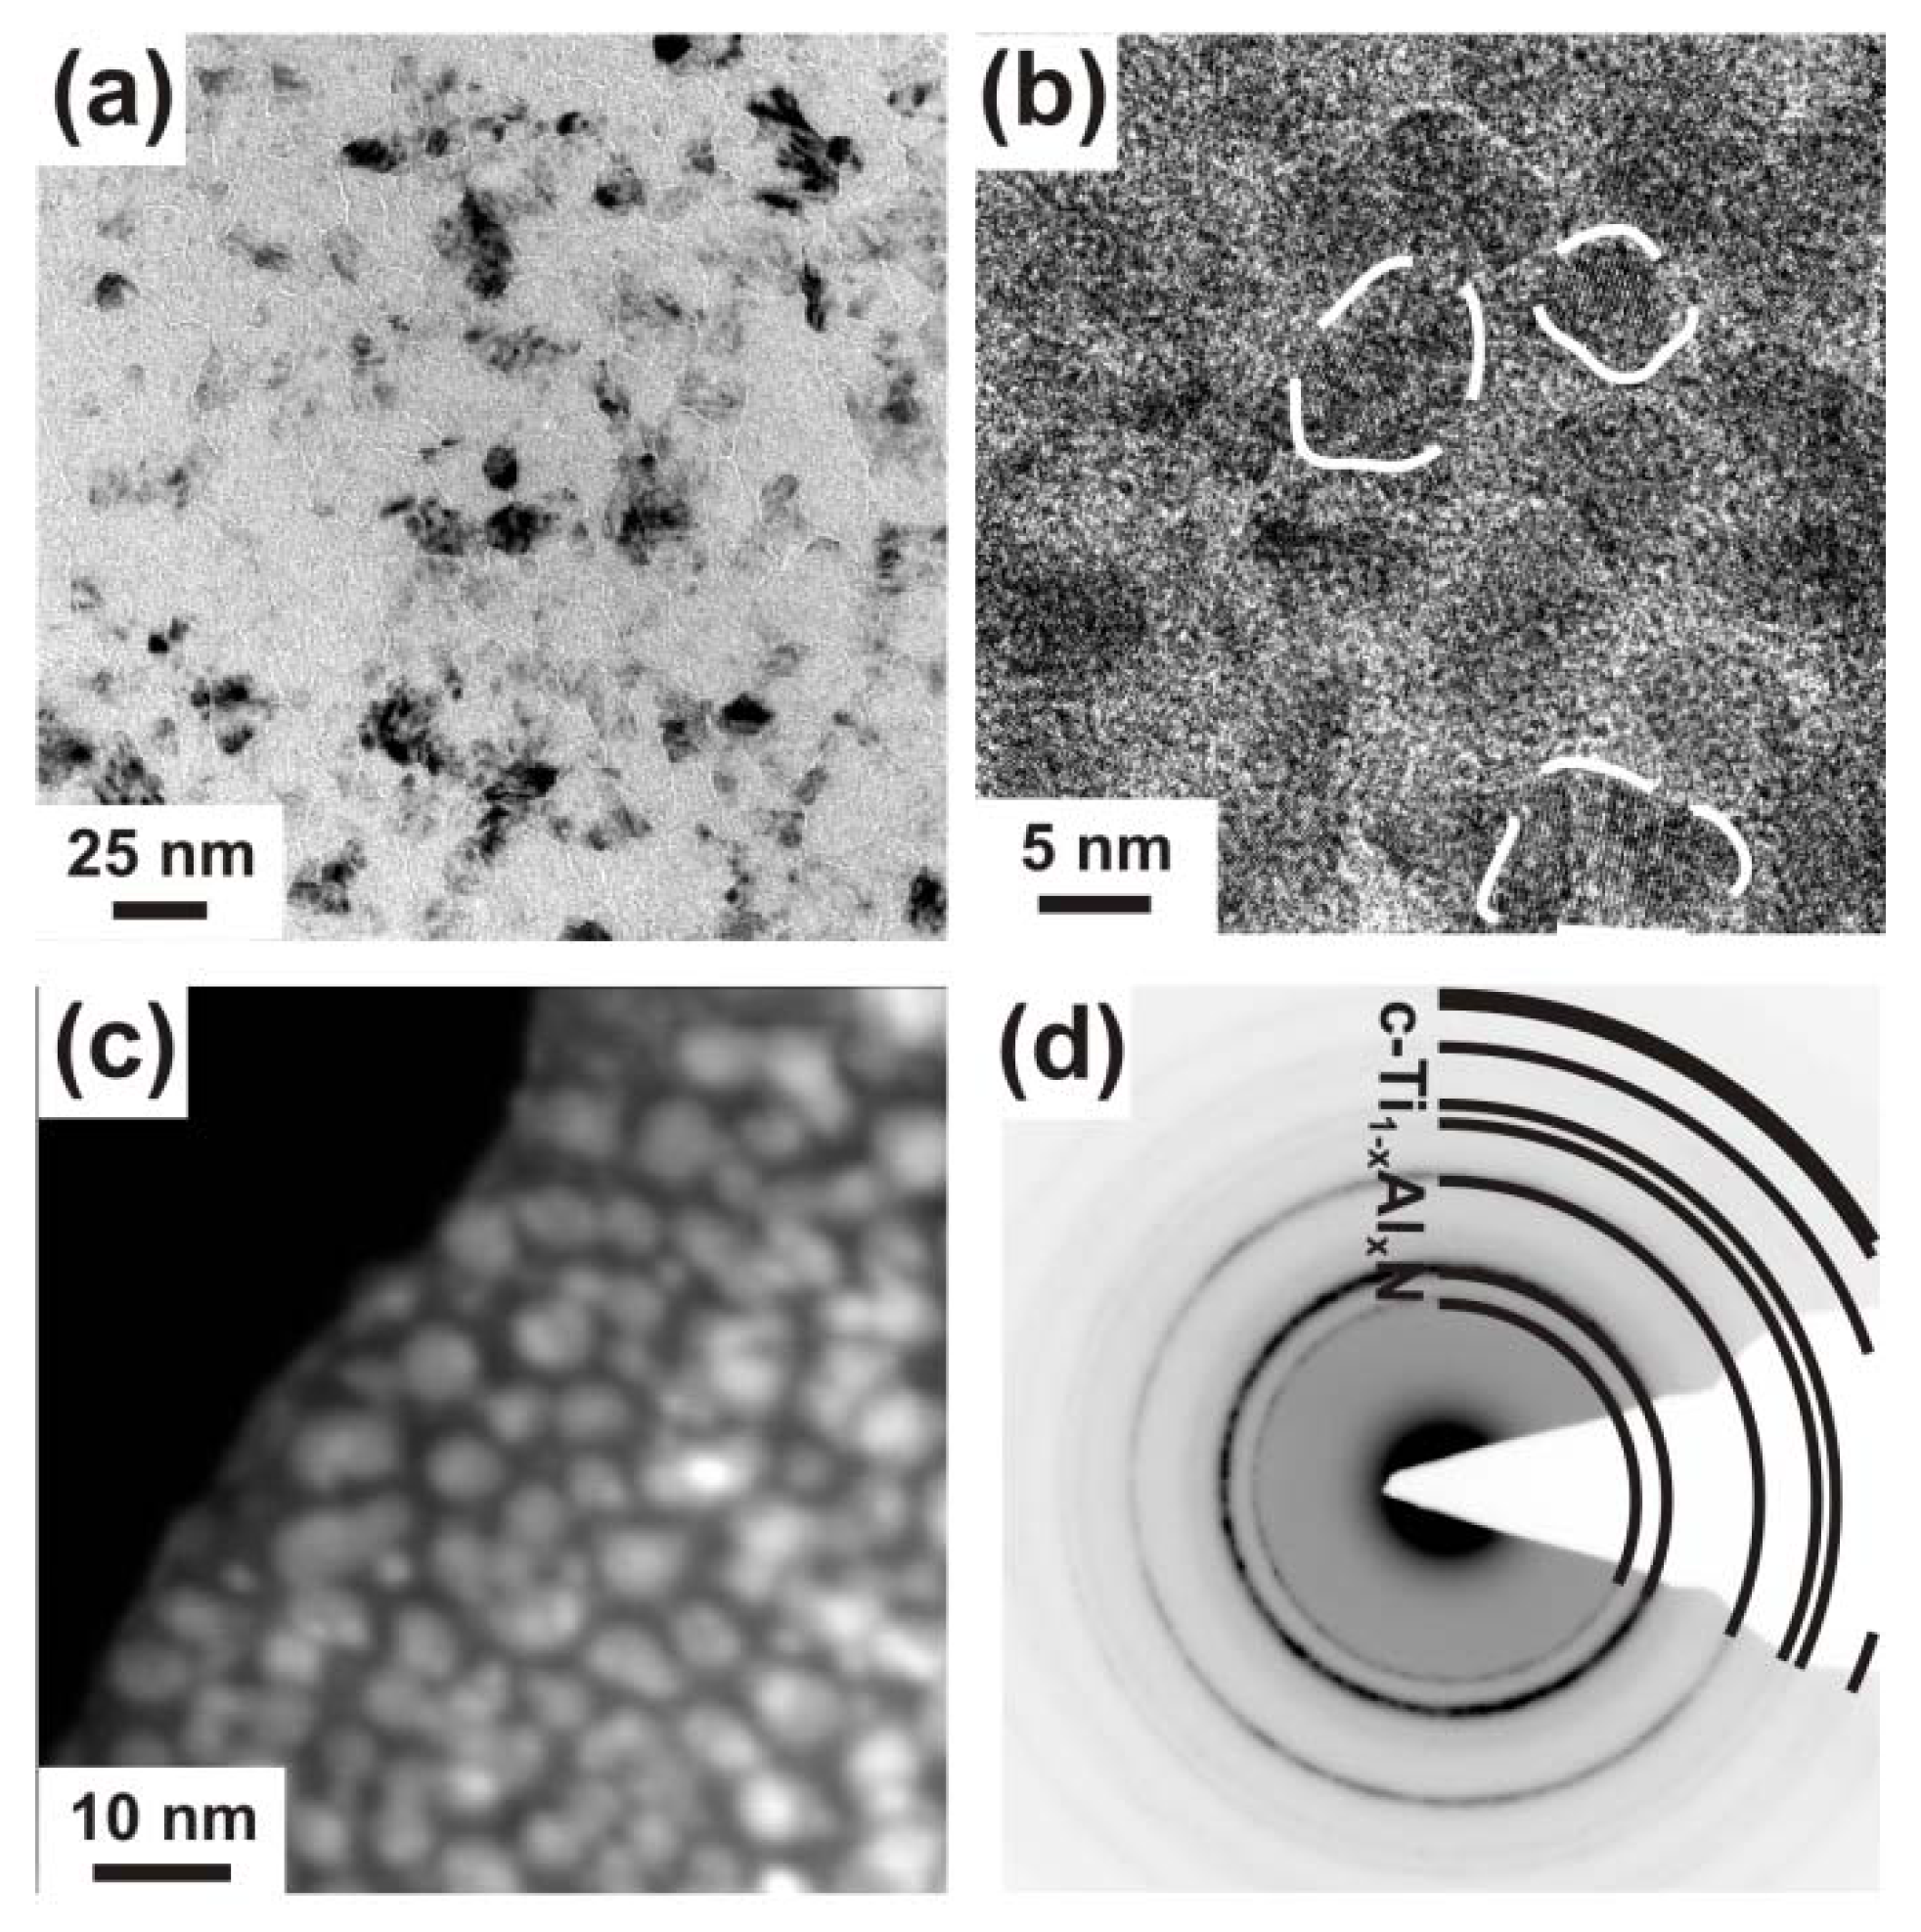
Figure 6.
Plan view TEM micrographs of the single-phase c-Ti0.46Al0.52Y0.02N taken in (a) bright-field low magnification, (b) HRTEM and (c) HAADF STEM mode. The crystallite areas are highlighted by the dashed-line in the HRTEM image. (d) SAED pattern showing only cubic solid-solution Ti1-xAlxN reflexes.
In the as deposited state the coating exhibits a fine-grained microstructure with domain sizes of <10 nm, much smaller as compared to the ~100 nm of the Y-free c-Ti
0.45Al
0.55N film (compare
Figure 3 and
Figure 6). The grain boundaries of the c-Ti
0.46Al
0.52Y
0.02N coating are more pronounced, as a bright-contrast tissue-phase can be identified in the bright-field image (
Figure 6a). In the HAADF image the tissue phase appears dark (
Figure 6c), indicating a lower average atomic number compared to the grains. The HRTEM and HAADF images (
Figure 6b and c, respectively), exhibit 5−10 nm sized grains (cross-section of the coating-columns, highlighted by the dashed line) encapsulated by the grain boundary phase with thicknesses up to a few nm. Lattice fringes can only be detected within the grains. The SAED pattern (
Figure 6d), taken over an area covering several grains as well as the tissue phase, shows only diffraction-rings for a cubic solid-solution with a lattice parameter of ~4.178 Å, comparable to that obtained by XRD. Based on these investigations, we assume that the grain-boundary phase has a low short-range order structure resulting in an electron (SAED) and X-ray (XRD) amorphous response.
When performing electron energy-loss spectroscopy (EELS) and EDX in the TEM on the samples, an increased Al content can be detected within the grain-boundary phase with respect to the encapsulated grains. The contents for Ti and Y are evenly distributed within the investigated areas of the as deposited films. As the chemical composition of this film is close to the border line between cubic and wurtzite phase-fields, see [
26,
27], depending on the deposition conditions and the resulting kinetics (which influence the phase-field ranges), either the cubic or the wurtzite phase can be favored, or both phases could co-exist. Such processes are fundamentally described in [
39,
40], and competitive-growth resulting structures are reported in literature for a large variety of different coating systems, ranging from metallic films to nanocomposites, e.g., based on transition metal nitrides or borides [
41,
42,
43,
44].
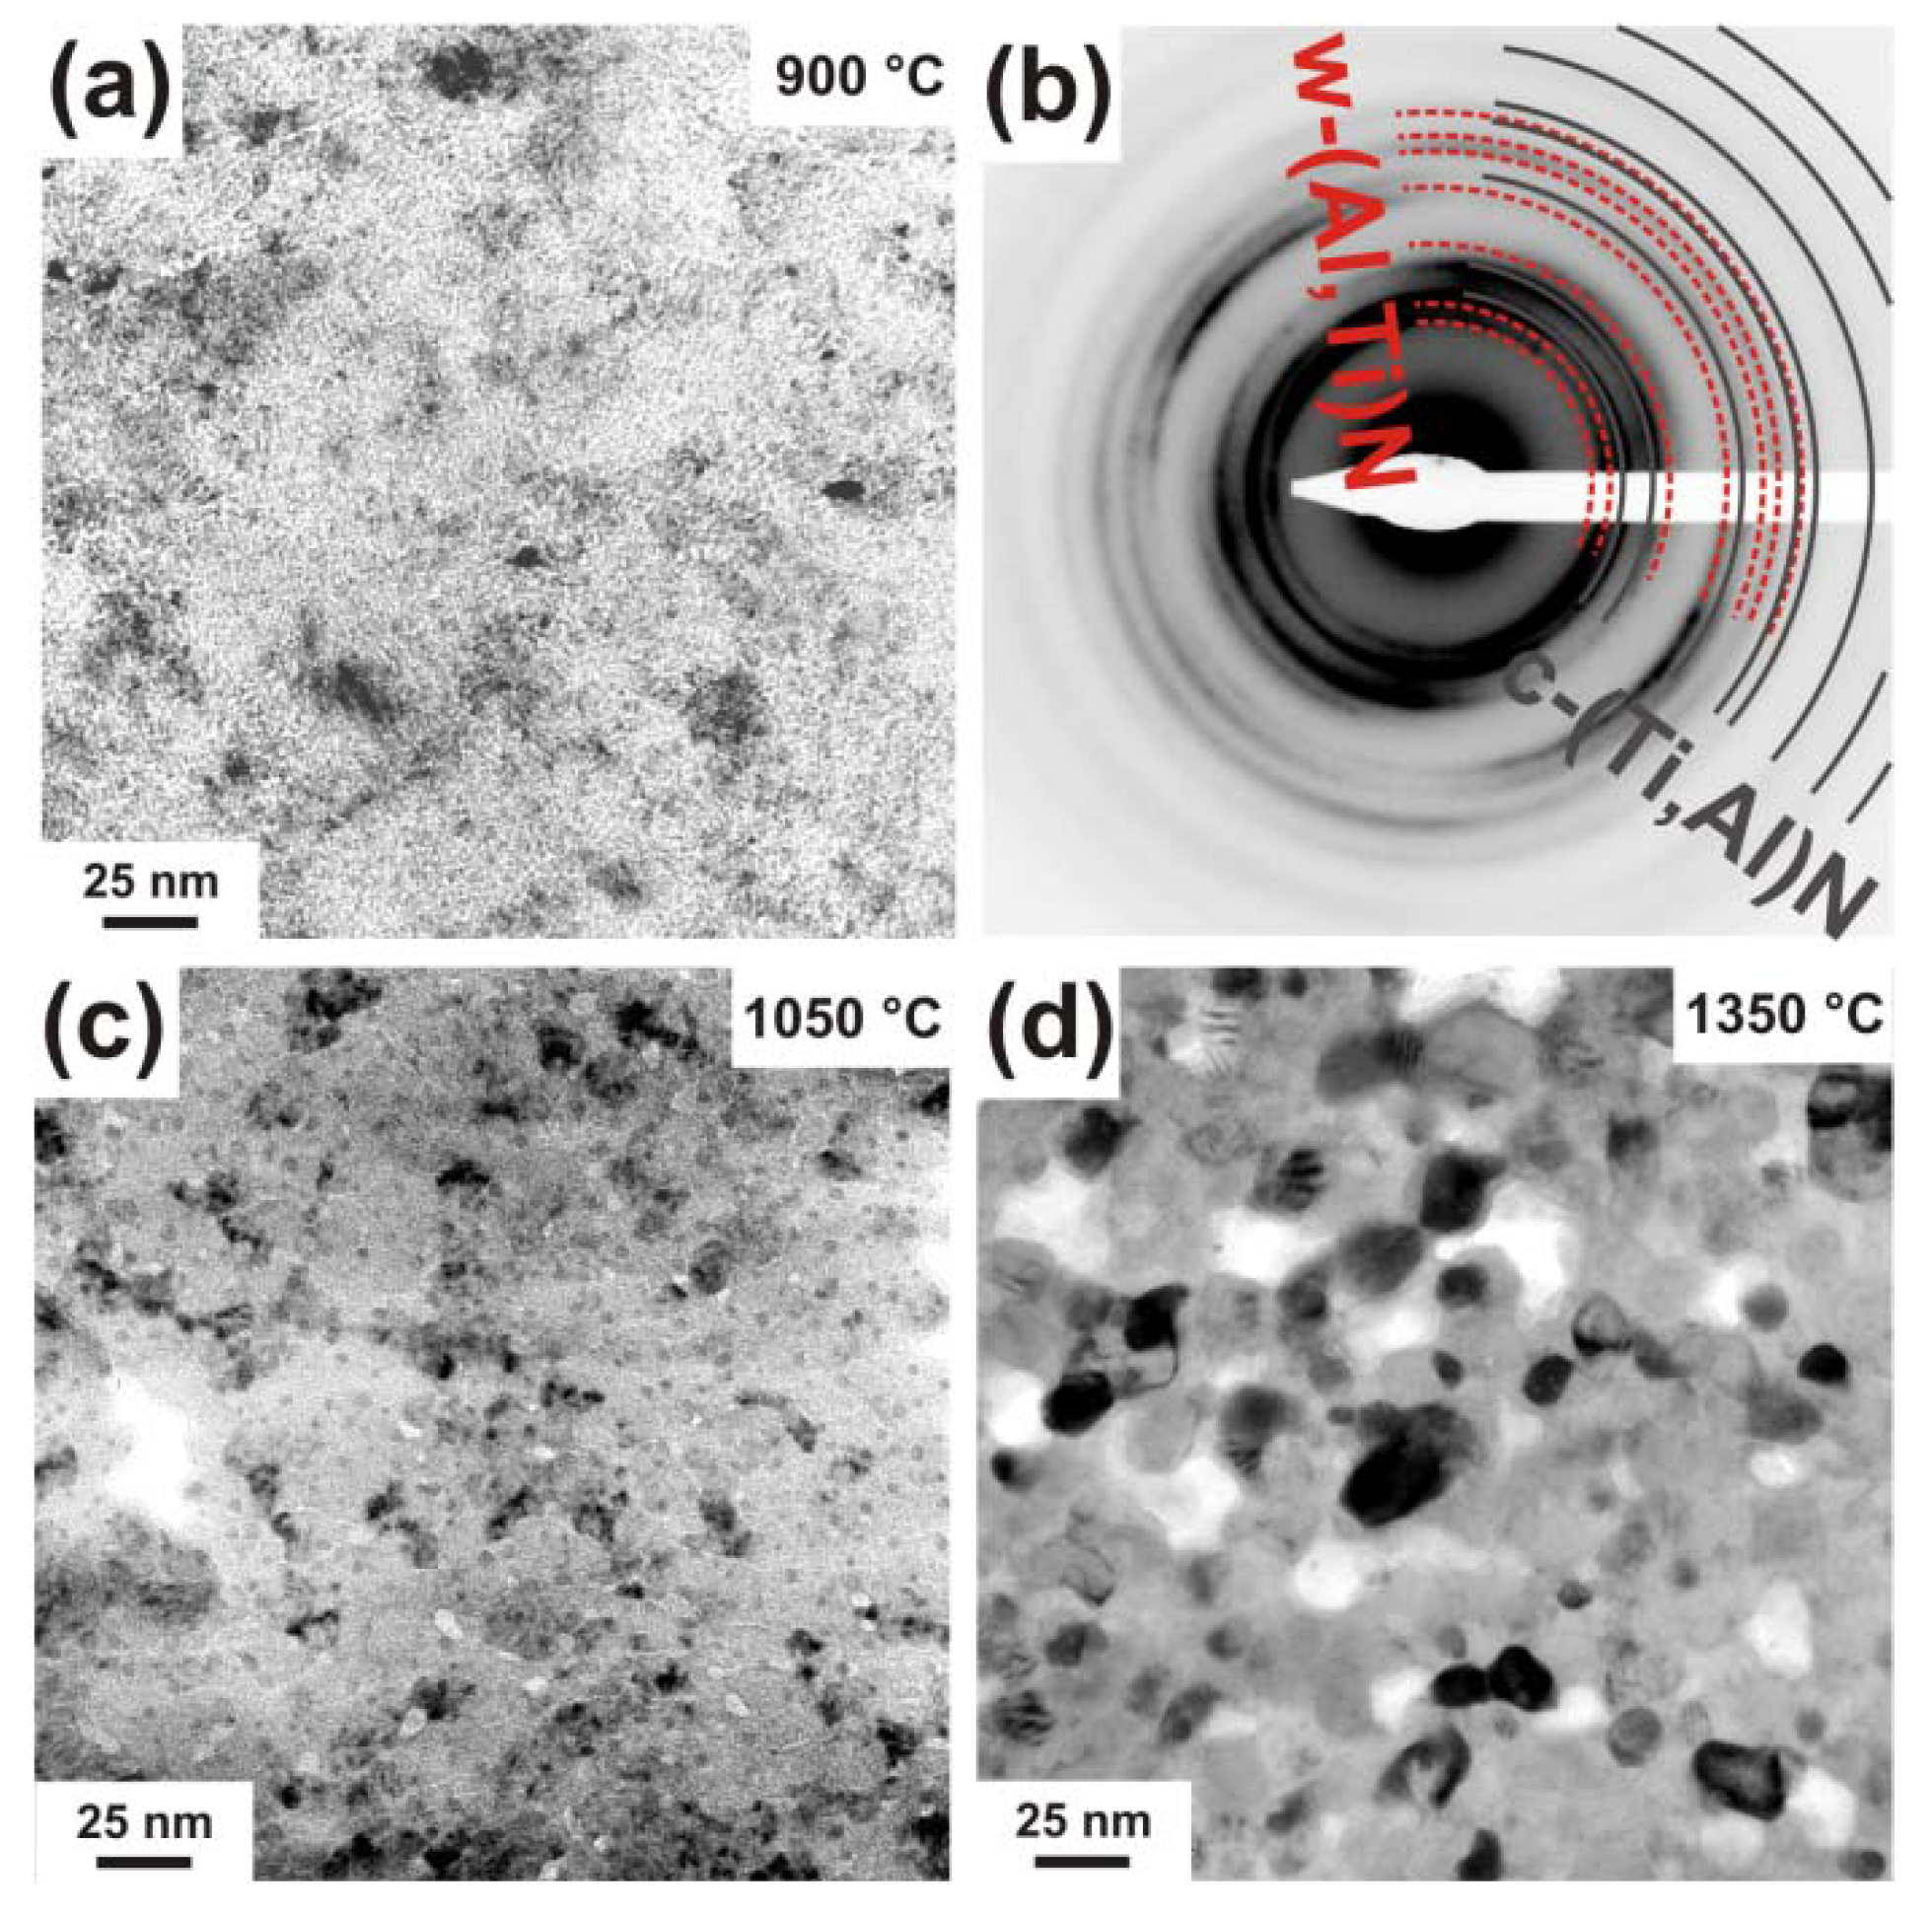
Corresponding to the results obtained for c-Ti
0.45Al
0.55N, also the c-Ti
0.46Al
0.52Y
0.02N film reveals a decreasing grain size with increasing T
a to 900 °C (compare
Figure 6a and
Figure 7a). The corresponding SAED pattern,
Figure 7b, suggests cubic as well as wurtzite phase contributions.
Figure 7.
TEM plan view micrograph of the single-phase c-Ti0.46Al0.52Y0.02N after annealing to (a) 900 °C, (c) 1050 °C, and (d) 1350 °C. (b) SAED pattern for the 900 °C annealed sample.
Figure 7.
TEM plan view micrograph of the single-phase c-Ti0.46Al0.52Y0.02N after annealing to (a) 900 °C, (c) 1050 °C, and (d) 1350 °C. (b) SAED pattern for the 900 °C annealed sample.
After annealing to 1050 °C,
Figure 7c, the coating exhibits ~20 nm sized domains, surrounded by a bright-contrast phase with diameters between 4.5 and 12 nm. These bright areas could be identified as holes. As for these sample areas, the SAED pattern (not shown here) indicate a decreased wurtzite phase content (as compared to the lower annealing temperatures) the holes might be related to former w-AlN areas. As the formation of wurtzite AlN from the cubic Ti
1-xAl
xN phase is connected to a huge volume increase (w-AlN has a ~26% higher specific volume as its metastable cubic counterpart [
6]) these areas might break during the TEM sample preparation.
Within the domains, small ~3.5 nm sized precipitations can be identified, similar to the 1050 °C annealed Y-free c-Ti
0.45Al
0.55N film. Whereas the latter exhibits an interconnected network of >100 nm sized grains after annealing at 1350 °C (see
Figure 3), the microstructure of the c-Ti
0.46Al
0.52Y
0.02N film annealed at the same temperature is composed of only ~25 nm globular grains (
Figure 7d). This grain refinement effect can be attributed to Y-induced effects and the additional precipitation of c-YN.
Based on these TEM and XRD investigations, the DSC measurements of the c-Ti
0.46Al
0.52Y
0.02N sample, shown in
Figure 1a, can be interpreted with respect to the findings for the Y-free c-Ti
0.45Al
0.55N sample. Similar to the Y-free film, the first exothermic DSC feature starting at ~500 °C includes recovery processes, spinodal decomposition, as well as formation of w-AlN. Our results suggest that the smaller grain size and the high-Al containing boundary phase with a lower density promote the formation of w-AlN. Cubic AlN can already be detected after annealing at ~700 °C, hence at lower temperatures as for the Y-free film, compare
Figure 2 and
Figure 5. In contrast to these results, the development of the w-AlN phase is retarded to higher temperatures. This is also represented in the DSC curve with an increase in peak temperature from 1052 °C for c-Ti
0.45Al
0.55N to 1118 °C for c-Ti
0.46Al
0.52Y
0.02N (see
Figure 1a). Consequently, the onset of mass loss is also shifted by 60 °C from 1140 °C for c-Ti
0.45Al
0.55N to ~1200 °C for c-Ti
0.46Al
0.52Y
0.02N (
Figure 1b). Yttrium retards the decomposition of the solid-solution as well as the transformation of c-AlN to w-AlN. The early onset of the formation of w-AlN is related to its development from the grain boundary phase. It is envisioned that a further optimization of the deposition conditions, where the amount of the grain boundary phase can be reduced and the cubic phase can further be stabilized, will result in a retarded formation of w-AlN, corresponding to the results obtained for Cr-Al-Y-N [
18].
3.2.3. Binary phase cubic/wurtzite Ti0.41Al0.57Y0.02N
The XRD pattern of the as deposited 2 mol % YN containing film, prepared by reactive magnetron DC sputtering of a Ti
0.49Al
0.49Y
0.02 target, suggests a binary phase structure composed of cubic and wurtzite (hatched area) solid-solution Ti
1-x-yAl
xY
yN phases, see
Figure 8. While the wurtzite phase fraction results in a relatively low-intensity reflection (2θ range between 32 and 37 deg) in the as deposited state, this intensity increases with increasing T
a to 1150 °C.
Corresponding to the cubic stabilized c-Ti
0.46Al
0.52Y
0.02N coating, also this binary c/w-Ti
0.41Al
0.57Y
0.02N coating exhibits increasing c-AlN reflexes (2θ ~44.7 deg) upon annealing to 700 °C, suggesting the onset of spinodal decomposition at relatively low temperatures. Annealing the coating to 1000 and 1150 °C, causes an increasing intensity for the XRD reflexes attributed to the wurtzite solid-solution at 2θ ~34 deg as well as the c-AlN at 2θ ~44.7 deg. The c-Ti
1-x-yAl
xY
yN peaks shift to lower diffraction angles, suggesting an increase in lattice constant and hence a depletion in AlN or enrichment in TiN of the cubic solid-solution. After annealing to 1350 °C the coating is mainly composed of phases with lattice constants close to their standard values, hence the XRD peaks match the 2θ positions for c-TiN and w-AlN, see
Figure 8. Nevertheless, the broad reflexes still suggest small grain sizes, similar to the results obtained for c-Ti
0.46Al
0.52Y
0.02N, and indicate retarded decomposition and transformation as compared to the Y-free c-Ti
0.45Al
0.55N film. With increasing the temperature to 1500 °C, the individual grains grow (increased sharpness of the respective XRD reflexes), and also c-YN can clearly be detected (2θ ~31.5 and 52.5 deg).
Plan view TEM investigations of this binary phased c/w-Ti
0.41Al
0.57Y
0.02N coating exhibit a fine grained morphology in the as deposited state, see
Figure 9a.
Figure 8.
XRD evolution of binary c/w-Ti0.41Al0.57Y0.02N with annealing temperature Ta up to 1500 °C.
Figure 8.
XRD evolution of binary c/w-Ti0.41Al0.57Y0.02N with annealing temperature Ta up to 1500 °C.
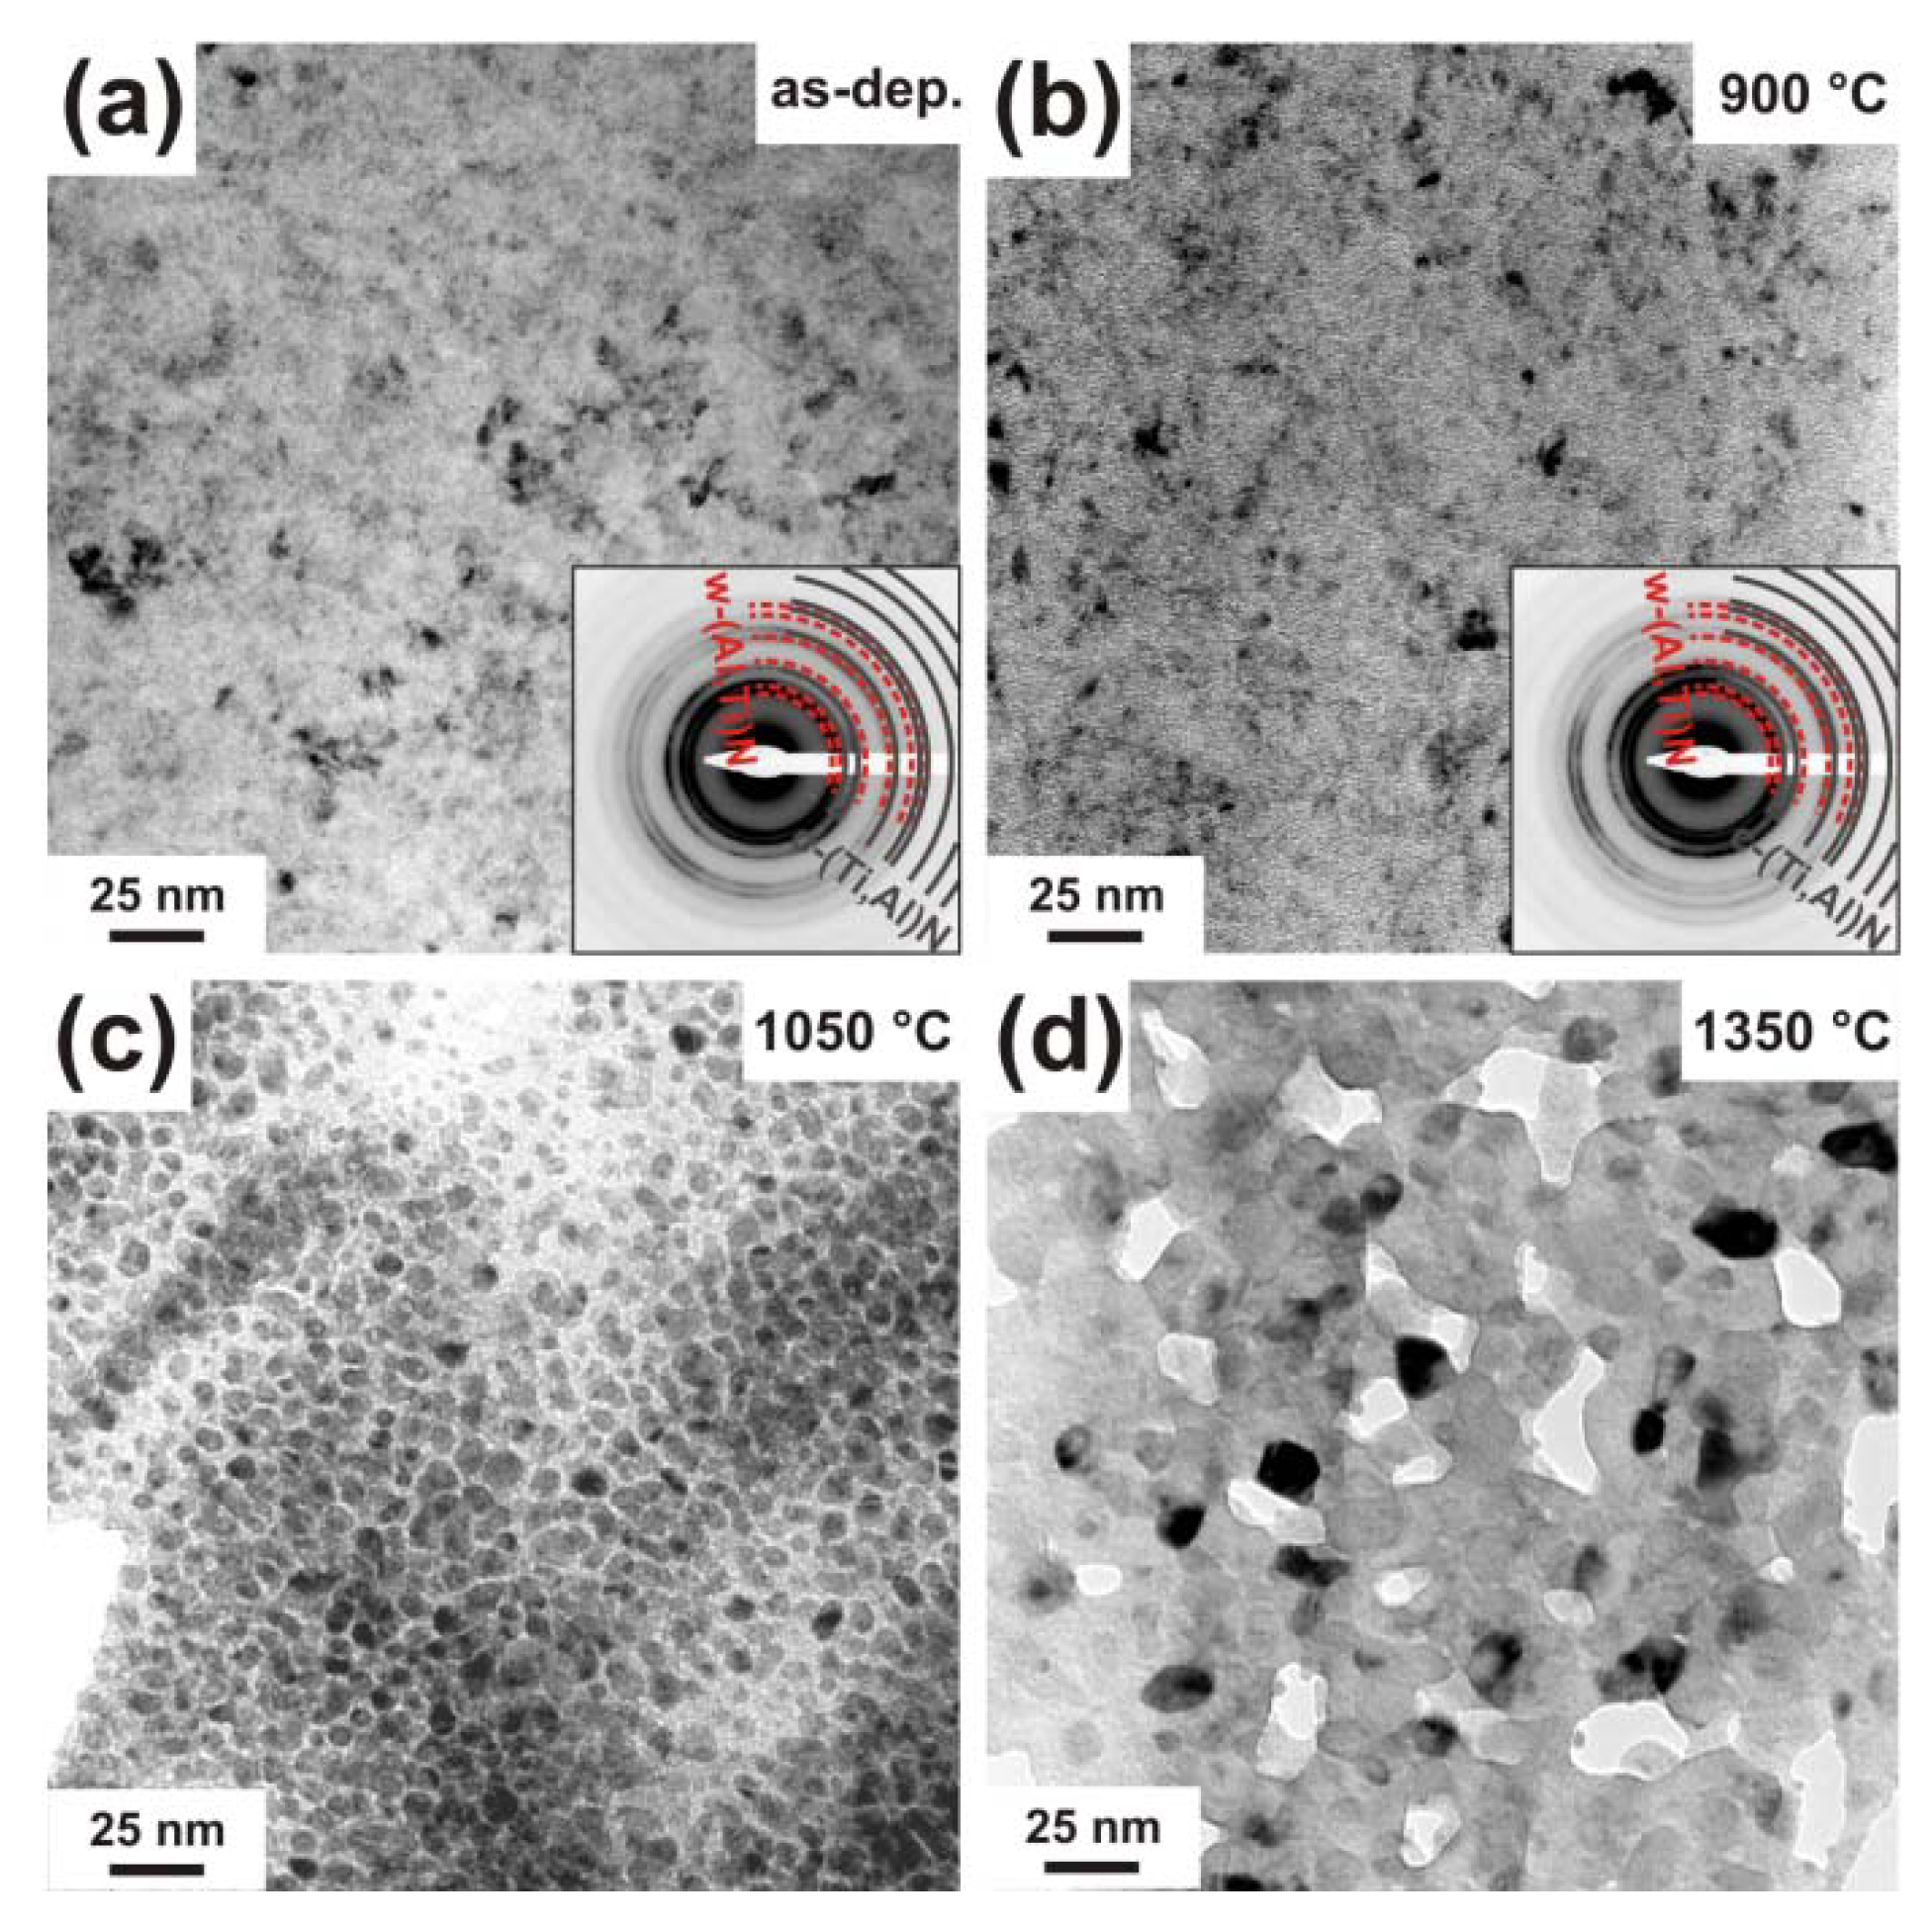
Figure 9.
Plan view TEM micrographs of binary c/w-Ti0.41Al0.57Y0.02N in the (a) as deposited state, and after annealing to (b) 900 °C, (c) 1050 °C, and (d) 1350 °C. The small insets in (a) and (b) are the corresponding SAED patterns.
Figure 9.
Plan view TEM micrographs of binary c/w-Ti0.41Al0.57Y0.02N in the (a) as deposited state, and after annealing to (b) 900 °C, (c) 1050 °C, and (d) 1350 °C. The small insets in (a) and (b) are the corresponding SAED patterns.
In [
27] we investigated this film by cross-sectional TEM and found a tilted columnar microstructure with column diameters at the coating surface below 40 nm in the as deposited state. The plan view investigations, here, suggest a grain size below 20 nm. The SAED pattern of the as deposited film (inset in
Figure 9a) clearly shows the co-existence of cubic and wurtzite phases. After annealing to 900 °C, the TEM plan view micrographs as well as the corresponding SAED pattern show no major changes as compared to the as deposited condition (
Figure 9b). After annealing to 1050 °C, the coating consists of grains with diameters in the range 5–15 nm, surrounded by a bright-contrast tissue phase, see
Figure 9c. Annealing the coating further to 1350 °C results in the formation of a coarsened (but still small sized), globular grained microstructure, see
Figure 9d.
Corresponding to the findings for the c-Ti0.45Al0.55N and the c-Ti0.46Al0.52Y0.02N coating also for this binary phased c/w-Ti0.41Al0.57Y0.02N coating relaxation and recovery effects are responsible for the DSC features between ~430 °C and the onset temperature of the large exothermic peak at ~920 °C. The latter covers the processes of decomposition, recrystallization and grain growth. In total the energy released of this c/w-Ti0.41Al0.57Y0.02N coating during annealing to 1500 °C is ~19.22 kJ mol-1.
3.2.4. Single phase wurtzite Ti0.38Al0.54Y0.08N
The XRD pattern of the as deposited 8 mol % YN containing Ti
0.38Al
0.54Y
0.08N film exhibits a solid-solution wurtzite structure with lattice parameters of a ~3.205 Å and c ~5.220 Å [
26], see
Figure 10. With increasing temperature to 1000 °C, the XRD patterns suggest only minor changes in structure. The increased XRD reflex intensities indicate only an increased crystallinity. When the coatings are annealed to 1150 °C, new phases can be detected which can be assigned to c-TiN (2θ ~43 deg). Hence, the solid-solution wurtzite structure decomposes to form TiN precipitates.
Figure 10.
XRD evolution of single-phase w-Ti0.38Al0.54Y0.08N with annealing temperature Ta up to 1500 °C.
Figure 10.
XRD evolution of single-phase w-Ti0.38Al0.54Y0.08N with annealing temperature Ta up to 1500 °C.
After annealing to 1350 °C, the XRD reflexes can be attributed to the stable phases c-TiN, w-AlN, and c-YN, although the reflexes are still broad. Hence, the grain size is still small, even after annealing to 1350 °C. With a further increase in Ta to 1500 °C, the XRD peaks are clearly separated and suggest further recrystallization and grain growth. Here, also the c-YN reflexes can clearly be identified.
The plan view TEM investigations of the as deposited w-Ti
0.38Al
0.54Y
0.08N coating exhibit a very small grain size, see
Figure 11a, as suggested by XRD. The corresponding SAED pattern indicates mainly diffraction rings due to a wurtzite phase and almost no indication for a cubic phase (inset in
Figure 11a). The TEM plan view as well as the corresponding SAED investigations exhibit no major changes due to an annealing treatment to 900 °C (see
Figure 11b), as compared to the as deposited film. This again is in agreement with the XRD results. Annealing the film to 1050 °C causes the formation of a clear crystalline grain structure with grain sizes around 3–5 nm, see
Figure 11c. Based on the XRD results, this is attributed to the decomposition of the wurtzite phase solid-solution and the precipitation of c-TiN. These grains coarsen during further annealing (
Figure 11d).
The small changes in XRD and TEM response between the as deposited and up to 1000 °C annealed w-Ti0.38Al0.54Y0.08N samples are in agreement with the small DSC feature between 400 and 1000 °C. The peak temperature with ~1200 °C for this coating is the highest compared to the films probed here, as already identified by XRD and TEM investigations. Also, the onset temperature for mass loss is with 1210 °C highest for this high Y-containing film. The overall energy released during DSC is ~19.15 kJ mol-1 and comparable to that of the c/w-Ti0.41Al0.57Y0.02N with 19.22 kJ mol-1 and c-Ti0.46Al0.52Y0.02N with 20.49 kJ mol-1.
Figure 11.
Plan view TEM micrographs of w-Ti0.38Al0.54Y0.08N in the (a) as deposited state and after annealing at (b) 900 °C, (c) 1050 °C, and (d) 1350 °C. The small insets in (a) and (b) are the corresponding SAED patterns.
Figure 11.
Plan view TEM micrographs of w-Ti0.38Al0.54Y0.08N in the (a) as deposited state and after annealing at (b) 900 °C, (c) 1050 °C, and (d) 1350 °C. The small insets in (a) and (b) are the corresponding SAED patterns.


