3.1. Microstructures
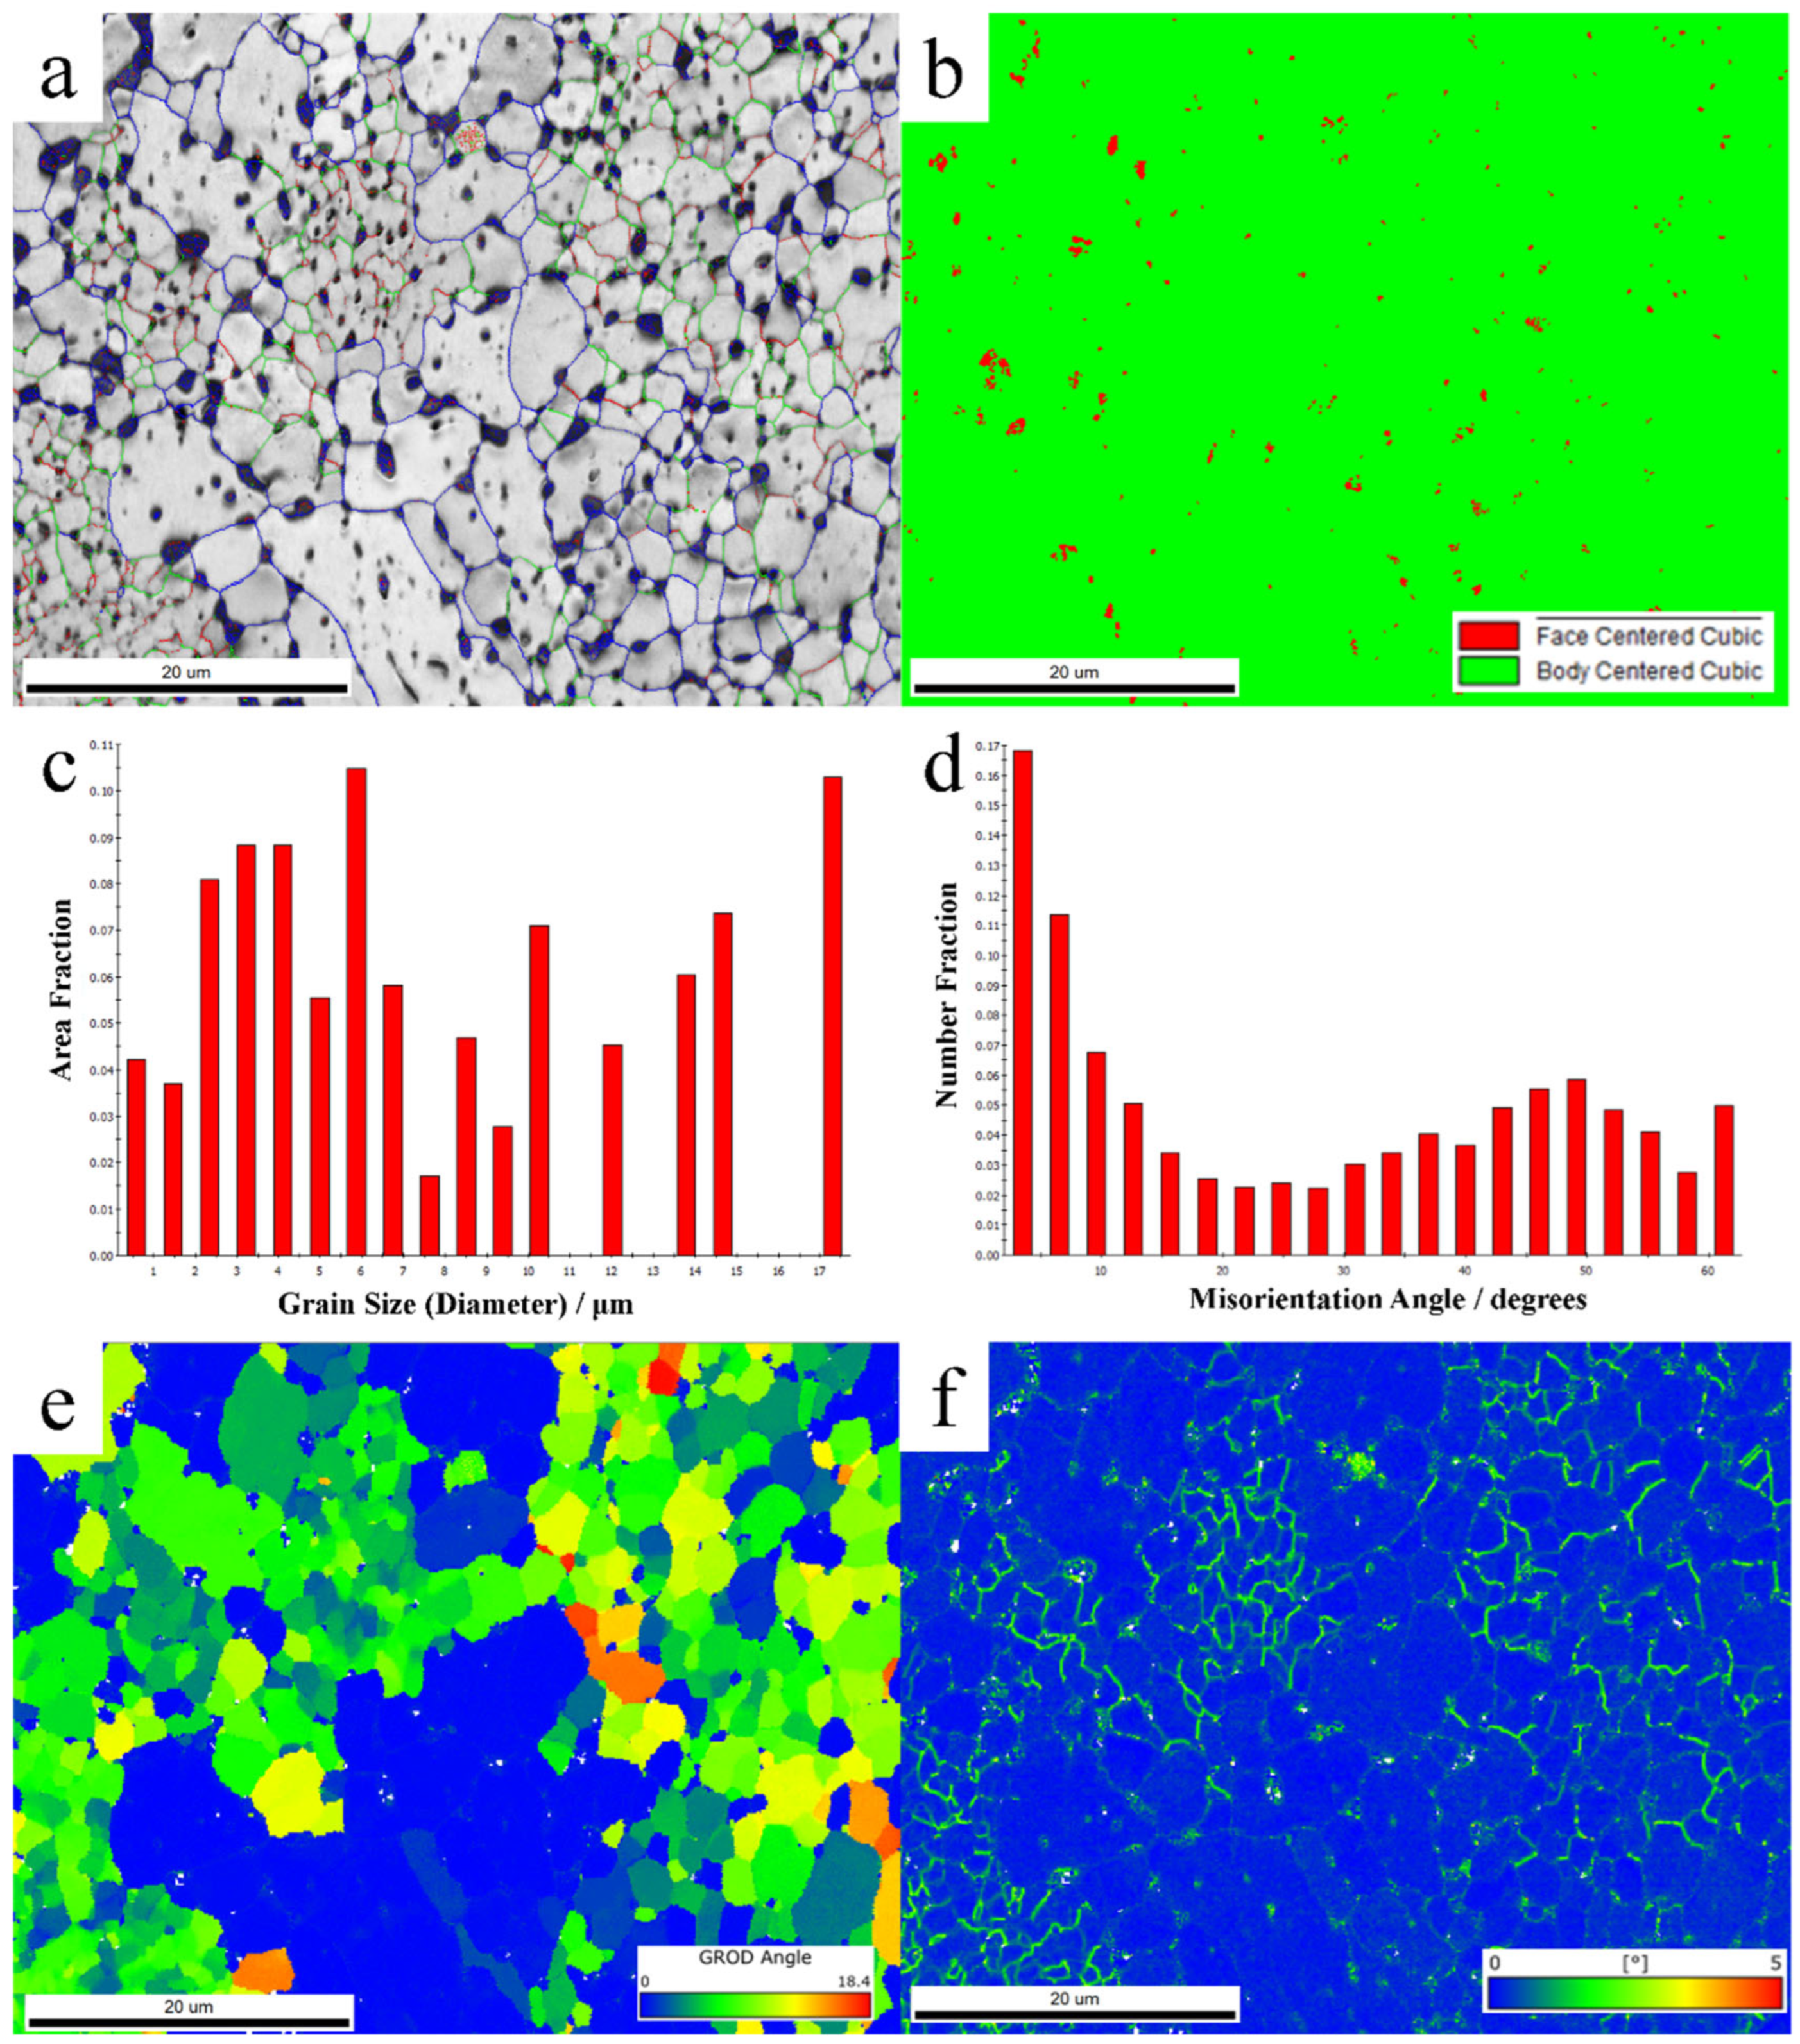
Figure 1 presents the EBSD characterization results of the tested specimen, with a statistically determined grain count of 343.
Figure 1a illustrates the microstructural characteristics of the specimen, revealing an average grain size of approximately 8.01 μm, with the size distribution depicted in
Figure 1c. The proportion of subgrain boundaries (2–5°) is 0.166, primarily associated with dislocation walls formed by edge dislocations. Low-angle grain boundaries (5–15°) account for 0.241, mainly attributed to substructures such as dislocation cell evolution products or partial recrystallization. High-angle grain boundaries (15–180°) dominate with a proportion of 0.590, linked to recrystallization. Additionally, the specimen consists almost entirely of BCC ferrite phase, accounting for approximately 99.1%, as detailed in
Figure 1b.
Figure 1d displays the local misorientation angle distribution, exhibiting a bimodal pattern at both low and high angles, with the highest proportion at low angles, indicating the coexistence of extensive annealing recrystallization and substructures (e.g., subgrains and dynamic recrystallization) induced by severe deformation (rolling). To further investigate the presence of various microstructures,
Figure 1e presents the Grain Reference Orientation Deviation (GROD) distribution. The fraction of GROD < 1° is 35.9%, suggesting the existence of recrystallized grains with a corresponding volume fraction. The range 1° < GROD < 5° (23.9%) corresponds to substructures such as dislocation cells, low-angle grain boundaries, and partial recrystallization, while GROD > 5° (40.2%) represents deformed grains with high dislocation density, pronounced orientation gradients, and elevated stored energy, which are prone to act as nucleation sites for recrystallization. For further clarification,
Figure 1f provides the Kernel Average Misorientation (KAM) map of the scanned region. A comparison between GROD and KAM distributions reveals that regions with high GROD values coincide with those exhibiting high KAM values, confirming the simultaneous presence of recrystallized grains, grain substructures, and deformed grains in the specimen. This observation implies the potential existence of significant preferred orientation, leading to anisotropic mechanical behavior.
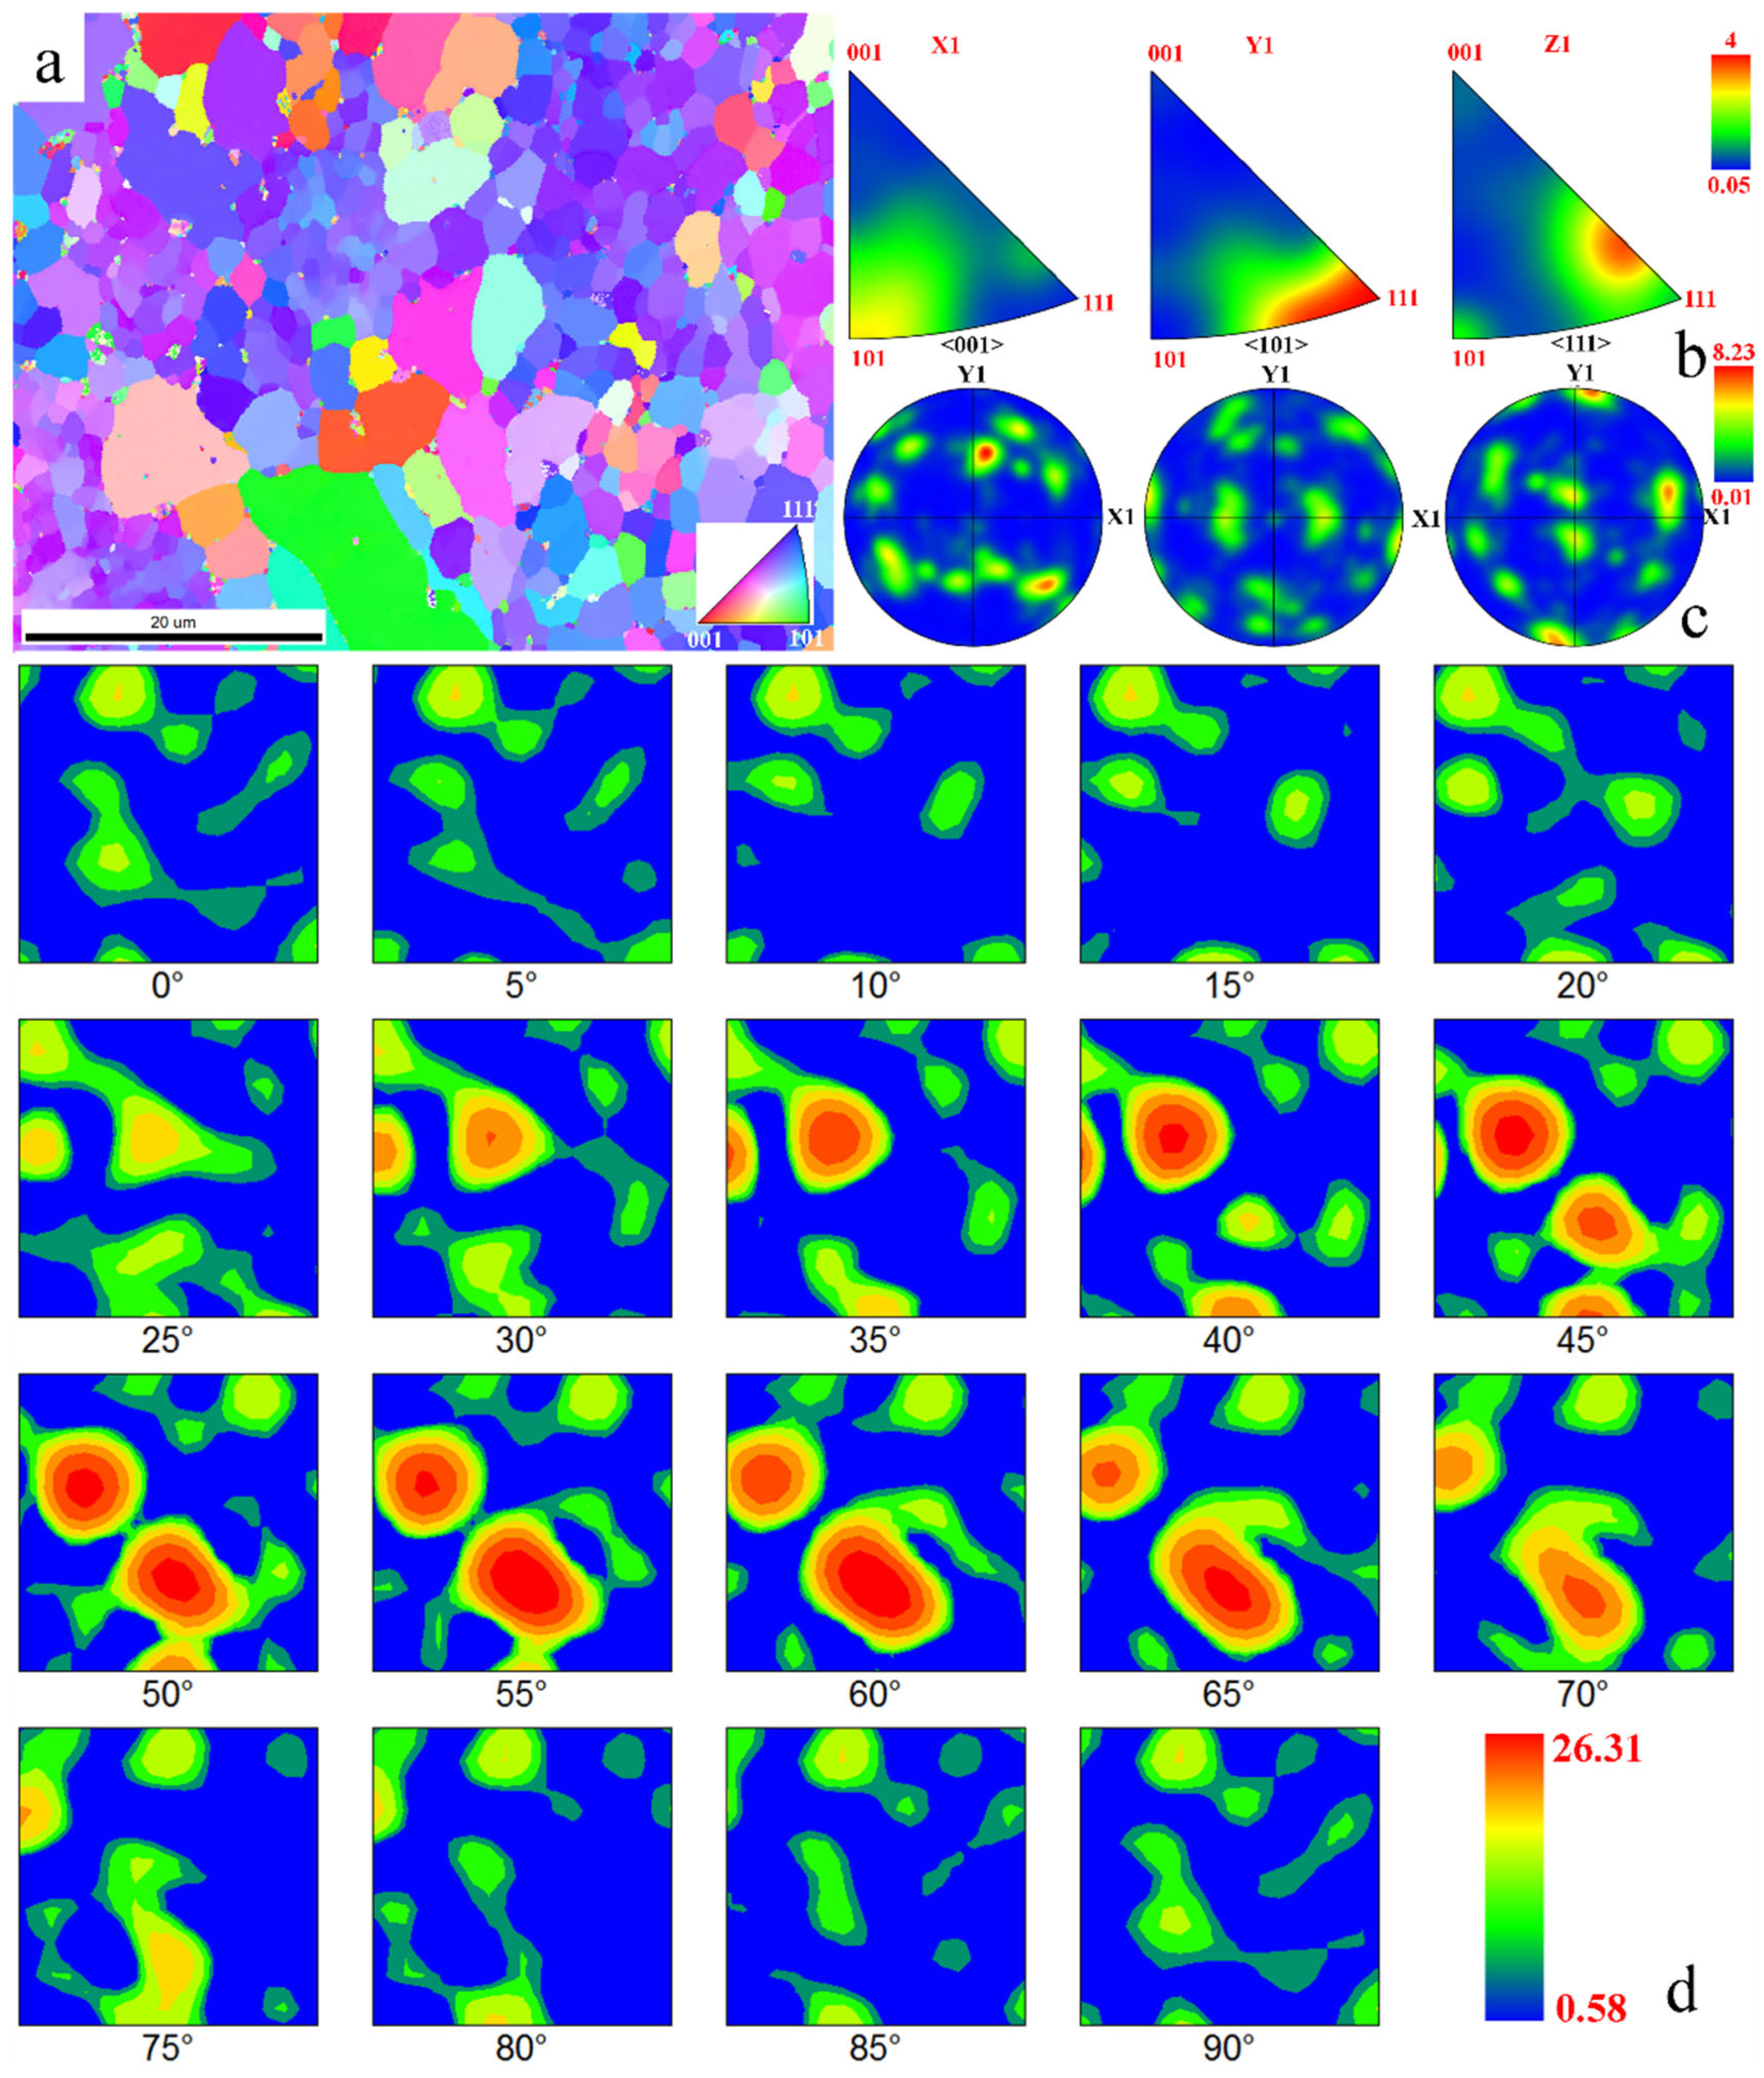
Figure 2 presents the inverse pole images (EBSD-IPFx), IPF maps, and pole images of the primary phases in the specimen. As shown in
Figure 2a, the grain orientations in the scanned region exhibit limited randomness, with a discernible <111>||RD texture. Additionally, an analysis of
Figure 2b–d confirms the presence of {111}<112>, <110>||RD, <001>||RD, and brass textures. The {111}<112> texture, a γ-fiber texture, typically forms during recrystallization after cold rolling and annealing. The <110>||RD texture, an α-fiber texture, usually arises from partial recrystallization post cold rolling. The <001>||RD cubic texture is commonly associated with recrystallization annealing, while the brass texture, a deformation texture induced by plane strain during cold rolling, is a primary contributor to material plastic anisotropy. The <111>||RD texture also predominantly originates from cold rolling, primarily due to the activation of {110} and {112} slip systems, which promote <111> alignment along the rolling direction (RD). For the ferritic steel studied here, different textures exert varying influences on mechanical properties, necessitating further analysis of the distribution of distinct texture components.
Therefore,
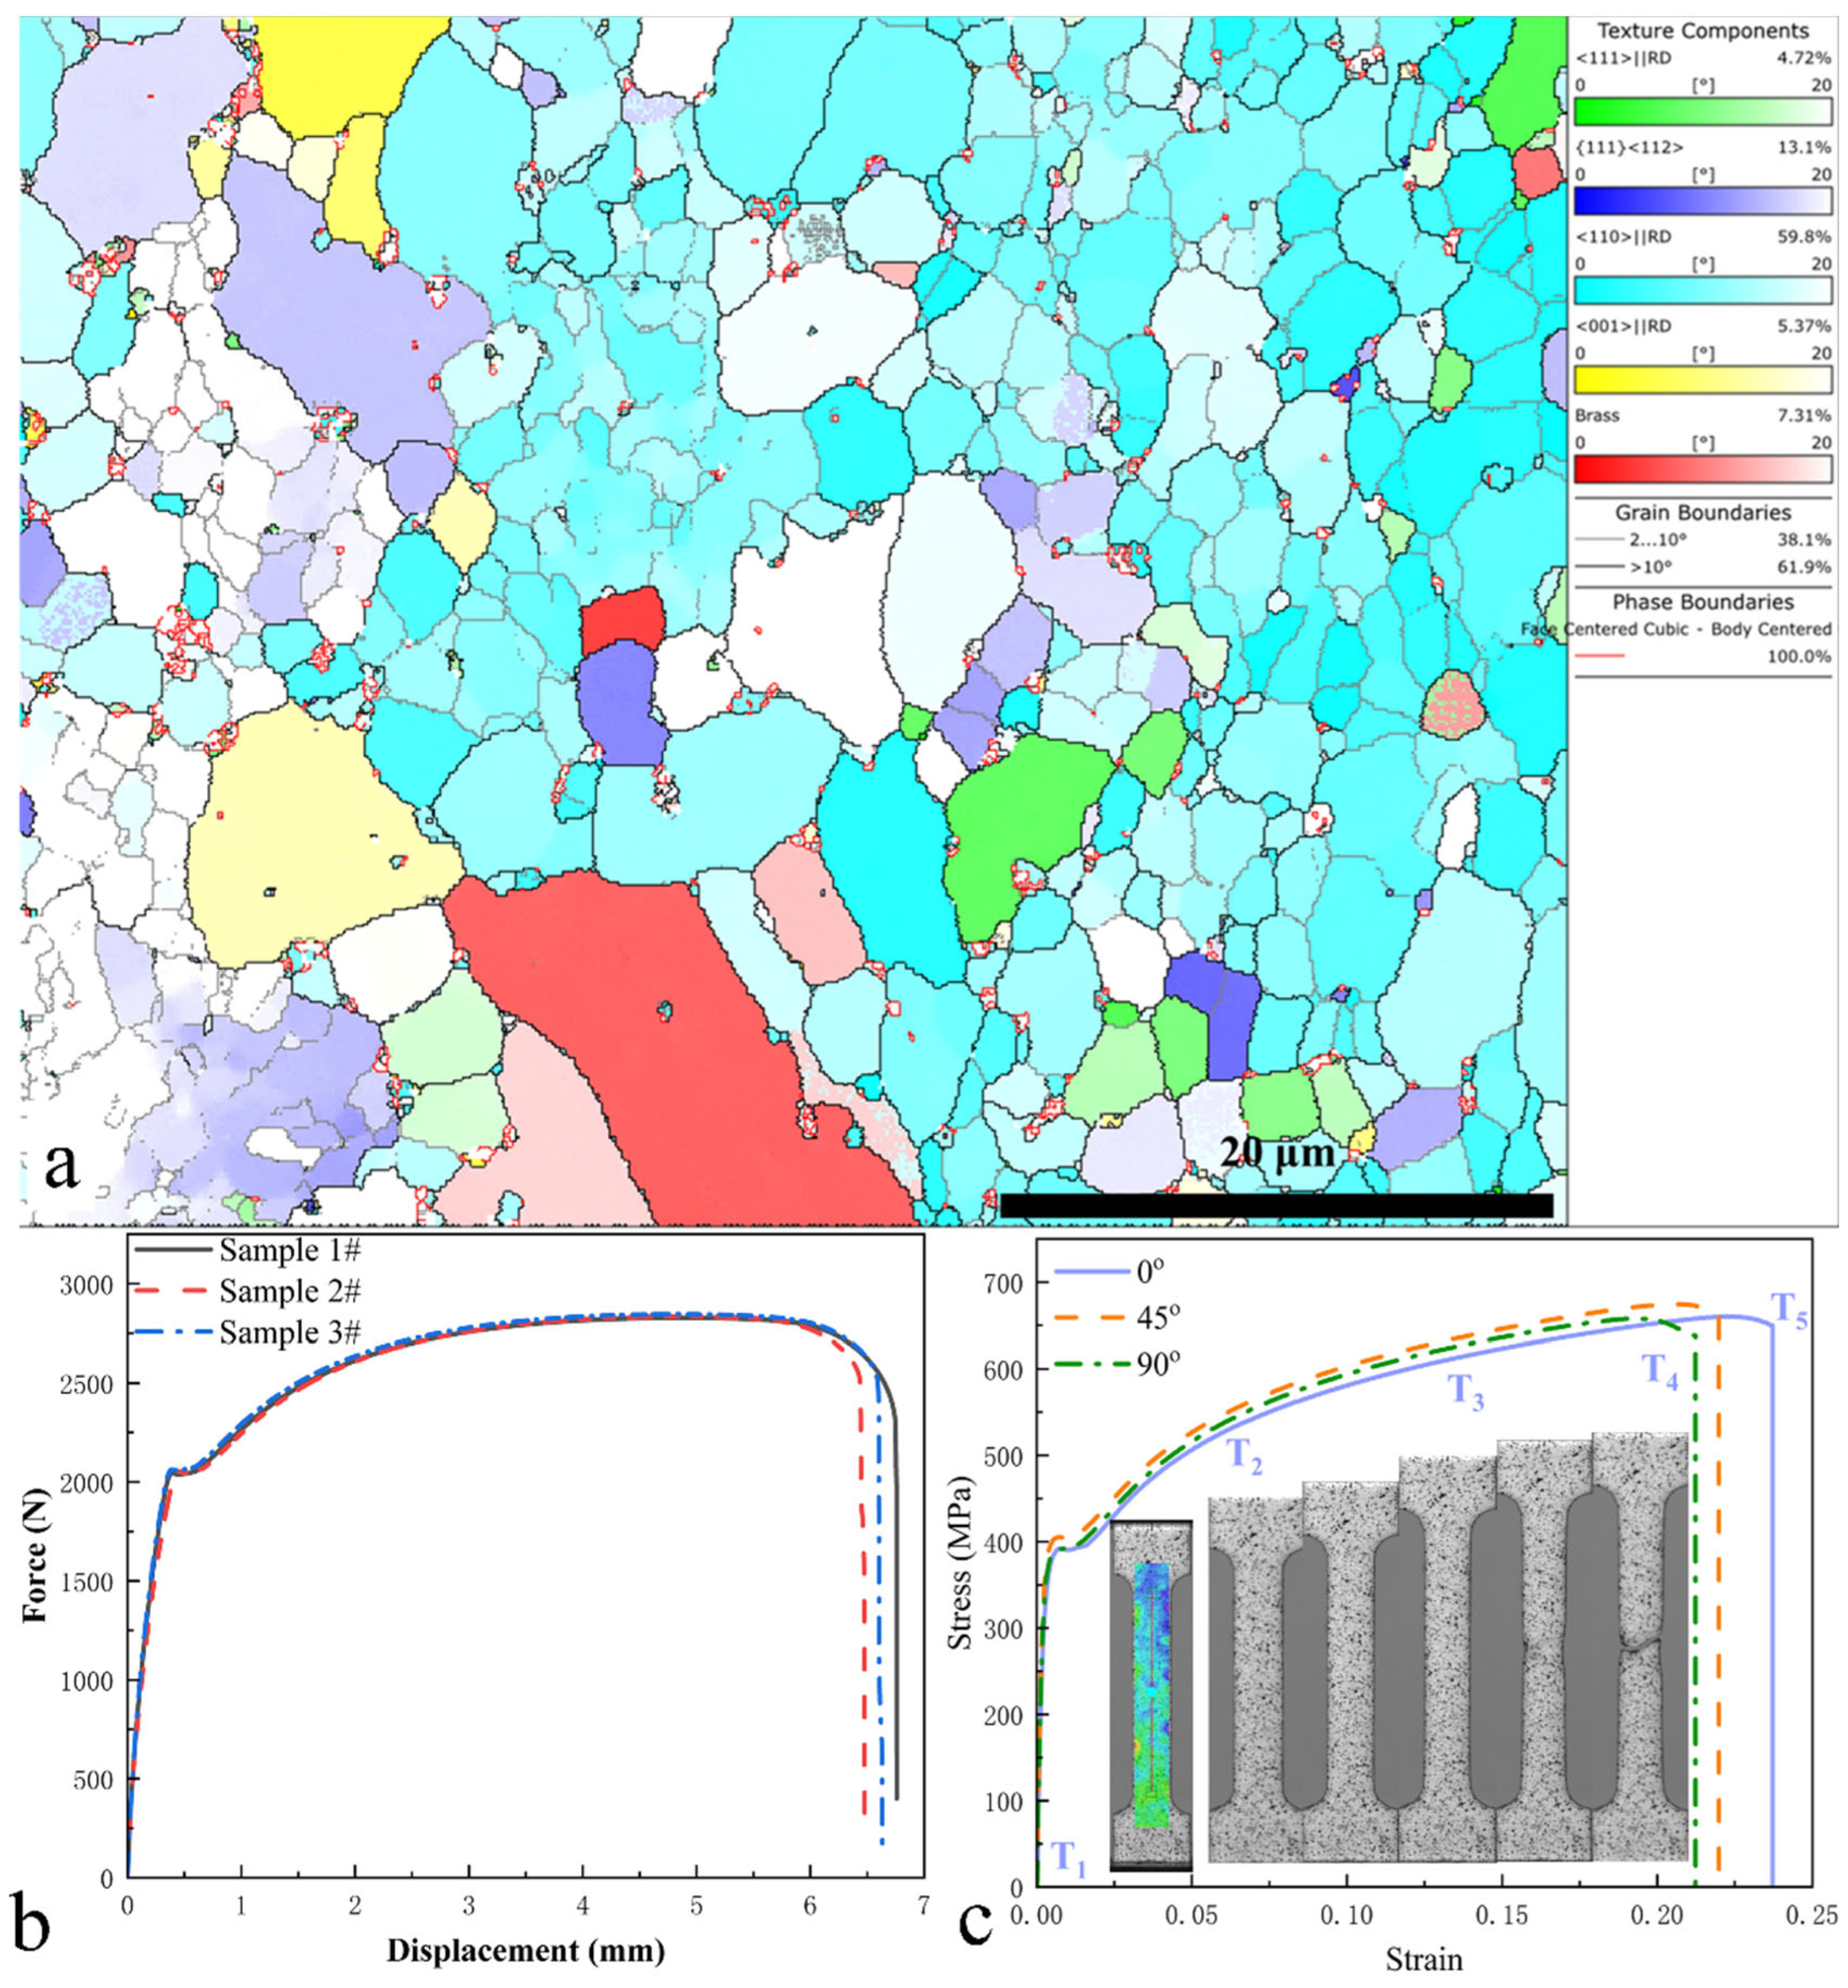
Figure 3a presents the texture distribution of the ferritic steel, dominated by the α-fiber texture <110>||RD (accounting for 59.8%), while the γ-fiber texture {111}<112> constitutes 13.1%, which is beneficial for deep-drawing formability. Additionally, minor components include <111>||RD (4.72%), <001>||RD (5.37%), and the brass texture {110}<112> (7.31%). These results demonstrate that the cold-rolled ferritic steel exhibits significant preferential orientation at the mesoscale, inevitably leading to anisotropic macroscopic mechanical properties. Consequently, it is necessary to investigate the mechanical behavior of specimens with different orientations, and the corresponding constitutive model must account for anisotropic characteristics. In addition, the strong <110>||D texture (≈59.8%) indicates that the local coordinate system of most grains is rotated relative to the global RD-TD-ND coordinate system by approximately 45° within the RD-TD plane. Under this texture condition, the three tested orientations correspond to specific local crystallographic directions: 0° (RD) corresponds to the [101] direction in the local grain coordinate system, 45° corresponds to the [010] direction, and 90° corresponds to the [210] direction. For a cubic crystal system, these three orientations effectively sample the primary mechanical responses of grains governed by the <110>||D texture. Therefore, testing at 0°, 45°, and 90° is considered sufficient to capture the orientation-dependent mechanical behavior of such material.
3.2. Anisotropic Stress–Strain Relations and Constitutive Modeling
Accordingly,
Figure 3b presents the tensile load–displacement curves of different ferritic steel specimens, demonstrating good repeatability in the tensile data. Mechanical tests were subsequently conducted along three orientations relative to the rolling direction: 0°, 45°, and 90°. By integrating the load data from the testing machine and strain measurements obtained via digital image correlation (DIC), the stress–strain curves for the ferritic steel tensile specimens along these orientations were derived, as shown in
Figure 3c. It should be noted that the strain values were determined using DIC technology by calculating the average strain over the virtual gauge length (illustrated in the inset of
Figure 3c), employing the true strain formulation, while the corresponding stress was computed by dividing the load cell data by the initial cross-sectional area of the specimen and applying the true stress conversion. The stress–strain data for specimens with different orientations (right panel) reveal pronounced plastic anisotropy in the material. Notably, while the elastic response remains orientation-independent, the plastic regime exhibits significant orientation dependence in terms of initial yield strength, strain hardening behavior, and fracture characteristics. Furthermore,
Figure 3c includes deformation images captured throughout the loading process. Overall, the specimens did not undergo severe necking prior to fracture. During early-stage loading, the gauge section deformed uniformly, with only minor cross-sectional contraction observed in the central region at later stages, indicating strain localization, consistent with the eventual fracture location. These observations suggest that the studied ferritic steel exhibits ductile fracture characteristics akin to those of modern advanced high-strength steels (AHSSs). The fracture strain of ferritic steel at 0°, 45°, and 90° are found to be 0.237, 0.220, and 0.212, respectively, which indicates the orientation-related fracture behavior. Consequently, modeling its failure behavior necessitates consideration of stress-state effects.
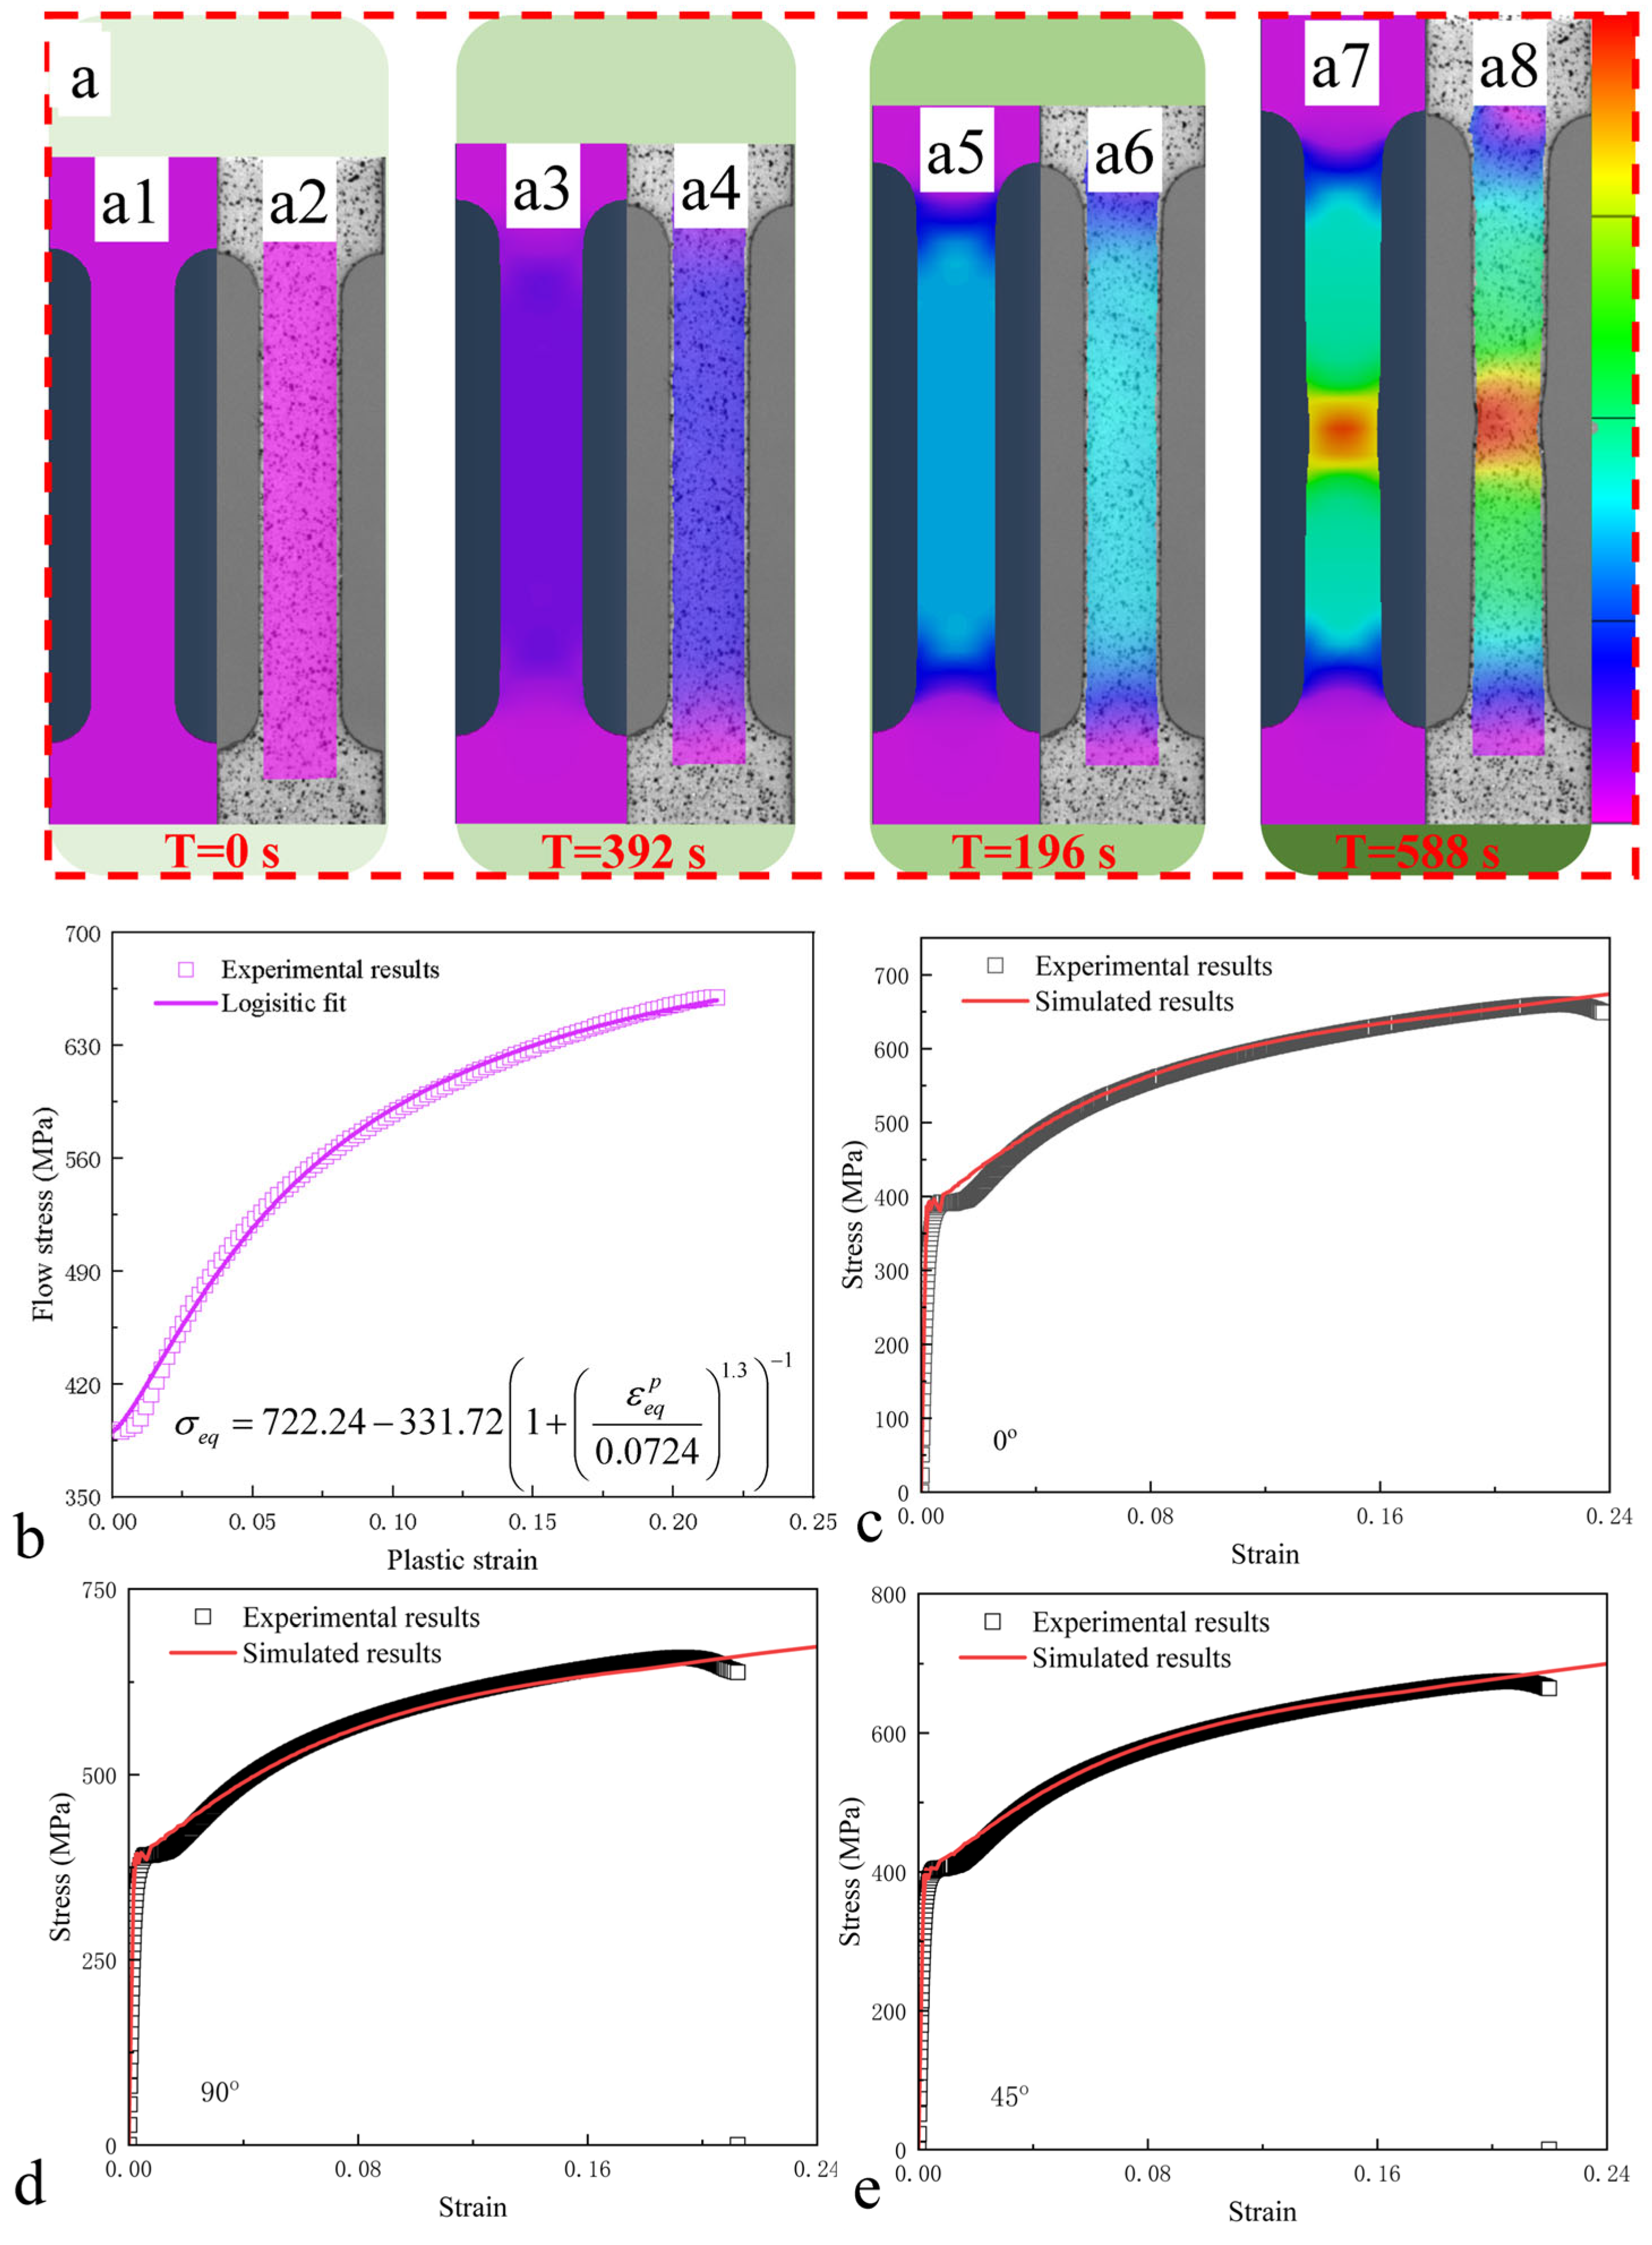
Figure 4a presents the strain field distribution of the ferritic steel specimen throughout the deformation process, with
Figure 4(a2,a4,a6,a8) displaying the results obtained from DIC experiments. The strain distribution indeed confirms the aforementioned observation that the deformation remains nearly uniform across the gauge section during early loading stages, with strain localization occurring only in later stages until fracture initiation. To characterize the anisotropic plastic behavior of the ferritic steel, this study employs the Hill48 anisotropy criterion, which is widely adopted for engineering metallic materials. Under a general stress state, the Hill48 yield criterion takes the following form:
where
,
F,
G,
H,
L,
M, and
N are equivalent stress and anisotropic parameters.
,
,
,
,
, and
are normal stress components and in-plane shear stress components described in the coordinate system of RD-TD-ND. In a 2D situation, the Hill48criterion can be written as:
Then, the anisotropic parameters in Equation (1) can be obtained through the following equations:
where
,
,
, and
are the initial yield strength of ferrite steel specimens at different orientations, i.e., 0°, 45°, 90°, and equal biaxial tension, respectively. In order to calibrate the anisotropic parameters,
is assumed to be equal to
[
29,
30]. The initial yield strength of the material is defined as the stress corresponding to a 0.2% offset strain, from which the yield strengths of ferritic steel with different orientations and the anisotropic parameters based on Hill48 criterion can be obtained as listed in
Table 1. It should be emphasized that the anisotropic yield parameters of the material adopted in this work remain constant during plastic flow. This implies that the hardening behavior is described solely by the formula shown in
Figure 4b, while the shape of the yield surface remains fixed. In other words, the constitutive modeling framework employed in this study is constructed based on the concept of initial anisotropic yield geometry combined with isotropic hardening.
To accomplish the anisotropic constitutive modeling of the ferritic steel, a continuous description of the material’s strain hardening behavior is required. The tensile flow stress-plastic strain curve of the ferritic steel specimen at an orientation of 0° was fitted using a Logistic function through the Levenberg–Marquardt algorithm, with the fitting results presented in
Figure 4b, demonstrating that the Logistic function effectively captures the strain hardening characteristics of the ferritic specimen. To validate the predictive accuracy of the adopted constitutive model for the tensile behavior of ferritic material, numerical simulations of tensile tests for specimens with different orientations were performed by implementing the developed ferritic steel constitutive relationship into ABAQUS via VUMAT, incorporating the return mapping algorithm combined with the associated flow rule.
The yield criterion based on the Hill48 function can be written as:
Then, the flow direction can be obtained based on the assumption of the associated flow rule:
For homogeneous function, the quantitative relation between increments of equivalent plastic strain
and the increment of plastic multiplier
can be derived with consideration of the principle of plastic work equivalence:
Furthermore, the specific form of
can be obtained as:
where
is the elastic modulus tensor and the hardening modulus
can be expressed as:
Therefore, given the explicit return mapping algorithm:
Therefore, the built constitutive model can be carried out in ABAQUS to simulate the tension behavior of ferritic steel specimens at various orientations.
Figure 4c–e display the comparisons between experimental and numerical results in the stress–strain curve at the loading directions of 0°, 45°, and 90°, respectively. Results show that the experimental data agrees well with the numerical results which indicates the reliability of constitutive relations. In addition,
Figure 4a displays the strain distribution contours of the ferritic steel under tensile loading (0° orientation) at different loading stages, where
Figure 4(a1,a3,a5,a7) correspond to numerical simulation results, while
Figure 4(a2,a4,a6), and 4(a8) represent experimental results. It can be seen that the simulations based on the built anisotropic constitutive model reproduce the experimental results. This phenomenon further corroborates that the established material constitutive model can effectively predict the mechanical behavior of the material. In addition, at the onset of necking (
Figure 4a), the ultimate tensile strength is approximately 657 MPa. At this stage, the FEM results show a maximum strain of 0.20566 in the necking zone, while the DIC results give a maximum strain of 0.19708, corresponding to an error of approximately 4.4%. Therefore, it can be concluded that the established FEM model can effectively predict the anisotropic mechanical behavior of the ferritic steel.
3.3. Fracture Behaviors
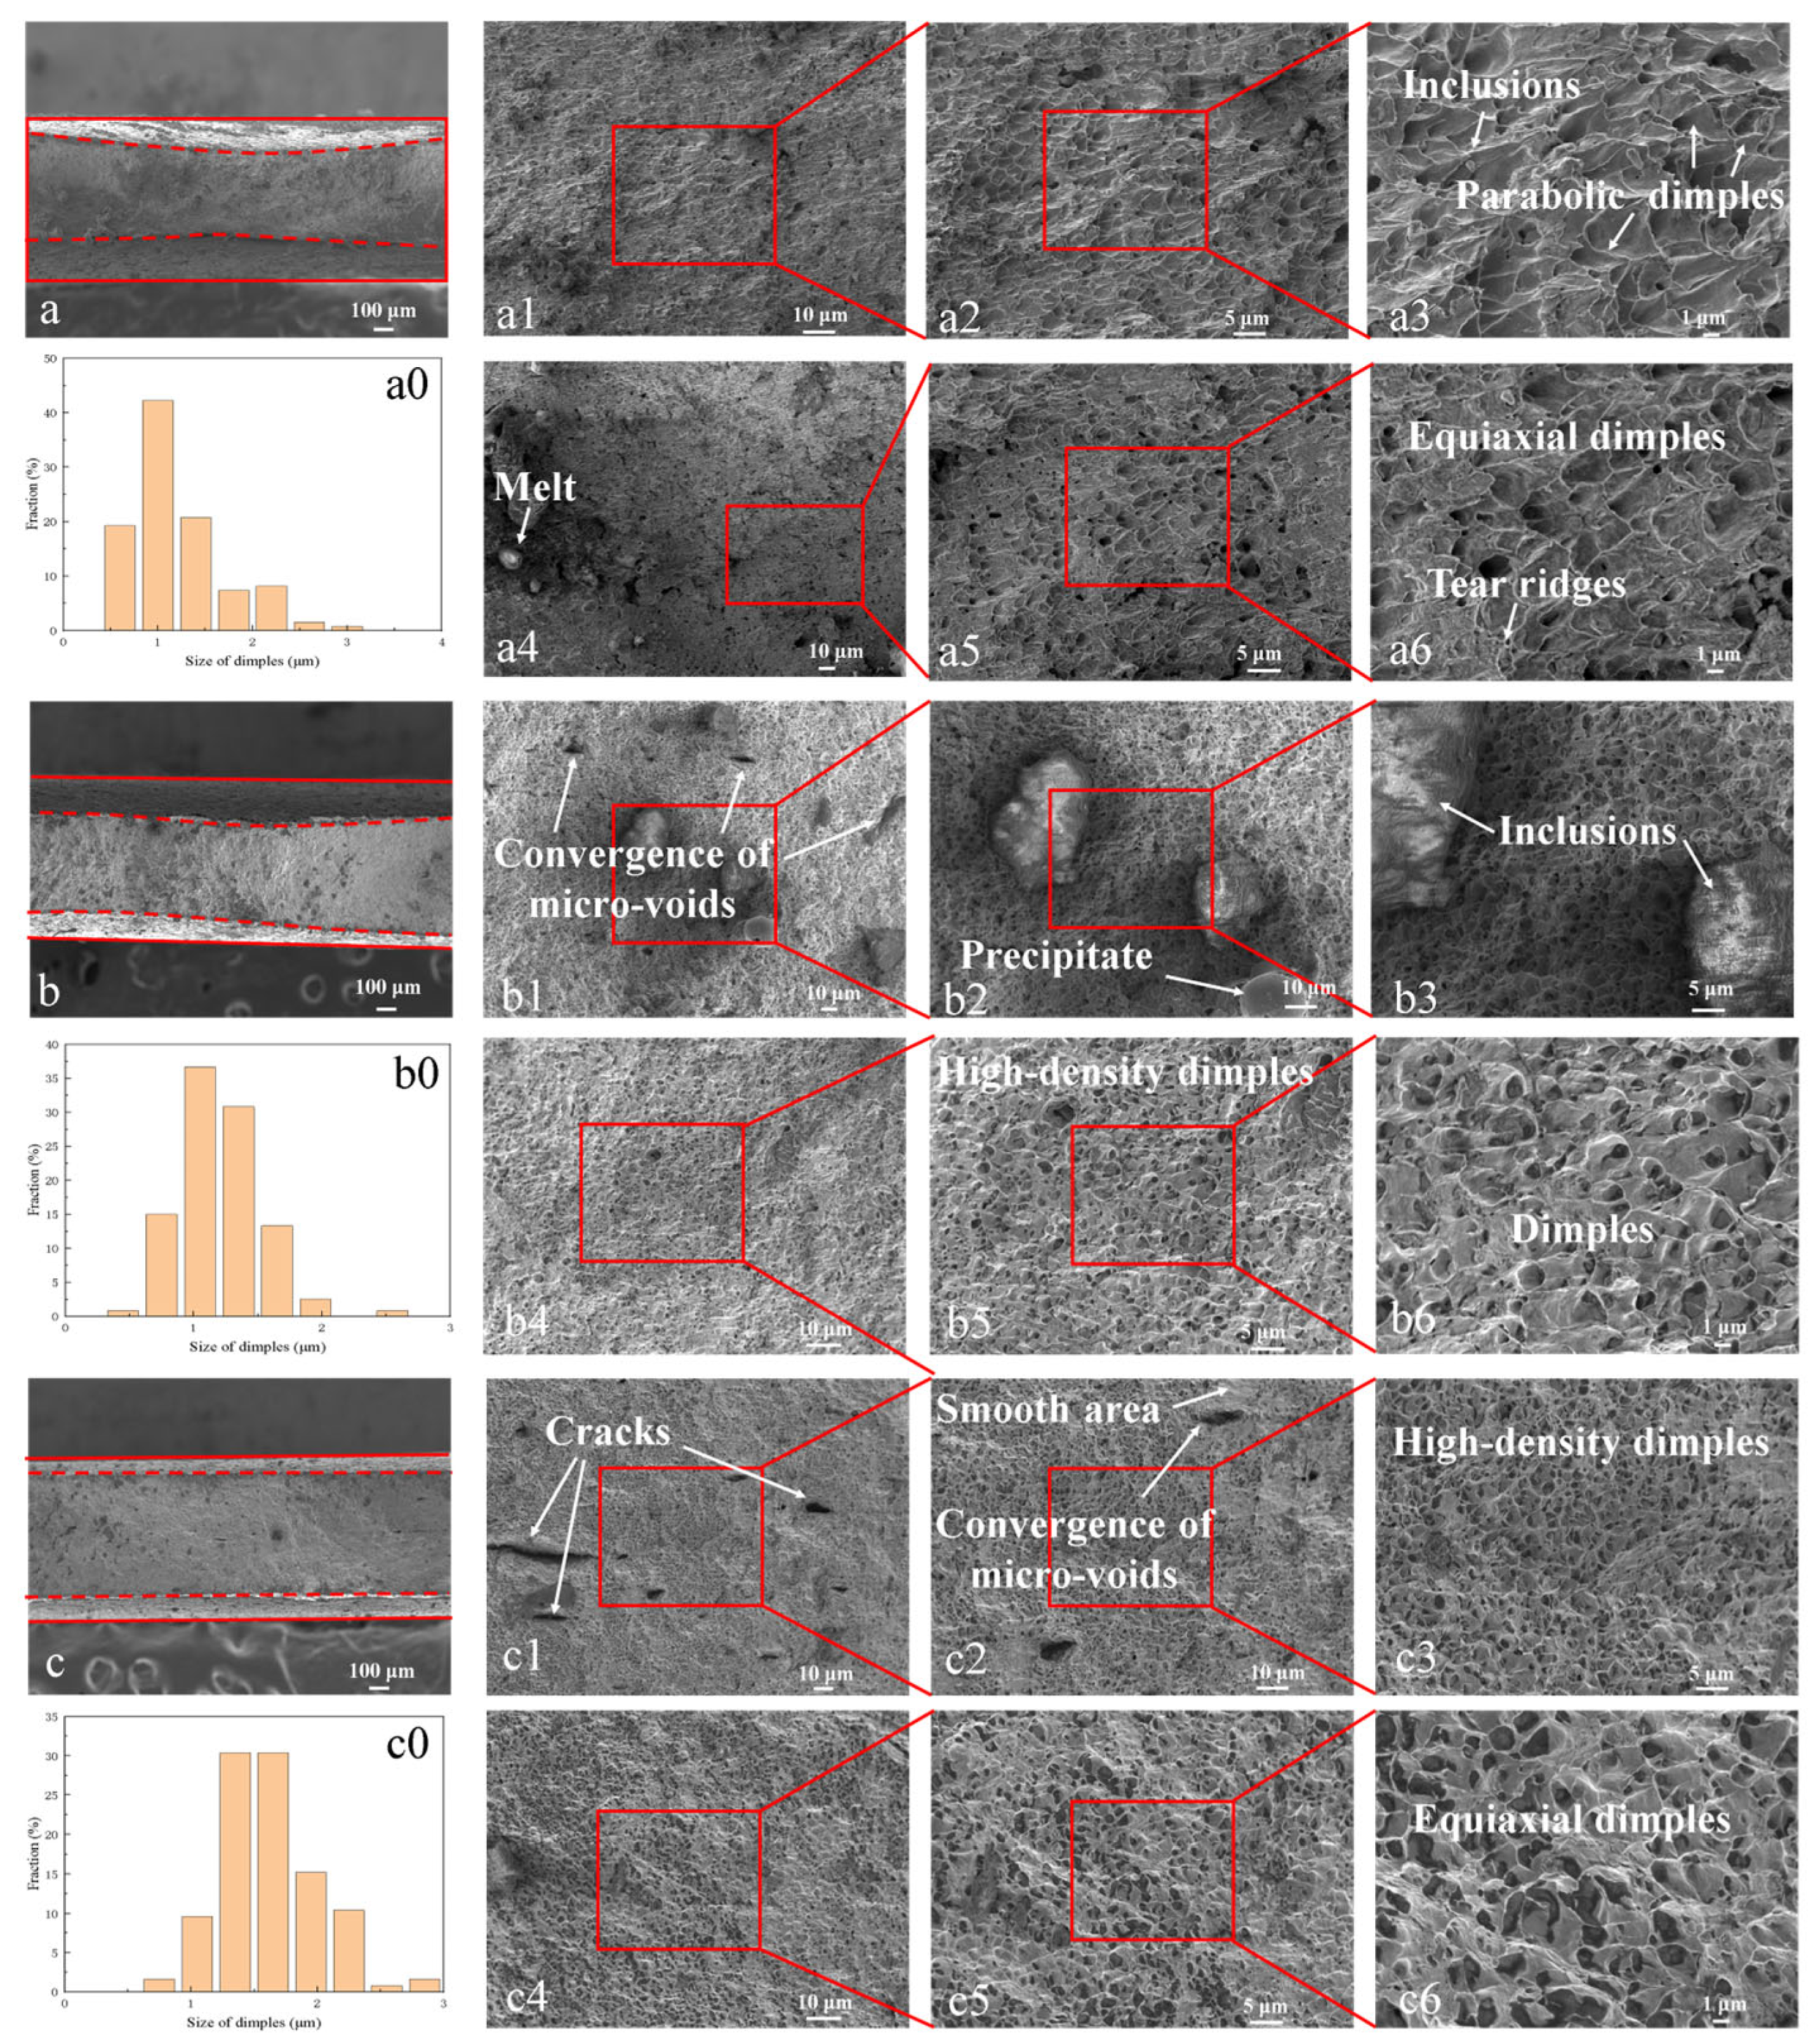
Figure 5 presents SEM images of fracture morphologies for ferritic steel specimens with different orientations after tensile failure. Overall, all specimens exhibit ductile fracture characteristics regardless of orientation. For the 0° orientation, the macroscopic fracture surface appears flat with noticeable thickness reduction at the central region, while the lateral edges show less pronounced contraction, resulting in a “thick ends-thin middle” cross-sectional profile as clearly visible in
Figure 5a. The red dashed lines in
Figure 5a–c indicate the post-fracture cross-sectional boundaries, whereas the solid red lines represent the initial specimen geometry. The fracture surface predominantly consists of dimples, including both parabolic and equiaxed types, suggesting a mixed tensile-shear fracture mechanism. For the 0° specimen, the average dimple size on the fracture surface is approximately 1.18 μm, with a maximum measured size of 3.14 μm and a minimum of 0.46 μm within the statistical range. The detailed size distribution is presented in
Figure 5(a0). The absence of second-phase particles at dimple bottoms indicates that dimple nucleation primarily occurred at grain boundaries. Additional features include localized melting and scattered inclusions (identified as precipitates based on their surface distribution rather than dimple-bottom locations).
The 45° orientation specimen displays similar overall contraction but with distinct anisotropic deformation characteristics, exhibiting an asymmetric “thick-thin” cross-section instead of symmetrical necking. Microscopic examination reveals microvoid coalescence, second-phase particles (~25 μm), smooth-surfaced precipitates (~20 μm), and high-density dimples of both parabolic and equiaxed types. The average dimple size is approximately 1.21 μm, with a maximum measured size of 2.46 μm and a minimum of 0.52 μm within the statistical range. The detailed size distribution is presented in
Figure 5(b0).
For the 90° orientation, the fracture surface demonstrates uniform thickness reduction with a flat morphology, featuring microcrack coalescence accompanied by smooth cleavage-like planes (attributed to rapid tearing during void linkage) alongside predominant equiaxed dimples, indicating typical tensile-dominated fracture mechanisms. For the 90° specimen, the average dimple size on the fracture surface is approximately 1.6 μm, with a maximum measured size of 2.80 μm and a minimum of 0.71 μm within the statistical range. The detailed size distribution is presented in
Figure 5(c0).
It is worth noting that the observed orientation-dependent fracture behavior may also be rationalized from the perspective of local stress triaxiality evolution during post-necking deformation. The strong α-fiber texture (<110>||RD, ≈59.8%) gives rise to anisotropic plastic flow, which in turn affects the development of the triaxial stress state within the necking region. For the 0° and 90° orientations, the texture promotes a more diffuse neck with lower local stress triaxiality, favoring microvoid coalescence and leading to a predominantly equiaxed dimple morphology and higher fracture strain. In contrast, for the 45° orientation, the texture induces a sharper strain localization and a higher local stress triaxiality in the necked zone, which promotes earlier void nucleation and coalescence under a mixed tensile-shear stress state, resulting in a lower fracture strain (0.220) and a mixture of parabolic and equiaxed dimples.
In addition to the crystallographic characterization, it is worth discussing the possible nature of the precipitates and inclusions observed on the fracture surfaces (
Figure 5), as they are potential void nucleation sites during tensile deformation. In ferritic steels, two common types of secondary phases are typically encountered: Nb-rich carbides (e.g., NbC or (Nb,Ti)
2C) and Fe
2Nb-type or Fe
2(Nb,W)-type Laves phases [
24]. It has been reported that Nb-bearing carbides and Laves phases can co-exist and even undergo mutual transformation during thermal processing. Moreover, coarser Cr-rich carbides are known to act as preferential damage nucleation sites [
14,
31], promoting void nucleation and coalescence under tensile loading. In the present study, the observed inclusions and precipitates vary in size and surface morphology. Although their precise phase identification would require further analytical techniques such as energy-dispersive X-ray spectroscopy (EDS) or transmission electron microscopy (TEM), it is plausible that the finer precipitates correspond to Nb-rich carbides or Laves phases, whereas the larger inclusions may be Cr-rich carbides or complex oxide-based non-metallic inclusions. These second-phase particles, regardless of their specific type, can act as preferential sites for void nucleation by either particle decohesion from the ferrite matrix or particle cracking, thereby contributing to the observed ductile fracture characterized by dimple-dominated morphologies.
3.4. Limitations and Future Work
The present work comprehensively investigates and analyzes the mechanical behavior, deformation characteristics, constitutive modeling, and failure mechanisms of ferritic steel with different crystallographic orientations under tensile loading. The Hill48 criterion is found to be capable of reasonably describing the tensile mechanical properties of ferritic steel. However, the current study has the following limitations: (1) the range of investigated orientations requires expansion to cover a broader angular spectrum; (2) the microstructural evolution during deformation has not been addressed; (3) phase identification of precipitates involved in the fracture mechanisms was not performed; (4) establishing an anisotropic fracture criterion for ferritic steel should be a key focus of future research; (5) the constitutive model adopted in this paper is based on the associated flow rule assumption. This assumption may become invalid when the principal directions of stress and strain are not aligned during plastic flow, which necessitates the additional consideration of an anisotropic plastic potential function to accurately describe the deformation characteristics of the material.
In view of the above limitations, the following research directions are suggested for future work: quasi-in situ or in situ tests should be conducted to investigate the microstructural evolution of ferritic steel during deformation, which would not only enable quantitative analysis of microstructural changes but also help establish a link between microstructure and macroscopic mechanical properties. Furthermore, mechanical tests on ferritic steel under a wider range of testing conditions (e.g., multiaxial stress states) should be carried out to establish a yield criterion that accurately describes the material’s mechanical behavior in the full stress space. Finally, in situ TEM techniques should be employed to analyze the formation mechanisms of precipitates in ferritic steel and their corresponding failure mechanisms.