Article

Electrochemical Analysis of the Corrosion Resistance of the Al-Alloy EN AW-5454-D and Its Welded Joints


1
Faculty of Mechanical Engineering, University of Maribor, Smetanova ulica 17, 2000 Maribor, Slovenia
2
Faculty of Sciences, University of Novi Sad, Trg D. Obradovica 3, 21000 Novi Sad, Serbia
3
Zlatarna Celje d.o.o., Kersnikova ulica 19, 3000 Celje, Slovenia
4
Jožef Stefan Institute, Jamova 39, 1000 Ljubljana, Slovenia
*
Author to whom correspondence should be addressed.
Materials 2026, 19(4), 750; https://doi.org/10.3390/ma19040750
Submission received: 21 January 2026 / Revised: 10 February 2026 / Accepted: 11 February 2026 / Published: 14 February 2026
(This article belongs to the Special Issue Solder Alloys and Metals: From Design to Applications)

Abstract

An electrochemical evaluation of the corrosion resistance of the Al-alloy EN AW-5454-D and its welded joints made by MIG (Metal Inert Gas) and by laser hybrid (LH) welding was performed in this study. All the tested samples had a thickness of 4 mm, whereby all the samples’ surfaces were cleaned with a plasma cleaning process before the electrochemical testing to reduce the impact of contamination. The electrochemical behaviour was investigated in a 3.5 wt.% NaCl electrolyte over exposure periods of 1 h, 7 days, and 30 days using electrochemical methods and surface examination. The results demonstrate that the welding processes (MIG and LH) caused microstructural heterogeneities that reduce the corrosion resistance of the weld. The MIG-welded specimen showed worse properties than the LH-welded specimen in the electrochemical tests, as it had a higher corrosion current density, lower polarisation resistance, and higher layer capacitance. Due to long-term exposure to the immersion solution, despite the reduced susceptibility to uniform corrosion, the Al-alloy samples and their welds remained susceptible to pitting corrosion.

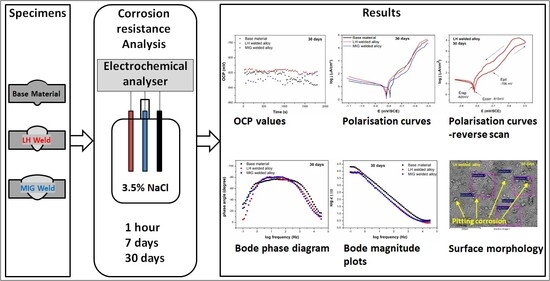
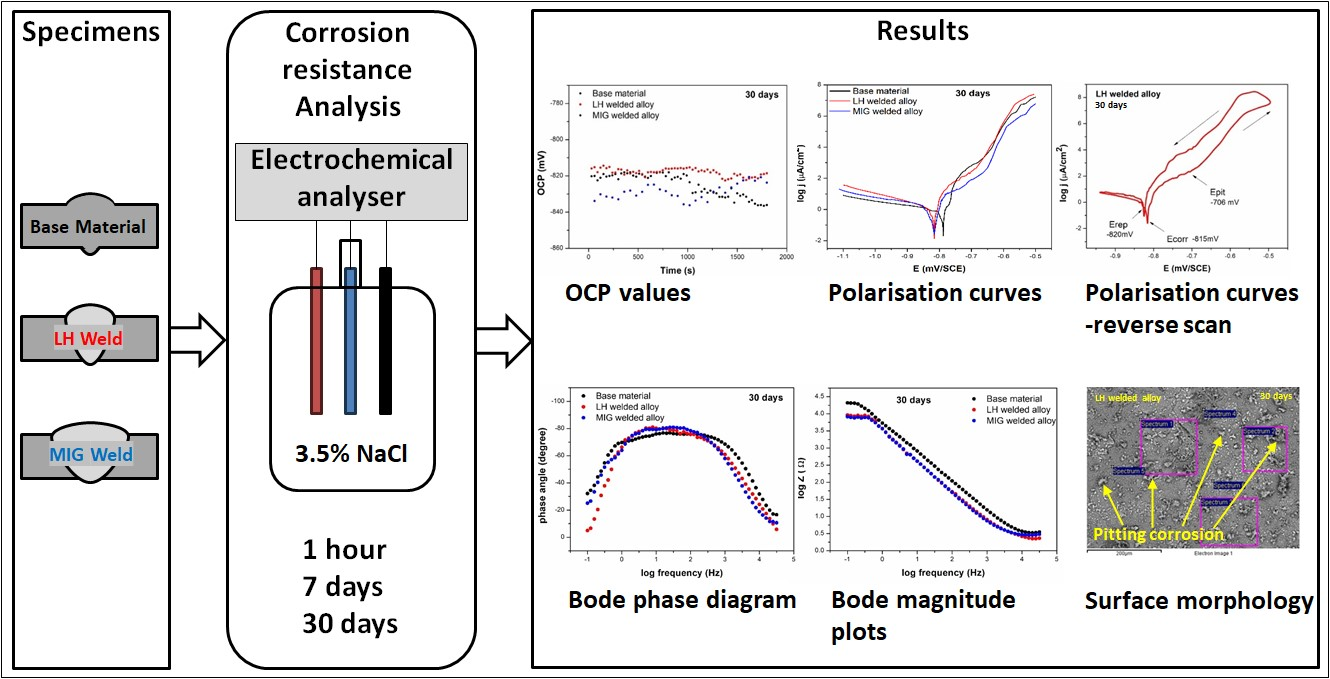
Graphical Abstract

1. Introduction

The properties of the EN AW-5454-D Al-alloy are well known from the scientific literature, such as very good corrosion resistance [1,2,3], good forming behaviour [4], favourable welding characteristics [5], good density-to-load capacity ratio [6,7], and excellent mechanical properties [3,8,9]. All these properties indicate that this Al-alloy is considered a strong candidate for automotive components [10] due to the reduction in weight and environmental footprint [11,12], and, consequently, lower energy consumption required to power vehicles [13]. Since this Al-alloy is corrosion-resistant and weldable, it is used for various chassis components that are joined together by welding.
Laser hybrid welding (LH) [14]: LH has many advantages [15] over conventional welding processes when choosing the optimal welding parameters since it offers higher processing speed and efficiency compared to conventional arc welding [16], provides lower heat input [17,18,19] into the welded joint, and, consequently, reduced microstructural modifications within the heat-affected zone (HAZ) [20,21,22], decreased energy input requirements, superior weld surface quality, and a reduction in welding-related defects [23,24]. Considering the size of the welding equipment, especially the LH welding head, which prevents access to more complex forms of welded parts, LH welding is best for welding long and straight welded joints. By contrast, the Metal Inert Gas (MIG) process offers distinct advantages, such as operational adaptability, high process efficiency, and favourable conditions for mechanisation and automation. The MIG welding process is used widely in automated welding [25]. Due to the relatively simple shape of the MIG torch, the accessibility to the welding site is much better than with LH welding and therefore allows the welding of more complex weld shapes. With the introduction of pulse MIG welding, the weld pool stirring is enhanced, and it allows a finer grain weld structure and better weld properties [25] in comparison to standard MIG welding. A key issue in MIG welding is the occurrence of porosity within the weld metal, which is greater than in LH welding [26,27]. A systematic review conducted by Saifudin et al. [28] argues that Laser–MIG hybrid welding can reduce the porosity in Al welds by appropriate adjustments to the heat input and speed. This review provides literature support for our claim that lower porosity in LH contributes to reduced ionic permeability and more stable barrier layers, consistent with our EIS-based corrosion ranking, LH > MIG.
The Al-alloy designated EN AW-5454-D is included in the 5000 series Al-Mg alloys of work-hardening Al-alloys [29,30]. With thinner sheet metal, the material is more hardened, and therefore has better mechanical properties, which was confirmed in a previous study of the same Al-alloy [27,31].
Thermal input during welding causes microstructural modifications within the heat-affected zone (HAZ), which, in turn, influence the material’s corrosion resistance [32,33,34]. The literature reports numerous studies examining factors that influence the corrosion resistance of Al-alloys. Bunaziv et al. [35] made a comprehensive review of laser beam and laser–arc hybrid welding of Al-alloys, detailing key challenges such as porosity, keyhole stability, and weld heterogeneity, and how hybridisation can mitigate the typical arc welding defects. This review contextualises our finding that LH > MIG in corrosion performance by linking hybrid welding to lower porosity/heterogeneity, which we then quantified mechanistically via EIS (C2, R2) on EN AW 5454 D. In his study, Sinan [1] investigated how rolling-based plastic deformation affects corrosion resistance, reporting an improvement in the corrosion resistance of the deformed Al-alloy. The effect of the degree of deformation on corrosion was investigated using a potentiodynamic test, although such a change was also recorded by corrosion testing. Fraker et al. [2] assessed the corrosion performance of several Al-alloys at elevated temperatures in salt water, and found that the AA5454 Al-alloy was the best among the Al-alloys studied. Yang et al. [36] investigated how changes in welding speed affect the aluminium–lithium alloy (Al-Li) 2195 in an LH process, finding that higher welding speeds led to lower corrosion resistance. In their study, Chandra et al. [37] investigated the impact of friction stir welding (FSW) on the corrosion behaviour of welded EN AW-7075 Al-alloy joints. Frankel & Xia [38] observed how friction stir-welded and arc-welded joints on an AA5454 Al-alloy exhibit different localised corrosion/SCC susceptibilities; FSW generally outperforms arc welding in pitting resistance, with weld process-dependent microstructures driving the differences. Their study underpins our observed hierarchy (BM > LH > MIG) by demonstrating that an arc-welded Al-alloy can be more prone to localised attack, which our EIS (higher C2, lower R2 in MIG) captures after 30 days. Guzmán et al. [39] conducted a comprehensive investigation of the electrochemical corrosion properties and mechanical performance of 6061 aluminium welds in two different heat treatments. The welds were made by MIG arc welding in pulsed mode. Microstructural and phase composition changes led to the formation of a galvanic couple prone to electrochemical corrosion. This effect was more pronounced in the heat-affected zone, whereas the remaining weld regions exhibited predominantly uniform and localised corrosion, as confirmed by electrochemical impedance spectroscopy. The thermal input applied during welding, especially in the HAZ, affects the corrosion resistance negatively. Shah and Badheka [40] evaluated the electrochemical behaviour of the AA 7075-T651 Al-alloy under different process parameters on corrosion performance. The corrosion performance was investigated in compliance with ASTM G-34. The outcomes demonstrated that the heat-affected zone (HAZ) represented the region most prone to corrosion attack. The experimental observations established further that the corrosion resistance of the welded specimens was strongly dependent on the magnitude of the heat input during welding. Welds produced using a lower tool rotational speed, higher welding speed, and a smaller tool diameter displayed superior corrosion resistance. These findings indicate collectively that heat input is the principal parameter governing the corrosion resistance of welded joints. Notably, the lowest corrosion resistance was recorded consistently in the HAZ. Zhou et al. [41] made a comparative study of 5xxx Al–Mg alloys in 3.5 wt.% NaCl, demonstrating passivation with long-term pitting initiation at the intermetallics, and showing how the alloying content shifts the electrochemical metrics (e.g., polarisation resistance, pitting potential). This study supports our pitting-focused interpretation and our use of EIS to separate the outer/inner layer behaviour, aligning with our observation that the microstructure controls the ionic ingress and barrier layer stability in chloride media.
Welded structures from the EN AW-5454-D Al-alloy are used widely in automotive applications, where the winter service exposes underbody components to chloride-bearing aqueous films formed from de-icing salts; warming cycles in garages accelerate corrosive attack further. To reflect these realistic conditions, we subjected both the base Al-alloy and welded joints to controlled chloride exposure and evaluated their corrosion performance in a unified, side-by-side framework.
In this study, we provide a direct, side-by-side corrosion comparison of MIG and LH welds on the EN AW-5454-D Al-alloy in 3.5 wt.% NaCl at three exposure times (1 h/7 d/30 d) [35]. We couple potentiodynamic polarisation with EIS, and derive the outer/inner layer parameters (e.g., C2, R2) to show how the choice of welding process governs the ionic ingress through the porous outer products and the stability of the inner barrier layer, and thus the propensity for pitting [41]. Specifically, after 30 days, the MIG-welded Al-alloy exhibited a distinctly higher inner-layer capacitance (C2) than the LH-welded specimen, which we related to higher permeability and local activation [38]. This fills a gap in prior hybrid-welding work that focused mainly on porosity/mechanics and on other Al series, by adding a quantitative EIS–microstructure link for an EN AW-5454-D Al-alloy [28].

2. Materials and Methods

2.1. Base Material

The Al-alloy was obtained from Speira GmbH (Grevenbroich, Germany) as cold-rolled sheet strips with a thickness of 4 mm, delivered in the O-temper (soft, annealed) [4]. The longitudinally rolled plates were cut to the required dimensions of 50 mm × 500 mm.
Table 1 shows the nominal chemical composition of the supplied EN AW-5454 alloy.

2.2. Filler Material

A massive welding wire, Safra Al Mg2.7Mn (S Al5554—EN ISO 18273 [43]), with a wire diameter of Ø 1.2 mm, supplied by the manufacturer Safra Spa (Travagliato, Italy), was used for welding.
Table 2 shows the chemical composition of the welding wire supplied for the experimental work.

2.3. Welding

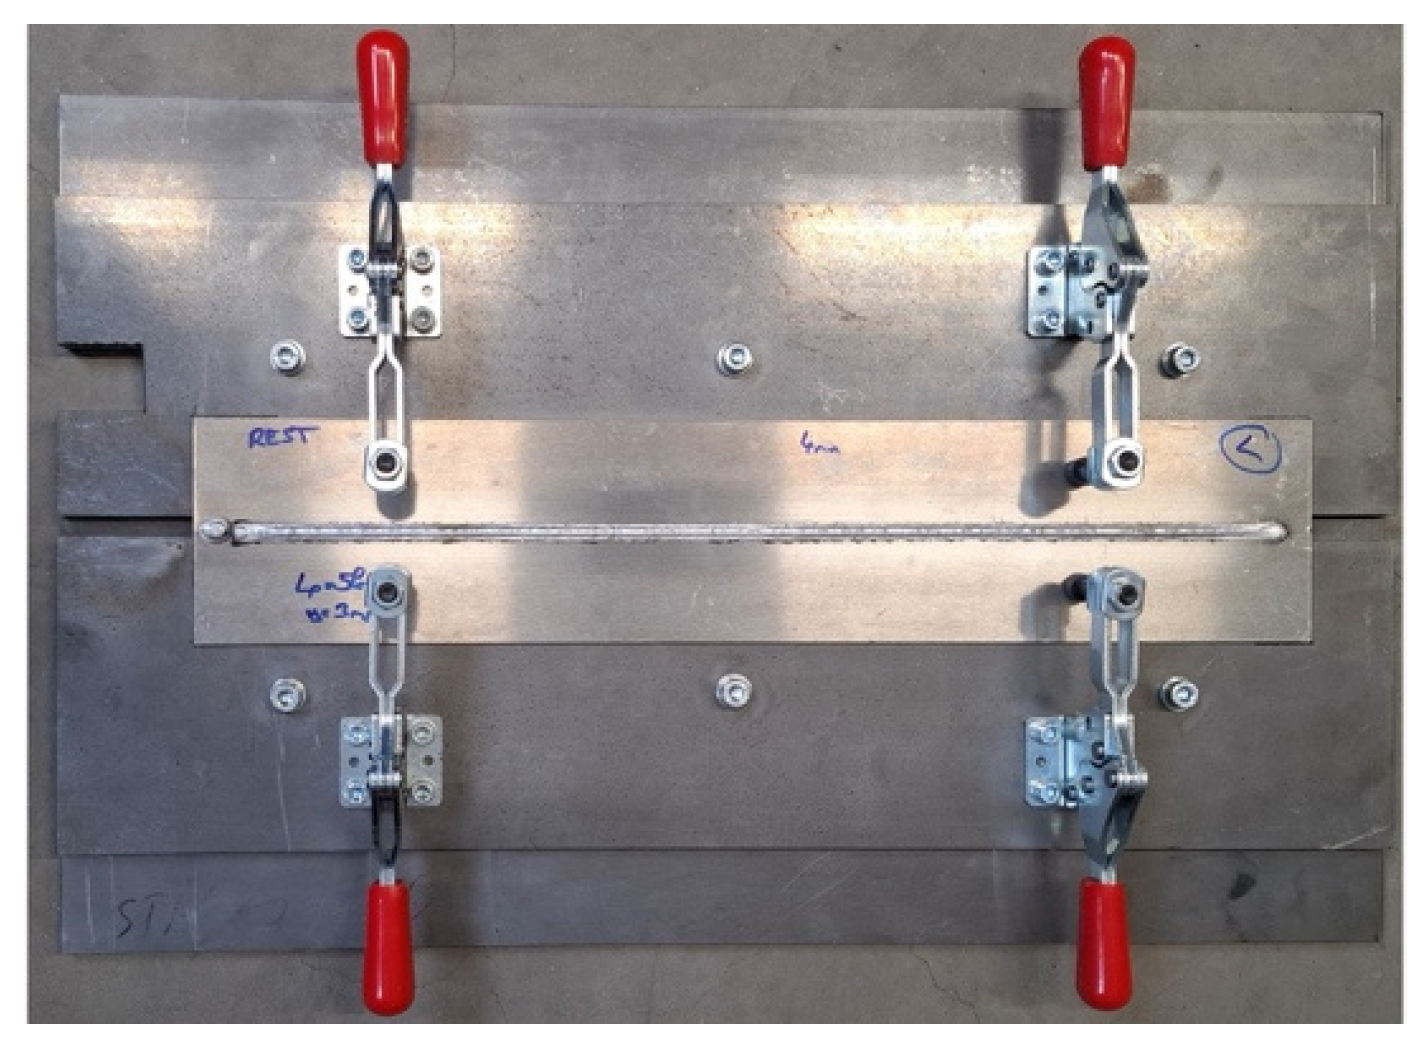
The Al-sheet samples were welded using a robotic system in a designated welding cell to ensure operational safety. The individual elements during the LH and MIG welding are shown in Figure 1. The use of robotic welding required accurate positioning and clamping of the weldments in the fixture, as illustrated in Figure 2.

2.3.1. Performing LH Welding

A laser welding source IPG YLS-10000-S2T with Laser process (continuous, pulsing, Fibre, solid): CW (Continuous Welding) Mode (IPG Laser GmbH, Allershausen, Germany), a welding power source for the synergic MIG welding process: PMC 4181 AC Universal: Fronius iWave500 (Fronius, Wels, Austria), together with a Fronius LH welding head (Fronius, Wels, Austria), were employed for the LH. The LH welding parameters for the butt weld are provided in Table 3.

2.3.2. Performing MIG Welding

A welding source, Fronius TPS 400 i (Fronius, Wels, Austria) with Synergic Line: PMC 4515 DC Universal, was employed for the MIG process. The MIG welding parameters for the butt weld are provided in Table 3.

2.4. Sample Preparation

Rectangular samples were cut roughly by wire erosion from the base material (BM) and the LH- and MIG-welded samples. The shape of the samples of the base material was processed mechanically from a rectangle—the contour of the base material sample imitated the contour (outline) of the welded sample, so that the surface sizes of all the samples were as equal as possible. The contour in the base material was then created with an electric straight sander, and later with a hand file according to the outlined contour.
Holes with a diameter of 1.0 mm were drilled into the samples mechanically, which were used to hang them on a wire in the test medium.

2.5. Characterisation

Microstructural observations and microchemical analyses of the samples were performed using a Scanning Electron Microscope (SEM), model Sirion 400 NC (FEI, Hillsboro, OR, USA), equipped with an Energy-Dispersive X-ray (EDX) spectroscope, INCA 350 (Oxford Instruments, Tubney Woods, Abingdon, Oxfordshire, UK). SEM imaging was performed in both secondary electron (SE) and backscattered electron (BSE) modes at magnifications from 500× to 2500×. An acceleration voltage of 20 kV and an electron beam spot size of 3.0–4.0 were employed to optimise the resolution and contrast. An EDX analysis was carried out over an energy range of 0–20 keV to determine the elemental composition of selected areas. The results were normalised to provide quantitative elemental data.
The BM and LH- and MIG-welded samples were analysed after mechanical processing, chemical and mechanical cleaning, as well as after cleaning with air plasma. Additional SEM investigations were then conducted on the samples after the electrochemical testing. ImageJ software, version 1.54p, was used for image processing and evaluating the amount of surface area of the pitting corrosion.

2.6. Sample Surface Cleaning

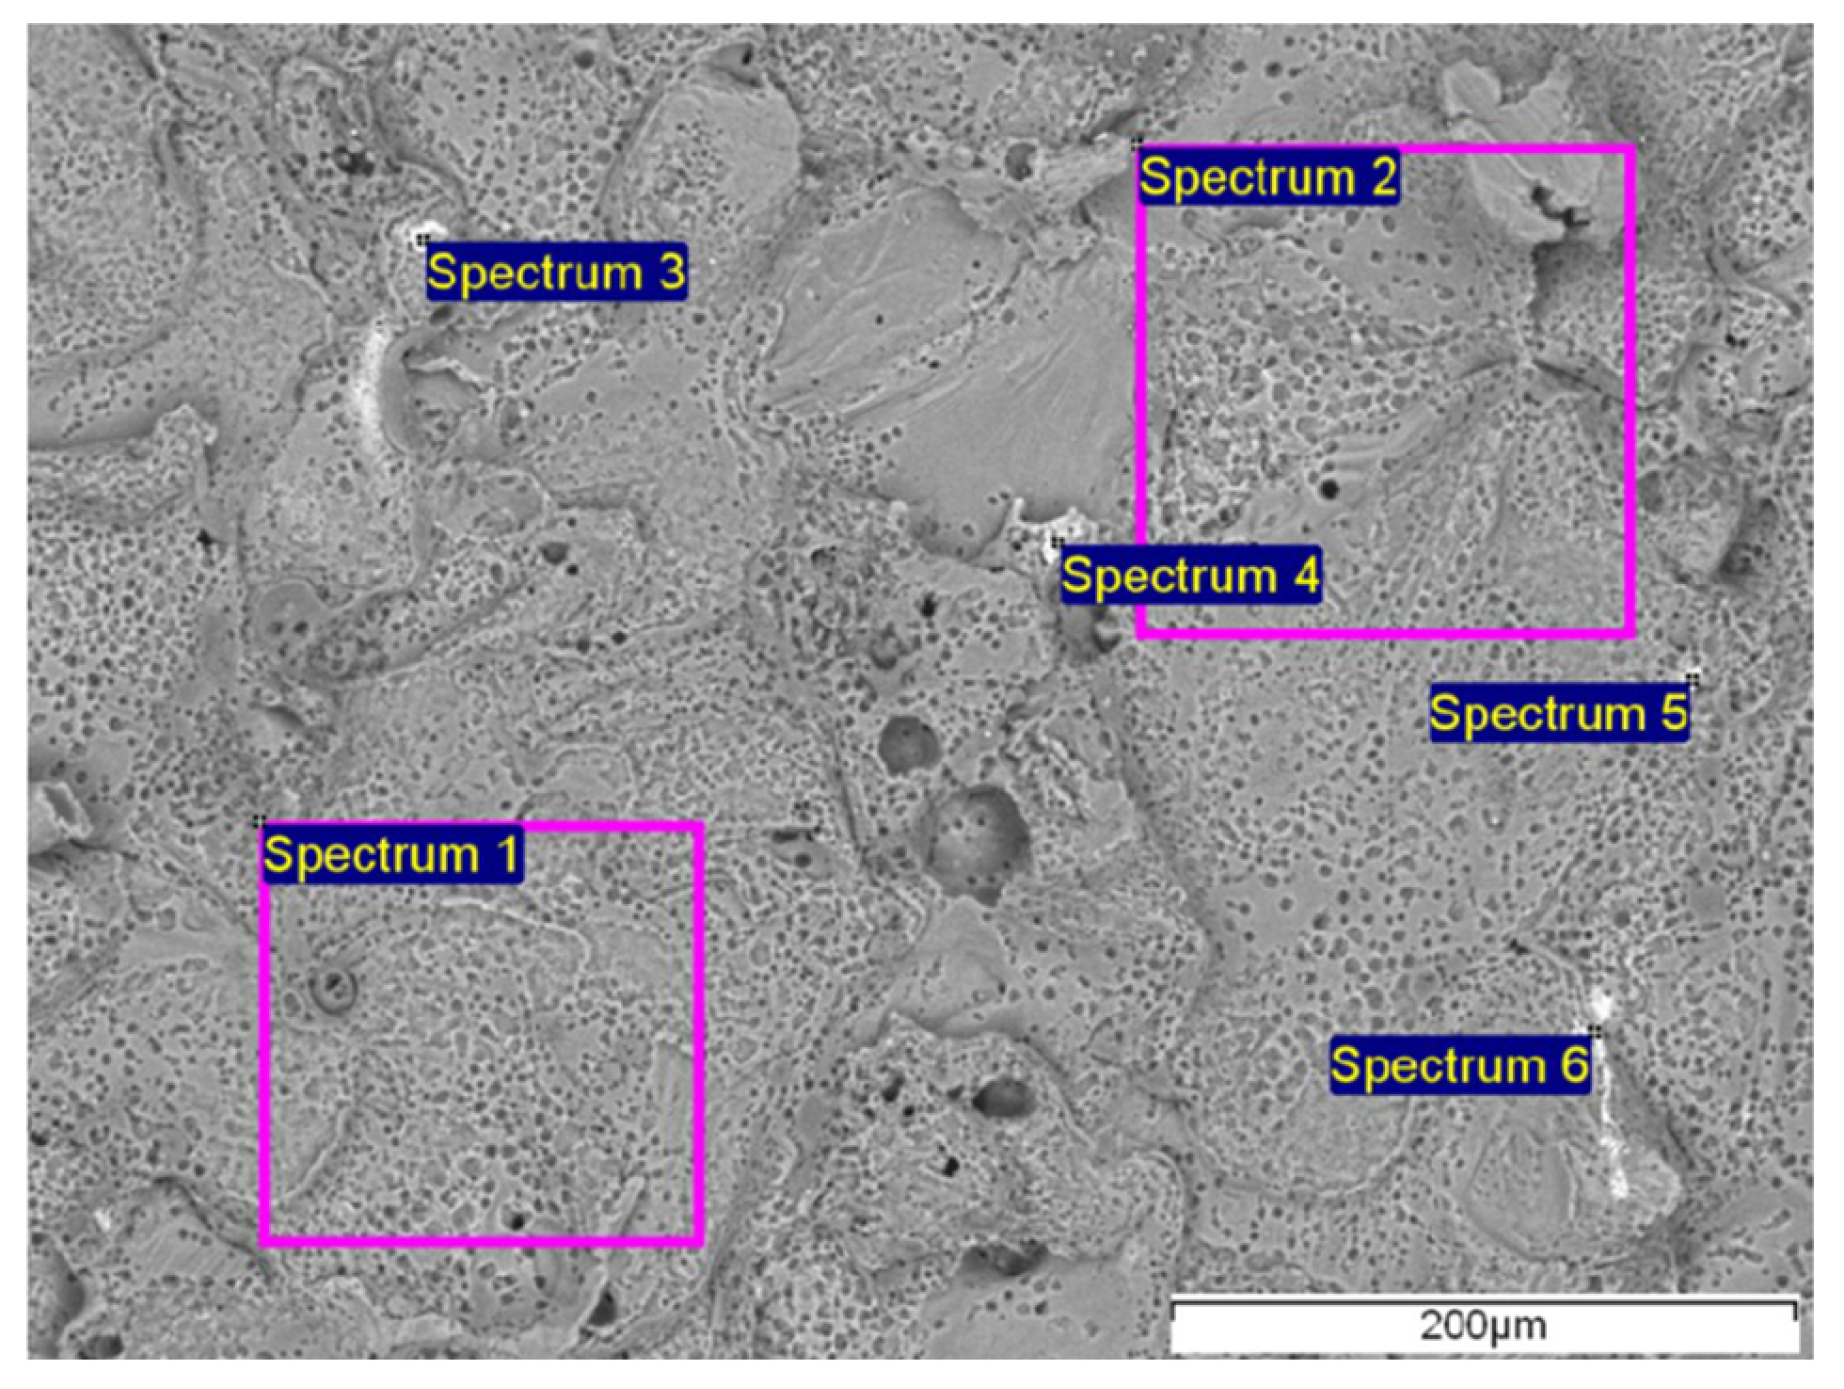
After mechanical processing, the samples were examined by SEM/EDX, which revealed the remains of a cutting tool on the surface (the sample was cut with a hand file-cutting tip made of austenitic steel). Fe was detected on the surface, visible as white particles in Figure 3. Different amounts of Fe were present at the analysed sites. Fe, and in some places Cr, and Mo, were detected (Table 4).
Different cleaning approaches were used to remove these residual elements. The sample surfaces were examined with SEM following the various cleaning approach steps, to confirm that the residual elements had been removed from the sample surfaces.

2.6.1. Chemical Cleaning

The specimens were etched in a 2 vol.% Nital solution (2 vol.% HNO3: 98 vol.% ethanol) etchant for 1 min, and then rinsed with water and dried.
An EDX examination of the samples after the cleaning attempt detected that different amounts of Fe were still present at the analysed sites.

2.6.2. Mechanical Cleaning

Manual polishing of the samples was carried out with Al2O3. The samples were sanded with a 4000 base—each sample for about 10 min. Following the sanding step, the specimens were subjected to ultrasonic cleaning for 5 min. Subsequent polishing was then conducted using 0.05 µm MasterMet colloidal silica paste, approximately 5 min/side/sample.
After the 2nd cleaning attempt with the Nital solution, the samples were examined by EDX, which showed no more Fe residues on the surface.

2.6.3. Cleaning with Air Plasma

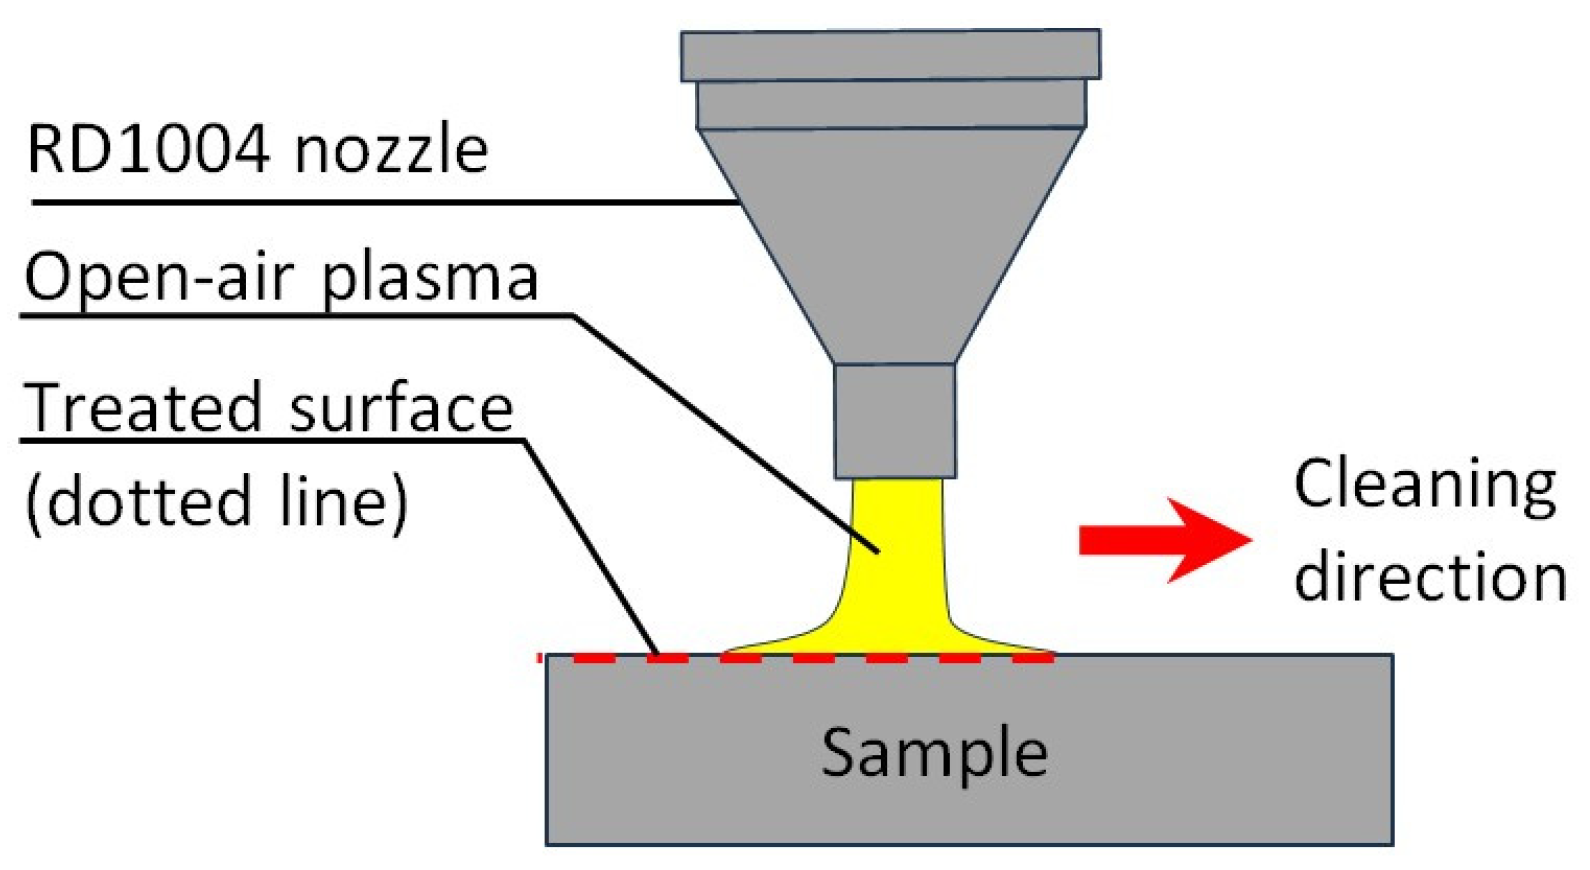
Surface cleaning with air plasma was performed to remove organic contamination from the specimen surfaces, which could otherwise affect the corrosion resistance measurements. A Plasmatreat FG5001 plasma generator, RD1004 nozzle, without rotation, and a table with automated scrolling (Plasmatreat GmbH, Queller Straße 76-80, 33803 Steinhagen, Germany) were used for the surface conditioning.
The compressed-air plasma jet acts primarily as a cleaning and activation tool: the reactive oxygen-containing species generated in the discharge remove the adsorbed hydrocarbons and increase the density of the surface hydroxyl groups. This results in a higher-energy, more wettable surface, while the thickness of the native Al2O3/AlOOH passive film remains essentially unaffected under the mild, air-only settings used in this study. The enhanced hydrophilicity exhibits partial relaxation over time; therefore, all the electrochemical tests were initiated immediately after the plasma treatment to maintain a consistent starting condition [44,45,46].
The plasma activation was employed solely to establish a reproducible and contamination-free surface before immersion in the chloride electrolyte. Under the specific operational parameters listed in Table 5, the jet desorbs organic species without modifying or thinning the native oxide film, thereby improving the surface uniformity across the BM and welded specimens. The removal of handling-related residues improves the wettability and reduces the sample-to-sample variations [44,45].
To prevent the surface ageing effects associated with delayed measurement, all the electrochemical experiments were performed immediately after cleaning. This standardisation step avoids uncontrolled contaminants being superimposed on the chloride environment, and ensures that the observed differences between the MIG- and LH-welded joints originate from weld-related microstructural features rather than from inconsistent surface conditions [44,45].
Table 5 provides the technological specifications for the surface preparation procedure. The sample surface preparation with air plasma is presented in Figure 4.

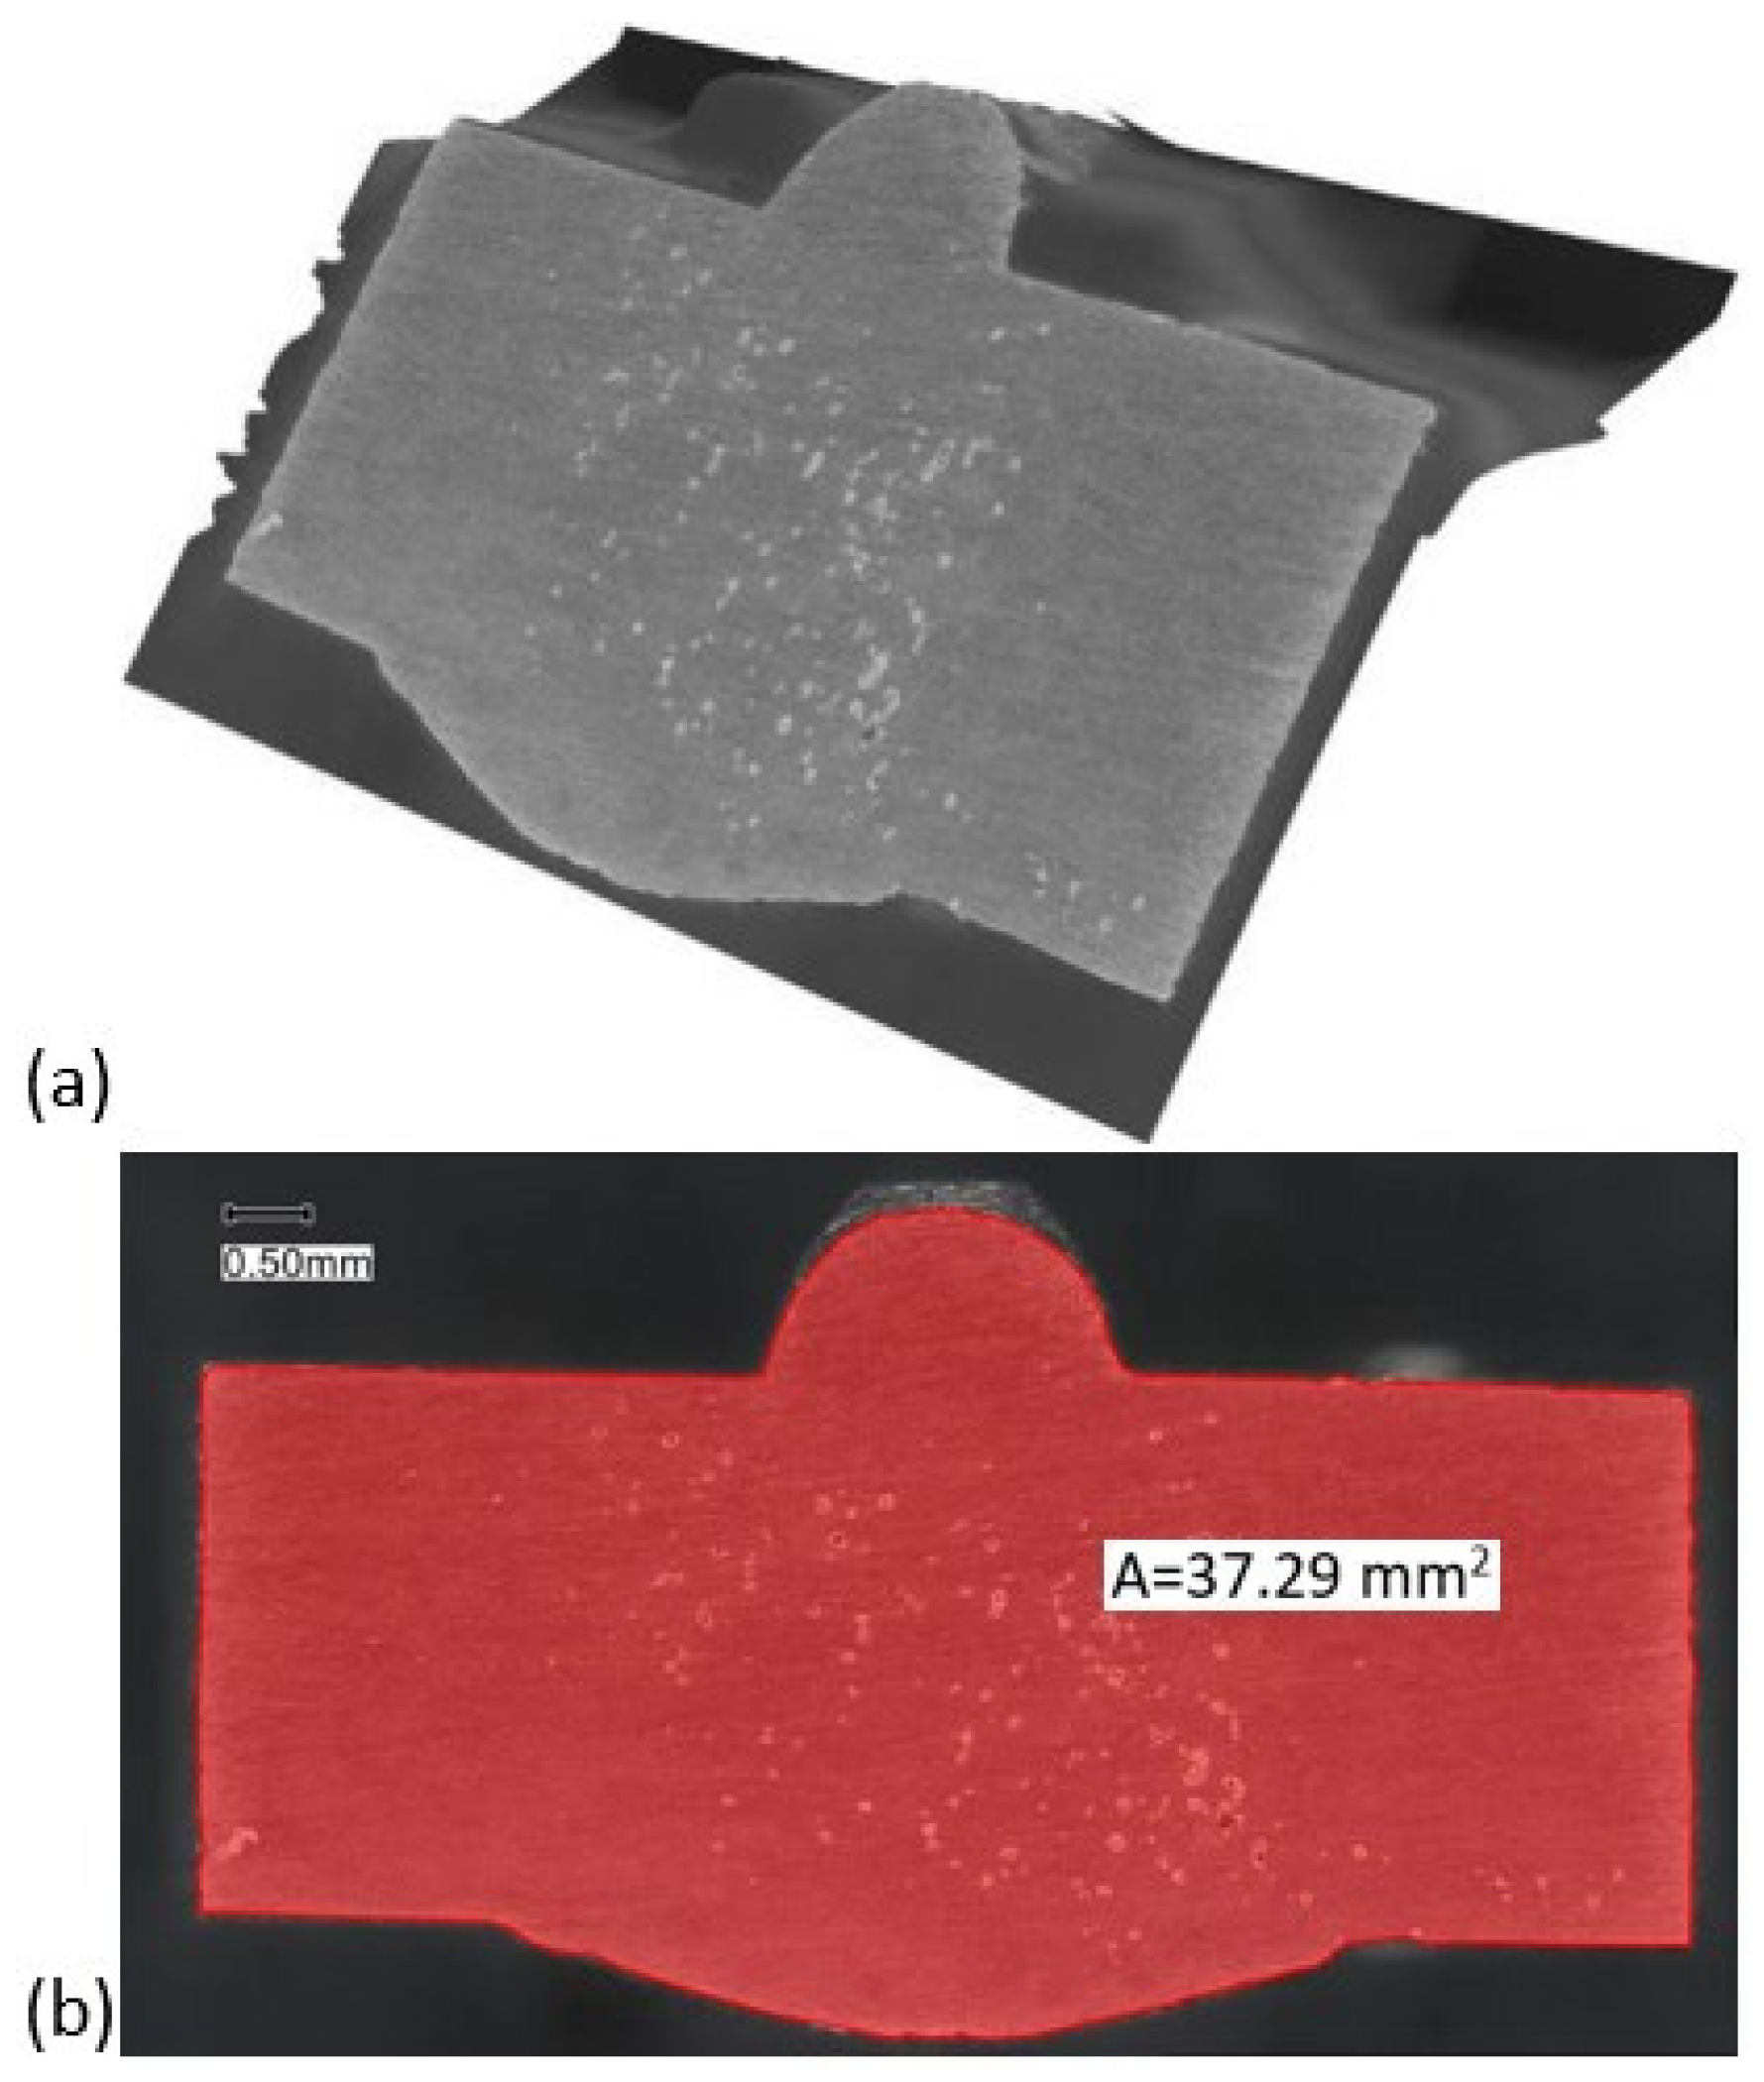
2.7. Sample Surface Area Size Determination

To calculate the polarisation and electric potential, it was necessary to determine all the surfaces of the samples accurately; therefore, the surfaces were captured in 3D using a Keyence VHX-7000 digital microscope (Keyence International, Mechelen, Belgium) with 100× magnification. With the included software, a 2D image was made from the 3D image, as shown in Figure 5. A Poligon function was used to draw a closed curve (points at 0.01 or 0.1 mm) to 0.01 mm precision, and the Area function was used to determine the area (interpolation). An approximation was made on the other side of the sample (×2 of the measured area).

2.8. Electrochemical Testing Procedures

The electrochemical behaviour of three Al-alloys, the BM, LH-welded, and MIG-welded samples, was investigated in a 3.5 wt.% NaCl solution over immersion periods of 1 h, 7 days, and 30 days. The chemical compositions of the tested Al-alloys are listed in Table 6. The NaCl solution was prepared using analytical grade NaCl and distilled water. The electrochemical measurements were performed using a conventional three-electrode cell in a 400 mL open-air beaker. The constant composition of the NaCl solution during the measured period was maintained by monitoring the conductivity of the solution constantly. The working electrode was the tested Al-alloy sample, the counter electrode was a platinum mesh, and the reference electrode was a saturated calomel electrode (SCE). All the potentials are reported versus the SCE. The electrochemical measurements were carried out using a VoltaLab PGZ-301 potentiostat (Radiometer Analytical (A Hach Company Brand), Villeurbanne Cedex, France). Before each test, the open circuit potential (OCP) was monitored for 60 min to ensure that a stable steady state condition was reached. Following the OCP stabilisation, electrochemical impedance spectroscopy (EIS) was conducted at the OCP over a frequency range of 0.1 Hz to 30 kHz with a sinusoidal perturbation amplitude of 10 mV. The EIS data were fitted using the appropriate equivalent circuit models. In the potentiodynamic polarisation tests, the potential was scanned from −1100 mV to 500 mV at a sweep rate of 1 mV/s. The corrosion potential (Ecorr), corrosion current density (jcorr), and polarisation resistance (Rp) were determined from the polarisation curves using Tafel extrapolation, using VoltaMaster 4 software. All the measurements were performed in triplicate.

3. Results and Discussion

3.1. SEM Imaging and EDX Microchemical Analysis

After the mechanical processing of the samples, residual elements from the cutting tool were detected on the surface, which may interfere with further investigations and the electrochemical testing results.
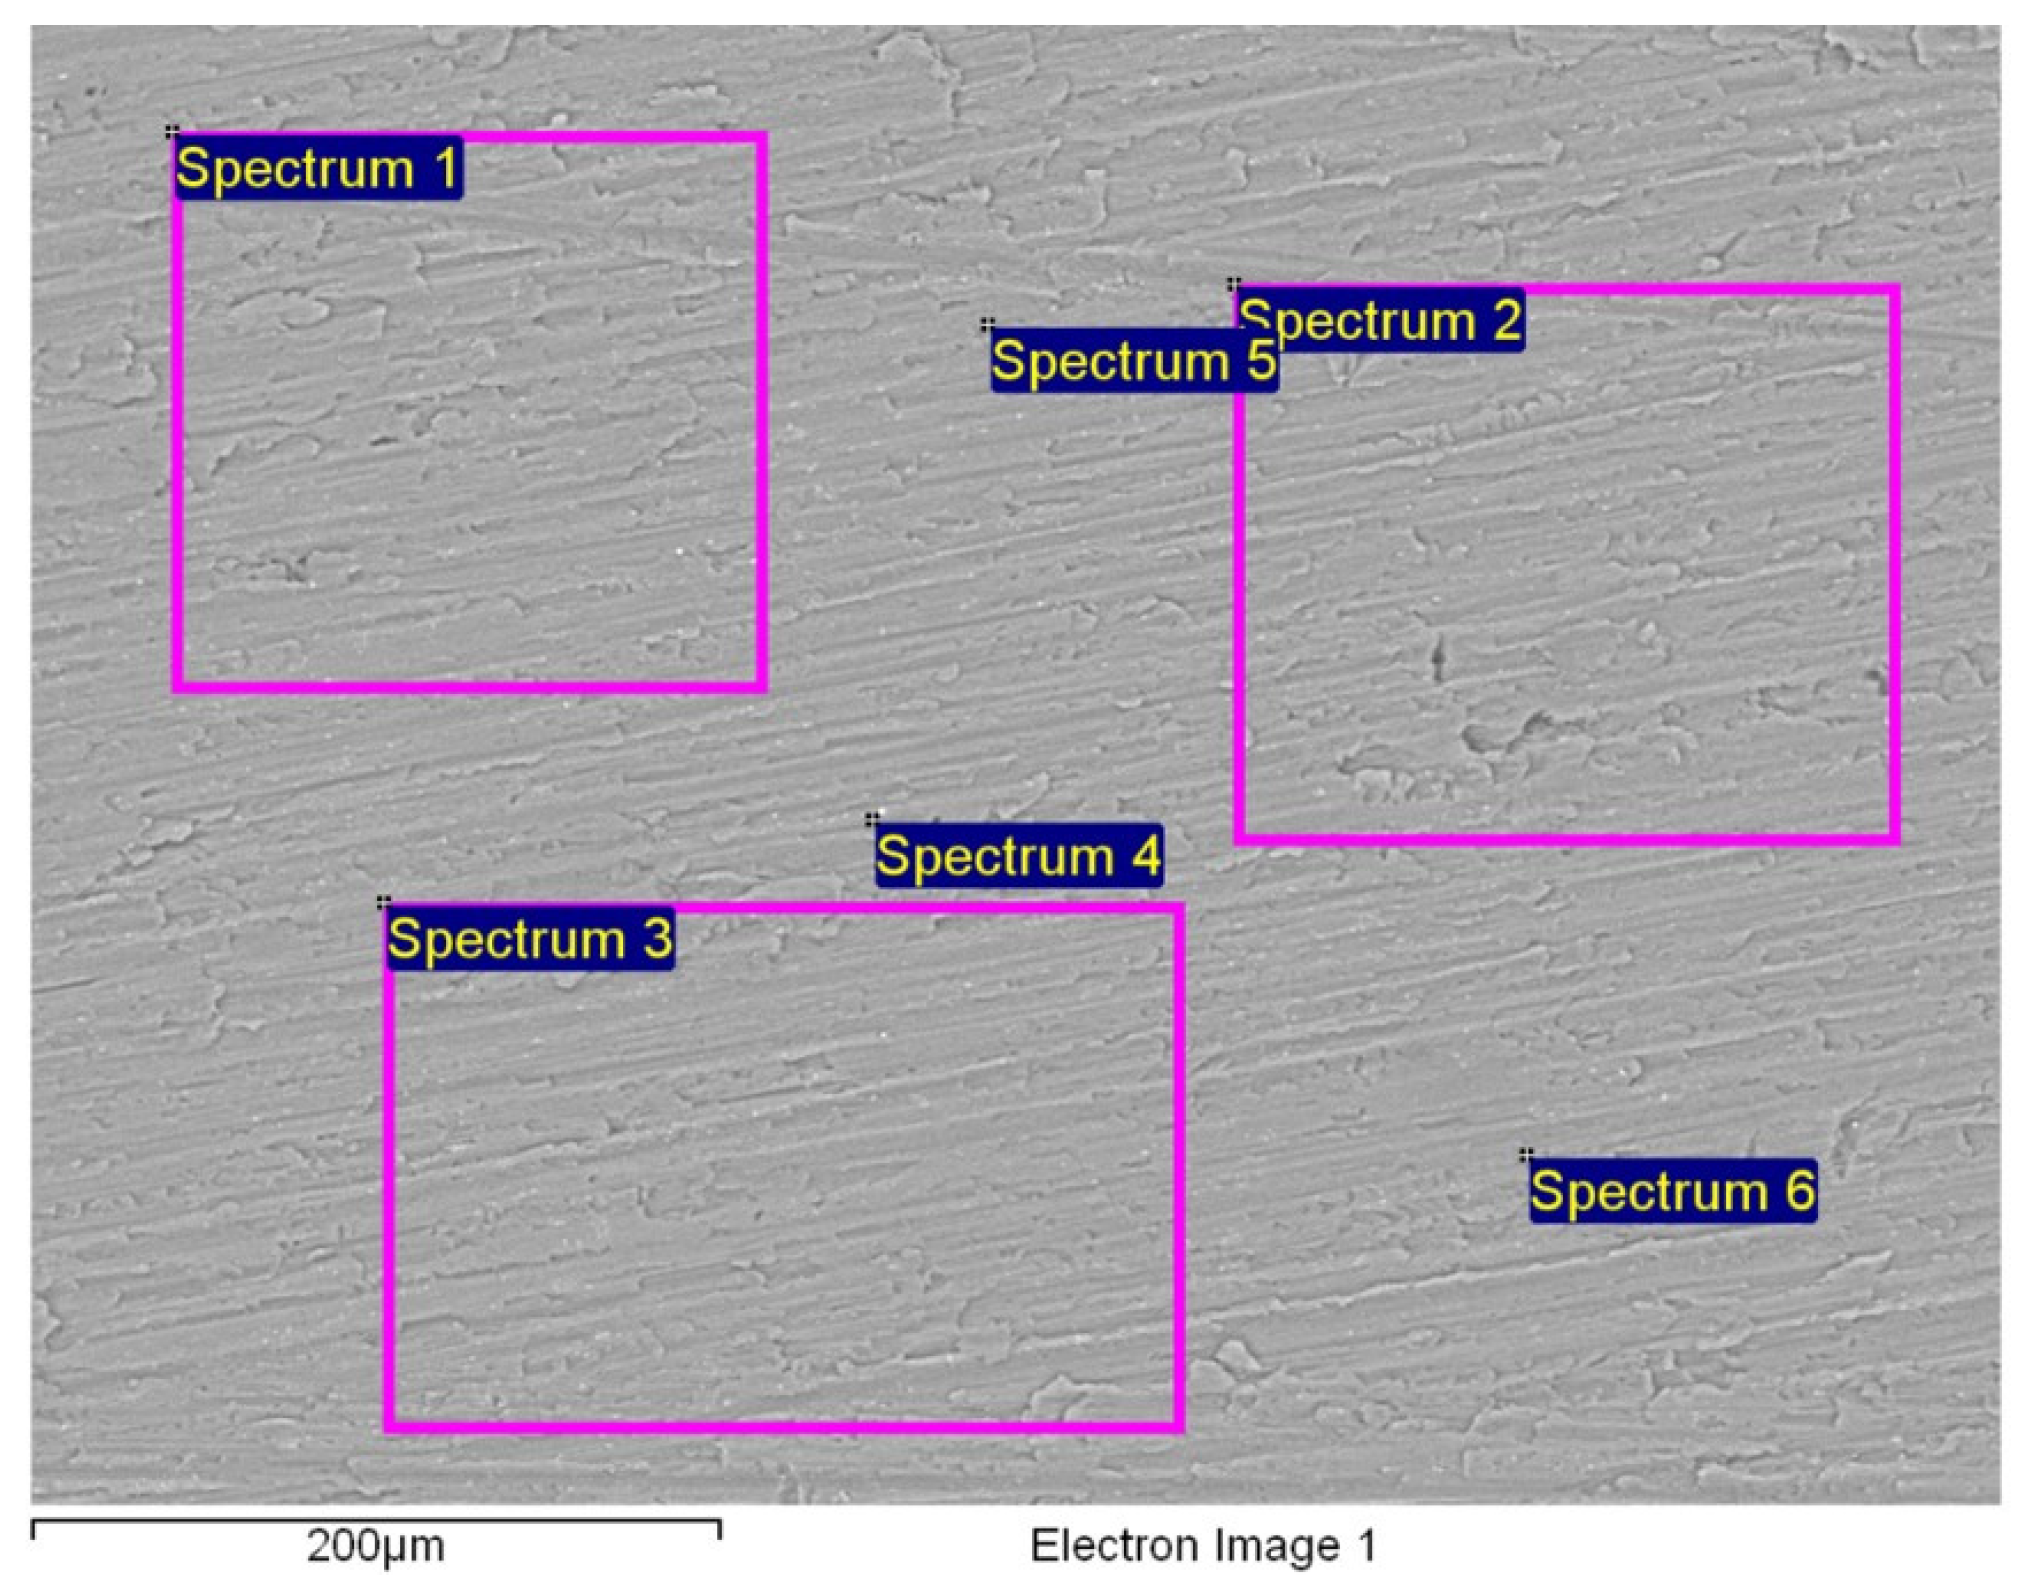
The SEM/EDX investigations of the BM samples after successful cleaning of the cutting residuals are shown in Figure 6 and Table 6. The obtained EDX results confirm that the surface chemistry is consistent with the expected composition of the EN AW 5454 D Al-alloy. The detected oxygen originated from the natural Al2O3 passive film, which forms spontaneously upon the exposure of Al to air, and is observed commonly in EDX due to its limited analysis depth, rather than from surface contamination.
Importantly, no Fe, W, Mo, Cr, or V were detected after cleaning, demonstrating that the procedure removed the tool-related contaminants effectively. The concentrations of the key alloying elements (Mg, Mn, and Si) aligned well with the nominal compositional specification for EN AW 5454 D. Furthermore, the low Standard Deviation among the individual spectra indicates minimal spatial variation and confirms that the surface is cleaned uniformly and chemically homogeneous.

3.2. Electrochemical Measurements

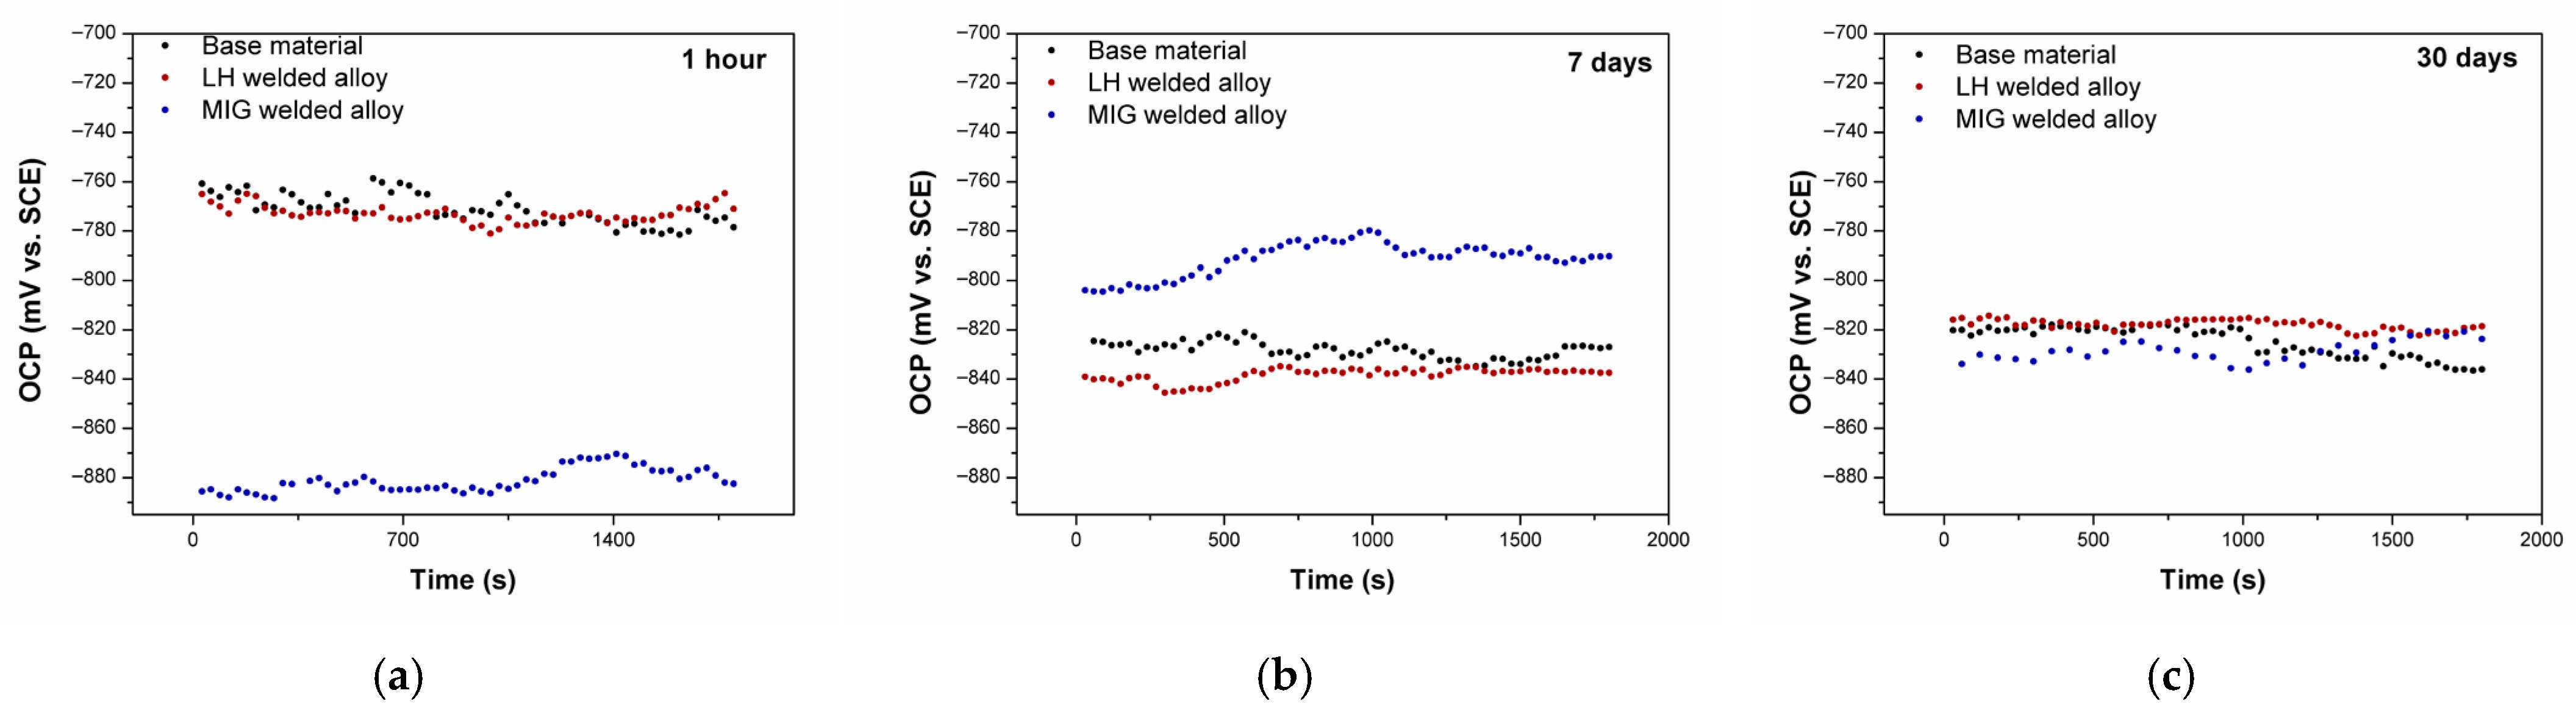
3.2.1. Open-Circuit Potential Measurement

Figure 7 presents the open circuit potential (OCP) of the tested Al-alloys as a function of the immersion time in a 3.5 wt.% NaCl solution. During the first hour, the Al-alloys exhibited stable OCP values with fluctuations within ±20 mV, indicating rapid surface layer formation. The BM displayed the noblest potential (around −750 mV), while the MIG-welded Al-alloy showed the most active potential (around −806 mV).
With extended immersion (7 and 30 days), a marked cathodic shift of OCP was observed for most Al-alloys. This kind of behaviour suggests that gradual electrochemical activation of the Al-alloy surface is a function of time. The exception was the MIG-welded sample after 7 days, which shifted slightly anodically, possibly due to temporary re-passivation. After 30 days, the OCP values converged within a narrow range (−815 to −795 mV), implying similar electrochemical surface states across all the Al-alloys.

3.2.2. Potentiodynamic Measurements

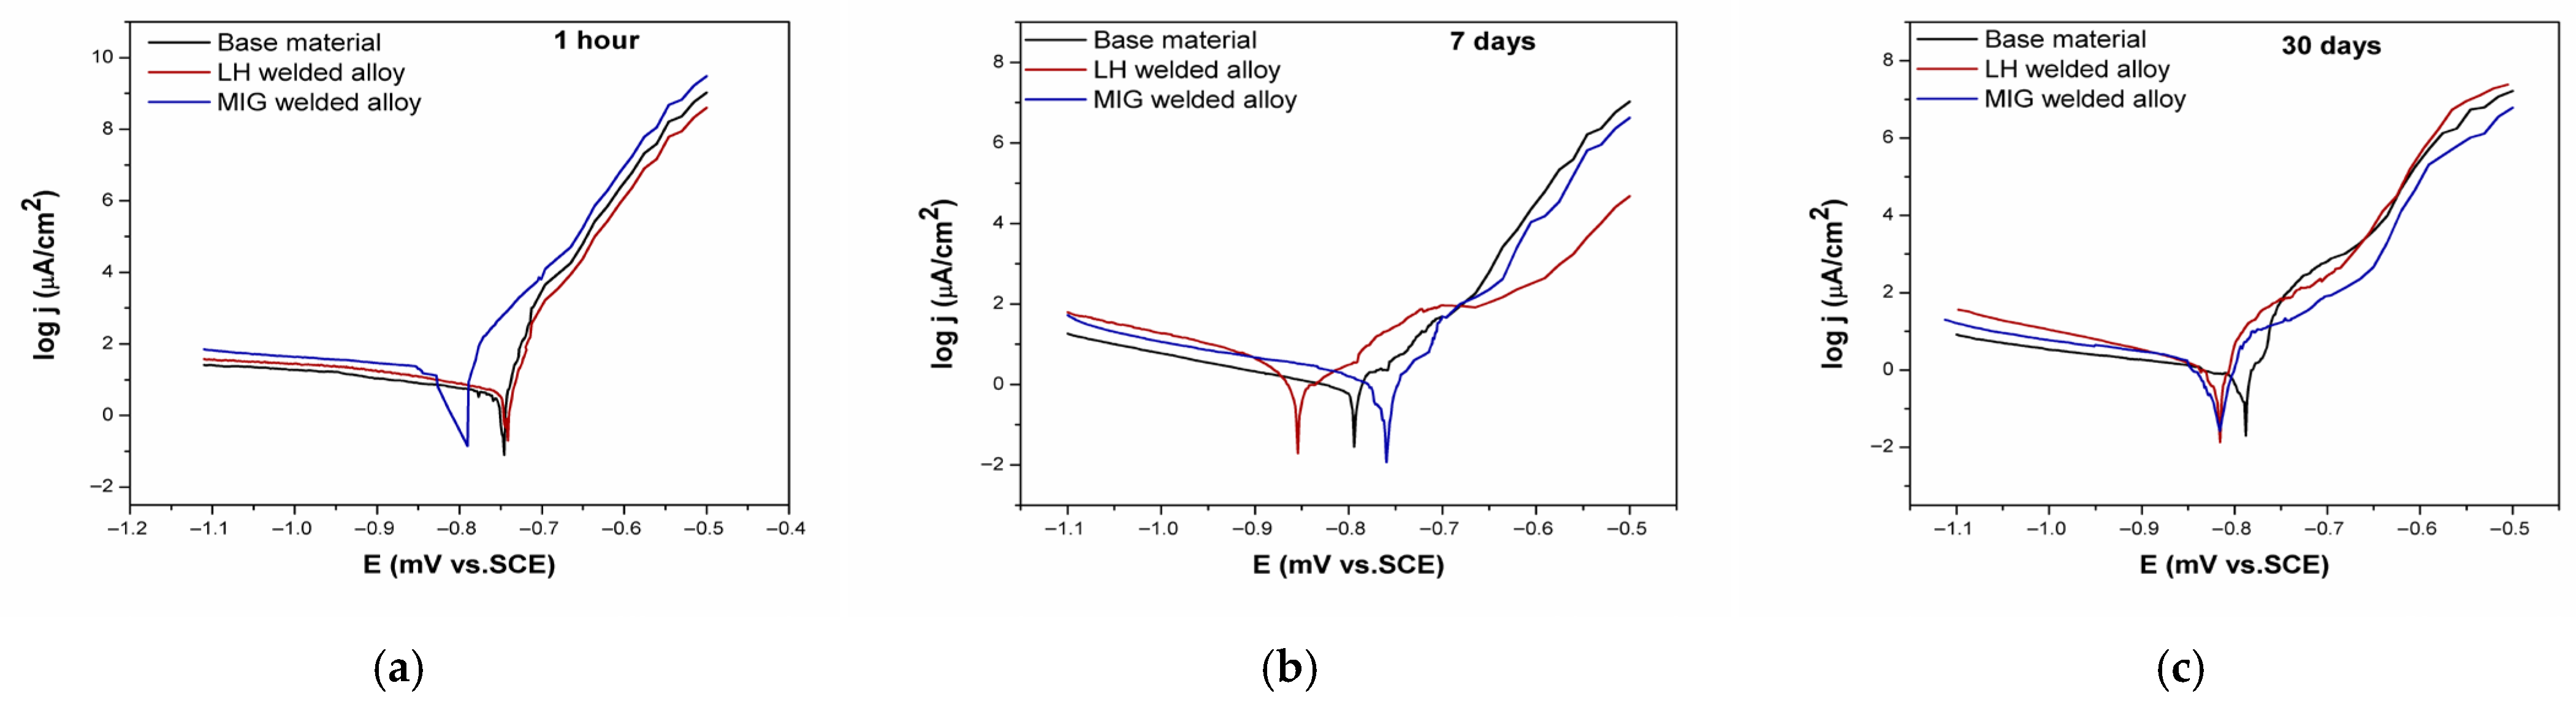
The potentiodynamic polarisation curves of the tested Al-alloys immersed at different times in the 3.5 wt.% NaCl solution are shown in Figure 8. The corrosion parameters derived from potentiodynamic polarisation measurements were calculated by the Tafel equation. The obtained average values for corrosion potential (Ecorr), corrosion current density (jcorr), and polarisation resistance (Rp) are summarised in Table 7 for immersion times of 1 h, 7 days, and 30 days in a 3.5 wt.% NaCl solution.
At the onset of the immersion (1 h), the BM and LH-welded Al-alloy exhibited similar corrosion potentials (approximately −750 mV). In contrast, the MIG-welded Al-alloy showed a significantly more negative corrosion potential (−806 mV), indicating its lower initial corrosion resistance. This was further confirmed by its considerably higher corrosion current density (18.15 µA/cm2) and lower polarisation resistance (1.60 kΩ cm2) compared to the base Al-alloy (3.80 µA/cm2; 4.55 kΩ cm2). The inferior initial performance of the welded Al-alloys, particularly MIG, is attributed to the microstructural heterogeneities and porosity introduced during the welding process, which increased the electrochemically active surface area and facilitated charge transfer reactions.
With prolonged immersion (7 days), the corrosion potential of the BM and LH-welded Al-alloys shifted towards more negative values, suggesting gradual activation of the surface. At the same time, in the case of the LH-welded Al-alloy, a much larger shift was recorded than in the case of the BM.
Following 30 days of immersion, the corrosion potential (Ecorr) of the BM remained stable relative to its 7-day measurement. In contrast, the Ecorr of the LH-welded Al-alloy shifted to more positive values during this period. This trend implies that the initially active surface observed at 7 days was subsequently passivated, likely due to the formation of corrosion products that reduced the electrochemical activity.
Conversely, the MIG-welded Al-alloy exhibited a different behaviour. Its corrosion potential shifted positively between 1 h and 7 days (from −806 mV to −761 mV), indicating an initial stabilisation or onset of passivation on the previously active surface. However, this positive shift did not persist. By day 30, the potential trend had reversed, suggesting a degradation of the protective effect that had begun to form earlier.
However, after 30 days, the corrosion potential of all the tested Al-alloys converged within a narrow range (approximately −800 mV), implying that the surface coverage with corrosion products became similar over time, regardless of the initial BM or weld microstructure.
The polarisation resistance (Rp) increased substantially for all the Al-alloys after 7 days, indicating improved resistance to uniform corrosion. This trend correlates with the marked decrease in corrosion current density over the same period, reflecting the formation of a more protective surface layer. A similar trend was registered after 30 days.
Throughout the test intervals, the base Al-alloy maintained the best corrosion properties in terms of uniform corrosion. Although the LH-welded Al-alloy showed slightly better performance than the MIG-welded Al-alloy, after 30 days, the difference between the two welded variants was much smaller than at the beginning of the experiment. Notably, after 30 days, the MIG-welded Al-alloy exhibited a lower Rp value, which may be due to the development of a porous corrosion product layer within the weld structure.
Comparing the Rp value obtained from the polarisation measurements (Table 7) with the total resistance calculated from the EIS measurements (Table 8), it is noticeable that the obtained values are in good agreement. Namely, the established hierarchy of performance persisted with both methods of determining Rp.
The slight increase in jcorr observed for all the Al-alloys after 30 days may signal the gradual degradation of the protective surface layer, potentially heralding the onset of localised corrosion processes.
A decrease in the current density over time typically signals a reduction in uniform corrosion, but, in electrolytes containing aggressive ions like chloride (Cl), this trend alone does not rule out the initiation or intensification of localised pitting corrosion [47,48].
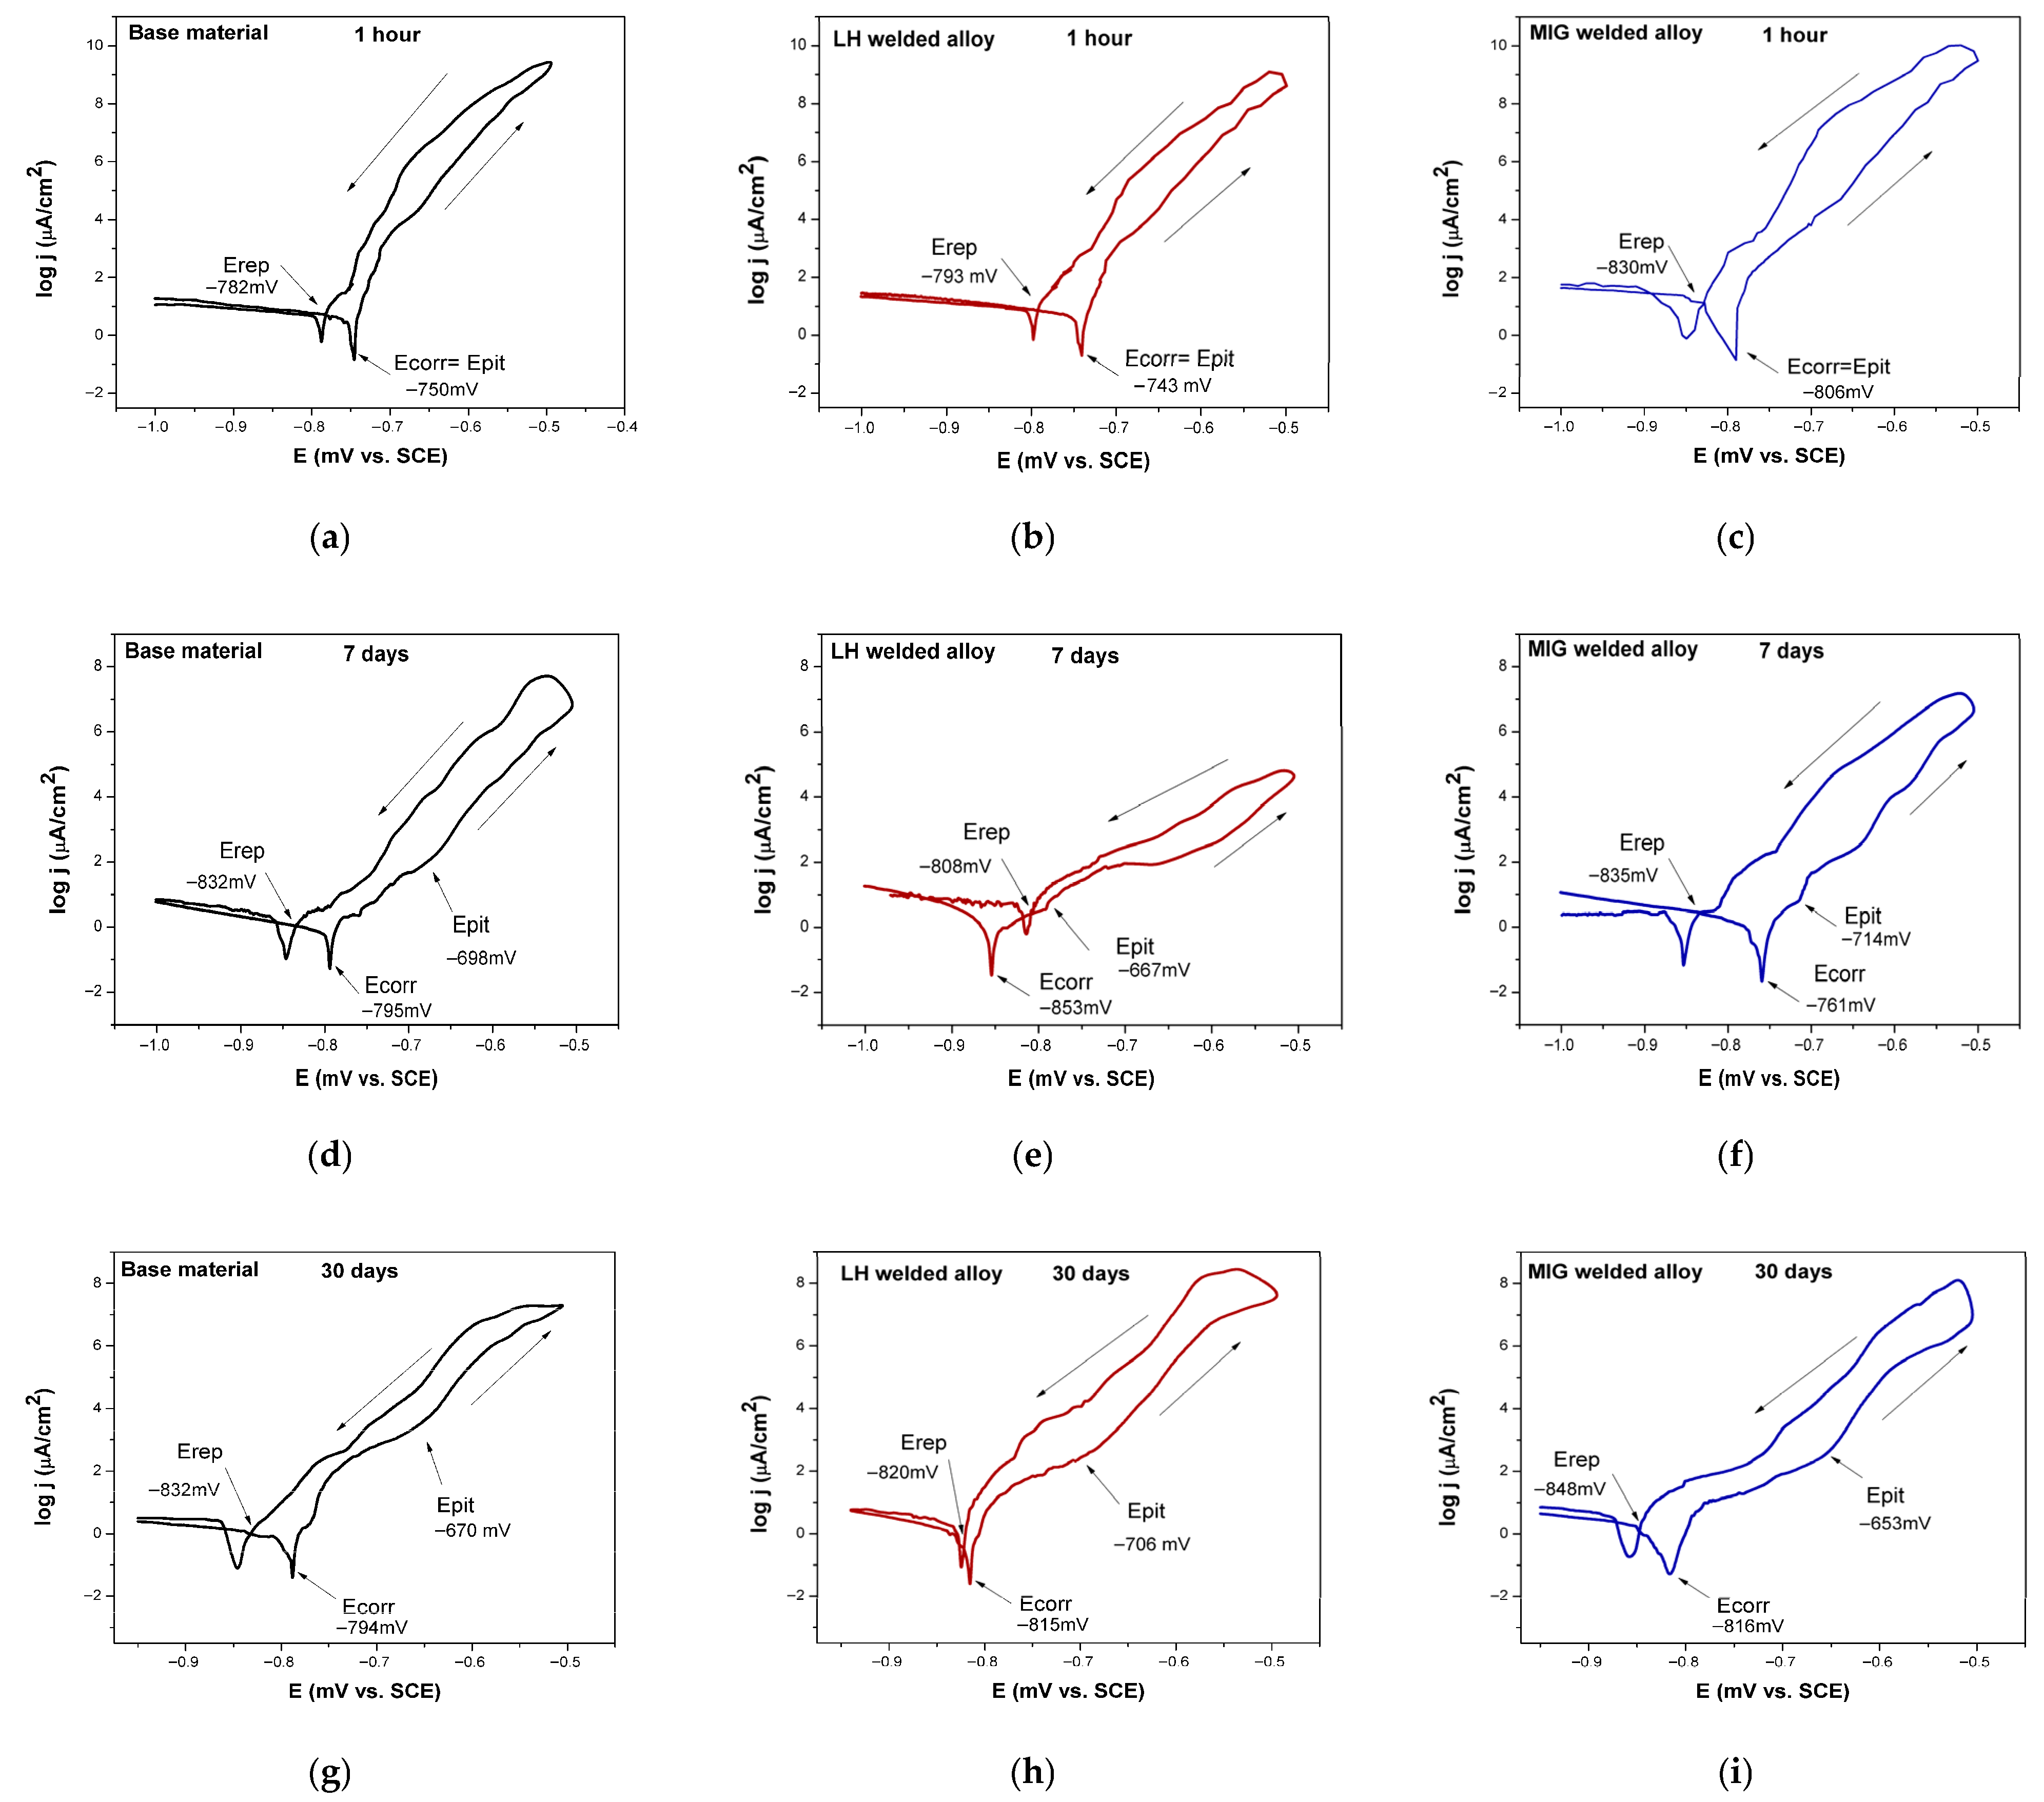
For assessing the pitting formation, the key electrochemical parameters are most critical: the pitting potential (Epit) and the re-passivation or protective potential (Eᵣₑₚ) [47,49]. The relationship between these two values is especially significant. A sharp, premature rise in anodic current density before reaching oxygen evolution potentials often suggests instability in the passive oxide layer and the likely onset of pitting (Epit). The protective potential (Erep) is identified during a reverse potential scan as the point where the current hysteresis loop closes, i.e., where the return scan intersects the forward scan [47]. The measured re-passivation potential (Erep) defines a critical threshold below which new pits should not initiate.
To assess whether the formed layer on the Al-alloy surface after a different exposure period in a 3.5 wt.% NaCl solution could protect the tested Al-alloys against pitting corrosion, a potentiodynamic polarisation test was performed, which included a reverse potential scan.
Figure 9a–i present the potentiodynamic polarisation curves, including reverse scans, for the BM, LH-welded, and MIG-welded Al-alloys after 1 h, 7 days, and 30 days of immersion in the 3.5 wt.% NaCl solution. The parameters of the reversed scan polarisation measurements (Ecorr, Epit, Erep) of the tested Al-alloys are summarised in Table 8 for the immersion times of 1 h, 7 days, and 30 days in a 3.5 wt.% NaCl solution.
It is noticeable in Figure 9a–i that in all the immersion times in the 3.5 wt.% NaCl solution, all the tested Al-alloys exhibited a higher current density during the reverse scan compared to the forward scan. This resulted in a positive hysteresis loop, a characteristic electrochemical indicator that pitting corrosion has initiated under these conditions. The difference between the Epit and Erep, along with the area of the hysteresis loop, is an indicator of pitting corrosion possibility. The larger Epit and Erep difference and the larger positive loop area correspond to lower pitting corrosion resistance [38].
At the initial 1 h immersion (Figure 9a–c), the corrosion potential (Ecorr) and pitting potential (Epit) were virtually identical for all the Al-alloys. Due to their high reactivity in air, metals like aluminium develop a surface oxide layer spontaneously, even prior to electrochemical polarisation. As a direct consequence, an increase in current density can be observed, beginning at, or very near, the corrosion potential. This behaviour results in the measured corrosion potential (Ecorr) and pitting potential (Eₚᵢₜ) being identical or extremely close in value at the beginning of the immersion [49,50,51].
At this early stage, Erep was positioned more negatively than Ecorr for all the Al-alloys (Figure 9a–c), indicating that any initiated pits were unlikely to re-passivate and would continue to propagate [38].
After 7 days (Figure 9d–f), a separation between Ecorr and Epit emerged, signalling the development of a more stable protective layer. The pitting potentials shifted to more noble values, with the LH-welded Al-alloy exhibiting the most positive Epit and the MIG-welded Al-alloy the most negative. A critical behavioural divergence was observed in the LH Al-alloy, where Erep shifted to a value between Ecorr and Epit (Figure 9e). This positioning creates a stable potential window (between Ecorr and Erep) where the passive film is maintained, preventing both the initiation and growth of new pits [38].
This performance hierarchy was maintained after 30 days of immersion (Figure 9g–i). For the BM and MIG-welded Al-alloy, Epit continued to drift positively, while the Erep of the MIG-welded Al-alloy shifted negatively over time. The resulting expansion of the Ecorr − Erep difference signifies a progressive decrease in pitting corrosion resistance with prolonged exposure [38]. In contrast, the LH-welded Al-alloy exhibited a distinct behaviour (Figure 9h). After 30 days, its Erep (−820 mV) remained nearly identical to its Ecorr (−815 mV), suggesting a potential for partial re-passivation that was not observed in the other Al-alloys. At the same time, after 30 days, the LH-welded Al-alloy had the smallest (~114 mV) and the MIG-welded Al-alloy had the largest (~195 mV) difference between Epit and Erep. These results suggest that the MIG-welded Al-alloy has a higher tendency to pitting corrosion than the LH-welded Al-alloy under the tested conditions.
Further insights into the stability of the surface oxide layer can be derived from another parameter: the active–passive transition potential, which is often visible as a distinctive “anodic nose” in the polarisation curve. This potential marks the point on the reverse scan where the current density undergoes a sharp decline. In the tested BM and MIG-welded Al-alloys, Ecorr was more noble (positive) than this transition potential, which suggests that the alloy surface would remain in a stable passive state at its corrosion potential [38]. The exception was the LH Al-alloy after 7 days, where the relative positions of these potentials were consistent with its unique re-passivation behaviour.
The result obtained by reversed scan polarisation highlights a fundamental distinction in the re-passivation kinetics between the two welded Al-alloys. The LH-welded Al-alloy exhibited a sharp, abrupt drop in current density upon approaching the re-passivation potential (Figure 9b,e,h). This rapid decline signifies the ability to reform a protective passive layer quickly once the potential falls below the critical threshold for pit growth.
Conversely, the MIG-welded Al-alloy demonstrated a different behaviour. Its current density decreased gradually over a broad potential range before finally reaching Erep (Figure 9c,f,i). This sluggish decay indicates that the reformation of its protective oxide film is a slower, less efficient process. Consequently, the passive layer that forms on the MIG-welded Al-alloy is inferred to be less stable and more sensitive to pitting corrosion compared to the layer on the LH-welded Al-alloy.
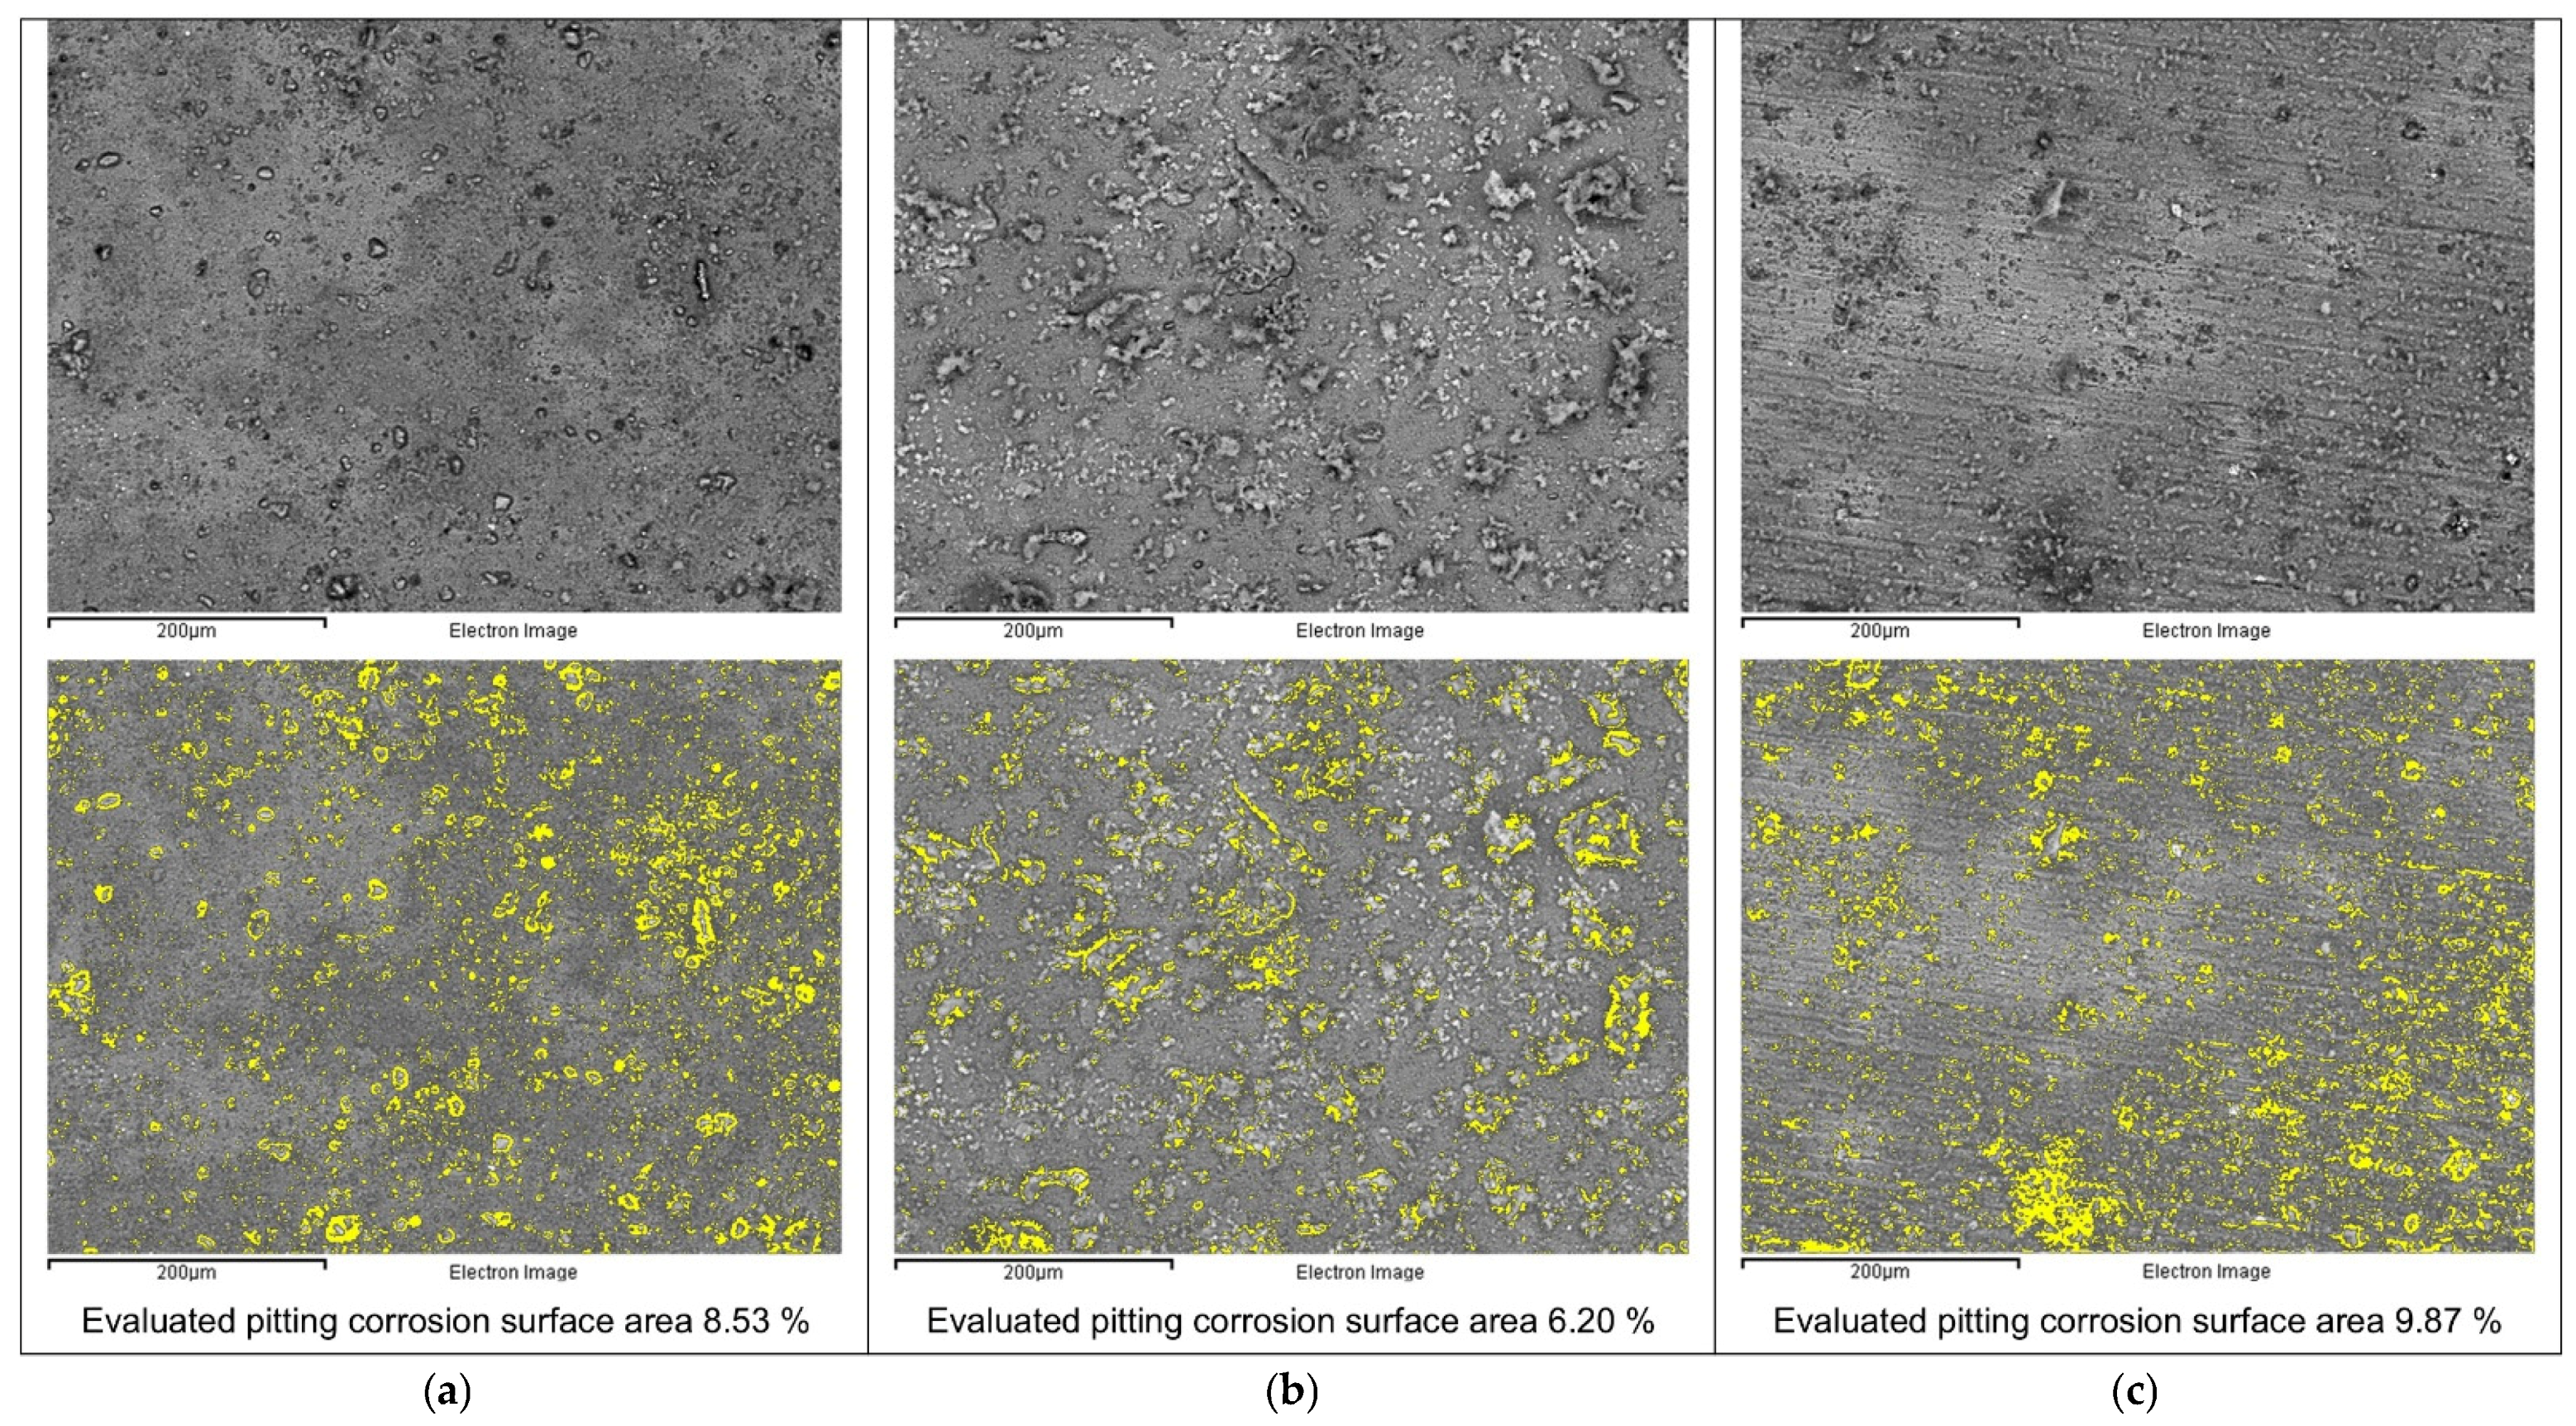
In order to check the possibility of pitting corrosion formation, the Al-alloy samples after potentiodynamic polarisation with reverse scans (30 days of immersion in the 3.5 wt.% NaCl solution) were analysed by SEM. Figure 10 shows the Al-alloy surface morphology after potentiodynamic polarisation with reverse scans (after 30 days of immersion in the 3.5 wt.% NaCl solution).
Based on the SEM micrographs in Figure 10, the surface morphology of the Al-alloys after potentiodynamic polarisation with reverse scans (after 30 days of immersion in the 3.5 wt.% NaCl solution) shows noticeable differences in corrosion damage.
The base Al-alloy surface (Figure 10a) exhibits a sparse distribution of corrosion products alongside numerous small pits and several larger ones, indicating active pitting corrosion. The evaluated pitting corrosion surface area on the selected location on the sample was 8.53%.
The MIG-welded Al-alloy presents a similar behaviour to the BM. After polarisation, its surface (Figure 10c) also appears largely free of precipitated products, and it is characterised by numerous deep pits, with the difference that these pits are not scattered randomly, but are clustered together, suggesting a higher pitting attack than in the case of the BM. The evaluated pitting corrosion surface area on the selected location on the sample was 9.87%.
In contrast, the surface of the LH-welded Al-alloy (Figure 10b) after polarisation is covered with a more substantial layer of corrosion products and shows significantly fewer pits. This behaviour indicates that, during the reverse scan, partial re-passivation occurred on the LH-welded Al-alloy surface, which is why its tendency to pitting corrosion was the lowest under the given conditions. The evaluated pitting corrosion surface area on the selected location on the sample was 6.20%.

3.2.3. Electrochemical Impedance Spectroscopy Measurements

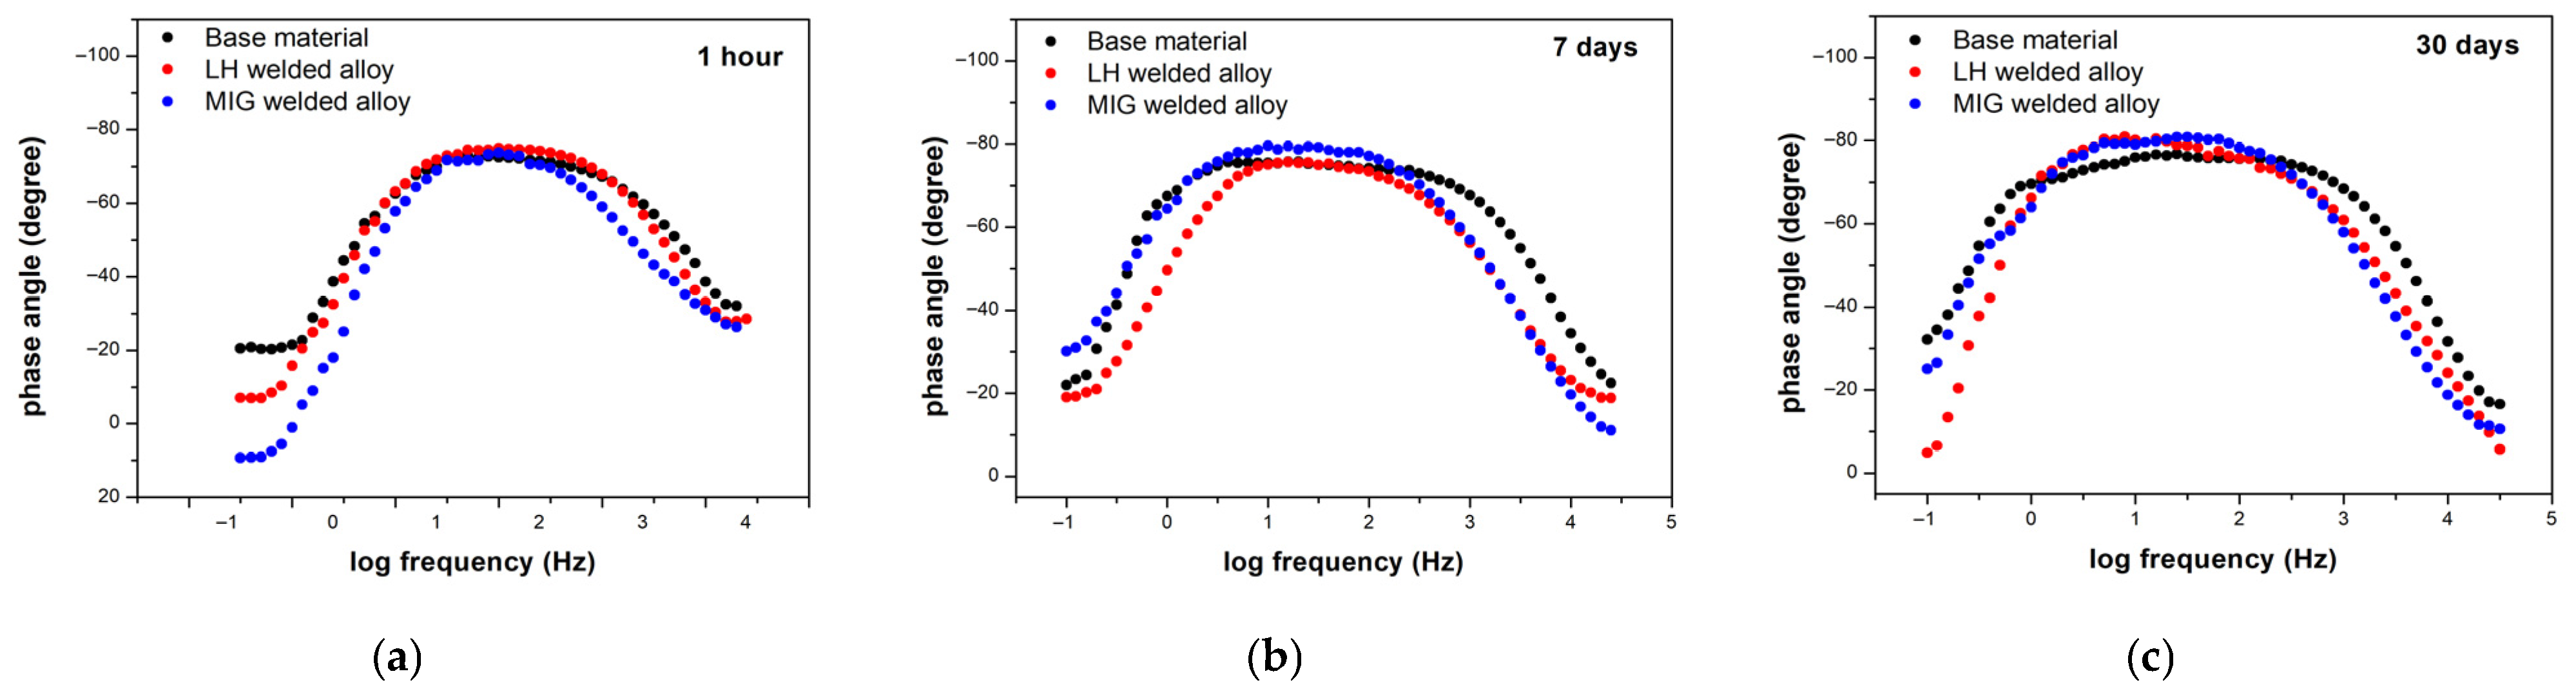
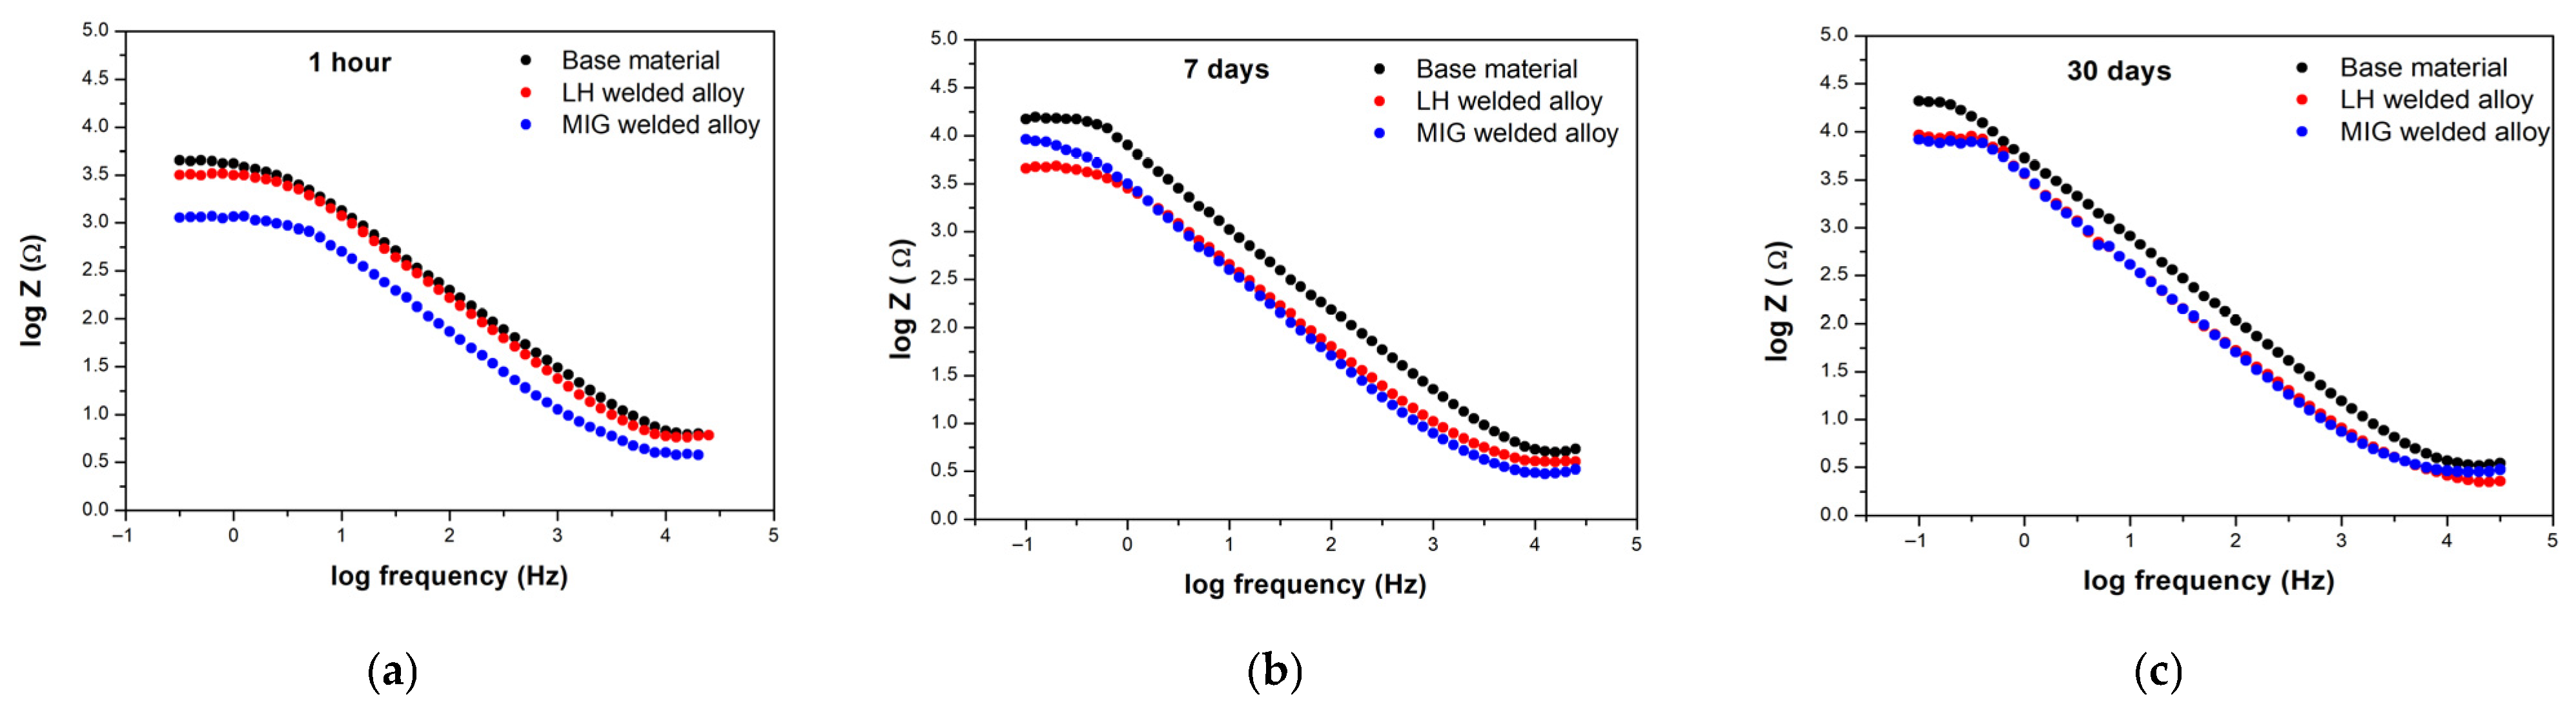
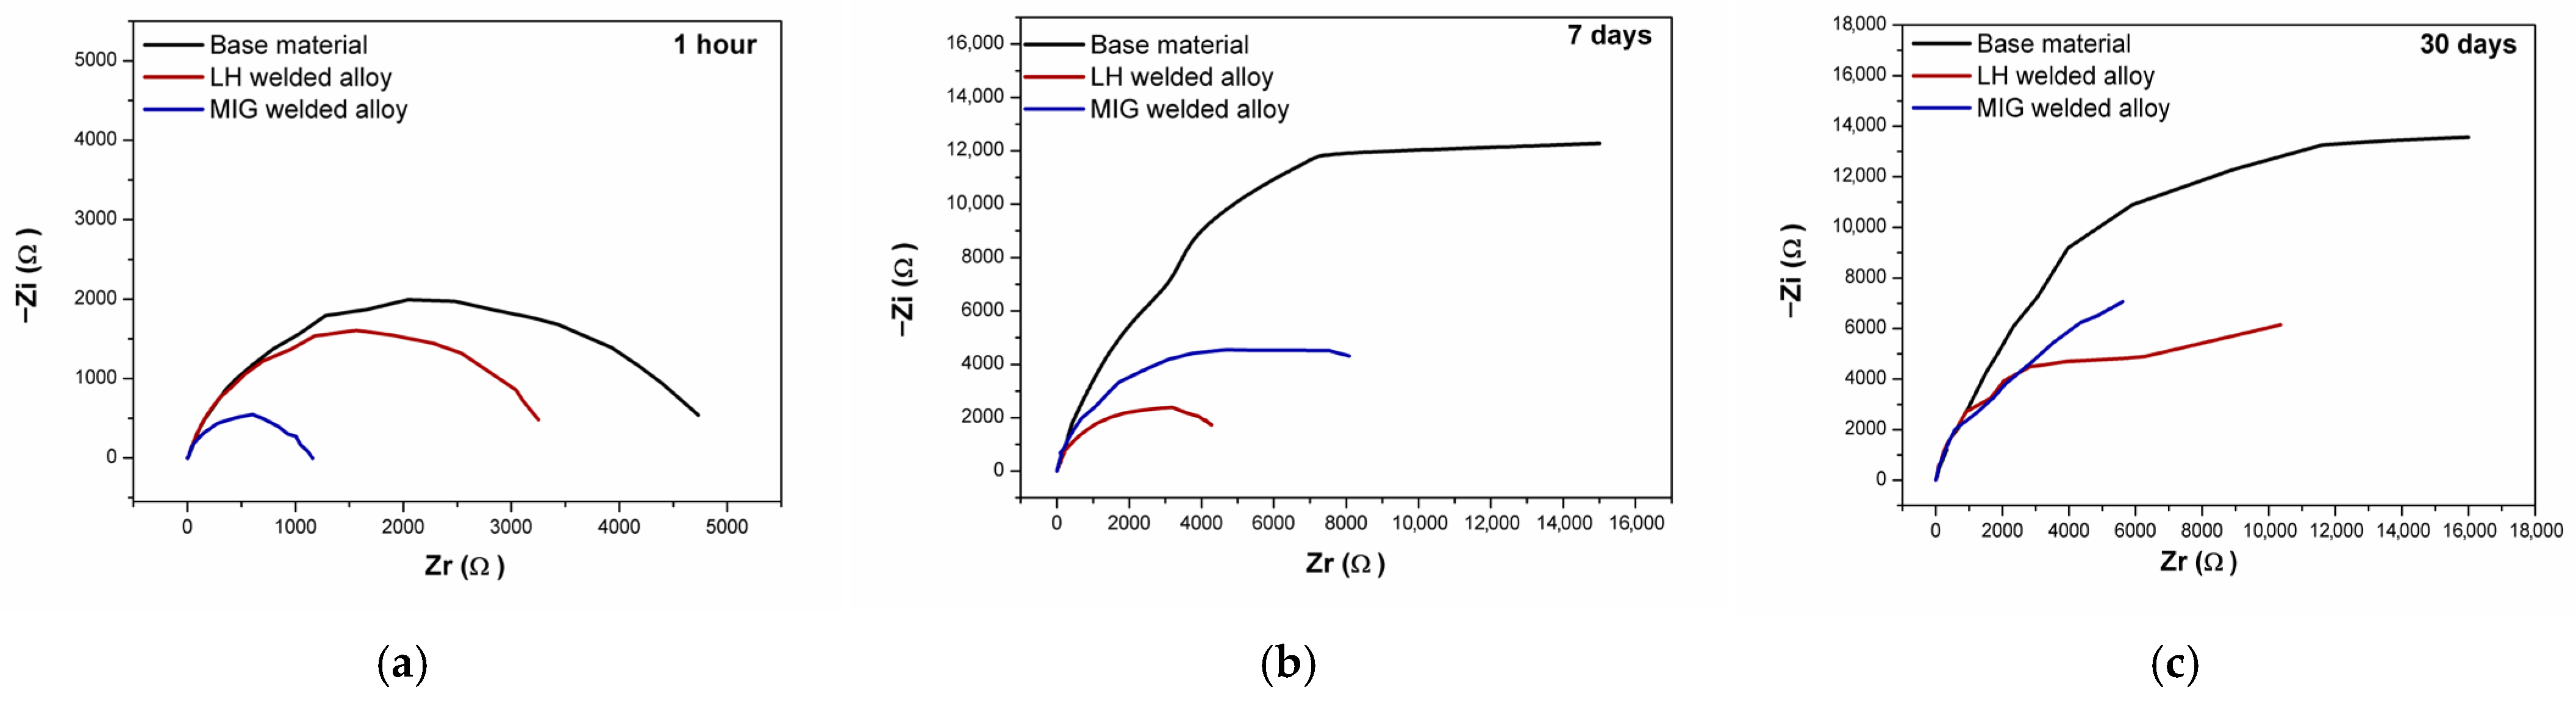
Electrochemical impedance spectroscopy (EIS) was performed at open circuit potential to investigate the interfacial behaviour and surface layer evolution of the Al-alloys over immersion periods of 1 h, 7 days and 30 days in a 3.5 wt.% NaCl solution. The results are presented as Bode phase (Figure 11a–c), Bode magnitude plots (Figure 12a–c), and Nyquist plots (Figure 13a–c).
The initial impedance measurement (Figure 11a) after one hour revealed a distinctive plateau in the Bode phase plot, with a maximum phase angle of approximately −75° observed in the intermediate frequency region near 100 Hz. This profile is a classic signature of capacitive behaviour, confirming the presence of a stable, protective film on the Al-alloy surface [52,53,54]. The high magnitude of this phase angle indicates further good corrosion resistance for all the tested Al-alloys under the specified conditions [52,55].
After 7 days of immersion (Figure 11b), the electrochemical response evolved to display two distinct time constants. A new time constant emerged in the lower intermediate frequency range (~10 Hz), maintaining a phase angle near −80°. Concurrently, a second time constant remained evident in the medium intermediate frequency region (~100 Hz), though with a maximum phase angle of approximately −75°. The persistent high phase angles (~70° to −80°) at lower frequencies continue to signify strong capacitive behaviour, and, thus, good protective properties. The appearance of the second time constant is attributed to the formation of an outer layer of corrosion products or a duplex oxide-based structure [52,56,57].
After 30 days (Figure 11c), both time constants shifted further towards lower frequencies (~6–7 Hz and 70–100 Hz, respectively), though the phase angle values remained largely unchanged. This suggests stabilisation of the surface layers without significant loss of the protective character.
The Bode magnitude plots (Figure 12a) revealed that, at 1 h, the low frequency impedance modulus (log Z) for all the Al-alloys fell within 3.0–3.5 Ω·cm2, with the MIG-welded Al-alloy exhibiting the lowest value. After 7 and 30 days (Figure 12b,c), the impedance increased slightly, reaching log Z values between 3.6 and 4.3 Ω·cm2, indicating improved corrosion resistance over time. The base Al-alloy showed the highest impedance consistently, while both welded Al-alloys converged to similar, slightly lower values after 30 days.
The slope of the magnitude plots in the intermediate frequency region was approximately −0.8 for all samples, suggesting that the surface layer behaves as a non-ideal capacitor with some ionic permeability, likely due to the porous nature of the oxide/corrosion product layer [58,59].
Across all the immersion periods, the high frequency region (1–100 kHz) showed consistent behaviour. The Bode magnitude plots exhibited a stable plateau, while the phase angle approached 0° (Figure 12a–c). This response is a direct fingerprint of the solution (electrolyte) resistance and showed no significant variation between the measurements.
The shape of the Nyquist plots evolved significantly with increasing immersion time, as illustrated in Figure 13a–c. A detailed analysis of this evolution, and the underlying electrochemical processes it represents, can be achieved by fitting an appropriate equivalent circuit model to the impedance data for each alloy under the given conditions.
The analysis of the impedance spectra revealed a non-ideal, frequency-dependent response (Figure 13a–c). To represent this behaviour accurately, a constant phase element (CPE, denoted as Q) was incorporated into the circuit model. The corresponding double-layer capacitance (C) was subsequently calculated from the CPE parameters using the standard conversion equation [54,58,59].
To interpret the EIS data quantitatively, different equivalent circuits were used to model the electrochemical interface. After 1 h, a simple Randles circuit (Figure 14a) provided a good fit, where Rs represents the solution resistance, R the charge transfer resistance, and Q a constant phase element. After 7 days, a two-time constant model was required (Figure 14b), reflecting the development of a dual-layer structure. In this refined model, the elements R1 and Q1 (converted to C1) characterise the outer, porous corrosion product layer. The components R2 and Q2 (C2) describe the properties of the inner, barrier oxide layer [54]. After 30 days, the best fit was achieved by incorporating a Warburg element (W) into the circuit, indicating the onset of diffusion-controlled processes (Figure 14c).
The need to apply different models during modelling indicates that the properties of the layer on the surface of the Al-alloy changed with the increasing immersion time in the 3.5 wt.% NaCl solution.
Table 8 summarises the key parameters extracted from the equivalent circuit models used to fit the EIS data. These values correspond to the electrochemical behaviour of the Al-alloy after immersion periods of 1 h, 7 days, and 30 days in a 3.5 wt.% NaCl solution. The fitting quality was evaluated by chi-squared value, which, in these calculations, ranged from 0.0001 ± 0.004 to 0.0001 ± 0.03.
Upon the initial exposure to the 3.5 wt.% NaCl solution, the electrochemical interface is described accurately by a simple one-time constant model (Table 8). At this stage, the BM demonstrated the most favourable corrosion properties, registering the highest polarisation resistance (R = 5.0 kΩ cm2), and the MIG-welded Al-alloy exhibited the lowest resistance (R = 1.1 kΩ cm2). This ranking is supported by the double-layer capacitance (C) values, which were lowest for the base Al-alloy and highest for the LH-welded Al-alloy.
Following 7 days of immersion, the impedance data required a more complex model incorporating a second time constant. All the Al-alloys showed a substantial increase in overall resistance compared to the 1 h measurement, while the capacitance of the inner barrier layer (C2) increased in the case of BM and decreased in the case of welded Al-alloys (much more significantly in the case of the LH-welded Al-alloy). This trend suggests that the surface becomes less active, indicating that welded Al-alloys require a longer duration to establish an effective protective oxide layer compared to the BM.
The performance hierarchy established initially did not persist, with the base Al-alloy maintaining the highest corrosion resistance, but the LH-welded Al-alloy now has the lowest.
A consistent finding across all the samples was the superior quality of the inner oxide layer compared to the outer layer. This was evidenced by higher resistance (R2 > R1) and significantly lower capacitance (C2 < C1) values. The good properties of this inner barrier layer are primarily responsible for the Al-alloy’s corrosion protection during this period [54].
The electrical properties of the outer layer, specifically its high capacitance (C1) and low resistance (R1), are indicative of a hydrated, porous structure permeated by electrolyte ions. The ingress and concentration of aggressive ions, particularly chloride, within this outer layer, can destabilise the underlying barrier oxide, creating conditions favourable for the initiation of pitting corrosion.
After 30 days of immersion, the impedance spectra for all the Al-alloys exhibited a low-frequency diffusion tail, necessitating the inclusion of a Warburg element (W) in the equivalent circuit model to account for the mass transport limitations. The calculated Warburg impedance values were consistently small and similar across all the tested materials.
Compared to the 7-day data, the resistance of the inner barrier layer (R2) showed a slight decrease for the BM and MIG-welded Al-alloys. In contrast, in the case of the LH-welded Al-alloy, an increase in R2 was registered, which suggests that, in the case of the LH-welded Al-alloy, the internal oxide layer retains and even improves its protective properties after 30 days, while the same cannot be said for the BM and MIG-welded Al-alloys.
Consequently, after 30 days, the two welded Al-alloys demonstrated comparable resistance values for both the outer and inner layers. A key distinction, however, is that the LH-welded Al-alloy exhibited lower capacitance values for both layers, with the difference being particularly pronounced for the inner layer capacitance (C2).
The notably higher inner layer capacitance for the MIG-welded Al-alloy (26.15 mF/cm2 vs. 1.38 mF/cm2 for LH-welded) is a critical finding. This increase in C2 (not just C1) suggests that, in the MIG-welded sample, electrolyte ions, particularly chlorides, have penetrated the outer porous layer and begun to incorporate into the inner barrier oxide. This incorporation degrades the protective quality of the inner layer, reducing its resistance to uniform corrosion and increasing its susceptibility to localised pitting attack substantially.

4. Conclusions

The electrochemical behaviour of BM, LH-welded, and MIG-welded Al-alloys was investigated in a 3.5 wt.% NaCl solution over immersion periods of 1 h, 7 days, and 30 days using electrochemical techniques and surface analysis. The following conclusions can be drawn:
The potentiodynamic polarisation measurements indicate that the welding process decreased the initial corrosion resistance of the Al-alloys, with the MIG-welded Al-alloy exhibiting the poorest performance, which resulted in the highest initial corrosion current density and the lowest polarisation resistance.
-
The corrosion resistance against uniform corrosion for all the Al-alloys improved with the immersion time, as evidenced by a significant decrease in the corrosion current density and an increase in the polarisation resistance after 7 and 30 days. This improvement is attributed to the formation and stabilisation of surface oxide/corrosion product layers.
-
Polarisation with the reverse scan registered that the layer formed on the surface after 1 h, 7-day, and 30-day exposure periods in a 3.5 wt.% NaCl solution could not protect the tested Al-alloys completely against pitting corrosion. The protective properties of the formed layer for all the Al-alloys decreased as a function of time.
-
The MIG-welded Al-alloy reforms the passive layer more slowly over a wider range of potentials before reaching the re-passivation potential than the LH-welded Al-alloy, and therefore, the passive layer that forms on the MIG-welded Al-alloy is less stable and more sensitive to pitting corrosion
-
The surface morphology analysis after potentiodynamic polarisation, including reverse scans (after 30 days of immersion in the 3.5 wt.%NaCl solution), confirmed the electrochemical results. The surface of the BM and MIG-welded Al-alloy indicated active pitting corrosion, while partial re-passivation occurred in the LH-welded Al-alloy during the reverse scanning.
-
The EIS analysis indicated the formation of a duplex surface layer over time, characterised by two time constants after 7 and 30 days. The MIG-welded Al-alloy exhibited the highest inner layer capacitance after 30 days, suggesting significant ion penetration and greater susceptibility to pitting corrosion.
Our results show the hierarchy BM > LH > MIG for resistance to both uniform and localised corrosion consistently [38]. The rationale is straightforward: LH welding tends to reduce porosity and microstructural heterogeneity versus arc welding, which lowers ionic ingress and stabilises the barrier layer during long-term exposure [35]. We added an EIS-based, quantitative picture—after 30 days, the MIG showed systematically higher C2 and lower R2—which we link directly to the increased pitting susceptibility [41]. This provides a mechanism-oriented, numerically supported framework to guide the process selection and surface post-treatment for the EN AW-5454-D Al-alloy.

Author Contributions

Conceptualisation, M.B., R.R. and G.V.; methodology, M.B., P.M. and G.V.; software, P.M. and G.V.; validation, M.B., R.R. and G.V.; formal analysis, P.M. and G.V.; investigation, M.B. and G.V.; resources, R.R.; data curation, P.M.; writing—original draft preparation, M.B. and G.V.; writing—review and editing, R.R. and G.V.; visualisation, P.M.; supervision, R.R.; project administration, R.R.; funding acquisition, R.R. All authors have read and agreed to the published version of the manuscript.

Funding

The authors gratefully acknowledge the financial support of the Ministry of Science, Technological Development and Innovation of the Republic of Serbia (Grant Nos. ‪451-03-33/2026-03/200125 and 451-03-34/2026-03/200125) and The Bilateral Projects Serbia—Slovenia (337-00-110/2023-05/26).

Institutional Review Board Statement

Not applicable.

Informed Consent Statement

Not applicable.

Data Availability Statement

The original contributions presented in this study are included in the article. Further inquiries can be directed to the corresponding author.

Acknowledgments

We would like to thank Irena Uranjek from the company Rogač plus d.o.o. (Rogač Plus d.o.o., Mariborska cesta 103, 2312 Orehova vas, Slovenia) for all the time she devoted to us for advising, sharing her experience, and enabling the use of the Plasmatreat equipment to clean the surfaces of the samples with air plasma.

Conflicts of Interest

Authors Peter Majerič and Rebeka Rudolf were employed by the company Zlatarna Celje d.o.o. The remaining authors declare that the research was conducted in the absence of any commercial or financial relationships that could be construed as a potential conflict of interest.

Abbreviations

The following abbreviations are used in this manuscript:
BMBase material
BSEBackscattered electron
CWContinuous welding
EcorrCorrosion potential
EDXEnergy-dispersive X-ray
EISElectrochemical impedance spectroscopy
FSWFriction stir welding
HAZHeat-affected area
jcorrCorrosion current density
LHLaser hybrid welding
MIGMetal inert gas
OCPOpen circuit potential
RₚPolarisation resistance
SCESaturated calomel electrode
SESecondary electron
SEMScanning electron microscope

References

  1. Sezek, S. Investigating Corrosion, Wear Resistance and Friction of AA5454-O Series after Its Severe Deformation by Rolling. Medžiagotyra 2017, 23, 27–31. [Google Scholar] [CrossRef][Green Version]
  2. Fraker, A.C.; Ruff, A.W. Observations of Hot Saline Water Corrosion of Aluminum Alloys. Corrosion 1971, 27, 151–156. [Google Scholar] [CrossRef]
  3. Engler, O.; Liu, Z.; Kuhnke, K. Impact of Homogenization on Particles in the Al–Mg–Mn Alloy AA 5454—Experiment and Simulation. J. Alloys Compd. 2013, 560, 111–122. [Google Scholar] [CrossRef]
  4. Salej Lah, A.; Vončina, M.; Paulin, I.; Medved, J.; Fajfar, P.; Volšak, D. The Influence of Chemical Composition and Heat Treatment on the Mechanical Properties and Workability of the Aluminium Alloy EN AW 5454. Mater. Tehnol. 2021, 55, 709–716. [Google Scholar] [CrossRef]
  5. Volpone, L.M.; Mueller, S. Joints in Light Alloys Today: The Boundaries of Possibility. Weld. Int. 2008, 22, 597–609. [Google Scholar] [CrossRef]
  6. Sheng, K.; Lu, L.; Xiang, Y.; Ma, M.; Wu, Z. Crack Behavior in Mg/Al Alloy Thin Sheet during Hot Compound Extrusion. J. Magnes. Alloys 2019, 7, 717–724. [Google Scholar] [CrossRef]
  7. Mikhaylovskaya, A.V.; Portnoy, V.K.; Mochugovskiy, A.G.; Zadorozhnyy, M.Y.; Tabachkova, N.Y.; Golovin, I.S. Effect of Homogenisation Treatment on Precipitation, Recrystallisation and Properties of Al–3% Mg–TM Alloys (TM=Mn, Cr, Zr). Mater. Des. 2016, 109, 197–208. [Google Scholar] [CrossRef]
  8. Engler, O.; Kuhnke, K.; Hasenclever, J. Development of Intermetallic Particles during Solidification and Homogenization of Two AA 5xxx Series Al-Mg Alloys with Different Mg Contents. J. Alloys Compd. 2017, 728, 669–681. [Google Scholar] [CrossRef]
  9. Hirsch, J. Aluminium Alloys for Automotive Application. Mater. Sci. Forum 1997, 242, 33–50. [Google Scholar] [CrossRef]
  10. Van Der Hoeven, J.A.; Zhuang, L.; Schepers, B.; De Smet, P.; Baekelandt, J.P. A New 5xxx Series Alloy Developed for Automotive Applications; SAE Technical Paper 2002-01-2128; SAE International: Warrendale, PA, USA, 2002. [Google Scholar] [CrossRef]
  11. Hirsch, J.; Al-Samman, T. Superior Light Metals by Texture Engineering: Optimized Aluminum and Magnesium Alloys for Automotive Applications. Acta Mater. 2013, 61, 818–843. [Google Scholar] [CrossRef]
  12. Krall, P.; Weißensteiner, I.; Pogatscher, S. Recycling Aluminum Alloys for the Automotive Industry: Breaking the Source-Sink Paradigm. Resour. Conserv. Recycl. 2024, 202, 107370. [Google Scholar] [CrossRef]
  13. García Gutiérrez, I.; Elduque, D.; Pina, C.; Tobajas, R.; Javierre, C. Influence of the Composition on the Environmental Impact of a Casting Magnesium Alloy. Sustainability 2020, 12, 10494. [Google Scholar] [CrossRef]
  14. Casalino, G.; Maso, U.; Angelastro, A.; Campanelli, S.L. Hybrid Laser Welding: A Review. DAAAM Int. Sci. Book 2010, 9, 413–430. [Google Scholar] [CrossRef]
  15. Paul, C.; Nicolae, J. Industrial Applications for Msg—Laserhybrid Welding Process. Rev. Tehnol. Neconv. 2011, 15, 63–67. [Google Scholar]
  16. Staufer, H. LaserHybrid Welding for Industrial Applications. In Proceedings of the SPIE—The International Society for Optical Engineering, Gmunden, Austria, 26 April 2007. [Google Scholar]
  17. ISO/TR 18491:2015 (E); Welding and Allied Processes—Guidelines for Measurement of Welding Energies. International Organization for Standardization: Geneva, Switzerland, 2015.
  18. EN 1011-1:2009 (E); Welding—Recommendations for Welding of Metallic Materials—Part 1: General Guidance for Arc Welding. European Committee for Standardization: Brussels, Belgium, 2009.
  19. Leo, P.; Renna, G.; Casalino, G.; Olabi, A.G. Effect of Power Distribution on the Weld Quality during Hybrid Laser Welding of an Al–Mg Alloy. Opt. Laser Technol. 2015, 73, 118–126. [Google Scholar] [CrossRef]
  20. Kostrivas, A.; Lippold, J.C. Fusion Boundary Microstructure Evolution in Aluminium Alloys. Weld. World 2006, 50, 24–34. [Google Scholar] [CrossRef]
  21. Leo, P.; D’Ostuni, S.; Casalino, G. Hybrid Welding of AA5754 Annealed Alloy: Role of Post Weld Heat Treatment on Microstructure and Mechanical Properties. Mater. Des. 2016, 90, 777–786. [Google Scholar] [CrossRef]
  22. Aleo, V. Effect of Welding on the Width of the Heat-Affected Zone of Aluminum Alloys. Ph.D. Thesis, University of Windsor, Windsor, ON, Canada, January 2004. [Google Scholar]
  23. Katayama, S. Fundamentals and Details of Laser Welding; Springer: Singapore, 2020. [Google Scholar]
  24. Ma, Y.R.; Cai, C.; Liu, Z.J.; Xie, J.; Yang, C. Plasma Monitoring During Laser-MIG Hybrid Welding Process Based on LabVIEW. Chin. J. Lasers 2022, 49, 0202014. [Google Scholar] [CrossRef]
  25. Wang, H.; Chang, S.; Zhou, Z.; Wang, W. Effect of TIG Remelting on the Microstructure, Mechanical Properties, and Corrosion Behavior of 5052 Aluminum Alloy Joints in MIG Welding. J. Mater. Res. Technol. 2024, 32, 2255–2267. [Google Scholar] [CrossRef]
  26. Lu, Y.; Wang, D.; Cao, L.; Ma, L.; Zeng, H. Comparative Analysis of Mechanical Properties and Microstructure of 7B52 Aluminum Alloy Laser-MIG Hybrid Welding and MIG Welding Joints. Metals 2024, 14, 1110. [Google Scholar] [CrossRef]
  27. Jiang, Z.; Hua, X.; Huang, L.; Wu, D.; Li, F.; Zhang, Y. Double-Sided Hybrid Laser-MIG Welding plus MIG Welding of 30-Mm-Thick Aluminium Alloy. Int. J. Adv. Manuf. Technol. 2018, 97, 903–913. [Google Scholar] [CrossRef]
  28. Saifudin; Triyono; Muhayat, N.; Surojo, E. Laser-MIG Hybrid Welding and Porosity Reduction on the Aluminum Alloy Welds: A Systematic Review. In Proceedings of the 3rd Borobudur International Symposium on Science and Technology 2021; AIP Publishing LLC: Melville, NY, USA, 2023; Volume 2706, p. 20040. [Google Scholar]
  29. Conserva, M.; Donzelli, G.; Trippodo, R. Aluminium and Its Applications; Edimet: Brescia, Italy, 1992. [Google Scholar]
  30. Davis, J.R. Alloying: Understanding the Basics; ASM International: Materials Park, OH, USA, 2001. [Google Scholar]
  31. Balant, M.; Vuherer, T.; Majerič, P.; Rudolf, R. The Influence of the Rolling Direction on the Mechanical Properties of the Al-Alloy EN AW-5454-D. J. Manuf. Mater. Process. 2024, 8, 217. [Google Scholar] [CrossRef]
  32. Kumar, S.; Shahi, A.S.; Sharma, V.; Malhotra, D. Effect of Welding Heat Input and Post-Weld Thermal Aging on the Sensitization and Pitting Corrosion Behavior of AISI 304L Stainless Steel Butt Welds. J. Mater. Eng. Perform. 2021, 30, 1619–1640. [Google Scholar] [CrossRef]
  33. Mohammed, G.R.; Ishak, M.; Aqida, S.N.; Abdulhadi, H.A. Effects of Heat Input on Microstructure, Corrosion and Mechanical Characteristics of Welded Austenitic and Duplex Stainless Steels: A Review. Metals 2017, 7, 39. [Google Scholar] [CrossRef]
  34. Da Fonseca, G.S.; Barbosa, L.O.R.; Ferreira, E.A.; Xavier, C.R.; De Castro, J.A. Microstructural, Mechanical, and Electrochemical Analysis of Duplex and Superduplex Stainless Steels Welded with the Autogenous TIG Process Using Different Heat Input. Metals 2017, 7, 538. [Google Scholar] [CrossRef]
  35. Bunaziv, I.; Akselsen, O.M.; Ren, X.; Nyhus, B.; Eriksson, M. Laser Beam and Laser-Arc Hybrid Welding of Aluminium Alloys. Metals 2021, 11, 1150. [Google Scholar] [CrossRef]
  36. Yang, M.; Lu, J.; Chen, J.; Li, Y.; Liu, Y.; Yang, H. Effect of Welding Speed on Microstructure and Corrosion Resistance of Al–Li Alloy Weld Joint. Mater. Corros. 2020, 71, 300–308. [Google Scholar] [CrossRef]
  37. Chandra, C.K.; Sommer, N.; Heider, B.; Hatzky, M.; Reitz, R.; Böhm, S.; Oechsner, M. Influence of Friction Stir Weld Parameters on the Corrosion Susceptibility of EN AW-7075 Weld Seam and Heat-Affected Zone. Adv. Eng. Mater. 2023, 25, 2300130. [Google Scholar] [CrossRef]
  38. Frankel, G.S.; Xia, Z. Localized Corrosion and Stress Corrosion Cracking Resistance of Friction Stir Welded Aluminum Alloy 5454. Corrosion 1999, 55, 139–150. [Google Scholar] [CrossRef]
  39. Guzmán, I.; Granda, E.; Cruz, C.; Martínez, D.; Vargas, B.; Acevedo, J.; Cruz, G.; Avila, Y.; Velazquez, R.; Flores, L. Corrosion Performance and Mechanical Strength in Aluminum 6061 Joints by Pulsed Gas Metal Arc Welding. Materials 2022, 15, 6226. [Google Scholar] [CrossRef]
  40. Shah, P.H.; Badheka, V. Effect of Various Welding Parameters on Corrosion Behavior of Friction-Stir-Welded AA 7075-T651 Alloys. Metallogr. Microstruct. Anal. 2018, 7, 308–320. [Google Scholar] [CrossRef]
  41. Zhou, W.; Xue, F.; Li, M. Corrosion Behavior of Al-Mg Alloys with Different Alloying Element Contents in 3.5% NaCl Solution. Metals 2025, 15, 327. [Google Scholar] [CrossRef]
  42. Balant, M.; Donik, Č.; Vuherer, T.; Rudolf, R. Microstructure Characterisation of the Laser-Hybrid-Welded Aluminium Alloy EN AW-5454-D. Mater. Tehnol. 2025, 59, 163–171. [Google Scholar] [CrossRef]
  43. EN ISO 18273:2015 (E); Welding Consumables—Wire Electrodes, Wires and Rods for Welding of Aluminium and Aluminium Alloys—Classification. ISO: Geneva, Switzerland, 2015.
  44. Muñoz, J.; Bravo, J.A.; Calzada, M.D. Aluminum Metal Surface Cleaning and Activation by Atmospheric-Pressure Remote Plasma. Appl. Surf. Sci. 2017, 407, 72–81. [Google Scholar] [CrossRef]
  45. Sorrentino, L.; Carrino, L. 2024 Aluminium Alloy Wettability and Superficial Cleaning Improvement by Air Cold Plasma Treatment. J. Mater. Process. Technol. 2009, 209, 1400–1409. [Google Scholar] [CrossRef]
  46. Liu, Y.; Cai, J.; Mao, H.; Zhou, Y.; Wu, C. Nanosecond Laser-Induced Plasma for Nondestructive Cleaning and Substrate Strengthening of 7075 Aluminum Alloy Surface Coating. Opt. Laser Technol. 2025, 187, 112862. [Google Scholar] [CrossRef]
  47. Esmailzadeh, S.; Aliofkhazraei, M.; Sarlak, H. Interpretation of Cyclic Potentiodynamic Polarization Test Results for Study of Corrosion Behavior of Metals: A Review. Prot. Met. Phys. Chem. Surf. 2018, 54, 976–989. [Google Scholar] [CrossRef]
  48. Sherif, E.-S.M. Corrosion Behavior of Magnesium in Naturally Aerated Stagnant Seawater and 3.5% Sodium Chloride Solutions. Int. J. Electrochem. Sci. 2012, 7, 4235–4249. [Google Scholar] [CrossRef]
  49. Wang, B.; Liu, J.; Yin, M.; Xiao, Y.; Wang, X.H.; He, J.X. Comparison of Corrosion Behavior of Al-Mn and Al-Mg Alloys in Chloride Aqueous Solution. Mater. Corros. 2016, 67, 51–59. [Google Scholar] [CrossRef]
  50. Ma, J.; Wen, J.; Li, Q.; Zhang, Q. Effects of Acidity and Alkalinity on Corrosion Behaviour of Al–Zn–Mg Based Anode Alloy. J. Power Sources 2013, 226, 156–161. [Google Scholar] [CrossRef]
  51. Zaid, B.; Saidi, D.; Benzaid, A.; Hadji, S. Effects of PH and Chloride Concentration on Pitting Corrosion of AA6061 Aluminum Alloy. Corros. Sci. 2008, 50, 1841–1847. [Google Scholar] [CrossRef]
  52. Canto, J.; Rodríguez-Díaz, R.A.; Martinez-de-la-Escalera, L.M.; Neri, A.; Porcayo-Calderon, J. Corrosion Inhibition in CO2-Saturated Brine by Nd3+ Ions. Molecules 2023, 28, 6593. [Google Scholar] [CrossRef] [PubMed]
  53. Vastag, G.; Majerič, P.; Lazić, V.; Rudolf, R. Electrochemical Behaviour of an Au-Ge Alloy in an Artificial Saliva and Sweat Solution. Metals 2024, 14, 668. [Google Scholar] [CrossRef]
  54. Dutta Chowdhury, N.; Ghosh, K.S. Electrochemical Behaviour of Dental Amalgam in Natural, Artificial Saliva and in 0.90 wt.% NaCl Solution. Corros. Sci. 2018, 133, 217–230. [Google Scholar] [CrossRef]
  55. Shao, P.; Xiao, H.; Liu, K.; Chen, X.; Hou, M.; Zhang, Q.; Qian, C.; Huang, S. Influence of Annealing Temperature on the Mechanical Properties and Corrosion Behavior of Ti-5.5Al-2.0Zr-1.5Sn-0.5Mo-1.5Nb Alloy. Arab. J. Chem. 2024, 17, 105790. [Google Scholar] [CrossRef]
  56. Falodun, O.E.; Oke, S.R.; Solomon, M.M.; Bayode, A. Microstructural Evolution and Electrochemical Corrosion Characteristics of Ti–Ni Matrix Composite in NaCl and HCl Solutions. Ceram. Int. 2024, 50, 15124–15133. [Google Scholar] [CrossRef]
  57. Torbati-Sarraf, H.; Ding, L.; Khakpour, I.; Daviran, G.; Poursaee, A. Unraveling the Corrosion of the Ti–6Al–4V Orthopedic Alloy in Phosphate-Buffered Saline (PBS) Solution: Influence of Frequency and Potential. Corros. Mater. Degrad. 2024, 5, 276–288. [Google Scholar] [CrossRef]
  58. Matemadombo, F.; Nyokong, T. Characterization of Self-Assembled Monolayers of Iron and Cobalt Octaalkylthiosubstituted Phthalocyanines and Their Use in Nitrite Electrocatalytic Oxidation. Electrochim. Acta 2007, 52, 6856–6864. [Google Scholar] [CrossRef]
  59. Porcayo-Calderon, J.; Rodríguez-Díaz, R.A.; Porcayo-Palafox, E.; Martinez-Gomez, L. Corrosion Performance of Cu-Based Coins in Artificial Sweat. J. Chem. 2016, 2016, 9542942. [Google Scholar] [CrossRef]
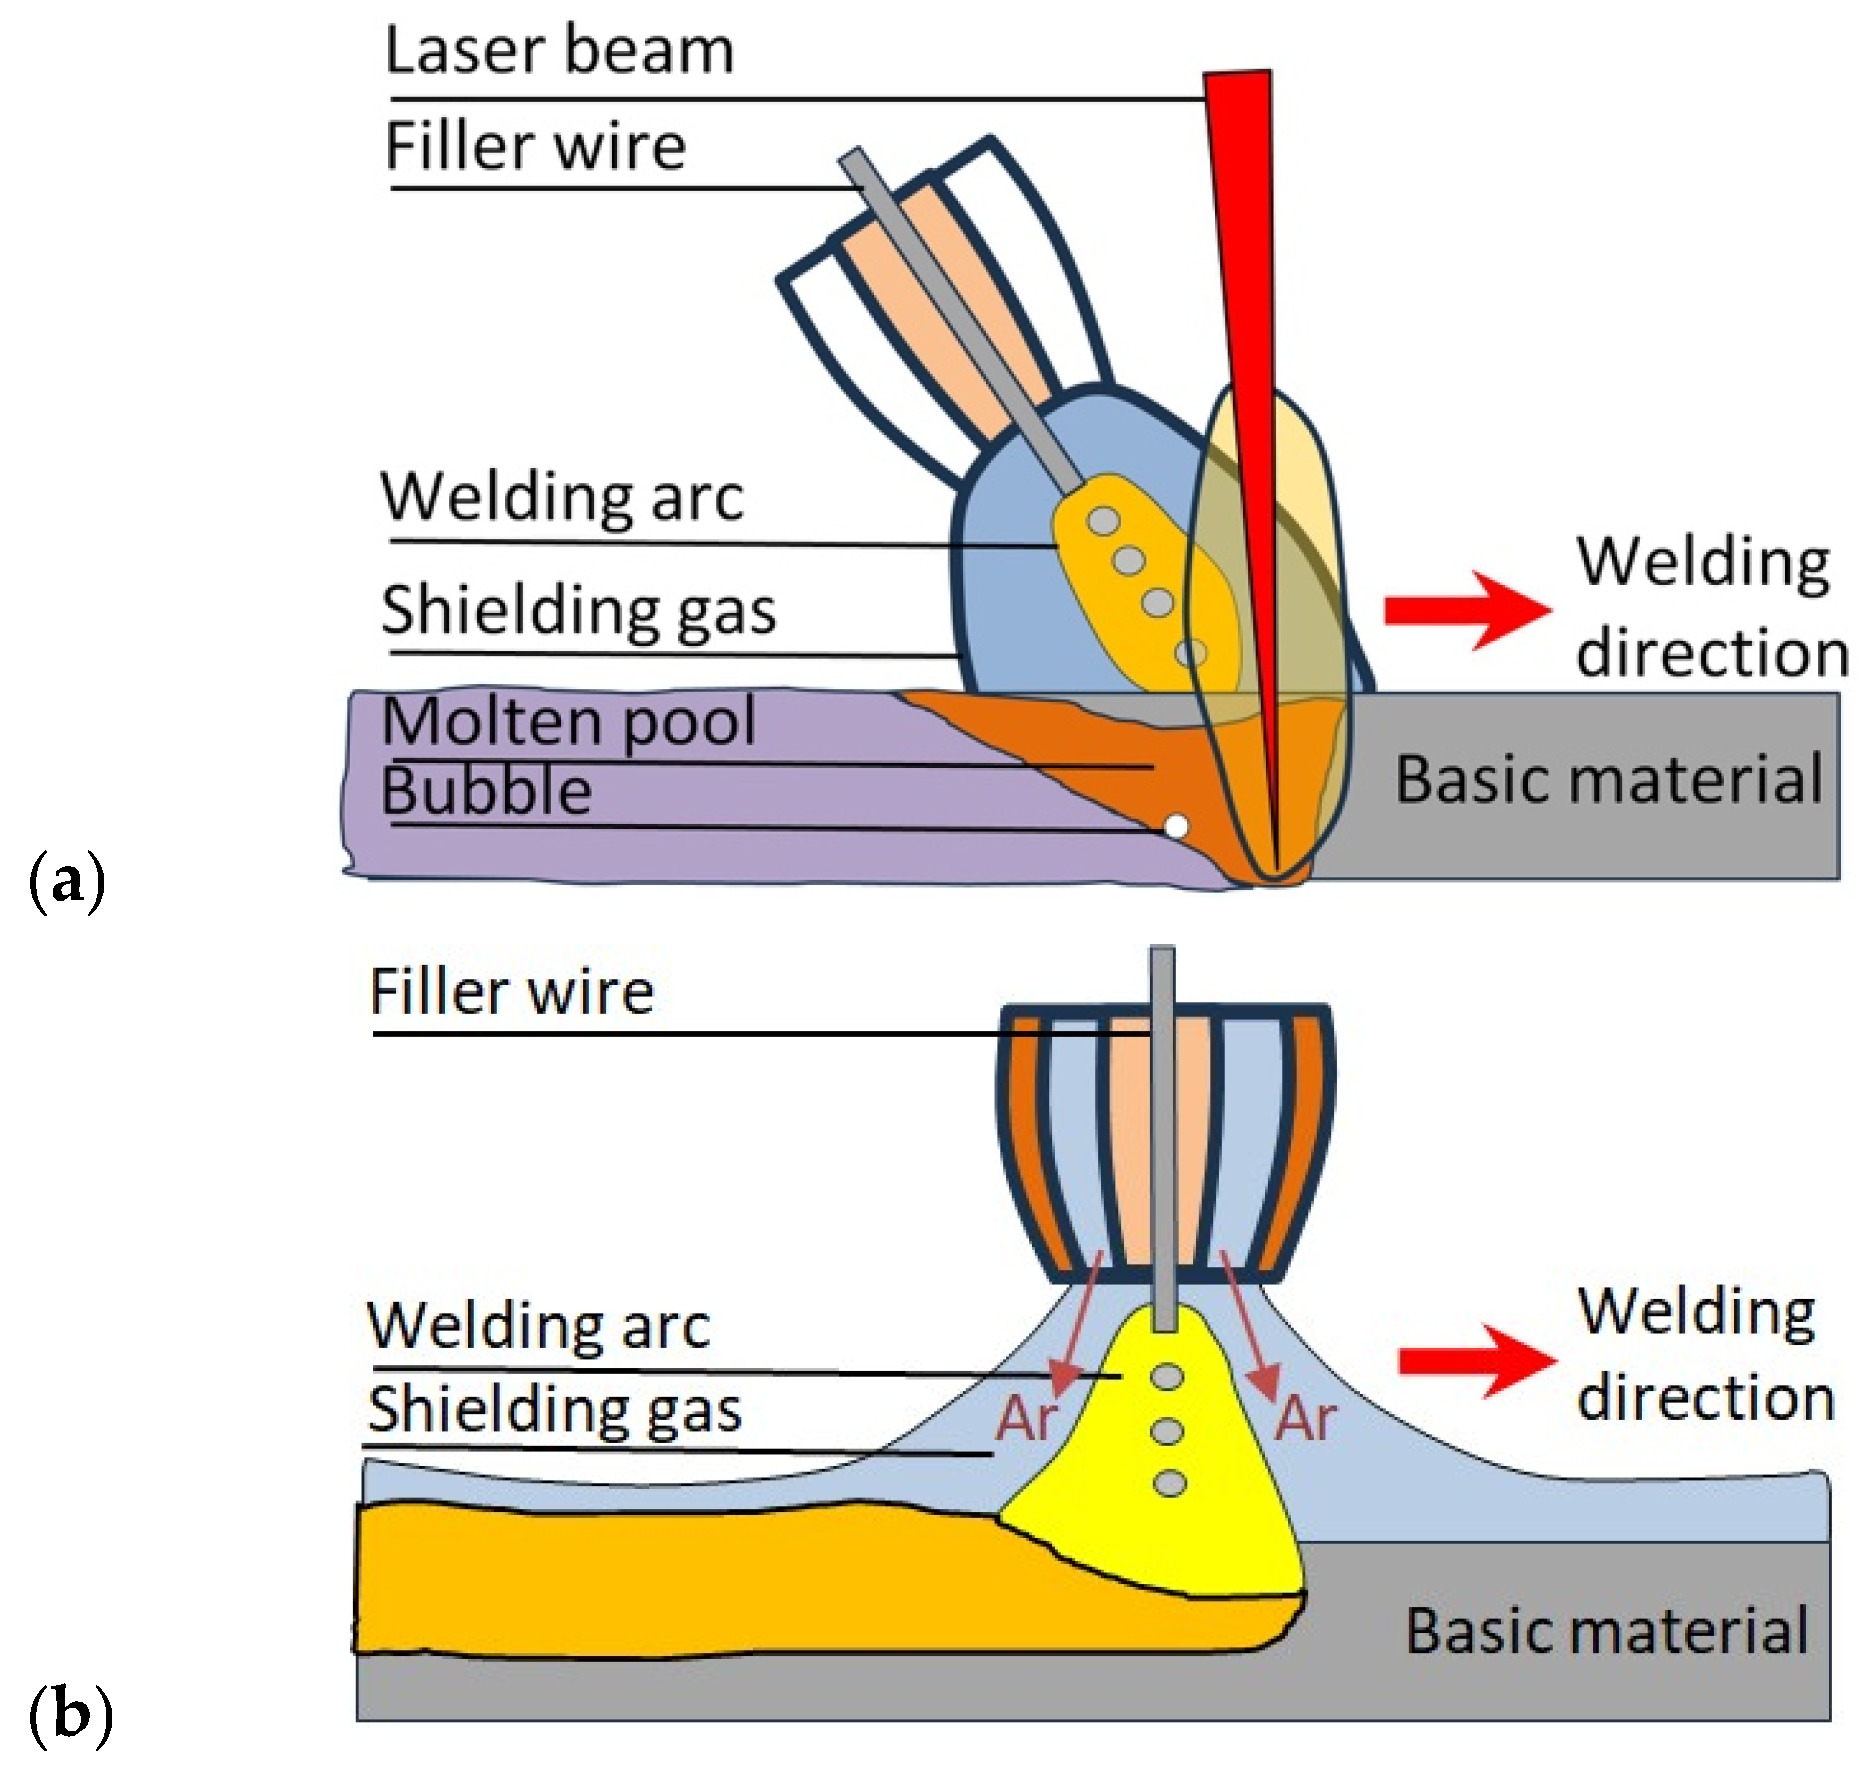
Figure 1. Schematic representation of the elements during (a) LH and (b) MIG welding.
Materials 19 00750 g001
Figure 2. Weldments are clamped in the welding fixture.
Materials 19 00750 g002
Figure 3. SEM analysis of the LH weld cross-section with marked areas of the EDX analysis, for spectrum 1–6 in Table 4.
Materials 19 00750 g003
Figure 4. Surface preparation with air plasma.
Materials 19 00750 g004
Figure 5. Surface area size determination: (a) 3D visualisation of the sample, (b) 2D visualisation of the sample.
Materials 19 00750 g005
Figure 6. SEM analysis of the BM samples with marked areas of the EDX analysis, for spectrum 1–6 in Table 6.
Materials 19 00750 g006
Figure 7. OCP values for the tested Al-alloys following immersion in a 3.5 wt.% NaCl solution: (a) 1 h, (b) 7 days, and (c) 30 days.
Materials 19 00750 g007
Figure 8. Polarisation curves of the tested Al-alloys for different immersion times in a 3.5 wt.% NaCl solution: (a) 1 h, (b) 7 days, and (c) 30 days.
Materials 19 00750 g008
Figure 9. Polarisation curve with reverse scan of the tested Al-alloys after an immersion time of 1 h (ac), 7 days (df), and 30 days (gi) in 3.5 wt.% NaCl. The arrow indicates the direction of polarization.
Materials 19 00750 g009
Figure 10. Surface morphology of the tested Al-alloy surface after potentiodynamic polarisation with a reverse scan (after an immersion time of 30 days in 3.5 wt.% NaCl); evaluation of pitting corrosion surface area (highlighted in yellow) with ImageJ processing on the selected sample locations: (a) BM, (b) LH-welded, and (c) MIG-welded specimens.
Materials 19 00750 g010
Figure 11. Bode phase diagram for the tested Al-alloys following immersion in a 3.5 wt.% NaCl solution: (a) 1 h, (b) 7 days, and (c) 30 days.
Materials 19 00750 g011
Figure 12. Bode magnitude plots for the tested Al-alloys following immersion in a 3.5 wt.% NaCl solution: (a) 1 h, (b) 7 days, and (c) 30 days.
Materials 19 00750 g012
Figure 13. Nyquist plots for the tested alloys following immersion in a 3.5 wt.% NaCl solution: (a) 1 h, (b) 7 days, and (c) 30 days.
Materials 19 00750 g013
Figure 14. Equivalent circuit for the tested alloys following immersion in a 3.5 wt.% NaCl solution: (a) 1 h, (b) 7 days, and (c) 30 days.
Materials 19 00750 g014
Table 1. The nominal chemical composition of the EN AW-5454-D Al-alloy (in wt.%), as specified by the manufacturer [42].
Thickness
[mm]
ElementSiFeCuMnMgCrZnTiAl
4.0 0.180.320.050.762.850.050.040.0295.73
Table 2. The chemical composition of the Al5554 welding wire (in wt.%) [42].
CrCuFeMgMnSiTiZnAl
0.0790.00190.1482.830.6090.0570.0880.0018Rest
Table 3. Technological parameters for LH welding and MIG welding.
Welding ParameterValueValue
Welding processLHMIG-PMC
Welding positionPA—Flat positionPA—Flat position
Gap Laser–MIG2 mm-
SequenceLaser Master,
MIG Slave
-
Stickout15 mm15 mm
Fibre diameter0.6 mm-
Spot size0.9 mm (no defocus)-
Collimation length200 mm-
Focal length300 mm. -
Optic5° in pulling position-
Shielding gas100% Ar 5.0100% Ar 5.0
Gas flow15 L/min15 L/min
Welding speed300 cm/min96 cm/min
Wire feed speed10.5 m/min5.5 m/min
Welding current147 A181 A
Voltage18.1 V20 V
Laser power5000 W-
Type of welding current and polarityDC—PulseDC—Pulse
AC balance+20
Arc length−0.20
Table 4. EDX analysis results of the LH weld cross-section (in wt.%).
SpectrumCOMgAlCrFeMoTotal
Spectrum 113.2912.691.6472.38---100
Spectrum 2-11.621.9886.40---100
Spectrum 3--1.2277.37-21.41-100
Spectrum 4-7.721.5362.721.7320.056.25100
Spectrum 5-14.28-53.974.6322.674.45100
Spectrum 6-13.59-44.102.1919.7520.38100
Mean2.229.981.0666.161.4313.985.18100
Std. Dev.5.435.410.8615.631.8510.887.91
Max.13.2914.281.9886.404.6322.6720.38
Min.00044.10000
Table 5. Air plasma technological parameters.
ParameterValueUnit
Supply air pressure3.6bar
Voltage300V
Electric current11.7A
Frequency21kHz
Plasma cycle time100%
Nozzle distance from the surface4mm
Nozzle/transition speed25mm/s
Nr. of transitions4-
Table 6. EDX analysis results of the BM samples (in wt.%).
SpectrumOMgAlSiMnTotal
Spectrum 13.282.9392.83-0.96100
Spectrum 22.562.9693.53-0.95100
Spectrum 32.242.7394.02-1.01100
Spectrum 44.853.6390.131.39-100
Spectrum 54.933.8290.44-0.81100
Spectrum 66.082.0791.04-0.81100
Mean3.993.0292.000.230.76100
Std. Dev.1.520.631.6700.38
Max.6.083.8294.021.391.01
Min.2.242.0790.1300
Table 7. Parameters of the polarisation measurements of the tested Al-alloys for different immersion times in a 3.5 wt.% NaCl solution.
Al-Alloy1 h7 Days30 Days
Ecorr
(mV)
jcorr
(µA/cm2)
Rp
(kΩ/cm2)
Ecorr
(mV)
jcorr
(µA/cm2)
Rp
(kΩ/cm2)
Ecorr
(mV)
jcorr
(µA/cm2)
Rp
(kΩ/cm2)
BM−7503.804.55−7950.7021.43−7940.7822.0
LH-welded−7434.633.05−8531.0511.98−8151.1614.7
MIG-welded−80618.151.60−7610.8818.10−8161.457.70
The average value of the obtained parameters is within the limits of variability of 0.10–0.25%.
Table 8. EIS parameters of the Al-alloy at different immersion times in a 3.5 wt.% NaCl solution.
Al-AlloyRs (Ωcm2)R1
(kΩcm2)
C1
(mF/cm2)
n1R2
(kΩcm2)
C2
(mF/cm2)
n2W
(kΩcm2)
1 h
BM5---------5.010.980.85---
LH-welded5---------3.424.280.95---
MIG-welded3---------1.116.690.95---
7 days
BM310.0670.80.8531.017.710.90---
LH-welded34.0556.00.864.914.430.93---
MIG-welded37.5341.70.919.013.580.94---
30 days
BM55.0197.20.9225.05.070.930.35
LH-welded56.0273.10.929.01.380.930.40
MIG-welded55.0335.00.938.026.150.940.30
The average value of the obtained parameters is within the limits of variability of 0.10–0.25%.
Disclaimer/Publisher’s Note: The statements, opinions and data contained in all publications are solely those of the individual author(s) and contributor(s) and not of MDPI and/or the editor(s). MDPI and/or the editor(s) disclaim responsibility for any injury to people or property resulting from any ideas, methods, instructions or products referred to in the content.