2.2.1. Preparation Method
To address the research objectives outlined above, a three-stage progressive experimental program was designed, in which material composition was gradually refined from cement paste to concrete scale to clarify the individual and combined effects of mineral admixtures, graphite powder, and thermally conductive aggregates.
As shown in
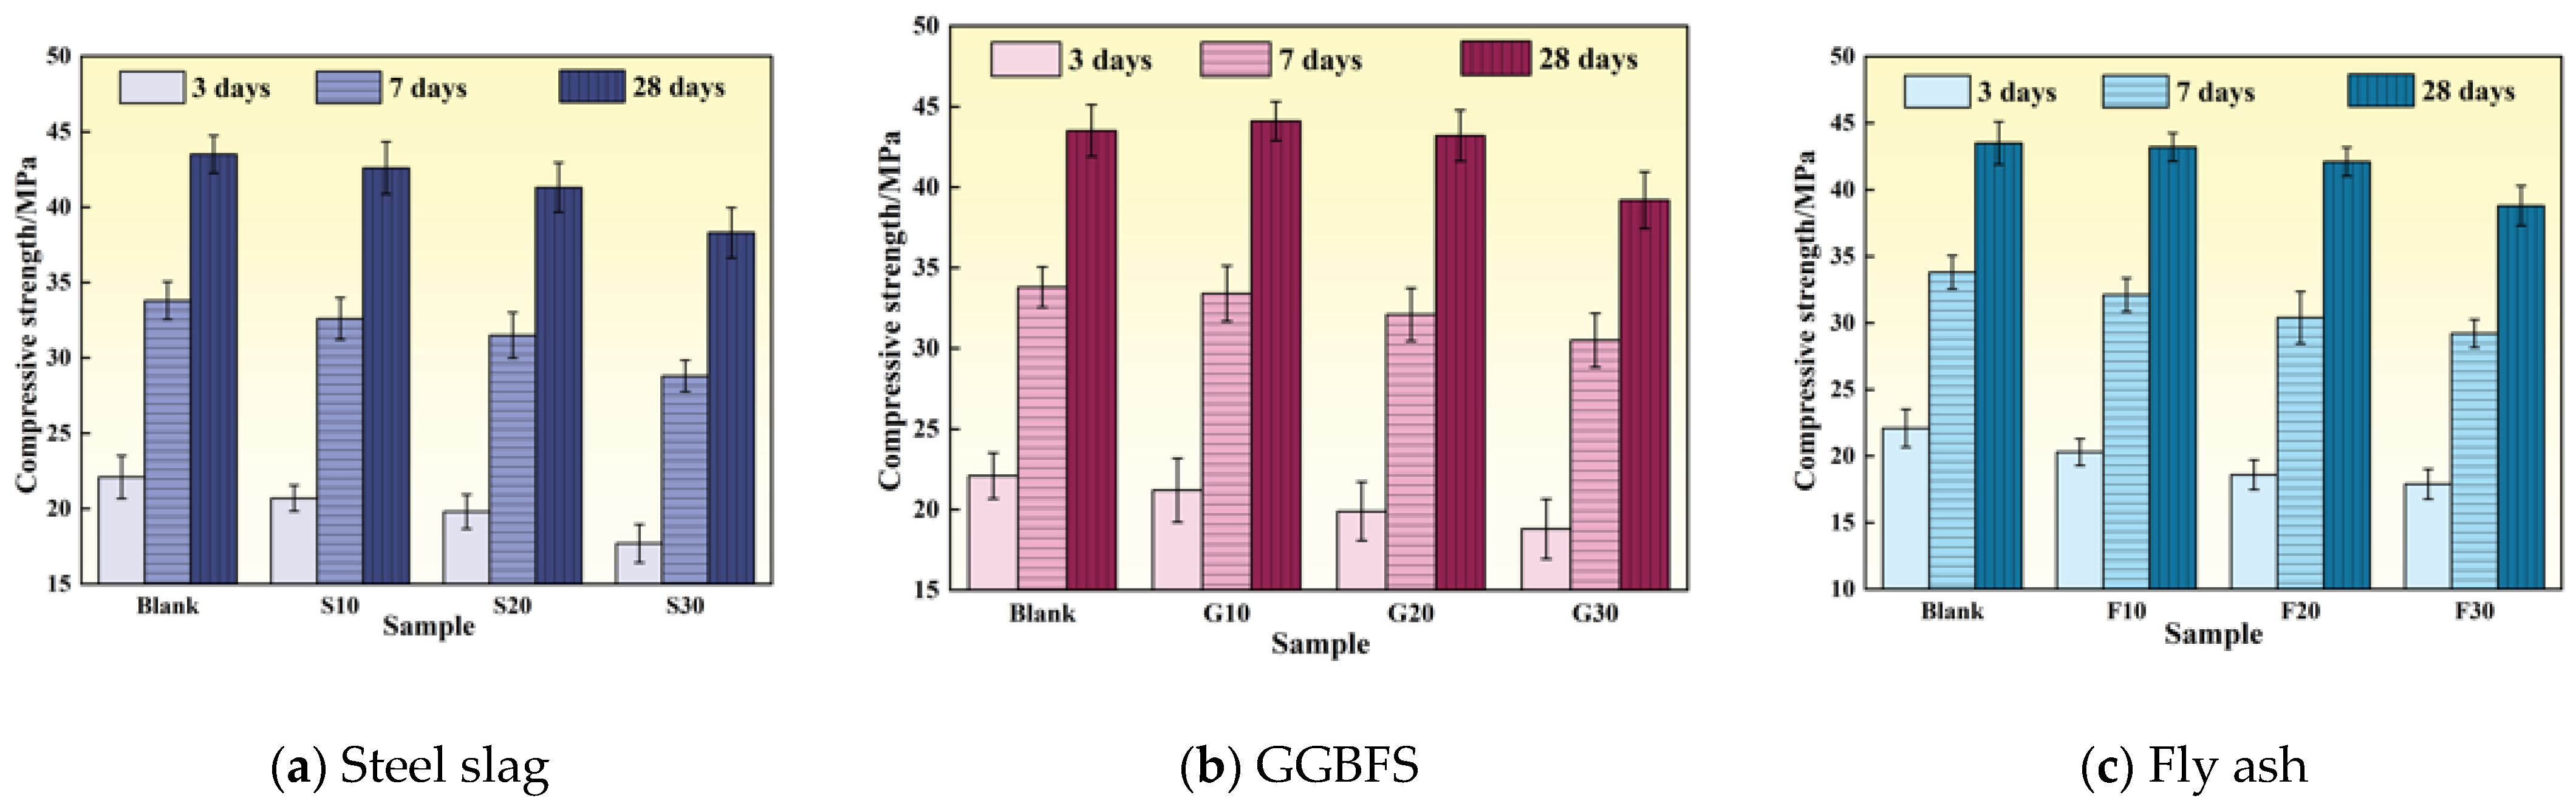
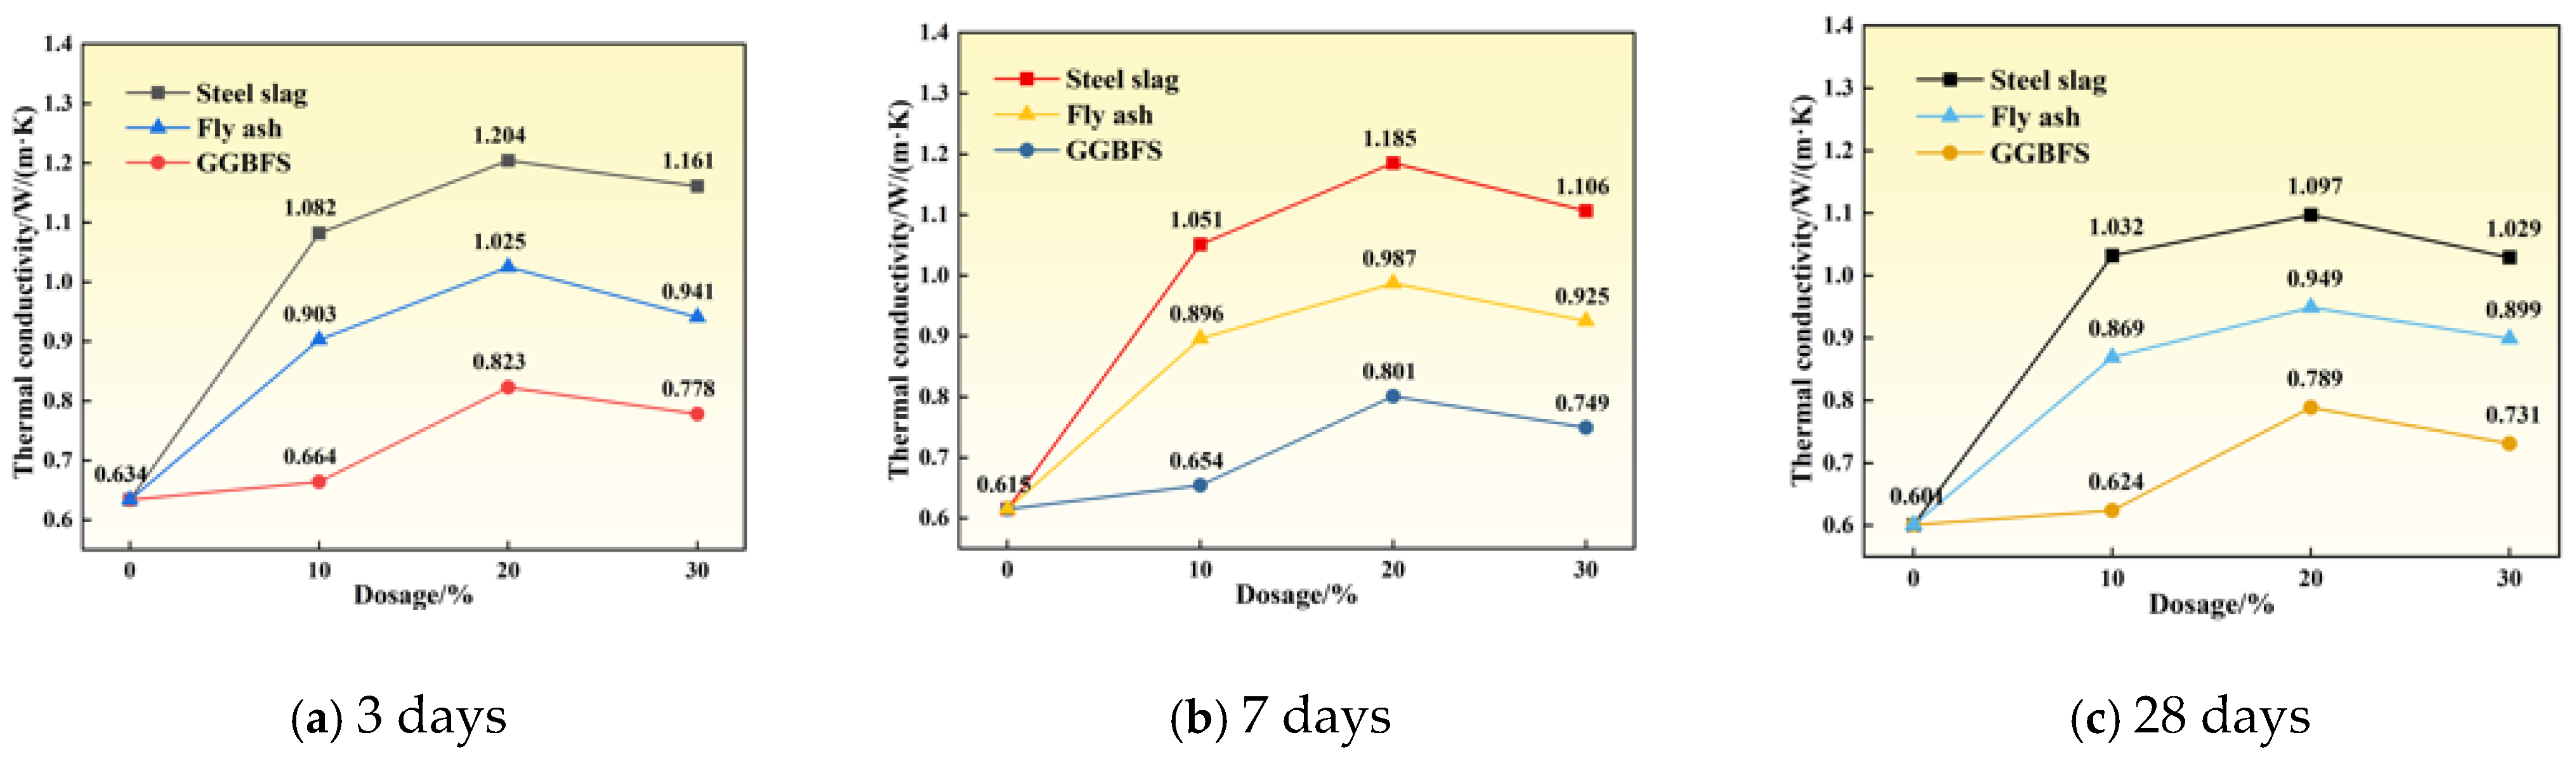
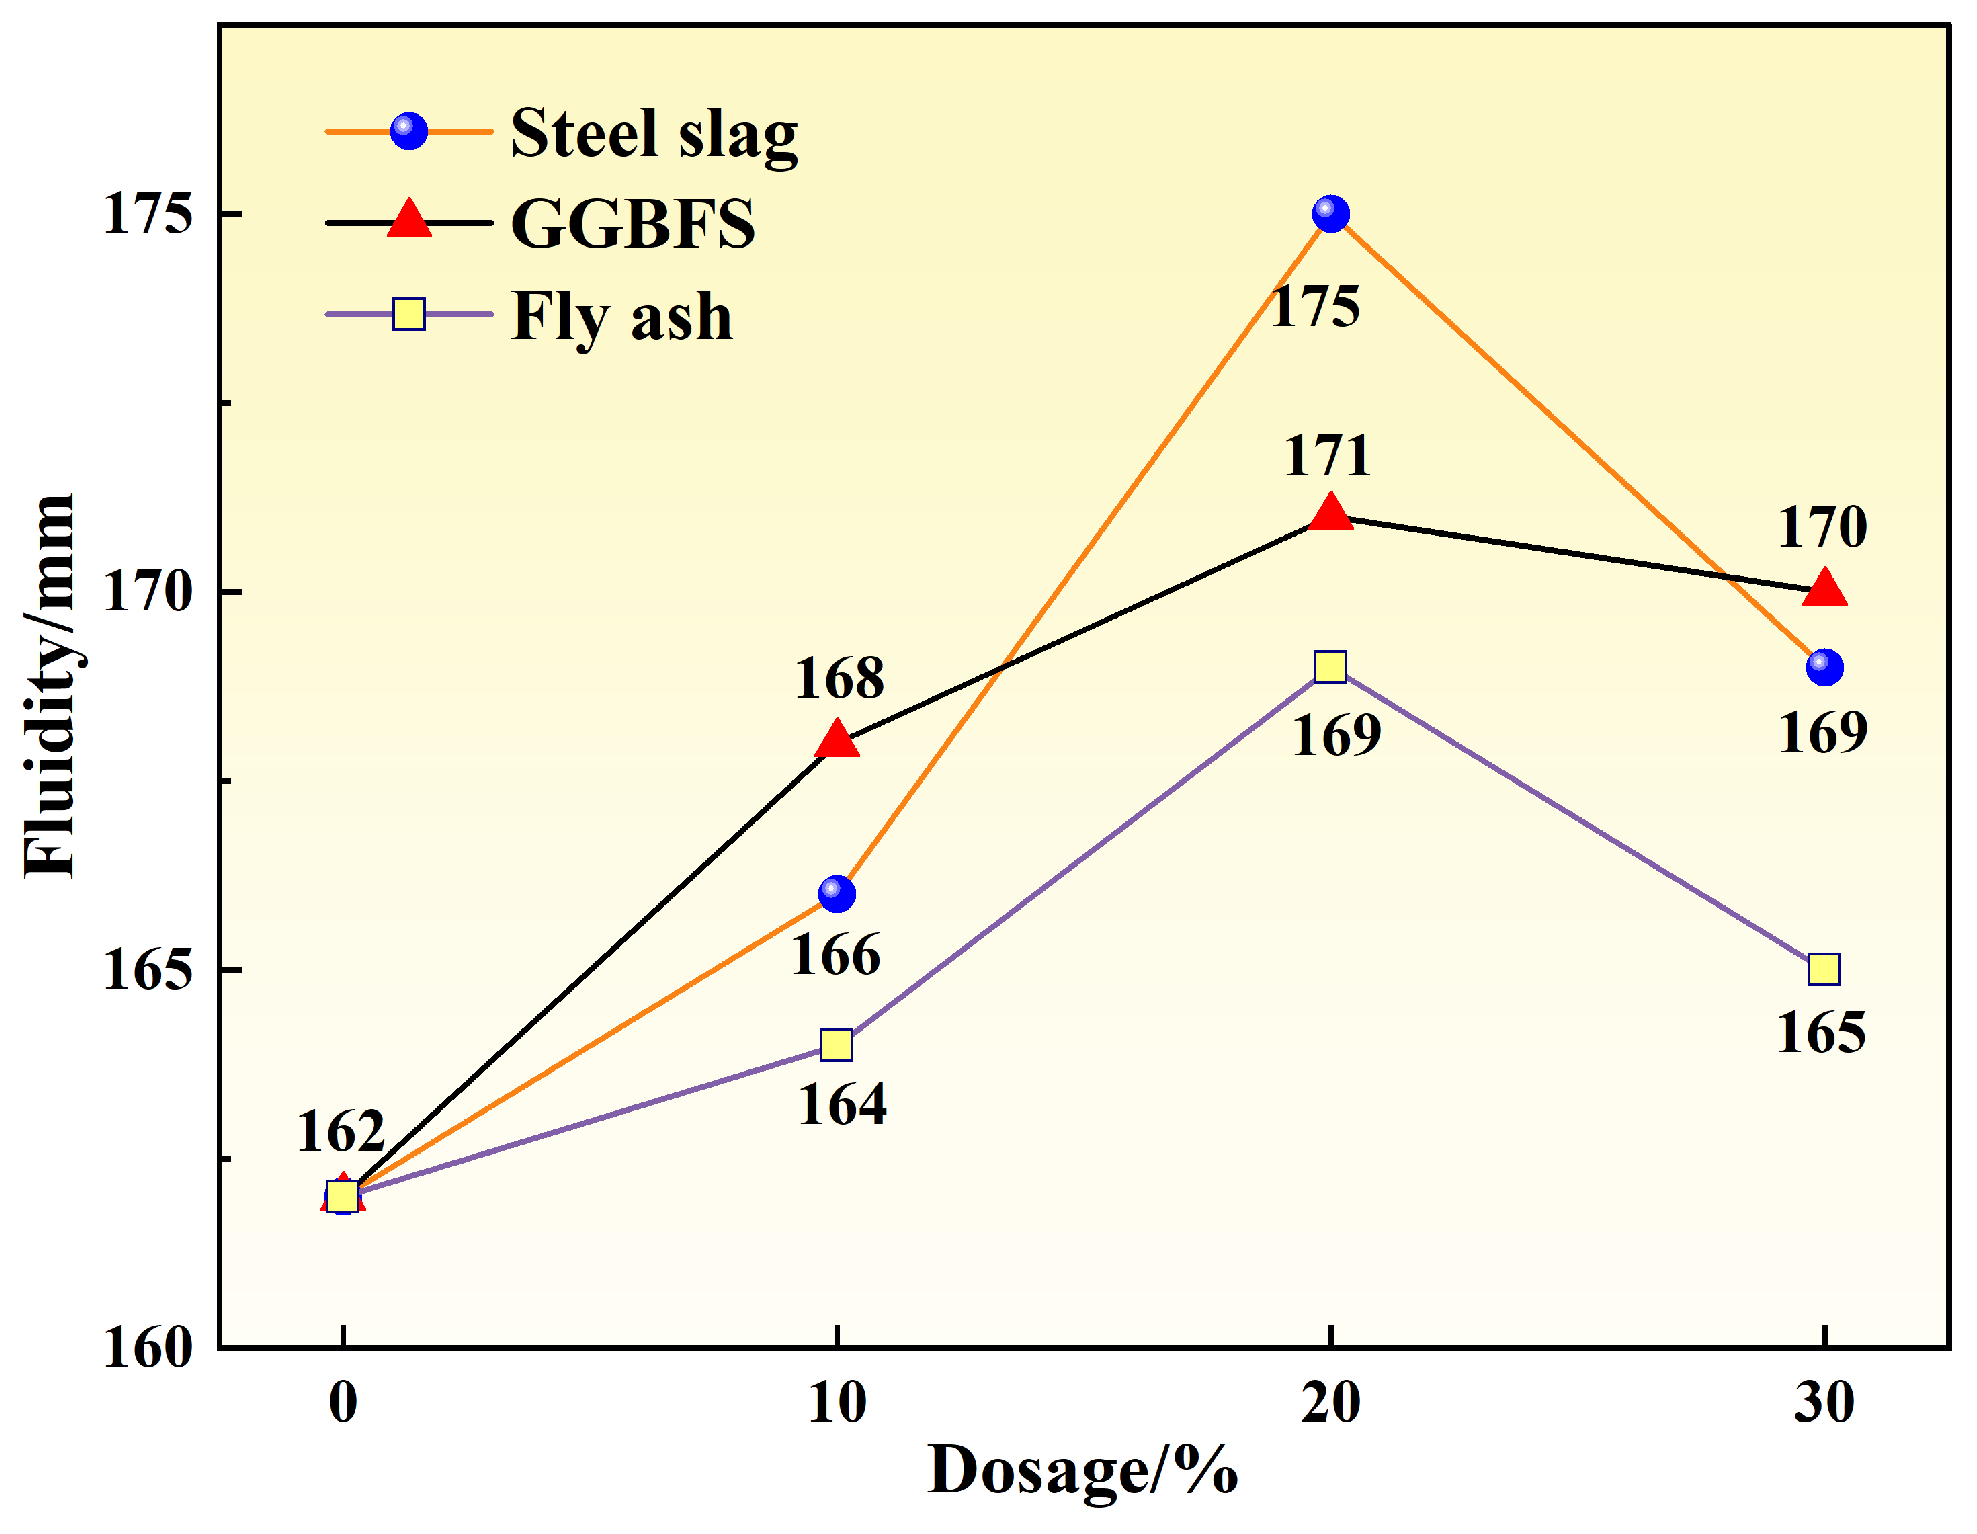
Table 3, the water-to-binder ratio (w/b) was maintained at 0.35. Cement was partially replaced by steel slag (S), ground granulated blast-furnace slag (G), and fly ash (F) to investigate the effects of different mineral admixtures on material properties. The replacement levels for each admixture were 10%, 20%, and 30% by mass of cement.
As shown in
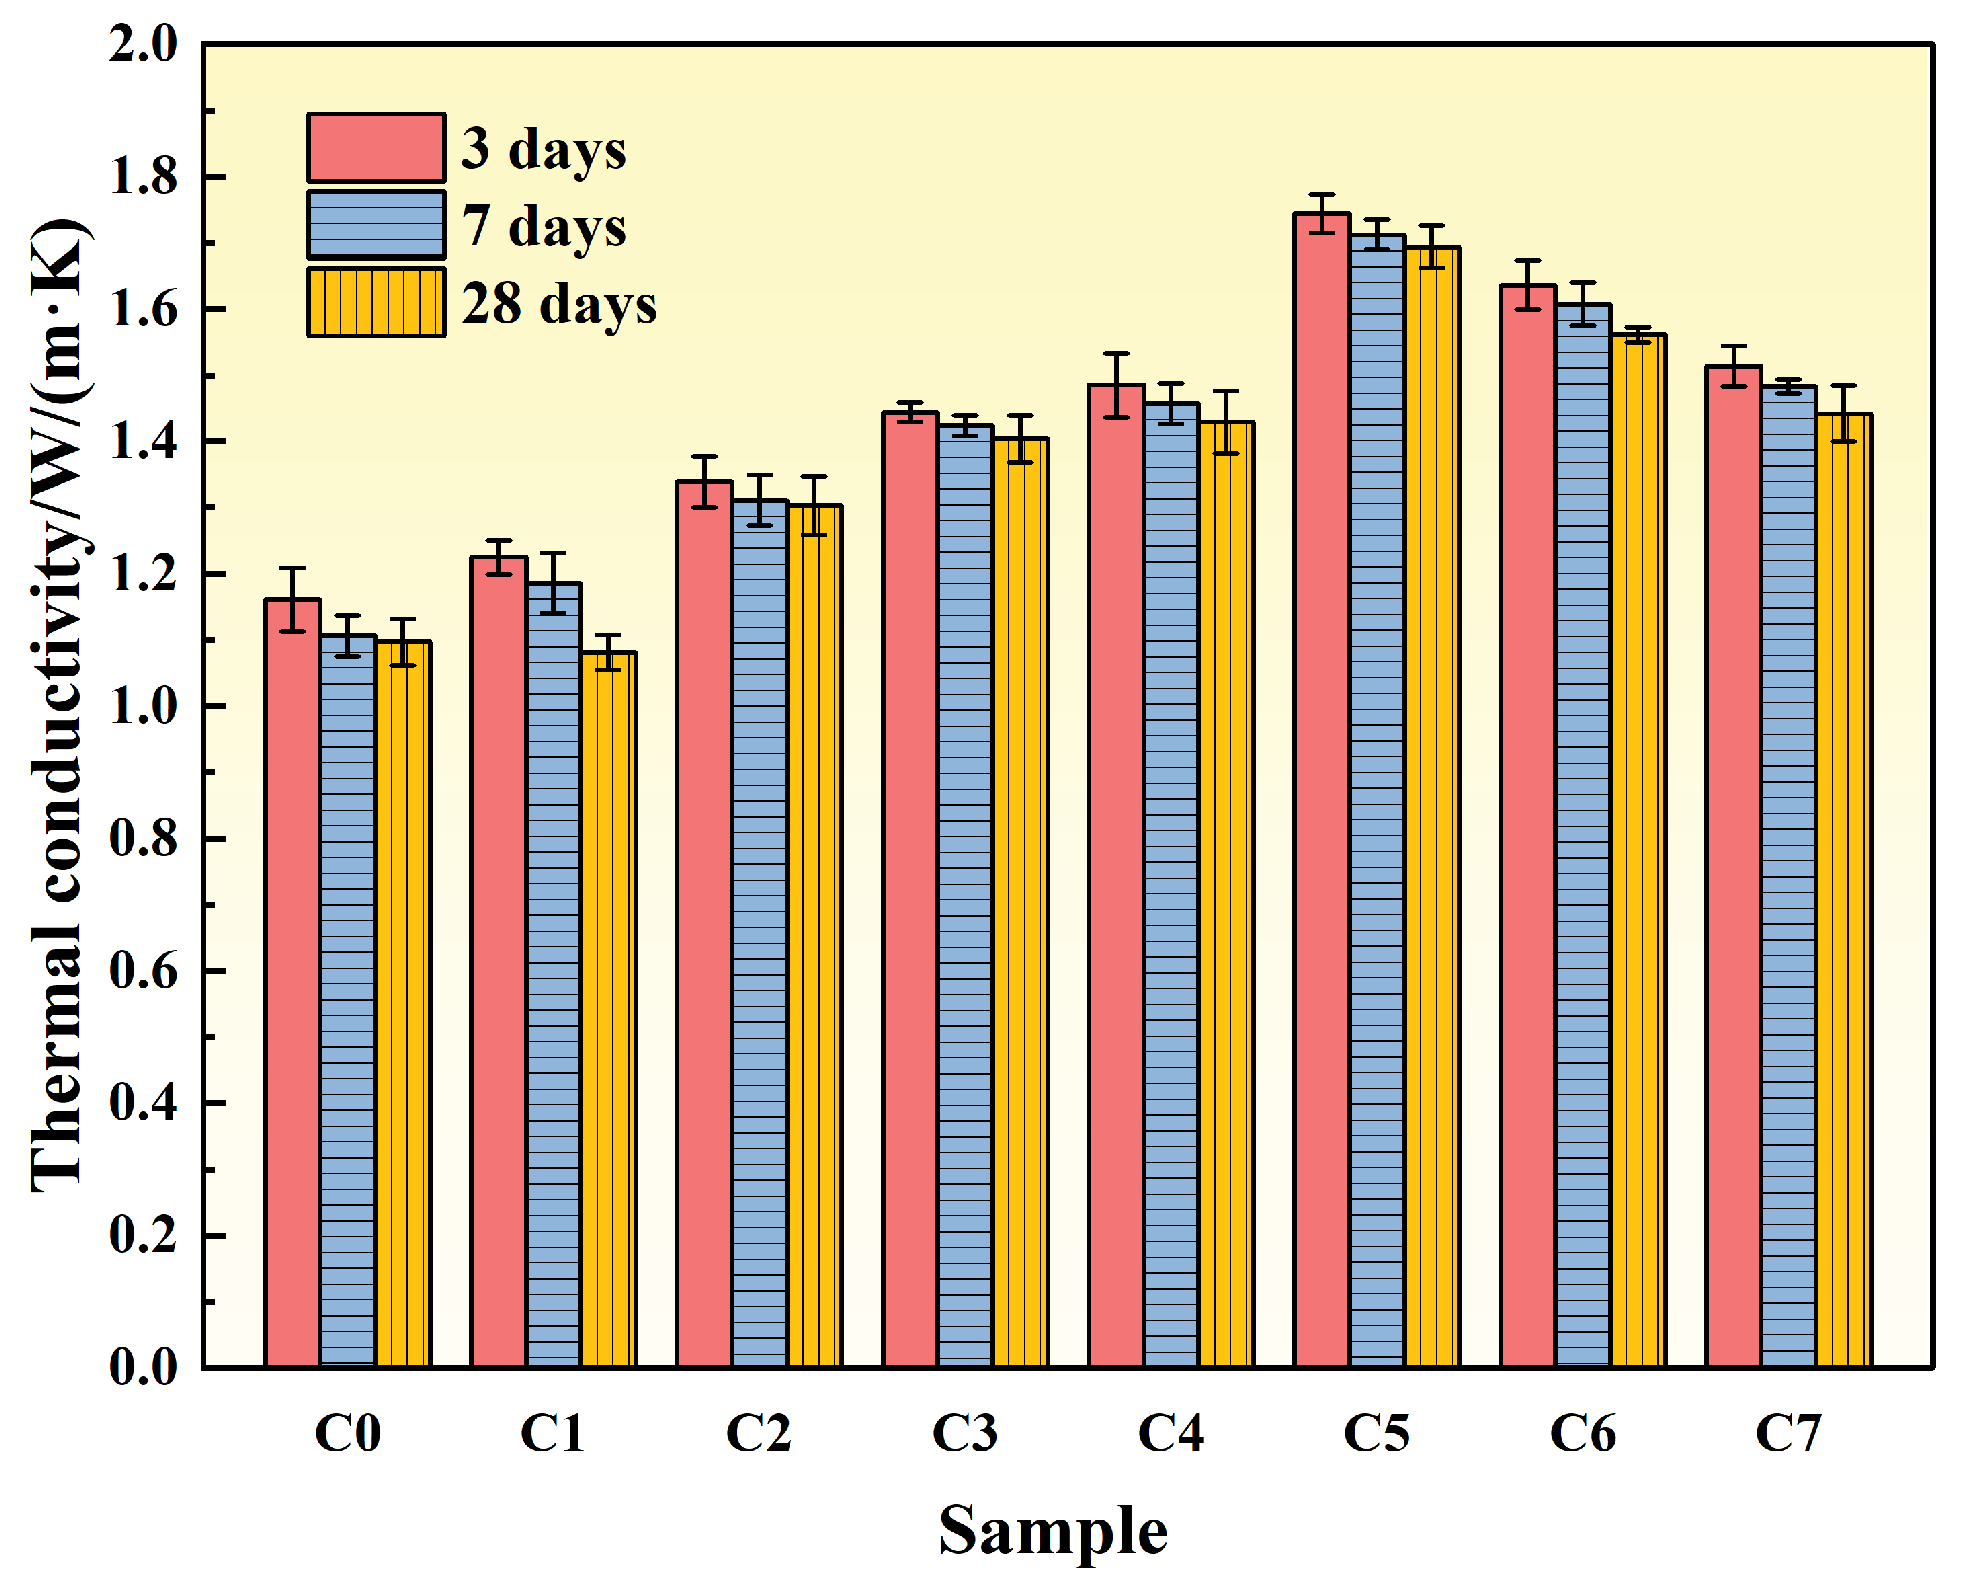
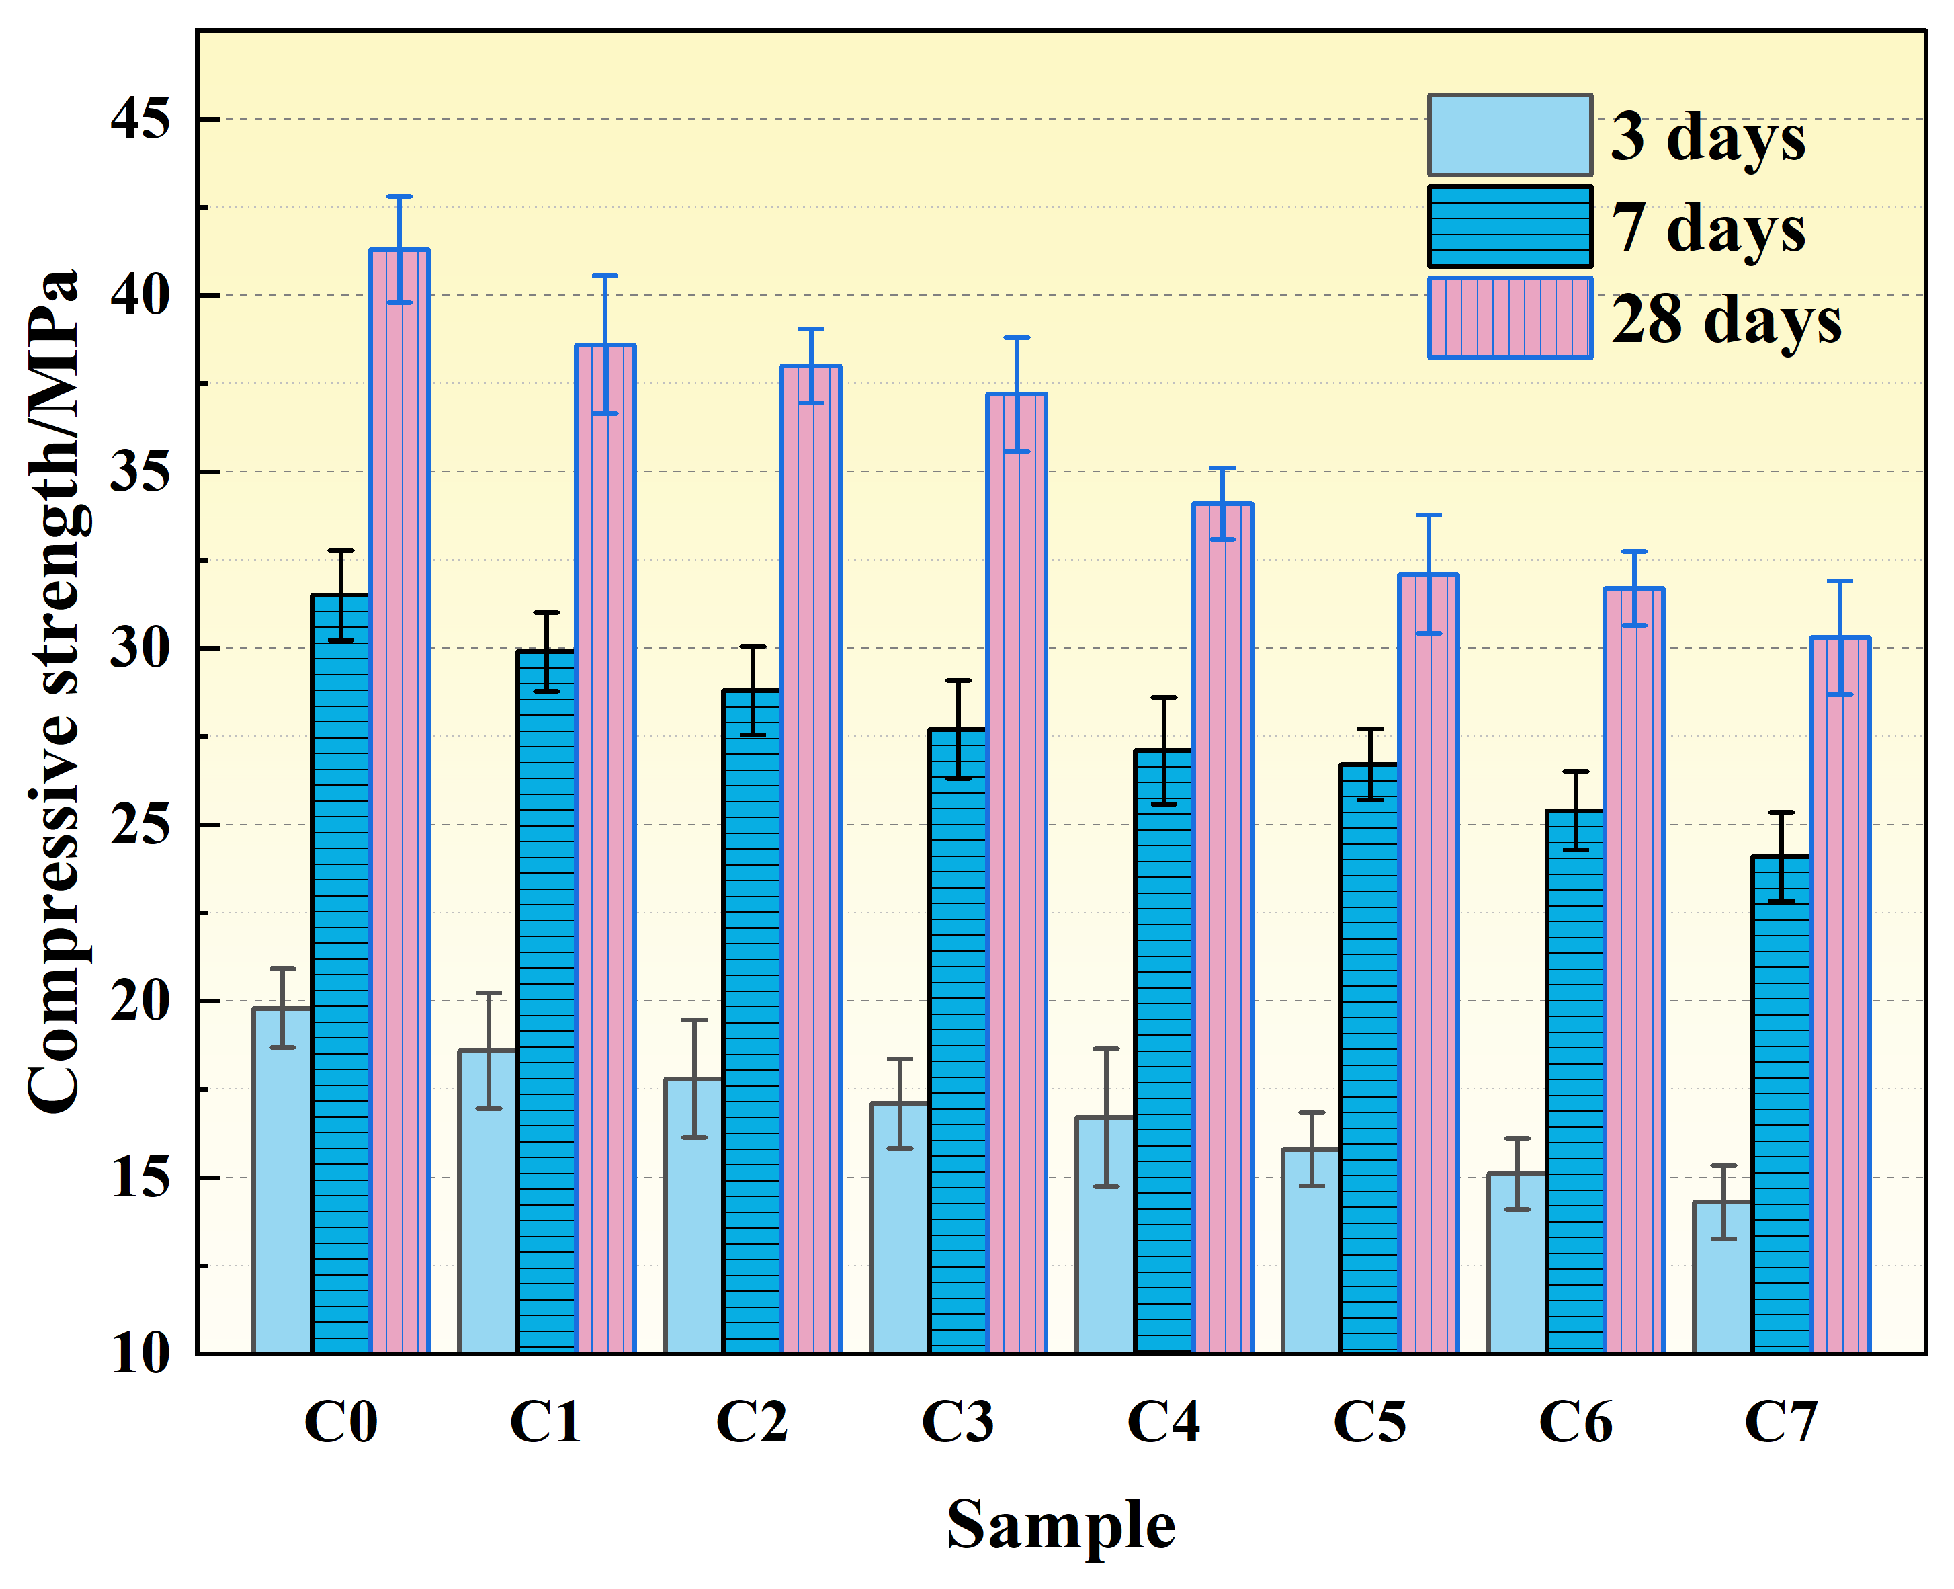
Table 4, the water-to-binder ratio was maintained at 0.35, with a steel slag content of 20% by mass of cement. Graphite powder (C) was used to partially replace cement to evaluate its effects on material properties. The replacement levels of graphite powder were 1%, 2%, 3%, 4%, 5%, 6%, and 7% by mass of cement.
As shown in
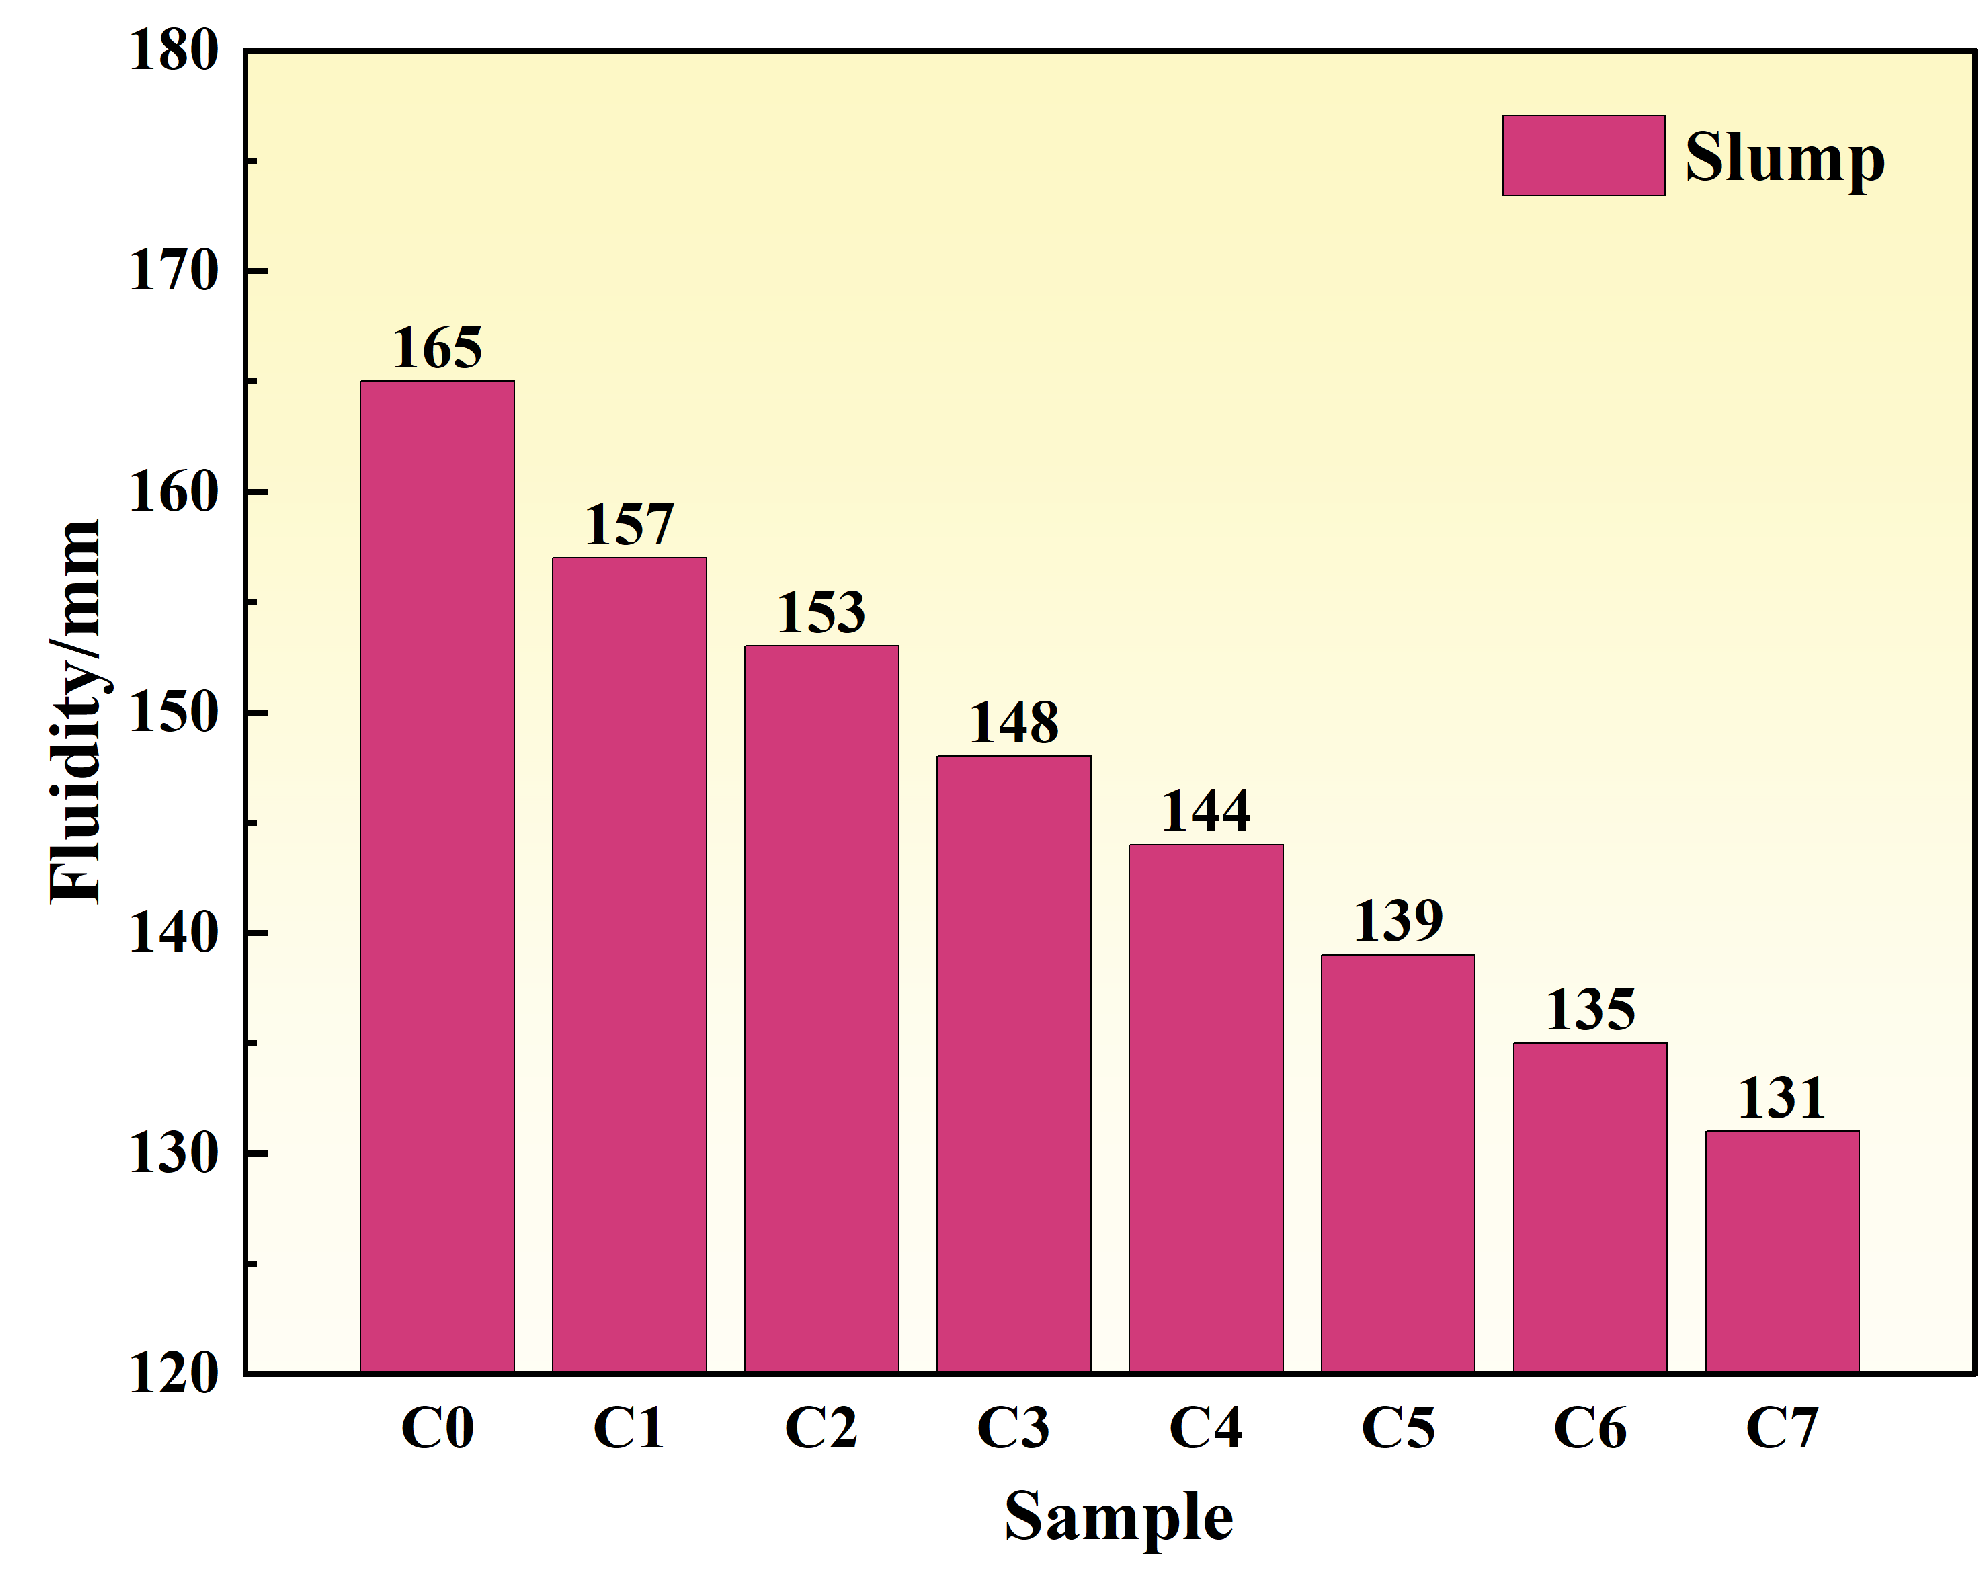
Table 5, the water-to-cement ratio (w/c) was set at 0.45, with a sand ratio of 0.40. The steel slag content was 20% by mass of cement, and the graphite powder content was 5% by mass of cement. Granite was used as the coarse aggregate, while the fine aggregate consisted of quartz sand and graphite particles (GP). Graphite particles were used to partially replace quartz sand at replacement levels of 0%, 5%, 10%, and 15% by mass of quartz sand. A polycarboxylate-based superplasticizer was incorporated to maintain slump values above 160 mm for all mixtures.
2.2.2. Test Methods
- 1.
Chemical composition analysis
The chemical compositions of raw materials were determined using a Zetium X-ray fluorescence (XRF) spectrometer (Malvern Panalytical, Almelo, The Netherlands) to ensure compliance with experimental design requirements.
- 2.
Thermal conductivity testing
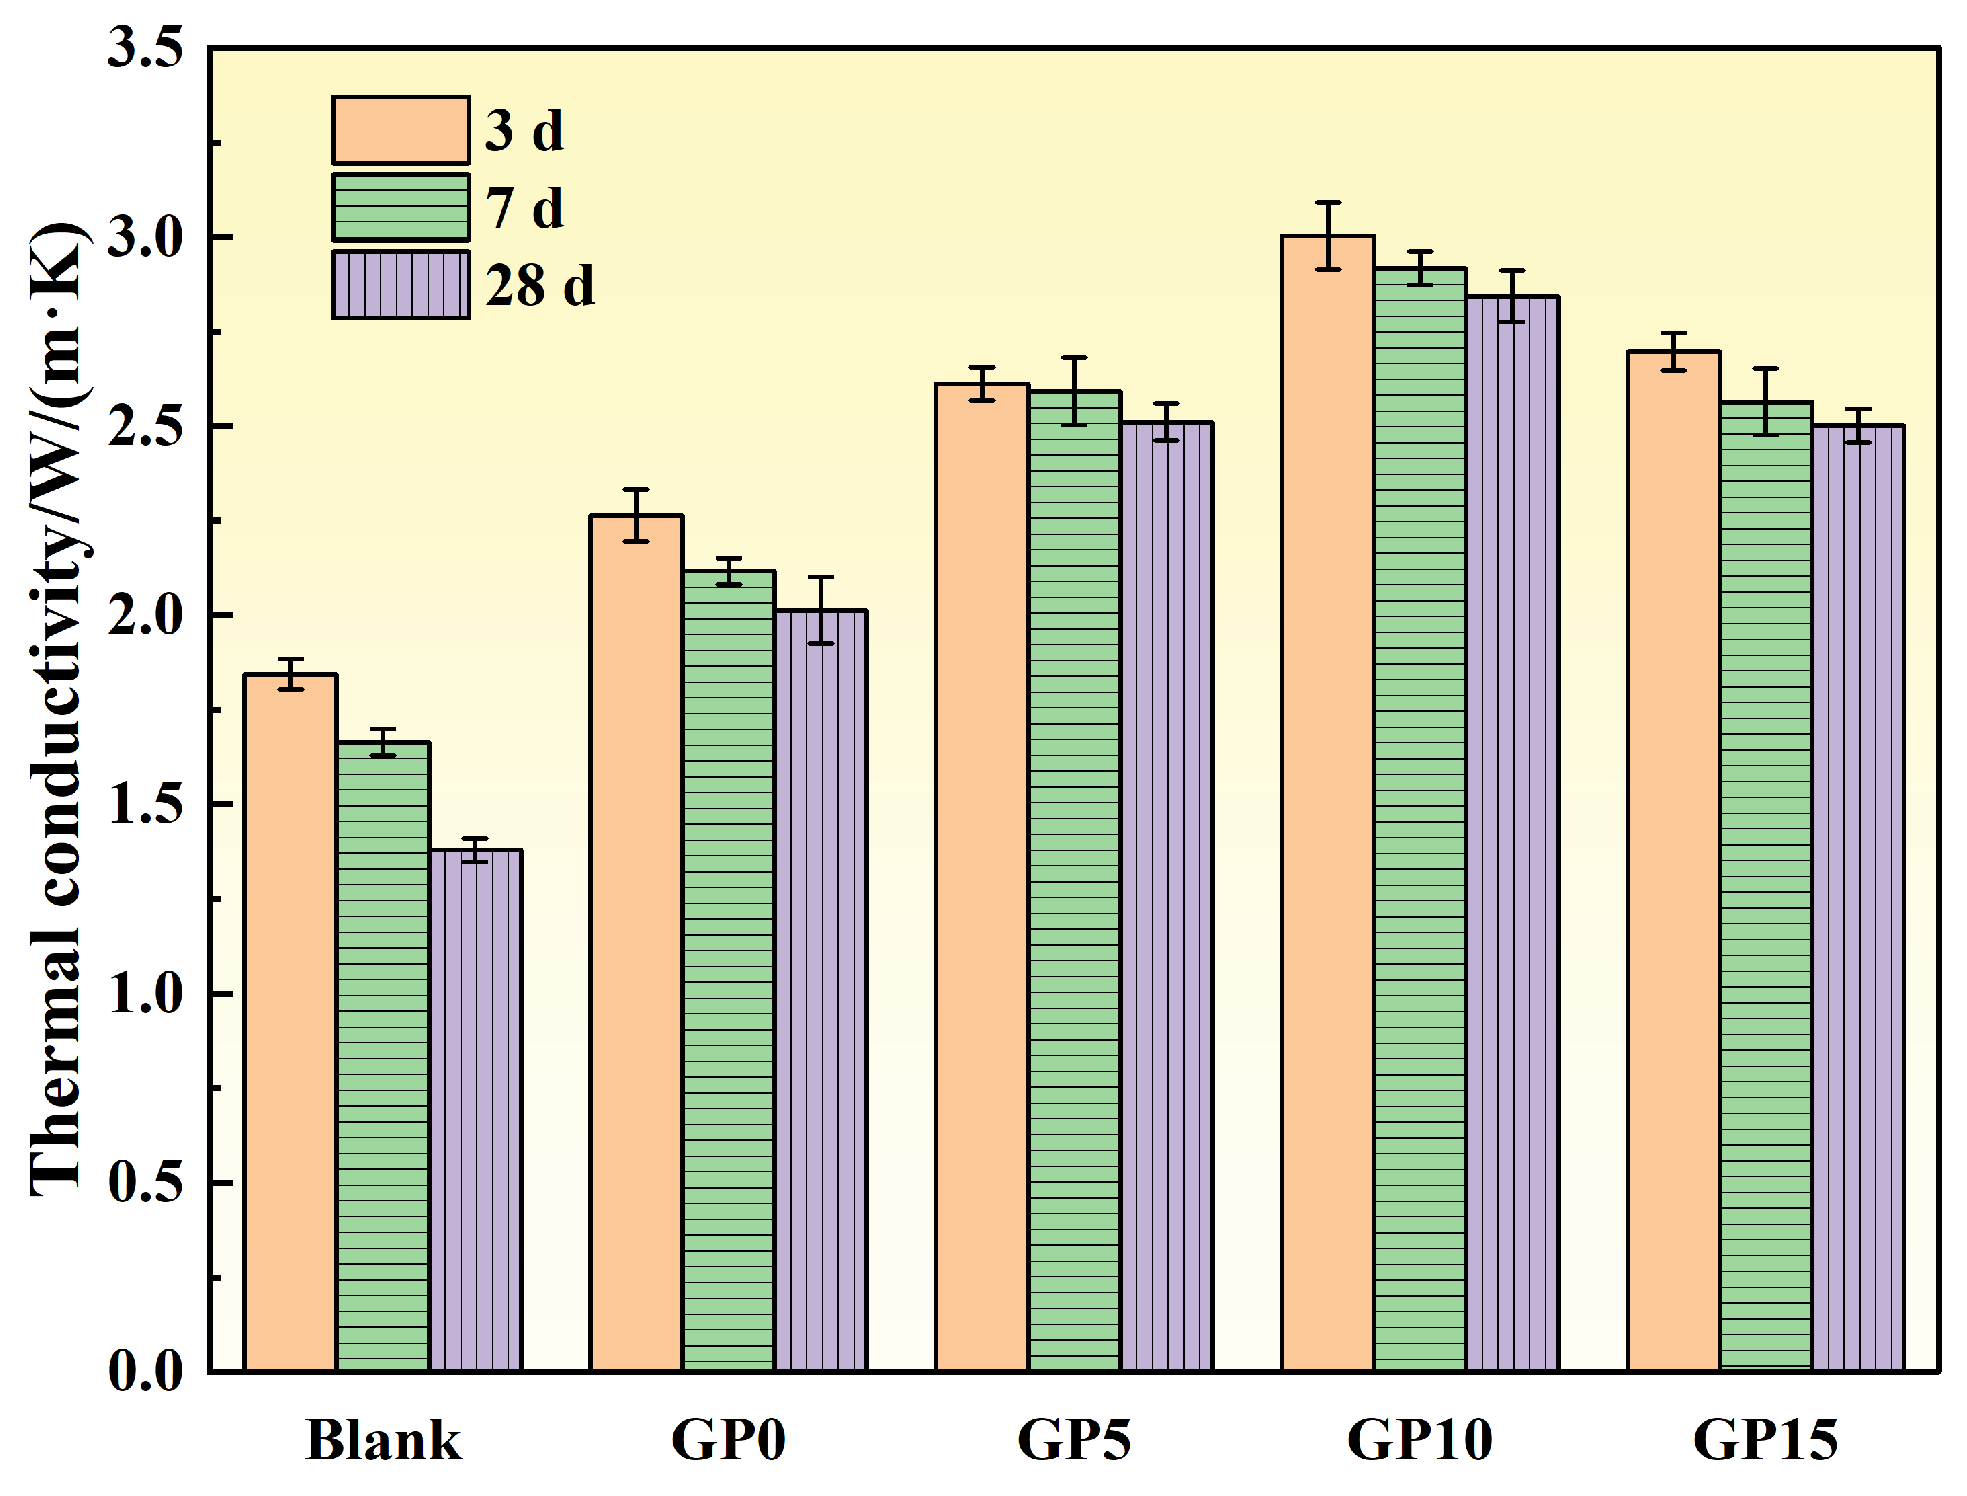
Thermal conductivity measurements were performed using a Hot Disk thermal constants analyzer (Hot Disk AB, Gothenburg, Sweden) in accordance with ISO 22007-2 [
18]. During testing, ambient temperature and humidity were maintained at stable levels to ensure the accuracy and comparability of results. Prior to thermal conductivity testing, all specimens were cured under standard conditions and subsequently stored in a controlled laboratory environment at (20 ± 2) °C and relative humidity of (60 ± 5)% until mass stabilization was achieved. Thermal conductivity measurements were conducted under this stabilized moisture condition. Although the exact gravimetric moisture content was not directly measured, the specimens can be considered to be in a near-dry and equilibrium moisture state at the time of testing.
- 3.
Mechanical properties testing
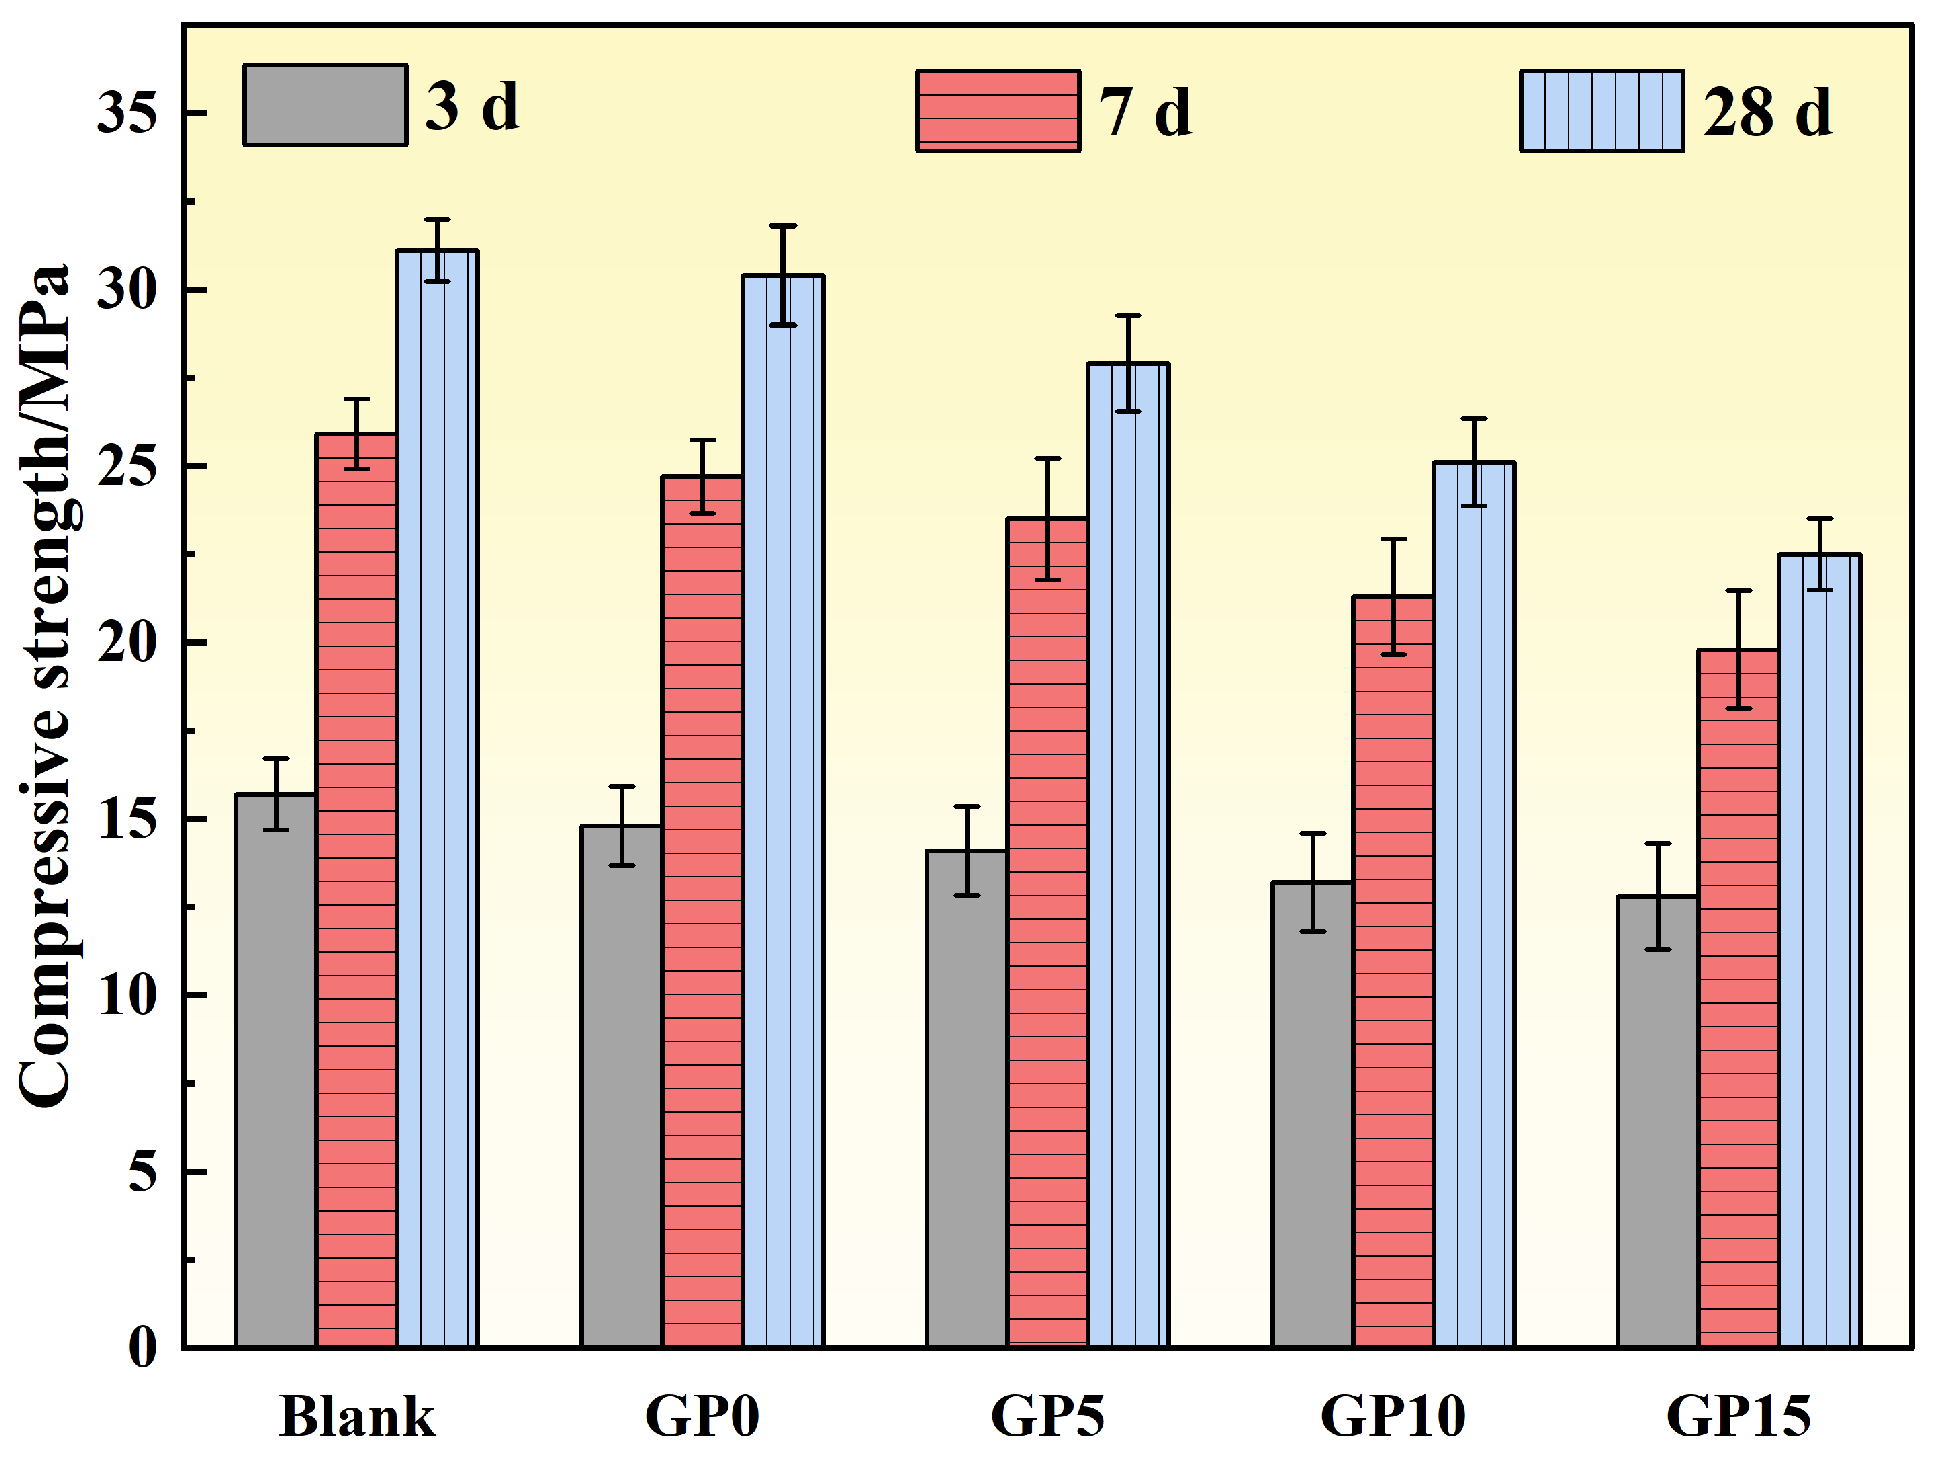
Compressive strength tests were conducted in accordance with the Chinese standard GB/T 50081-2019 [
19] Test Methods of Physical and Mechanical Properties of Concrete, using a WAY-300 fully automatic flexural and compressive testing machine (Wuxi Xiyi Building Materials Instrument Factory, Wuxi, China). Specimens were tested at curing ages of 3, 7, and 28 days under a loading rate of 0.4 MPa/s. Three parallel specimens were tested for each mix proportion, and the average value was reported as the compressive strength.
- 4.
Workability testing
The fluidity of cement paste was measured according to the Chinese standard GB/T 2419-2023 [
20] Test Method for Fluidity of Cement Mortar.
- 5.
Value engineering method
In the value engineering analysis, the value coefficient
was employed to characterize the relationship between functionality and cost, defined as Equation (1) [
16]:
where
is the function coefficient representing the weighted comprehensive evaluation of material performance, and
is the cost coefficient representing the total cost per unit volume of concrete.
The function coefficient
is calculated using Equation (2):
where
is the score of the concrete material for the
-th functional index, and
is the weight of the
-th functional index.
Based on the requirements of cable duct bank encasing engineering, four functional indices were selected: thermal performance (
Q1), mechanical performance (
Q2), workability (
Q3), and environmental sustainability (
Q4). The analytic hierarchy process (AHP) [
16] was employed to determine the weights of these indices. A judgment matrix
was established based on the relative importance of each index. Assuming that the relative importance of indices
Q1,
Q2,
Q3, …,
Qn with respect to the objective O is denoted as
, where
, the judgment matrix is expressed as
, satisfying
and
for
.
To ensure the reliability of the judgment scale
, domain experts were invited to conduct pairwise comparisons using a 1–9 scale [
16], where intermediate values (2, 4, 6, 8) indicate intermediate importance levels, and reciprocal values (1/2, 1/3, …, 1/9) indicate inverse relationships. The judgment scale is presented in
Table 6.
The judgment matrix was constructed as shown in Equation (3):
The judgment matrix
was normalized by columns to obtain matrix
, as shown in Equation (4):
The weight of each functional index
was then calculated by averaging each row, as shown in Equation (5):
The consistency of the judgment matrix was verified by calculating the maximum eigenvalue (), the consistency index (), and the consistency ratio (). Since , judgment matrix demonstrated satisfactory consistency.
The resulting weights for the functional indices were determined as follows: thermal performance (Q1) = 0.558, mechanical performance (Q2) = 0.263, workability (Q3) = 0.122, and environmental sustainability (Q4) = 0.057.
The cost coefficient
represents the total cost per cubic meter of concrete, comprising material cost, labor cost, equipment cost, and management cost, as defined in Equation (6):
where
,
,
, and
represent the costs of materials, labor, equipment, and management, respectively.
- 6.
Experimental repeatability and data analysis
For each concrete mixture, multiple specimens were prepared and tested to ensure measurement repeatability. Thermal conductivity measurements were conducted on three independently prepared specimens for each mix, and each specimen was measured three times under identical conditions. The reported thermal conductivity values represent the average of these measurements.
Compressive strength tests were performed on three cubic specimens for each mixture in accordance with the corresponding testing standards. The mean values are reported in this study. Measurement uncertainty associated with the thermal conductivity tester was within the manufacturer-specified accuracy range, and efforts were made to minimize systematic errors by maintaining consistent specimen dimensions, curing conditions, and testing procedures across all mixtures.
Basic statistical analysis was applied to the experimental results. Where applicable, standard deviations are provided to indicate data dispersion and measurement variability. Given the comparative and trend-focused objective of this study, no advanced statistical hypothesis testing was performed. This trend-focused approach is consistent with recent experimental studies on cement-based composites, where comparative analysis under standardized conditions is emphasized over formal hypothesis testing [
9,
21].