3.1. Crystal Structures of Re3Zr Phases
For Re–Zr intermetallics, crystal structure governs atomic packing and bonding and therefore underpins phase stability and mechanical response. A recent first-principles study considered Re
3Zr in the cubic
Pm-3
n structure [
12]. In that work, however, the A15 (Cr
3Si-type) structure was treated as a predefined candidate and subsequently optimized rather than identified through an unbiased global structure search. Other competitive Re
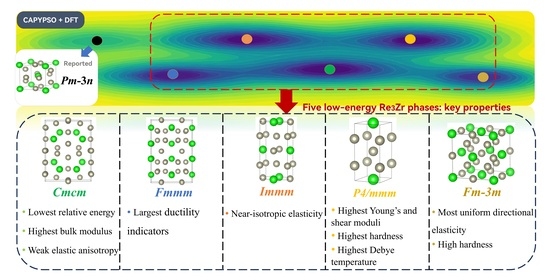
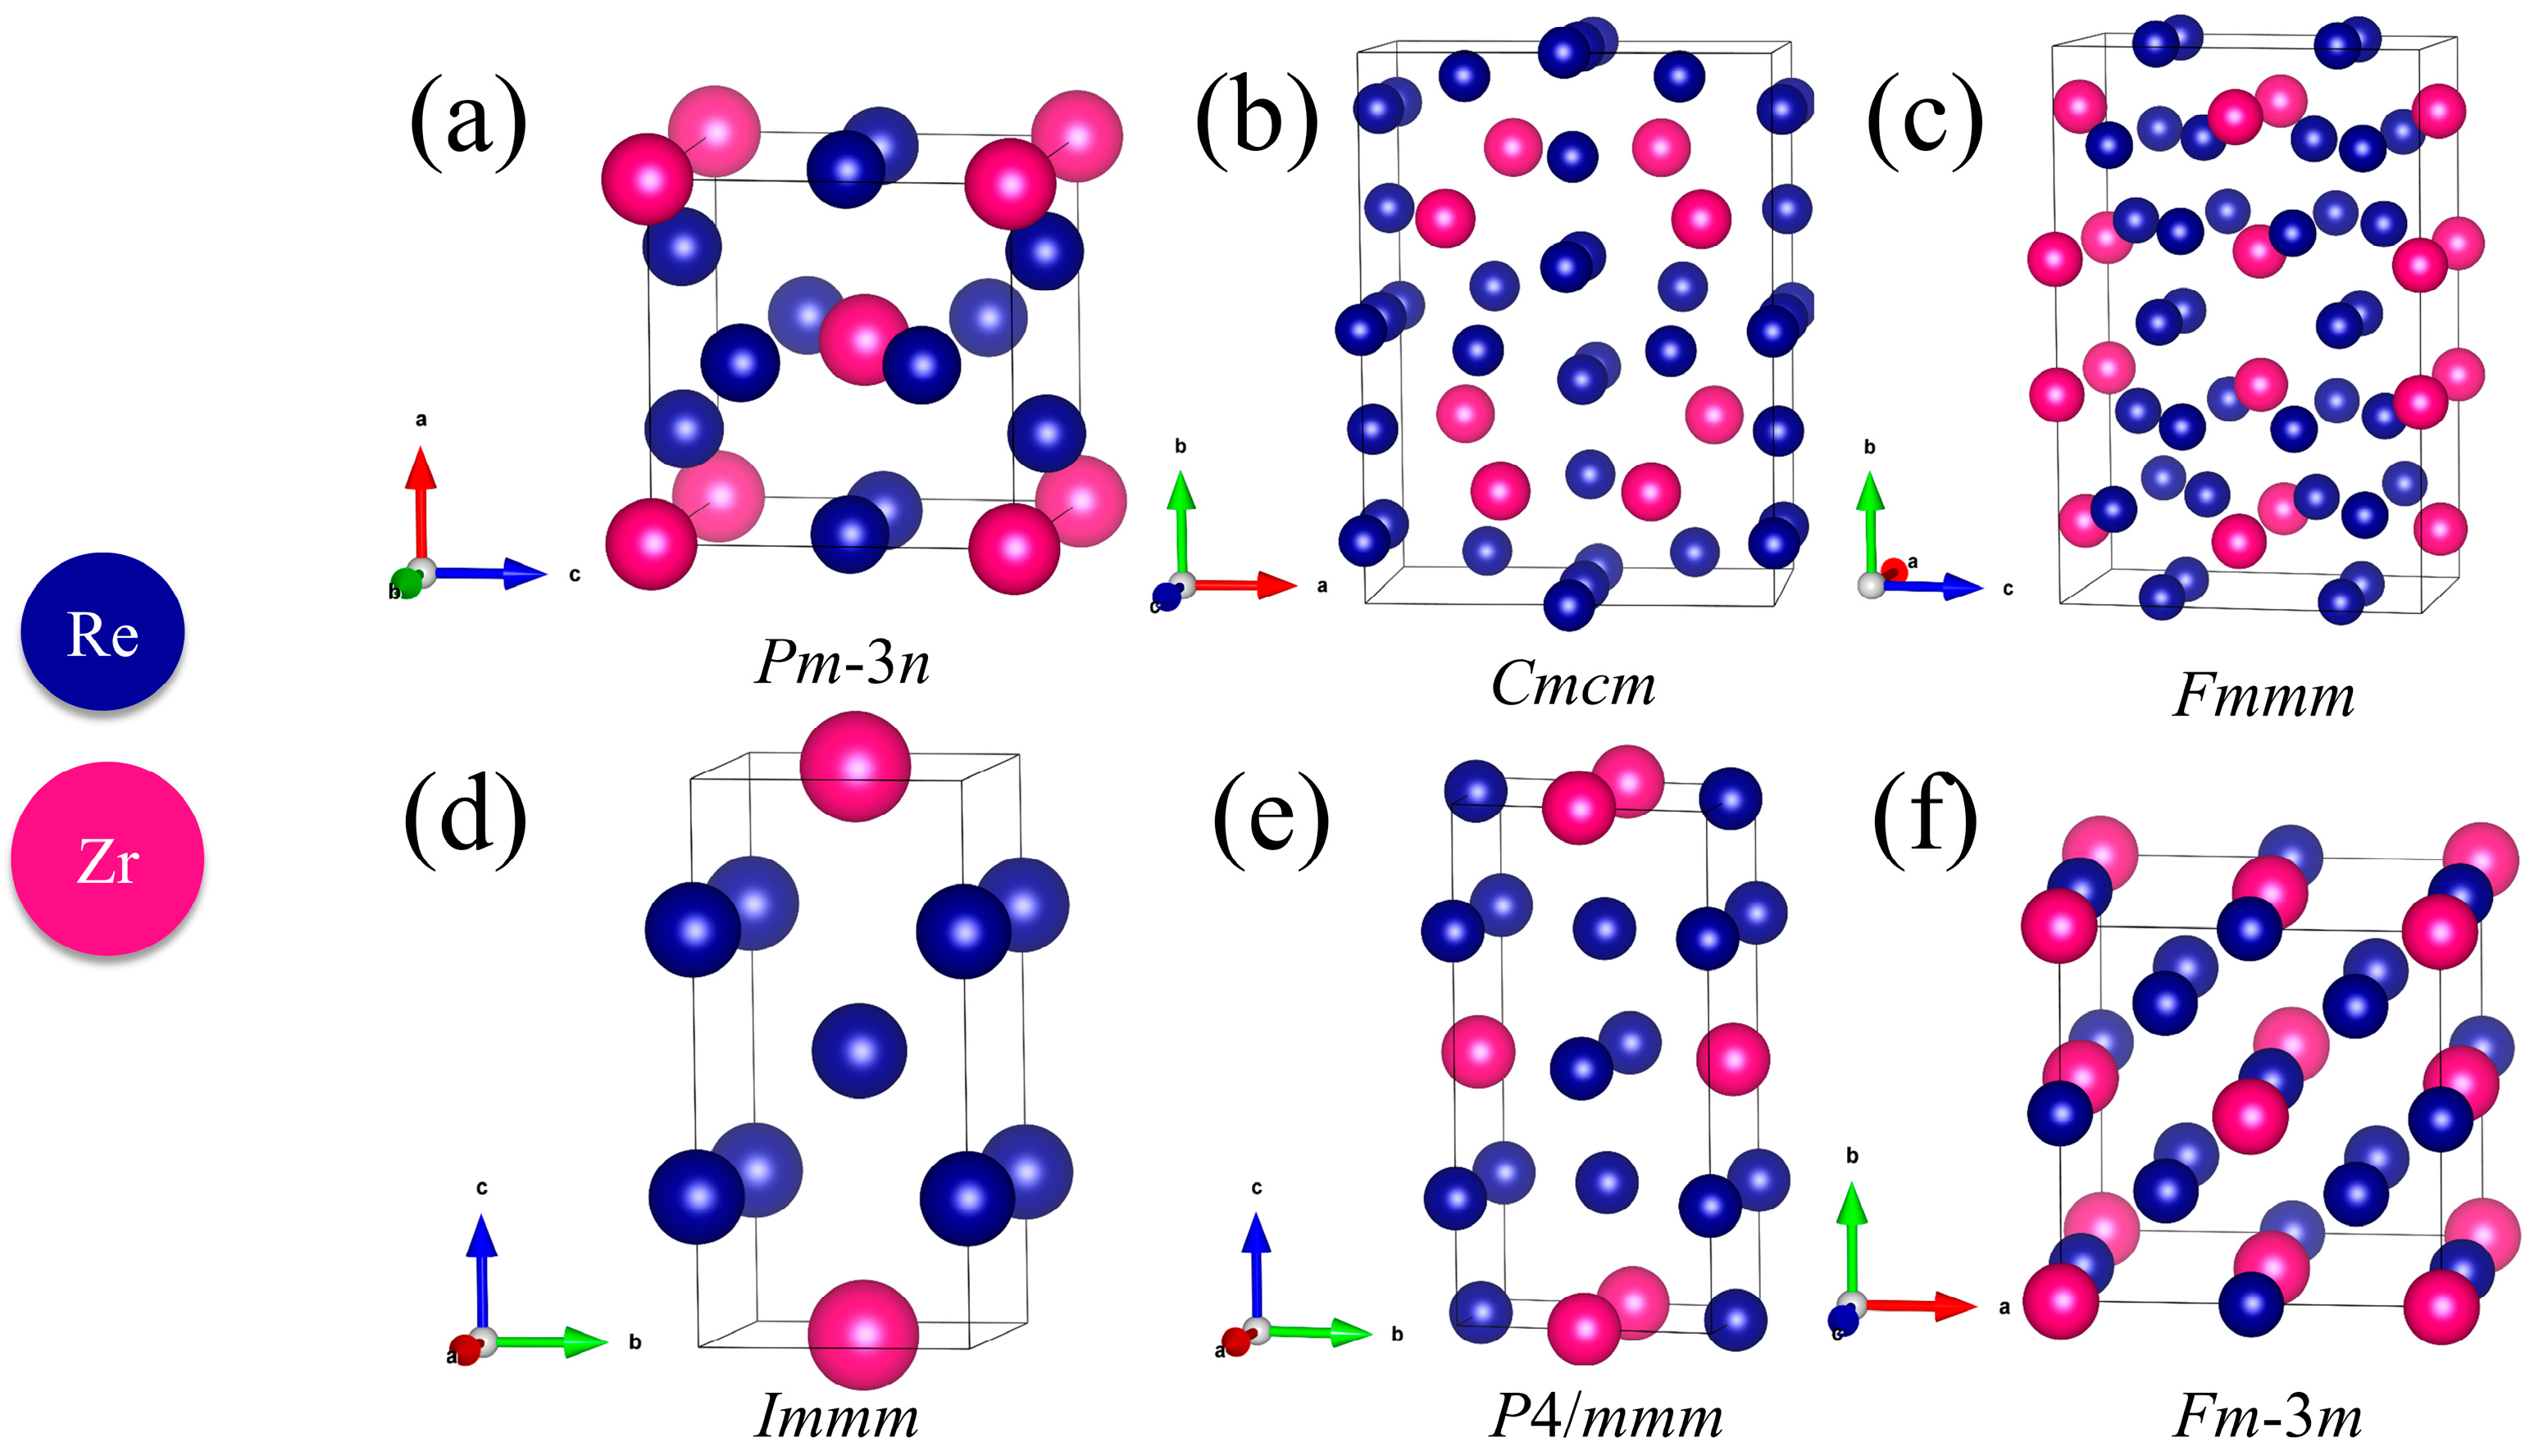
3Zr configurations may therefore have been overlooked. To explore the structural landscape more comprehensively, a global search was performed at ambient pressure using the particle swarm optimization algorithm implemented in CALYPSO. Five candidate phases with
Cmcm,
Fmmm,
Immm,
P4/
mmm, and
Fm-3
m symmetries were identified and evaluated alongside the reported
Pm-3
n phase. Their optimized structures are shown in
Figure 1, the principal crystallographic parameters are listed in
Table 1, and the nonequivalent atomic sites and local coordination environments are summarized in
Table 2. The fully optimized lattice vectors and fractional atomic coordinates of all six Re
3Zr polymorphs are provided in the
Supplementary Materials in VASP POSCAR format (
Tables S1–S6). These structural results provide the basis for the subsequent stability and mechanical-property analyses.
To clarify how crystal symmetry changes the packing of Re3Zr at fixed composition, the global crystallographic features of the six phases are first compared. The structures span three crystal systems: orthorhombic Cmcm, Fmmm, and Immm; tetragonal P4/mmm; and cubic Pm-3n and Fm-3m. Their conventional cells contain between one and eight formula units. The Cmcm and Fmmm phases have the largest cells, each containing eight formula units, whereas P4/mmm contains only one. The volume per formula unit, which enables a direct packing comparison among cells of different sizes, ranges from 65.04 Å3 for Fm-3m to 69.53 Å3 for Fmmm. Correspondingly, Fm-3m has the highest density of 16.59 g cm−3, while Fmmm has the lowest value of 15.52 g cm−3. The remaining four phases lie within a narrower density range of 15.98–16.52 g cm−3. Thus, even at the same stoichiometry, the alternative symmetries produce appreciable differences in packing efficiency.
Because global lattice parameters alone do not reveal the bonding topology that controls stability and deformation, the local coordination environments were examined further (
Table 2). Here, Zr
xRe
y denotes a coordination environment containing
x Zr and
y Re nearest neighbors, and CN is the total coordination number. The
Cmcm phase contains five nonequivalent sites with CN values of 12–16 and the broadest bond-length interval of 2.60–3.08 Å, indicating a heterogeneous local environment. The
Fmmm phase also shows mixed coordination, with CN = 8–12 and bond lengths of 2.57–3.04 Å. By contrast, all nonequivalent sites in
Immm and
P4/
mmm are eightfold coordinated, and their narrow bond-length ranges of 2.72–2.82 and 2.72–2.83 Å, respectively, indicate more uniform first-neighbor environments. In the A15-type
Pm-3
n phase, Zr at the 2a site is surrounded by 12 Re atoms, whereas Re at the 6d site has four Zr and two Re nearest neighbors. The
Fm-3
m phase exhibits eightfold coordination at all nonequivalent sites and a single nearest-neighbor distance of 2.76 Å, representing the most uniform local geometry among the six structures. The contrast between these heterogeneous and uniform coordination motifs provides an atomistic basis for interpreting the energetic, vibrational, and elastic responses discussed below.
Before ranking the competing phases, the reported
Pm-3
n structure provides a useful internal benchmark for the present calculations. Its optimized lattice constant of 5.113 Å differs from the previous theoretical value of 5.116 Å by only 0.06%, and the corresponding densities are 16.15 and 16.12 g cm
−3, respectively [
12]. This close agreement validates the present structural-relaxation settings for the reference model. It does not, however, establish
Pm-3
n as the preferred phase. The pronounced differences in cell size, packing density, and local coordination among the six candidates therefore motivate the energetic, dynamical, and mechanical stability assessments presented in the following subsection.
3.2. Stability and Mechanical Properties
Static energy ordering among polymorphs at a fixed composition and thermodynamic stability against decomposition into competing phases address different questions. We therefore first compare the energy–volume relations of the six Re
3Zr polymorphs and then place them in the compositional context of the Re–Zr system using consistently calculated formation enthalpies and a selected-phase partial convex hull. The energy–volume data were fitted using the third-order Birch–Murnaghan equation of state (EOS) [
24]:
where
E0,
V0,
B0, and
B0′ are the equilibrium energy, equilibrium volume, bulk modulus, and pressure derivative of the bulk modulus, respectively. The resulting energy–volume relations describe the fixed-composition energetic ordering of the six Re
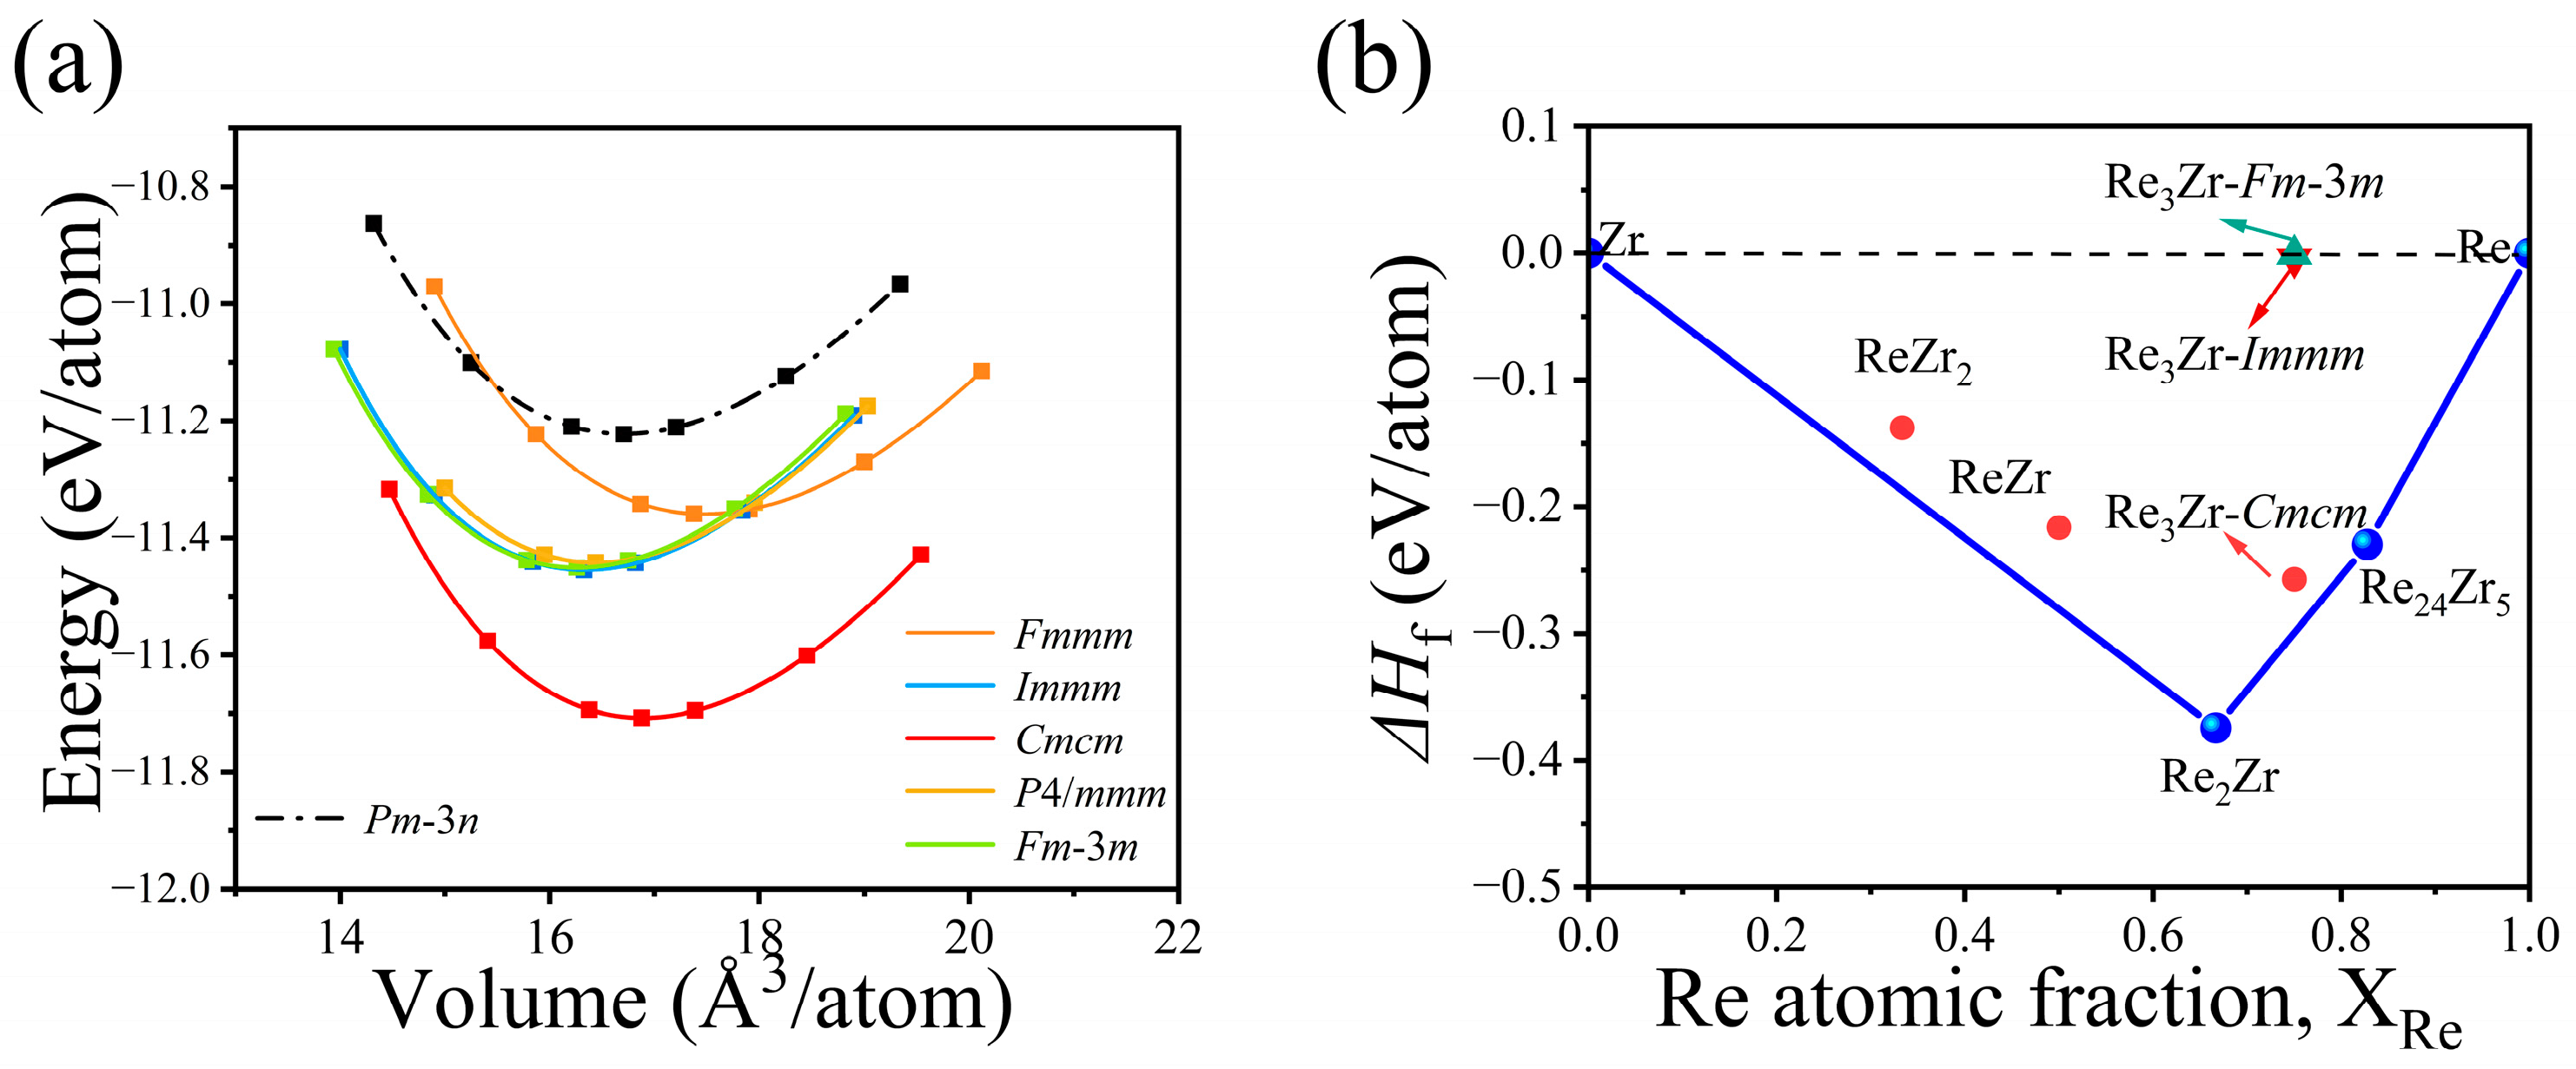
3Zr polymorphs and their response to isotropic volume changes. As shown in
Figure 2a, the calculated energy–volume points are smoothly reproduced by the EOS fits. The
Cmcm phase has the lowest equilibrium energy and remains the lowest-energy structure throughout the sampled volume range. The
Immm,
Fm-3
m, and
P4/
mmm phases lie approximately 0.25–0.27 eV atom
−1 above
Cmcm, whereas
Fmmm is approximately 0.35 eV atom
−1 higher. The previously reported
Pm-3
n phase has the highest minimum energy, approximately 0.49 eV atom
−1 above
Cmcm. Thus,
Cmcm is the lowest-energy structure among the six Re
3Zr polymorphs considered at 0 K and 0 GPa. This fixed-composition comparison, however, does not by itself establish stability against decomposition into other Re–Zr phases.
To evaluate stability against decomposition, the formation enthalpy per atom of each ReₓZrᵧ compound was calculated according to
where
is the calculated total energy of the compound, and
and
are the calculated energies per atom of elemental Re and Zr in their respective hexagonal ground-state structures.
Figure 2b presents a selected-phase partial convex hull constructed exclusively from energies calculated using the same computational settings and elemental reference states. The calculated formation enthalpies of ReZr
2, ReZr, Re
2Zr, and Re
24Zr
5 are −0.138, −0.216, −0.374, and −0.230 eV atom
−1, respectively. For Re
2Zr, the present value differs by 0.017 eV atom
−1 from the Materials Project value of −0.357 eV atom
−1 for the corresponding Re
2Zr entry (mp-12109) [
36]. This database value is used only as an external numerical reference and was not included in constructing
Figure 2b. Re
25Zr
21 was excluded from the partial hull because an energy obtained using the same computational settings was unavailable. The Materials Project reports a formation energy of −0.347 eV atom
−1 for Re
25Zr
21 (mp-574458) [
37]; this value is likewise quoted only for reference and was not combined with the present DFT energies. The calculated formation enthalpy of
Pm-3
n Re
3Zr, +0.255 eV atom
−1, differs markedly from the negative value reported by Pan et al. [
12]. All entries used in
Figure 2b were evaluated within a single internally consistent reference scheme, and the present
Pm-3
n value is therefore retained. The origin of the discrepancy remains to be independently resolved.
At the Re
3Zr composition, the relevant tie line of the selected-phase partial hull connects Re
2Zr and Re
24Zr
5 and has an interpolated formation enthalpy of approximately −0.299 eV atom
−1. The
Cmcm structure has a formation enthalpy of −0.257 eV atom
−1 and therefore lies approximately 0.042 eV atom
−1 above this partial hull. Accordingly,
Cmcm is not predicted to be a 0 K equilibrium ground-state phase, but it is the lowest-lying off-hull Re
3Zr structure examined here and may be regarded as a metastable candidate subject to kinetic accessibility. Metastable phases can nevertheless be experimentally accessible when kinetic barriers hinder transformation to the equilibrium structure. For instance, metastable bixbyite-type V
2O
3 and δ-TaON were experimentally synthesized and shown to persist owing to kinetic stabilization [
38,
39]. These examples support the possible accessibility of low-lying metastable phases under suitable synthesis conditions. The
Immm and
Fm-3
m structures have slightly negative formation enthalpies of −0.004 and −0.001 eV atom
−1, respectively, but remain substantially above the partial hull. By contrast, the positive formation enthalpies of
Fmmm (+0.091 eV atom
−1),
P4/
mmm (+0.008 eV atom
−1), and
Pm-3
n (+0.255 eV atom
−1) indicate instability relative to the elemental reference states at 0 K. These thermodynamic classifications do not preclude the structures from being dynamically or mechanically stable local minima, which are assessed separately below.
Thermodynamic position relative to the partial convex hull and dynamical stability describe distinct aspects of phase stability. Phonon calculations were therefore used to determine whether the relaxed Re
3Zr structures correspond to dynamically stable local minima.
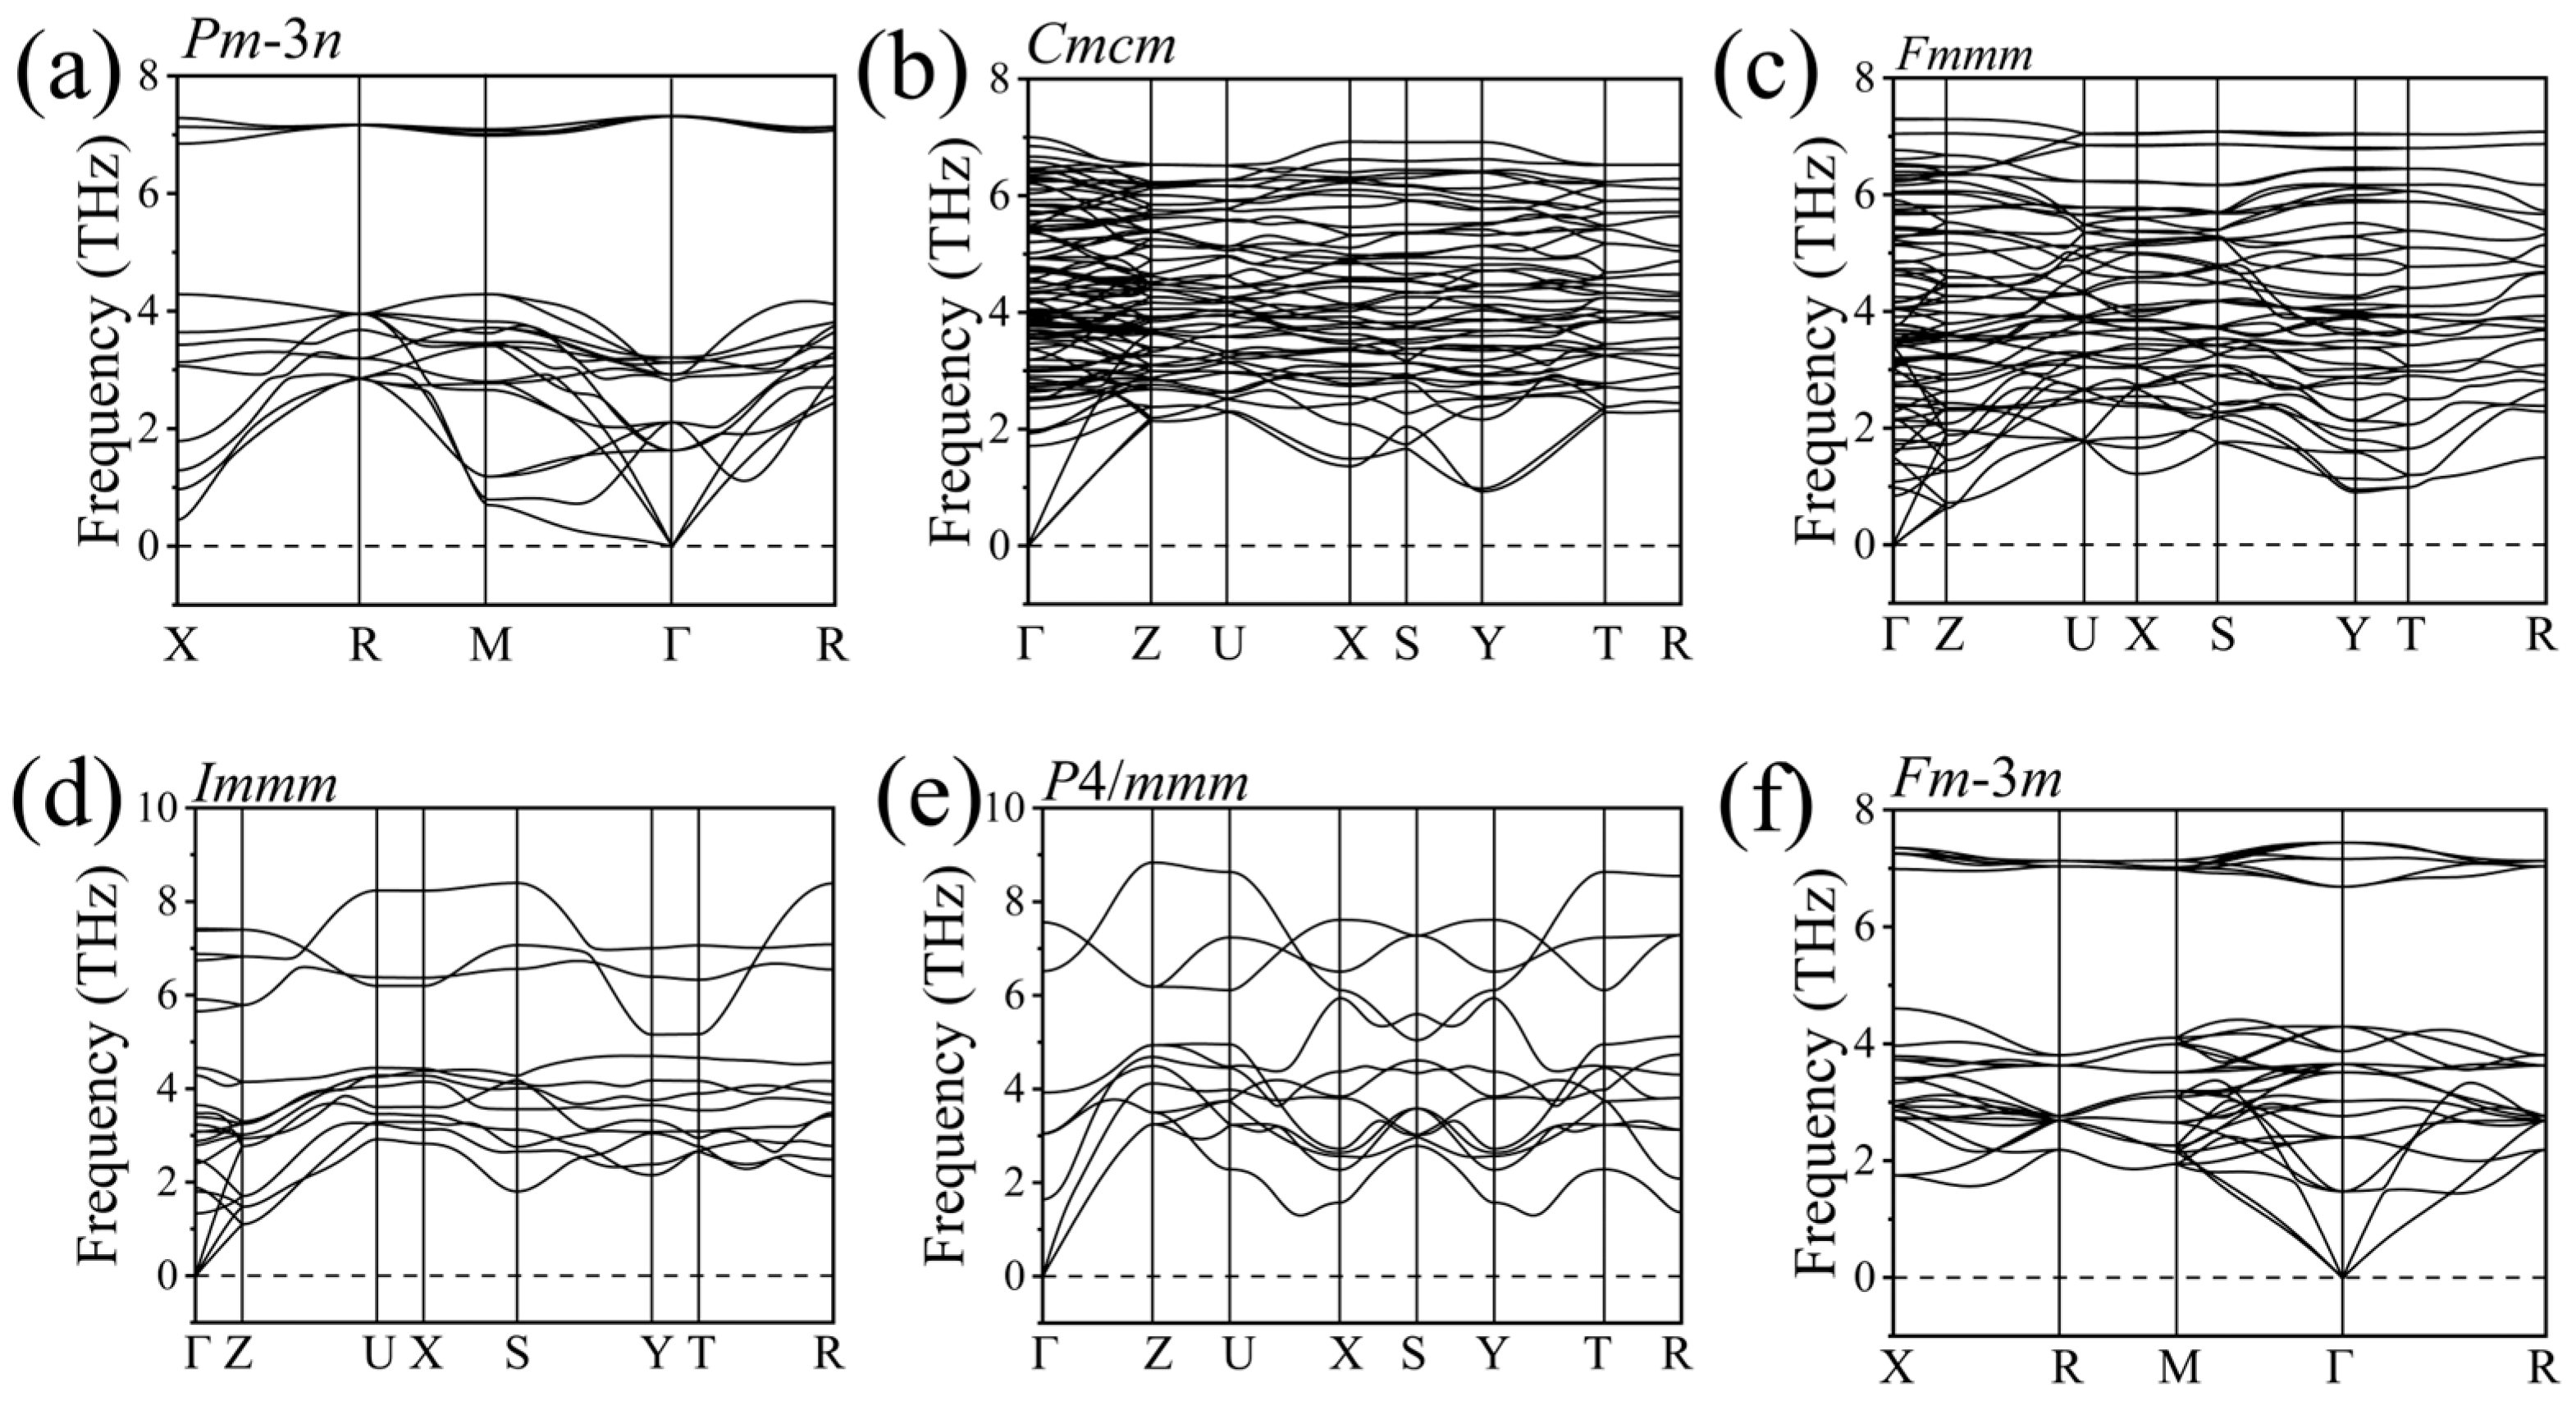
Figure 3 compares the phonon dispersion relations of all six Re
3Zr polymorphs calculated using the phase-dependent supercells and consistent finite-displacement protocol described in
Section 2. No imaginary frequencies are observed along the sampled high-symmetry paths, and the three acoustic branches approach zero frequency at the Γ point. All six relaxed structures can therefore be identified as dynamically stable local minima within the harmonic approximation at 0 K and ambient pressure. The phonon-branch distributions differ appreciably among the six polymorphs because of their distinct cell sizes and force-constant networks. The denser branch manifolds of
Cmcm and
Fmmm arise primarily from the larger numbers of atoms in their crystallographic cells. The
Immm and
P4/
mmm spectra extend to approximately 8–9 THz, consistent with their comparatively stiff local bonding environments and narrow nearest-neighbor distance ranges. Both cubic structures,
Pm-3
n and
Fm-3
m, exhibit separated groups of high-frequency optical branches near 7 THz, although their lower-frequency branches show different dispersive behavior. These results establish the harmonic dynamical stability of the six structures as local minima, but do not alter their thermodynamic classification: in particular, the absence of imaginary phonon modes in
Pm-3
n does not offset its positive formation enthalpy, and the off-hull
Cmcm structure remains a candidate metastable configuration rather than a 0 K equilibrium phase.
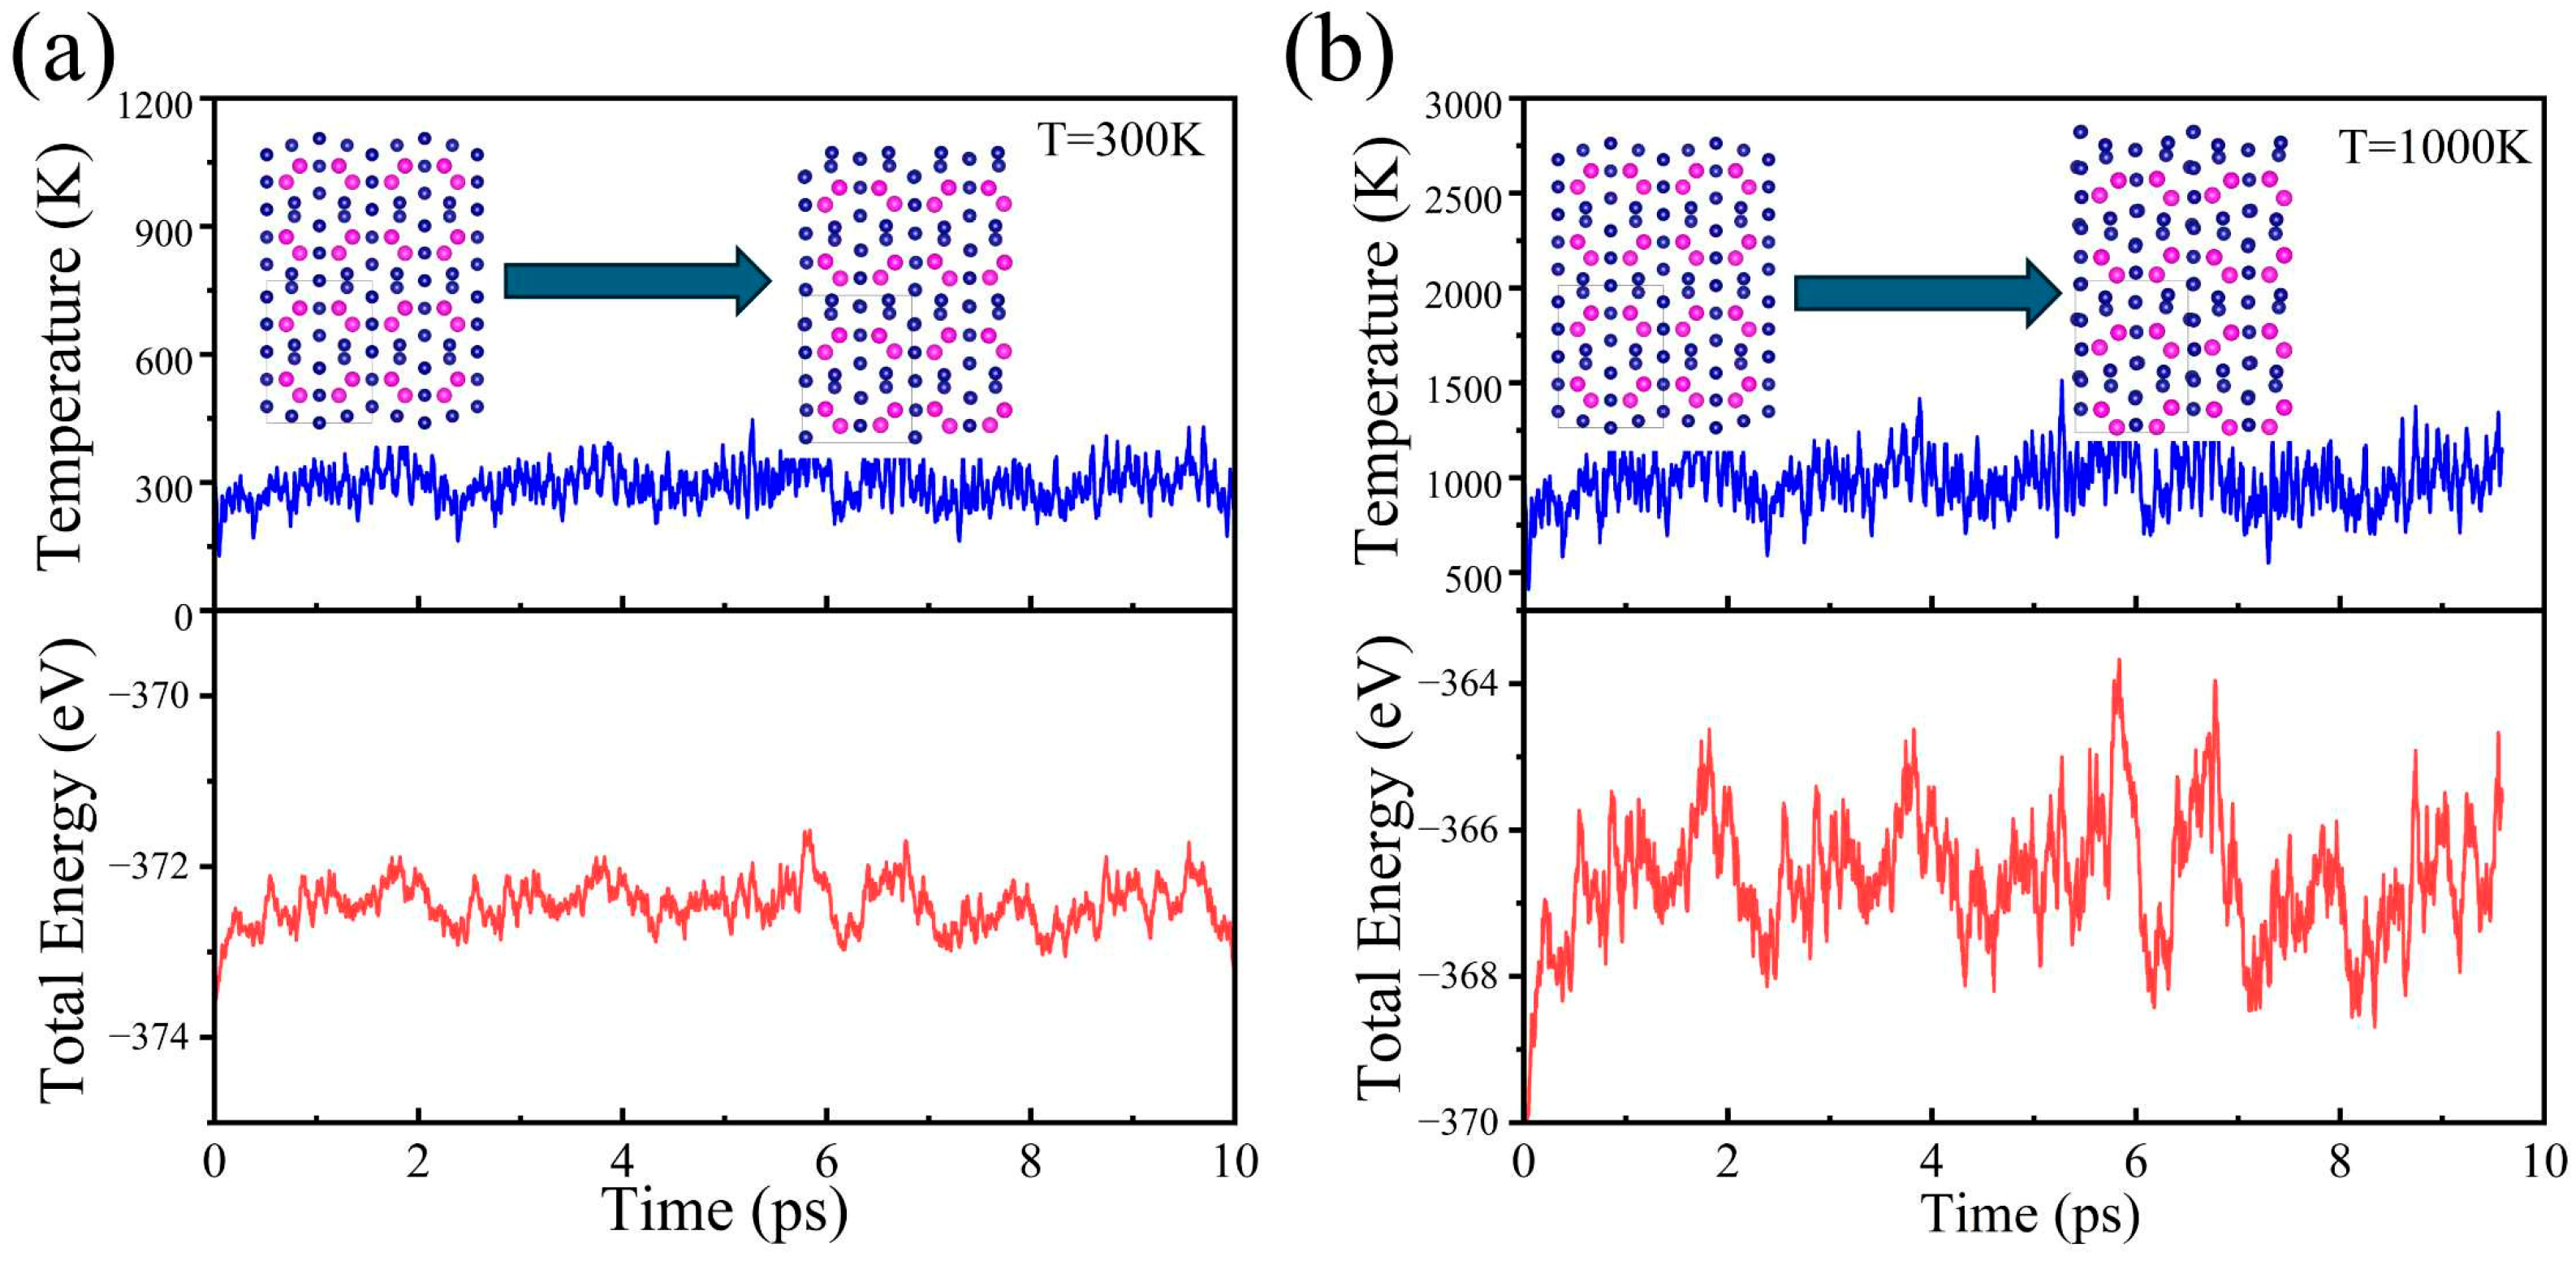
To further examine the finite-temperature structural persistence of the
Cmcm phase, AIMD simulations were performed at 300 and 1000 K. As shown in
Figure 4, the instantaneous temperatures fluctuate around the prescribed values, while after an initial equilibration period, the instantaneous temperatures fluctuate around the prescribed values, while the total energies exhibit bounded thermal fluctuations without sustained drift. The final configurations at both temperatures retain the overall framework of the initial
Cmcm structure, although larger thermal displacements are observed at 1000 K. No obvious structural collapse or reconstruction is observed over the simulated time scales. These AIMD results therefore support the finite-temperature structural persistence of the
Cmcm phase on the picosecond time scale.
Mechanical integrity under applied load is equally important for intermetallics because an elastic instability can trigger structural distortion before fracture or plastic flow. The second-order elastic constants quantify resistance to small strains and also underpin the modulus, anisotropy, and acoustic analyses presented later. Accordingly, mechanical stability was assessed from the
Cij values listed in
Table 3. Because the elastic tensors refer to fully relaxed structures at zero external pressure, the necessary and sufficient Born criteria for unstressed crystals were applied [
40]. For the orthorhombic phases, these criteria are:
For the tetragonal
P4/
mmm phase, the corresponding stability conditions reduce to:
For the cubic
Pm-3
n and
Fm-3
m phases, they reduce further to:
Only the symmetry-independent elastic constants are reported in
Table 3. For the tetragonal
P4/
mmm structure, symmetry requires
=
,
=
, and
=
. For the cubic
Pm-3
n and
Fm-3
m structures,
=
=
,
=
=
, and
=
=
. The remaining unlisted components are either symmetry-equivalent to the listed constants or vanish by symmetry.
Substitution of the calculated elastic constants into the corresponding Born criteria shows that all six structures satisfy the required inequalities and are therefore mechanically stable against infinitesimal homogeneous strains at 0 K and zero external pressure.
The reported
Pm-3
n phase [
12] also serves as a benchmark for the elastic calculations. The present
C11 and
C44 values differ from the previous theoretical results by only 2.5% and 9.1%, respectively, whereas
C12 is 18.3% larger. This level of agreement supports the reliability of the present stress–strain calculations. Although
Pm-3
n has the largest
C11 value of 498 GPa, its much smaller
C44 value of 36 GPa reveals weak resistance to the corresponding shear deformation. This contrast shows that high longitudinal stiffness does not necessarily imply strong resistance to shear. Similar shear softness is found for
Fmmm, whose
C44,
C55, and
C66 values are 59, 57, and 36 GPa, respectively. In contrast,
P4/
mmm exhibits the largest shear constants (
C44 = 139 GPa and
C66 = 120 GPa), while
Cmcm,
Immm, and
Fm-3
m also show substantially stronger shear resistance than the reference phase. Taken together with the energetic and phonon results, the elastic data demonstrate that the CALYPSO-predicted structures are mechanically stable at 0 K and ambient pressure and that several provide greater shear resistance than
Pm-3
n. These differences provide the basis for the subsequent polycrystalline modulus, ductility, anisotropy, and acoustic analyses.
The single-crystal elastic tensors were further converted into effective isotropic polycrystalline moduli using the Voigt–Reuss–Hill (VRH) approximation. The bulk modulus
B, shear modulus
G, and Young’s modulus
E quantify the calculated small-strain resistance to volumetric, shear, and uniaxial deformation, respectively. These 0 K elastic averages are used here as comparative descriptors of the ideal structures; they do not include the effects of defects, grain boundaries, plastic deformation, temperature, or creep. Using the stiffness coefficients
Cij and the elastic compliance coefficients
Sij, where
S =
C−1, the Voigt upper bounds and Reuss lower bounds are expressed as [
26,
27,
28]:
The effective bulk and shear moduli are taken as the arithmetic means of the corresponding bounds, and Young’s modulus, Poisson’s ratio, and the modulus ratio
k are then obtained from:
Elastic anisotropy was quantified using the universal index
AU [
29], for which
AU = 0 represents an elastically isotropic solid. The Chen and Tian models [
30,
31] were used to obtain empirical Vickers-hardness estimates from the calculated elastic moduli:
Here, the subscripts
V and
R denote the Voigt and Reuss bounds, respectively, and
k =
G/
B. The calculated macroscopic properties are summarized in
Table 4. Because these models are empirical correlations based primarily on elastic moduli, they do not explicitly describe indentation-induced plasticity, defects, microstructure, or fracture. The resulting values are therefore interpreted only as comparative hardness indicators rather than direct predictions of experimental indentation hardness.
The universal anisotropy index reveals a clear contrast between the CALYPSO-predicted phases and the reference structure. Fm-3m is essentially isotropic (AU = 0.02), whereas Pm-3n exhibits a markedly larger AU of 3.53; the remaining predicted phases lie between these limits and retain comparatively weak-to-moderate anisotropy. The comparatively large anisotropy of Pm-3n is consistent with its low and indicates a pronounced directional dependence of its small-strain shear response. The contrast between Pm-3n and Fm-3m also shows that cubic symmetry alone does not imply elastic isotropy; the directional response must be determined from the elastic constants.
Although the absolute hardness values are model dependent, the Chen and Tian models reproduce the same trend: hardness increases with shear stiffness rather than with resistance to volumetric compression. P4/mmm gives the largest estimate of 10–11 GPa, consistent with its maximum G, whereas the shear-soft Fmmm and Pm-3n phases are the least hard. Thus, no single structure optimizes every mechanical attribute. Among the six phases, Cmcm combines the lowest static energy with high incompressibility, ductility, and low anisotropy; P4/mmm has the largest stiffness and hardness estimates, whereas Immm and Fm-3m combine high shear rigidity with low elastic anisotropy. These results describe the relative 0 K elastic responses of ideal crystals and should not be interpreted as measured hardness, ductility, or finite-temperature mechanical performance.
3.3. Elastic Anisotropy
Elastic anisotropy was examined to resolve the directional variation in the calculated small-strain response of the six Re
3Zr structures. The Voigt–Reuss–Hill moduli describe an effective isotropic polycrystalline average but do not identify the stiffest and most compliant crystallographic directions. The directional bulk modulus
B, Young’s modulus
E, shear modulus
G, and Poisson’s ratio
ν were therefore evaluated from the elastic compliance tensor as follows [
42]:
Here,
Sijkl is the fourth-rank elastic compliance tensor, and
n and
m are mutually orthogonal unit vectors specifying the loading and transverse directions, respectively. The angles
θ and
φ define
n, whereas
ψ describes the rotation of
m about
n. Because
B and
E depend only on
n, they can be represented directly as three-dimensional surfaces.
G and
ν additionally depend on
m and were therefore visualized using averages of their maximum and minimum values for each loading direction:
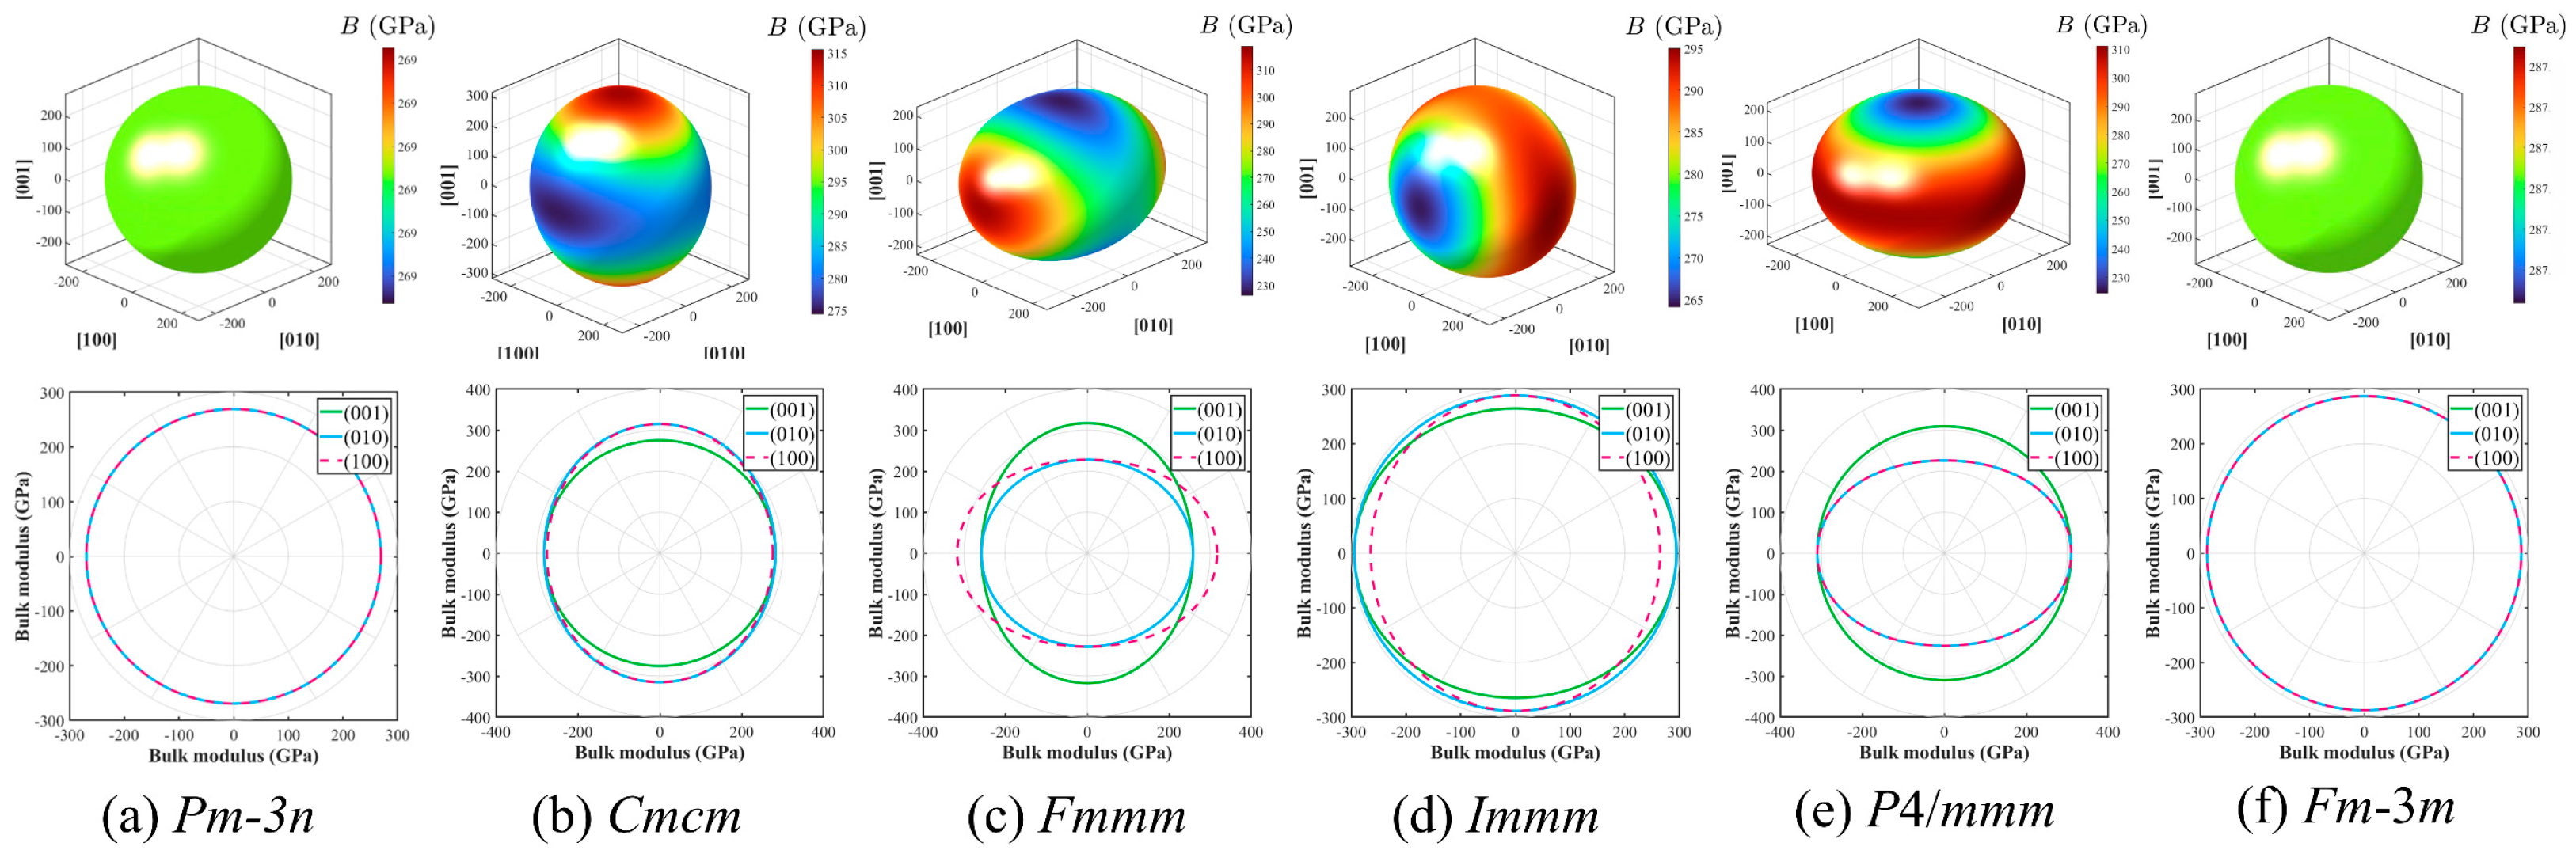
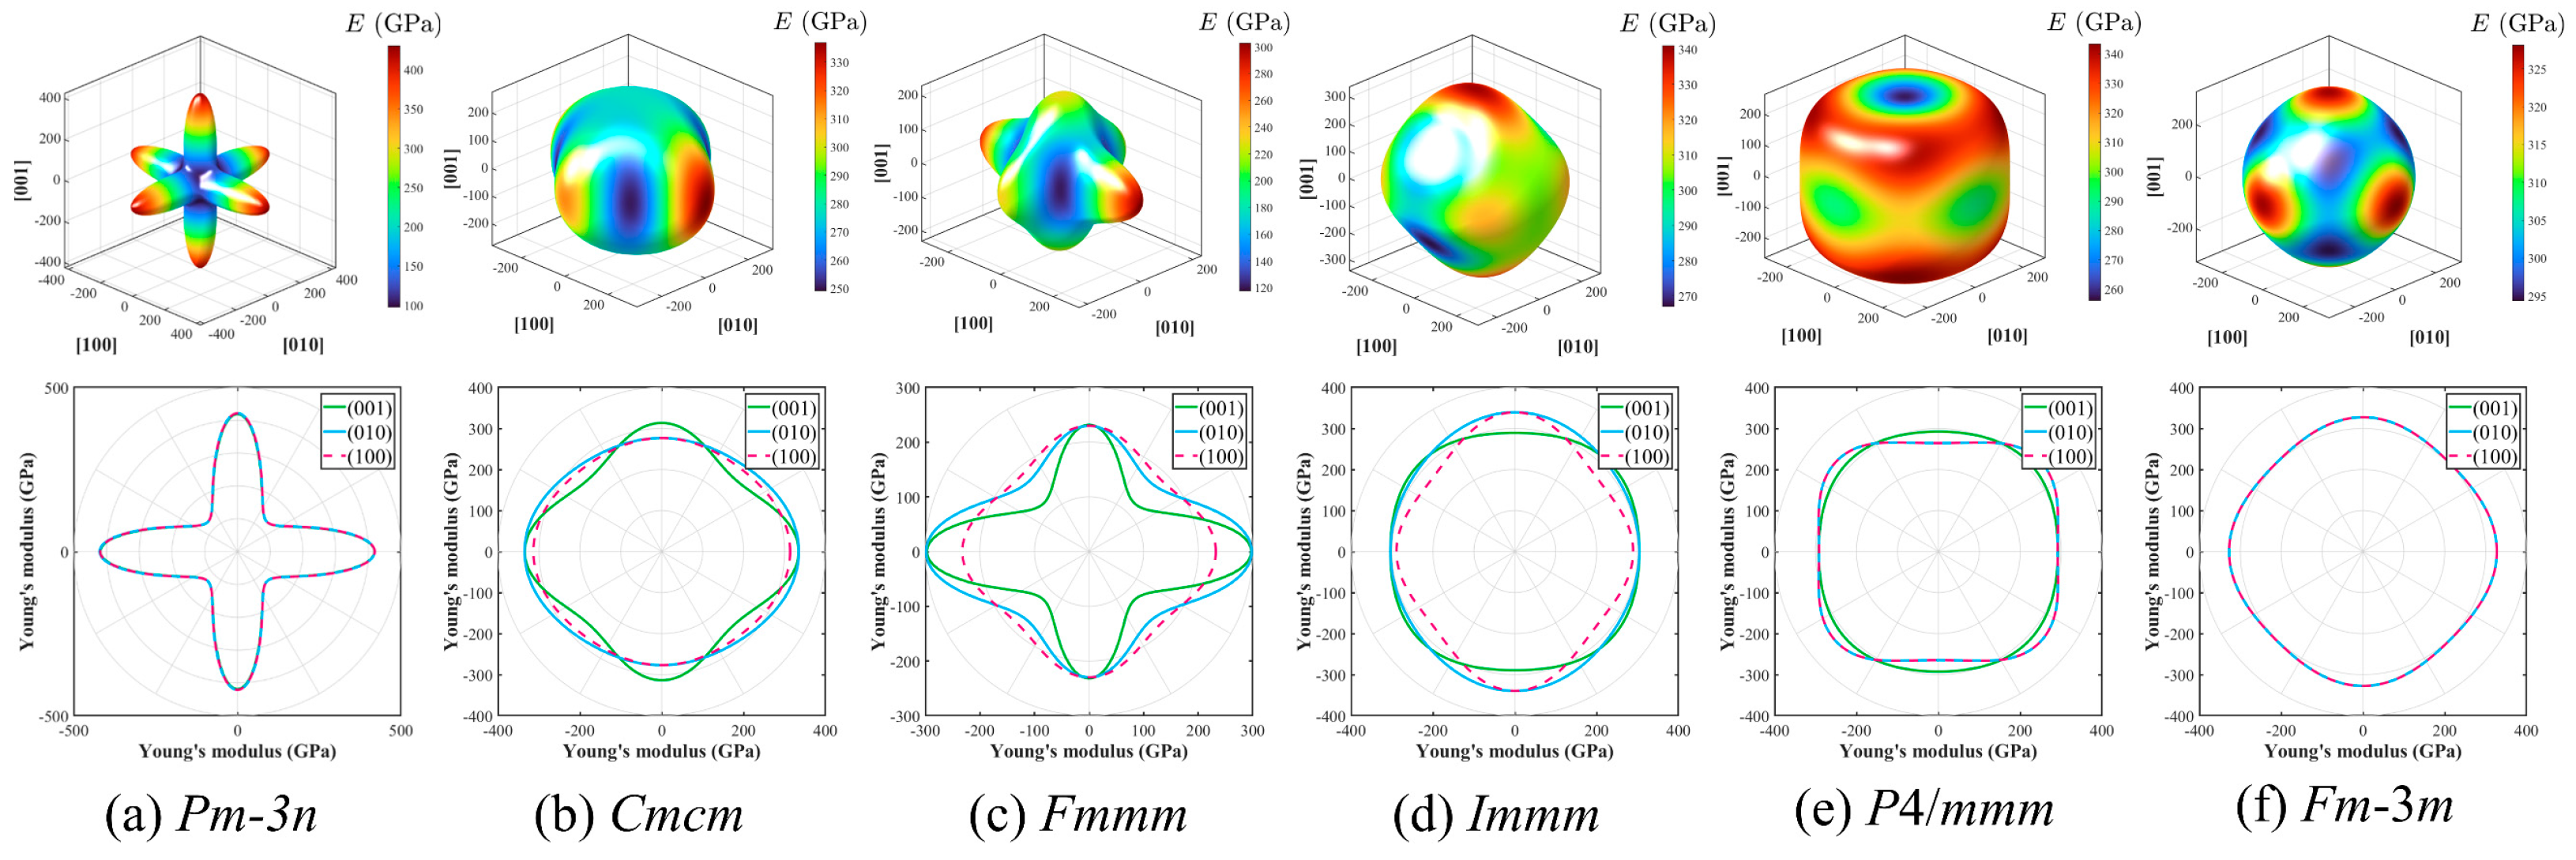
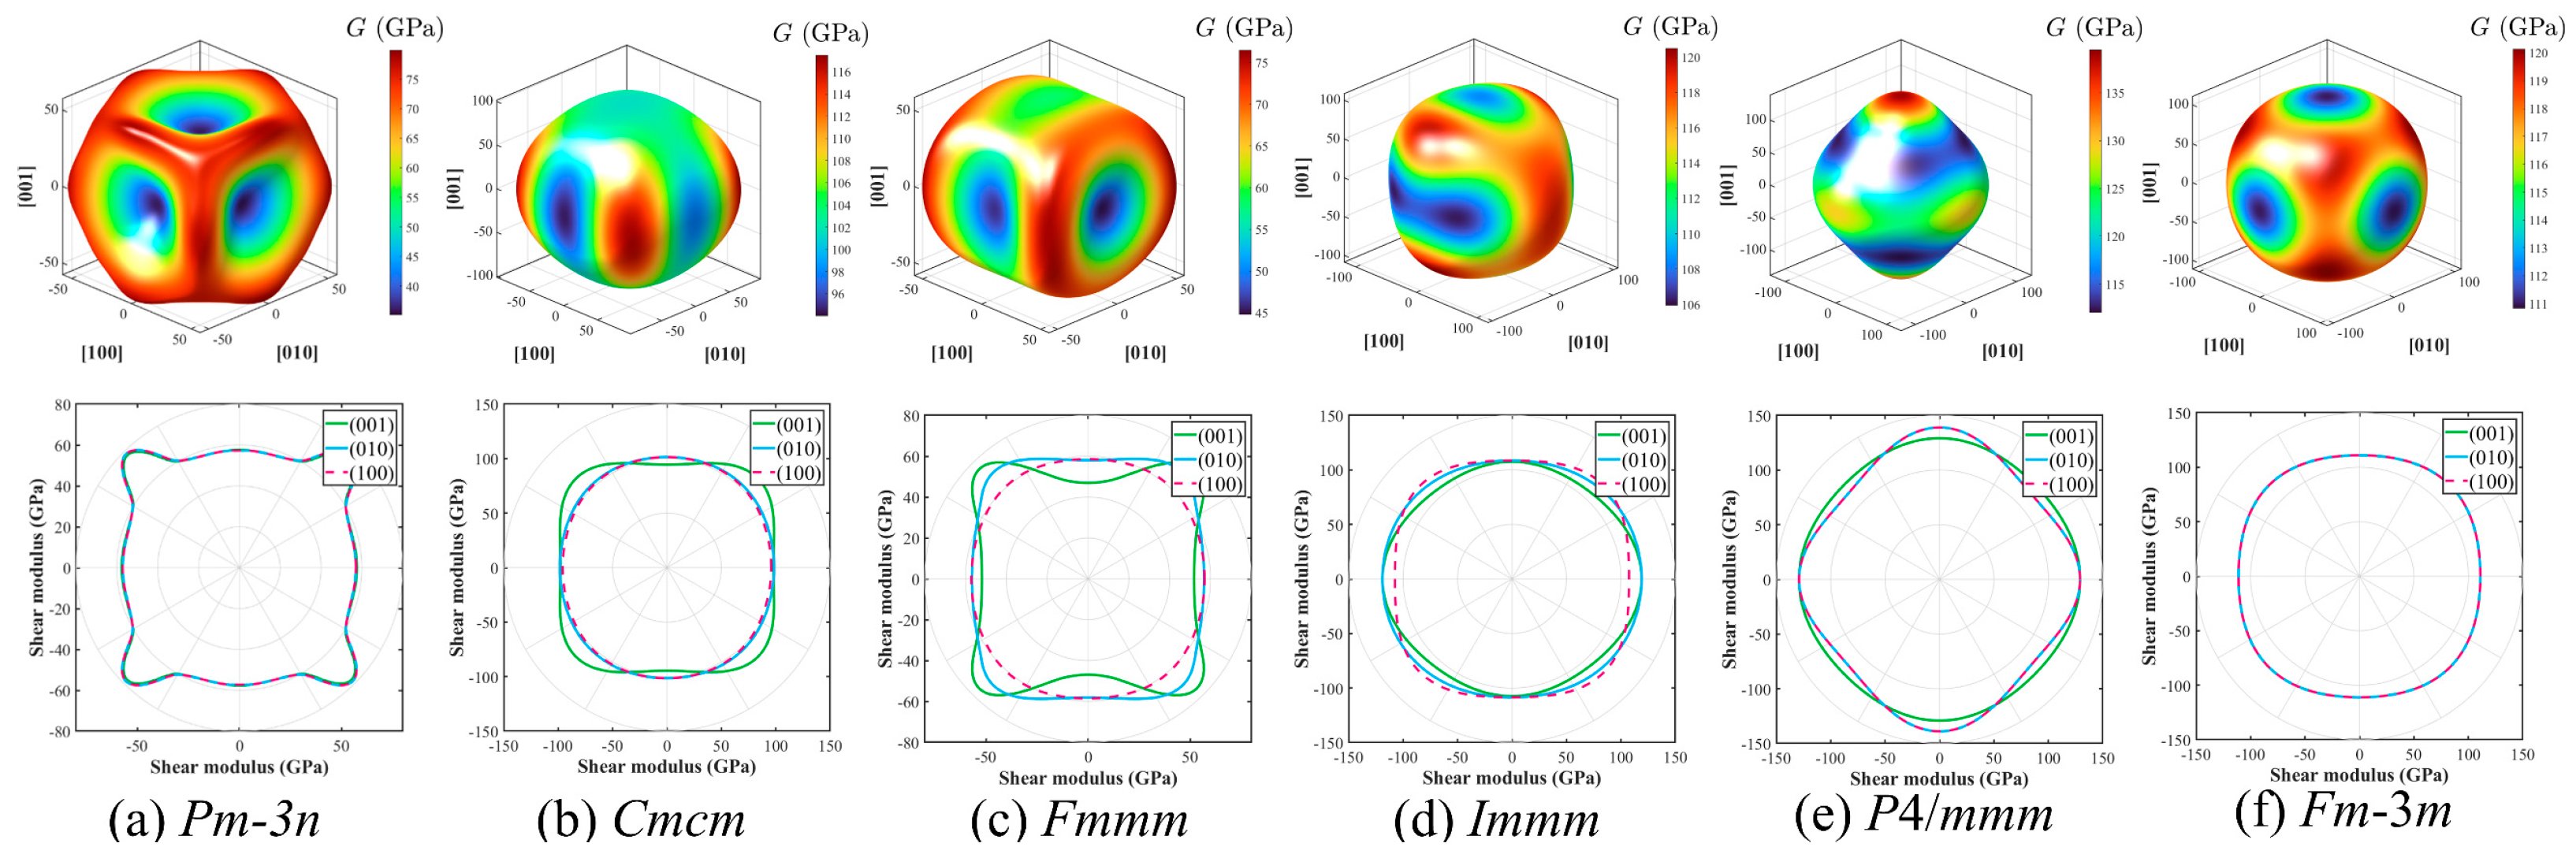
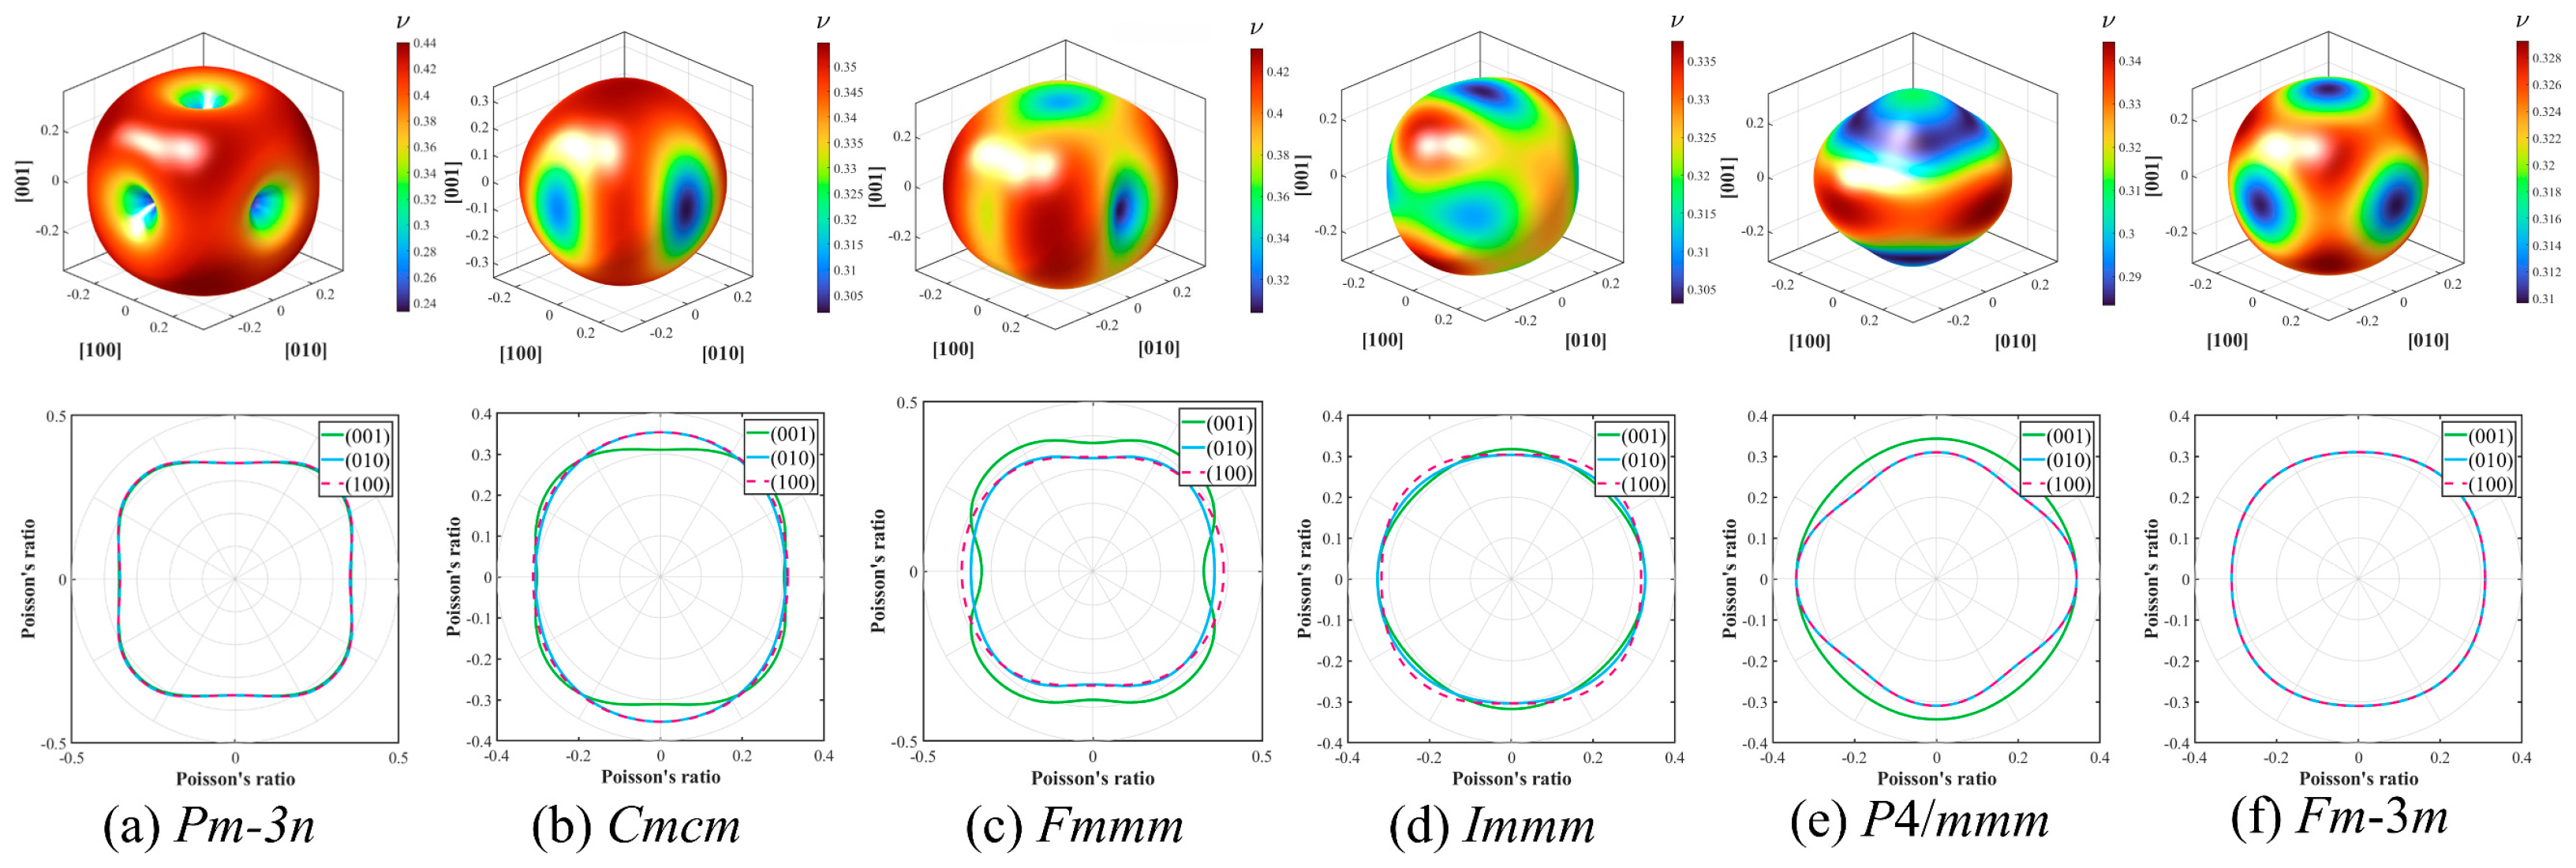
A spherical surface with coincident circular projections represents an isotropic response; increasing distortion and separation among the (001), (010), and (100) projections indicate stronger directional dependence. In
Figure 5,
Figure 6 and
Figure 7, red and blue regions denote larger and smaller directional moduli, respectively. In
Figure 8, the colors indicate only larger or smaller Poisson’s-ratio values and should not be interpreted as stronger or weaker directional stiffness.
The bulk-modulus surfaces in
Figure 5 show that similar polycrystalline
B values can conceal different directional compression responses.
Pm-3
n and
Fm-3m have nearly spherical surfaces and coincident projections, indicating almost direction-independent resistance to hydrostatic compression in this representation. By contrast,
Cmcm and
Immm show modest distortions, while
Fmmm and
P4/mmm exhibit clearer axial–basal differences;
P4/mmm is more compressible along [001] than within the basal plane. The comparable
B surfaces of
Pm-3
n and
Fm-3m do not imply comparable overall elastic isotropy because their
E and
G surfaces differ strongly, as discussed below.
The six-phase comparison in
Figure 6 and
Figure 7 reveals a much wider variation in tensile and shear anisotropy than in bulk compression.
Pm-3
n exhibits the most distorted
E and
G surfaces, with sharp lobes and deep minima along selected directions.
Fmmm shows the next strongest directional contrast, whereas
Cmcm,
Immm, and
P4/mmm exhibit moderate-to-weak distortions.
Fm-3m has the most regular surfaces and nearly overlapping projections, indicating the most uniform tensile and shear responses. The opposite behavior of the two cubic phases,
Pm-3
n and
Fm-3m, demonstrates that cubic symmetry does not by itself guarantee elastic isotropy. The corresponding directional extrema and anisotropy ratios are summarized in
Table 5.
Table 5 quantifies these trends.
Pm-3
n has by far the largest directional ratios,
Emax/
Emin = 4.07 and
Gmax/
Gmin = 4.72, because high maxima (424 and 171 GPa) coexist with low minima (104 and 36 GPa).
Fmmm is the second-most anisotropic, with ratios of 2.47 and 2.96. In contrast,
Fm-3m has the smallest ratios (1.11 and 1.13), followed by
Immm (1.26 and 1.29);
Cmcm and
P4/mmm also remain within moderate ranges. Thus, the ranking of directional anisotropy agrees with
AU and identifies compliant directions that are obscured by the polycrystalline averages. The corresponding Poisson’s-ratio surfaces are shown in
Figure 8.
All six Poisson’s-ratio surfaces in
Figure 8 remain positive; therefore, no auxetic response is obtained for the sampled loading and transverse directions.
Pm-3
n and
Fmmm show the broadest directional variations and the largest local
ν values, consistent with their pronounced shear compliance and anisotropy.
Cmcm and
P4/mmm show intermediate directional contrast, whereas
Immm and
Fm-3m have the narrowest variations. Taken together with the static energetic, mechanical, and dynamical results, the newly predicted structures should be regarded as possible candidates for further finite-temperature investigation.
3.4. Sound Velocities and Elastic Debye Temperatures
Sound velocities and elastic Debye temperatures were derived to compare the acoustic stiffness scales of the six Re3Zr structures. Within the isotropic elastic approximation, the sound velocities reflect the ratio between elastic stiffness and density, while the Debye temperature derived from the average sound velocity provides a characteristic elastic–acoustic energy scale. These quantities are comparative descriptors and do not constitute direct calculations of phonon lifetimes, lattice thermal conductivity, thermal expansion, heat capacity, anharmonicity, or finite-temperature phase stability.
Within the isotropic polycrystalline approximation, the longitudinal sound velocity
vl, transverse sound velocity
vt, and average sound velocity
vm were calculated from the Voigt–Reuss–Hill bulk modulus
B, shear modulus
G, and density
ρ using [
32]:
The Debye temperature was obtained from the average sound velocity according to [
32]:
Here,
h and
kB are the Planck and Boltzmann constants, respectively, while
n and
V denote the number of atoms and volume of the selected unit cell; thus,
n/
V is the atomic number density. The resulting sound velocities are listed in
Table 6.
The longitudinal velocities occupy a relatively narrow interval, whereas
vt and
vm distinguish the phases more clearly because they are governed primarily by shear rigidity.
P4/
mmm has the largest
vt and
vm values of 2713 and 3033 m s
−1, respectively, followed closely by
Fm-3
m and
Immm. This ordering is consistent with comparatively large shear moduli.
Cmcm exhibits the highest
vl of 5188 m s
−1, reflecting its strong resistance to volumetric compression, while retaining an intermediate-to-high
vm of 2878 m s
−1. By contrast,
Fmmm and the reference
Pm-3
n phase have substantially smaller transverse and average velocities, consistent with their low shear stiffness. Since the densities of these Re-rich phases vary only modestly, the velocity differences are controlled mainly by their elastic moduli rather than by mass density. The resulting Debye temperatures are shown in
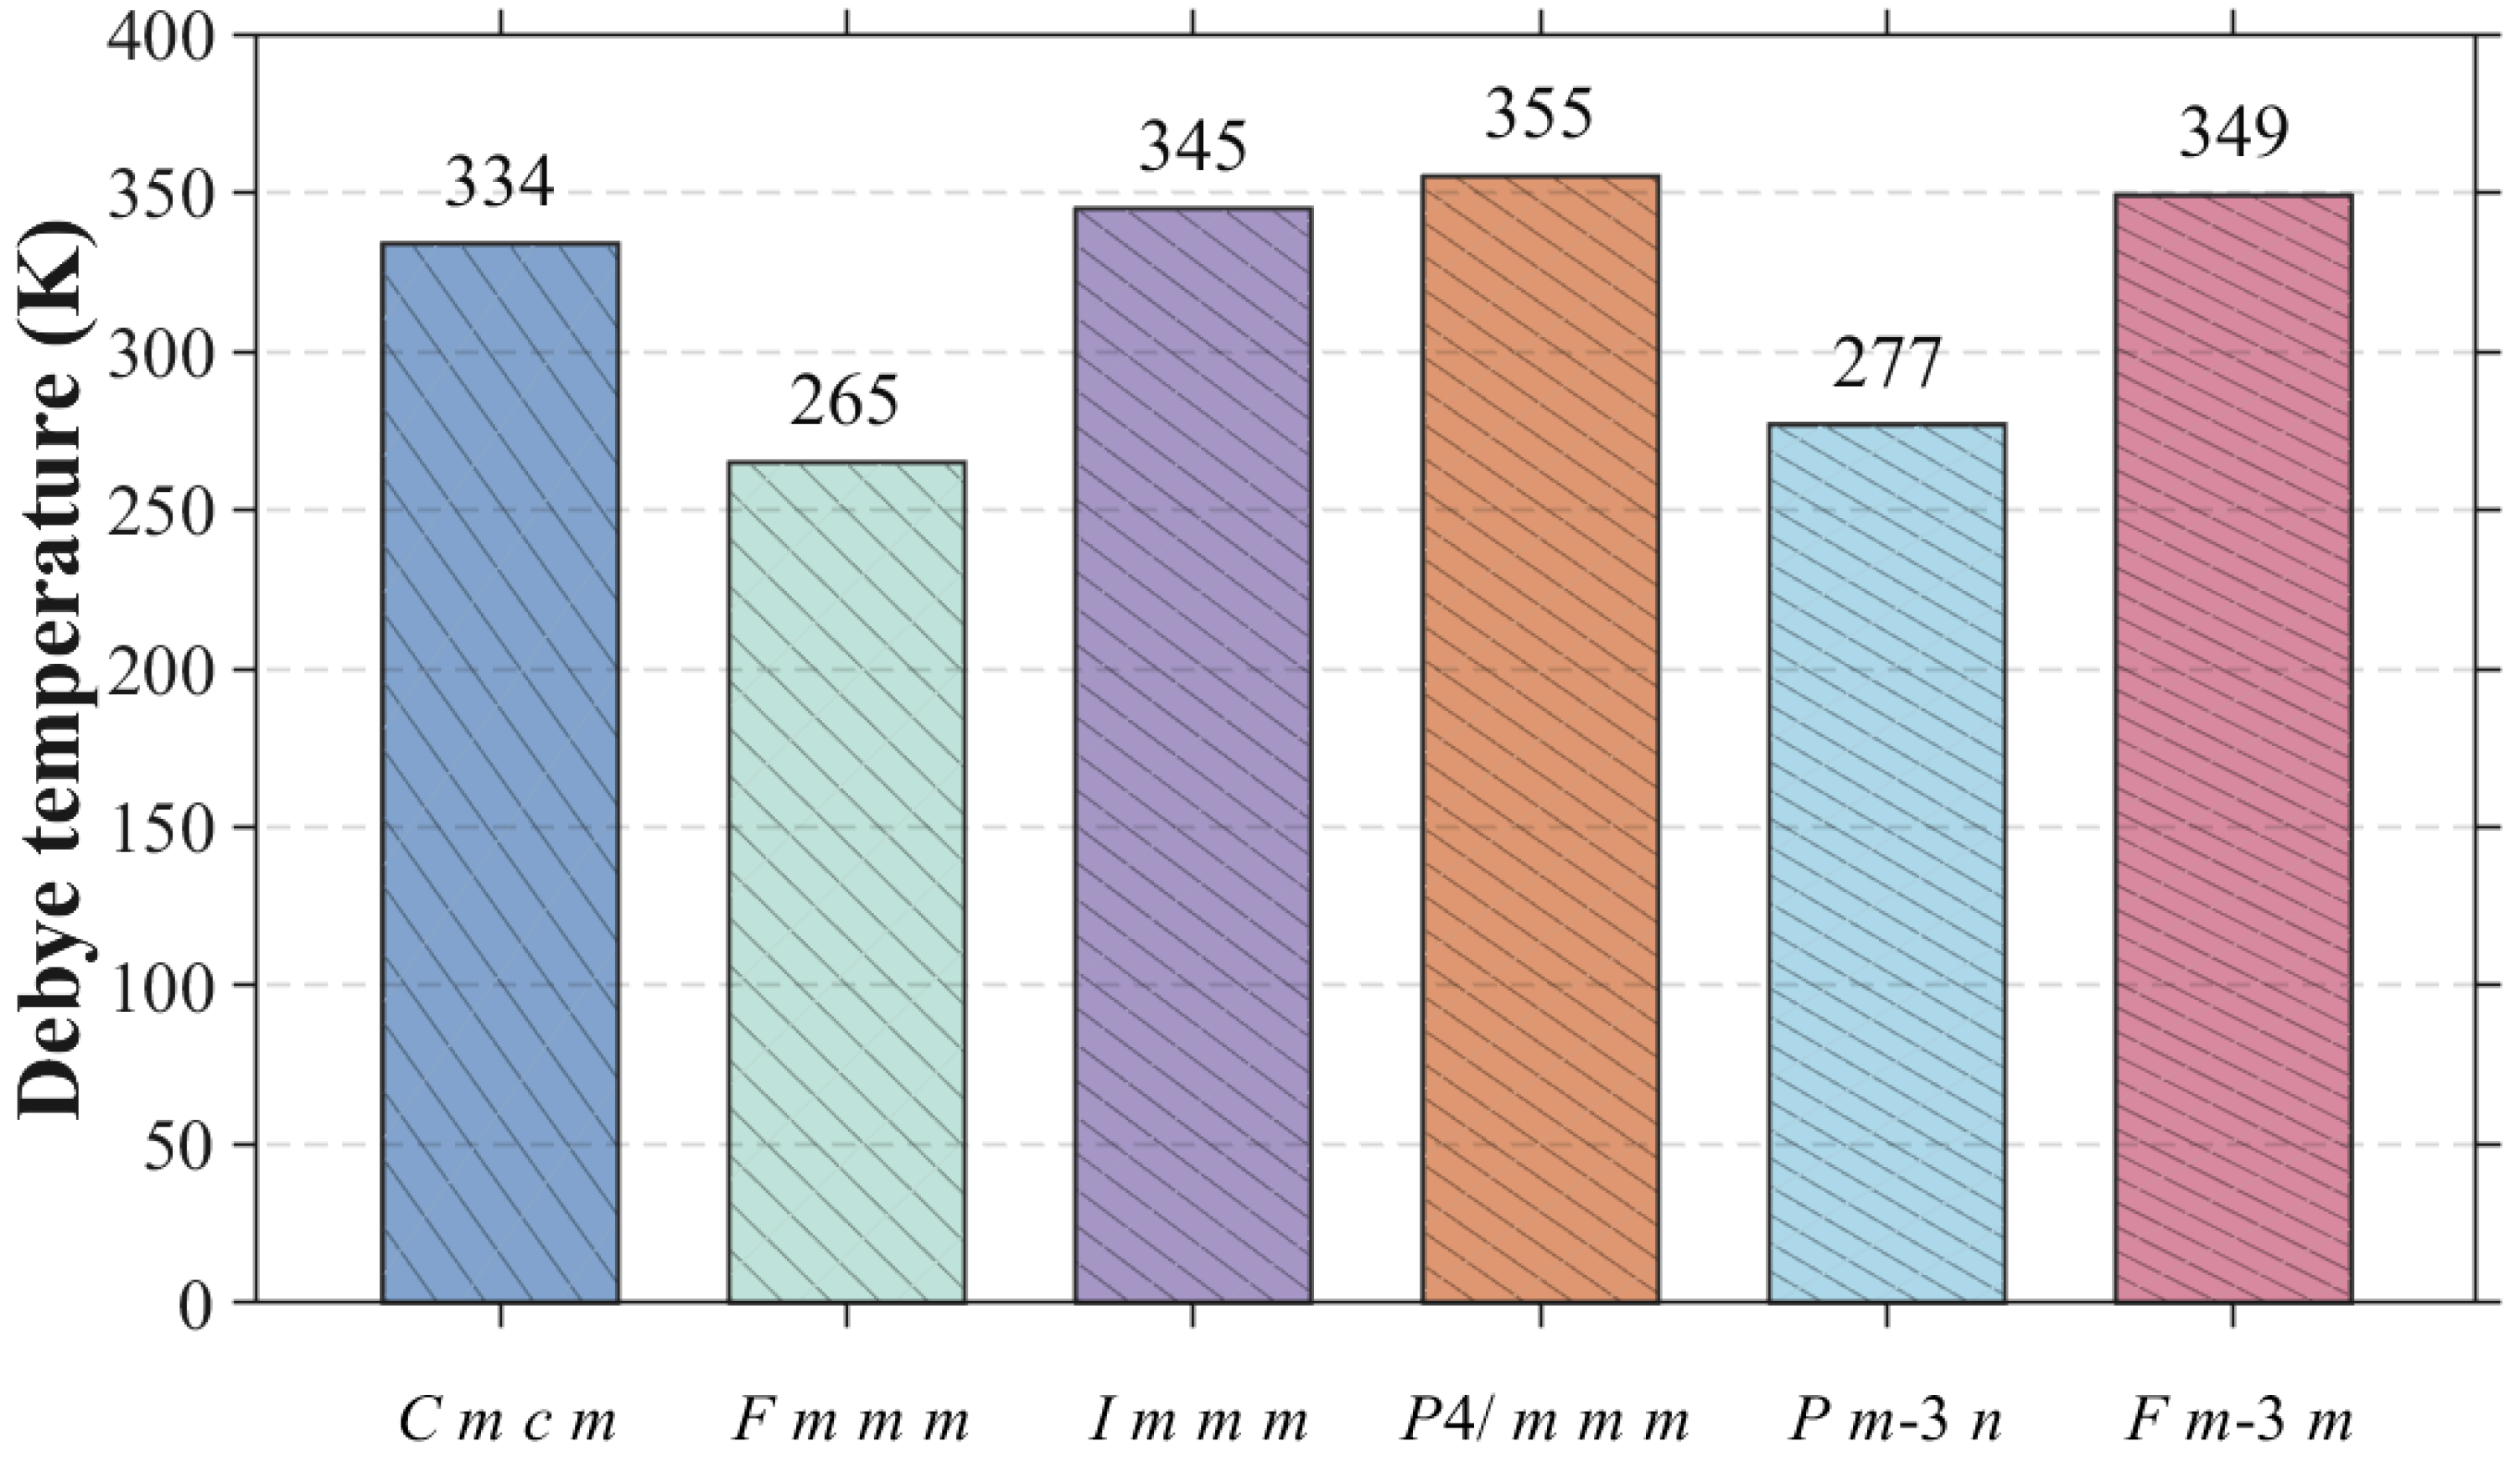
Figure 9.
As shown in
Figure 9, the Debye temperatures follow the same sequence as
vm, confirming that their differences originate predominantly from lattice stiffness.
P4/
mmm has the highest
ΘD of 355 K, followed by
Fm-3
m (349 K),
Immm (345 K), and
Cmcm (334 K). The lower values of
Pm-3
n (277 K) and
Fmmm (265 K) reflect their softer shear responses and lower characteristic phonon frequencies. Notably, four of the five CALYPSO-predicted phases have higher
ΘD values than the reported
Pm-3
n structure, with the
P4/
mmm value being approximately 28% larger. Thus,
P4/
mmm provides the strongest overall elastic–vibrational rigidity, whereas
Fm-3
m and
Immm combine high sound velocities with similarly elevated Debye temperatures. These elastic–vibrational trends provide a macroscopic basis for the electronic-structure analysis used subsequently to clarify their bonding origin.
3.5. Electronic Structure and Bonding Characteristics
Electronic properties provide the microscopic link between crystal structure and the mechanical and thermal responses discussed above. The band structures, total and orbital-projected densities of states, and electron localization functions were examined to identify the electronic origin of the phase-dependent properties of Re
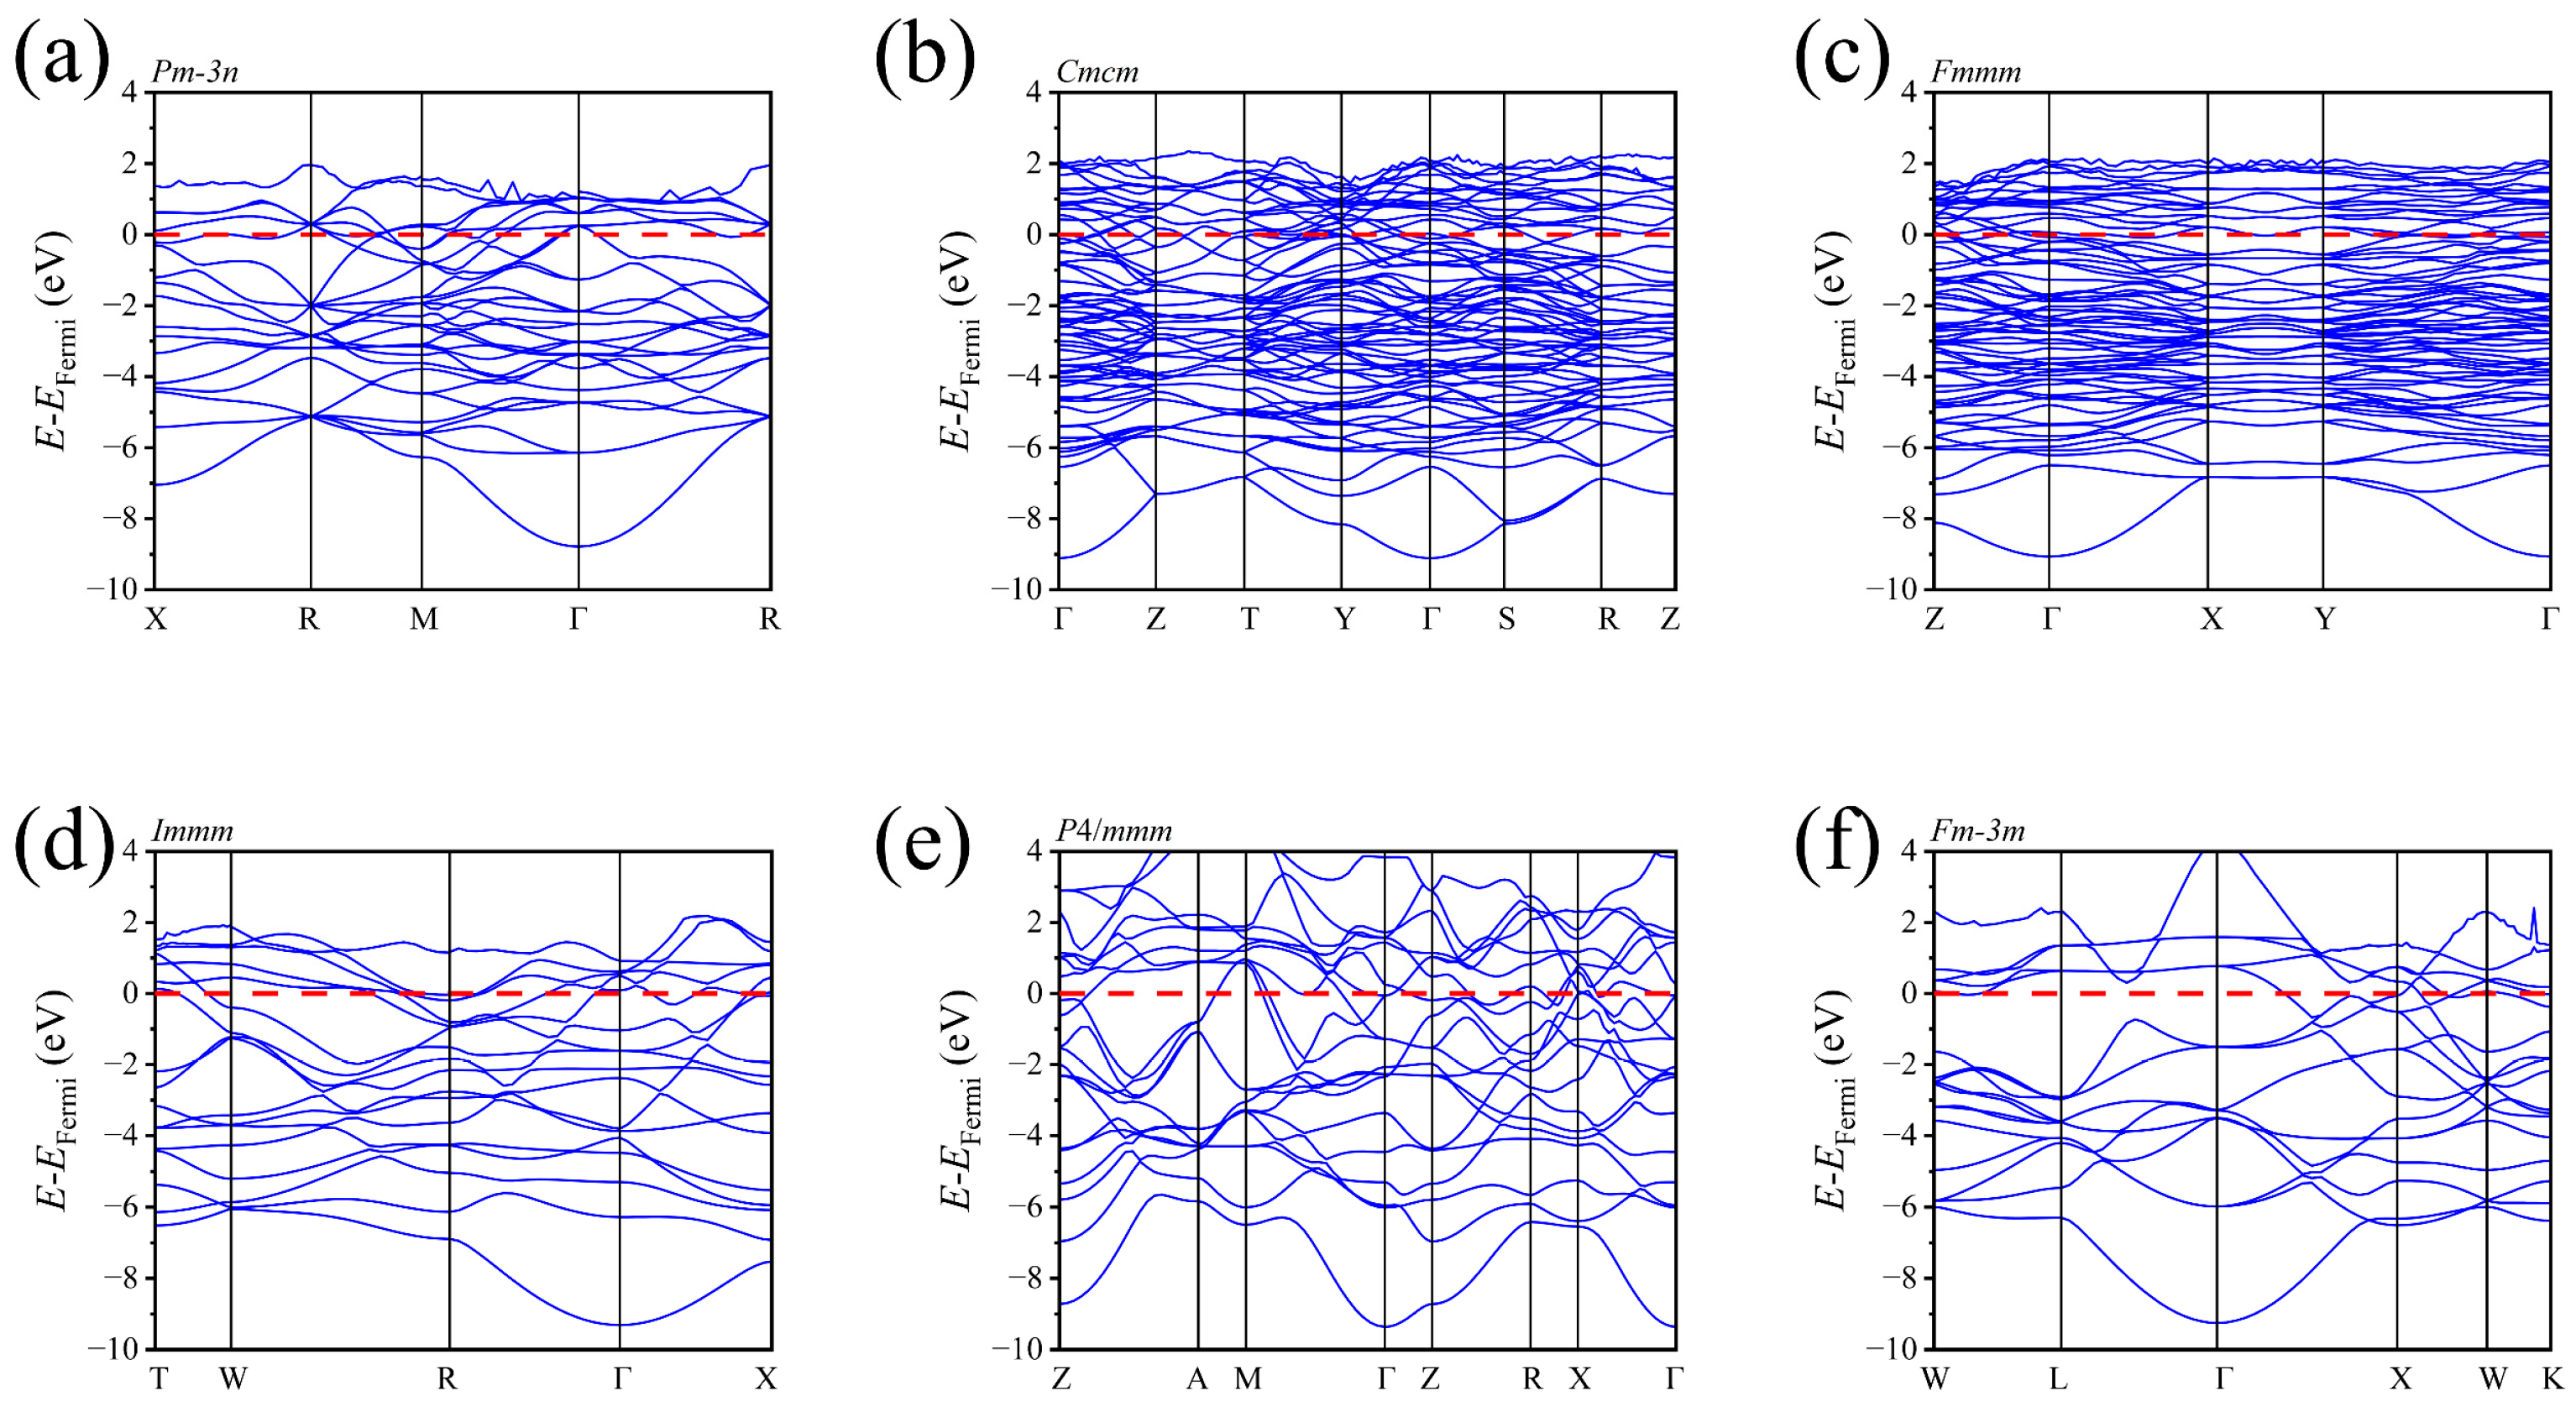
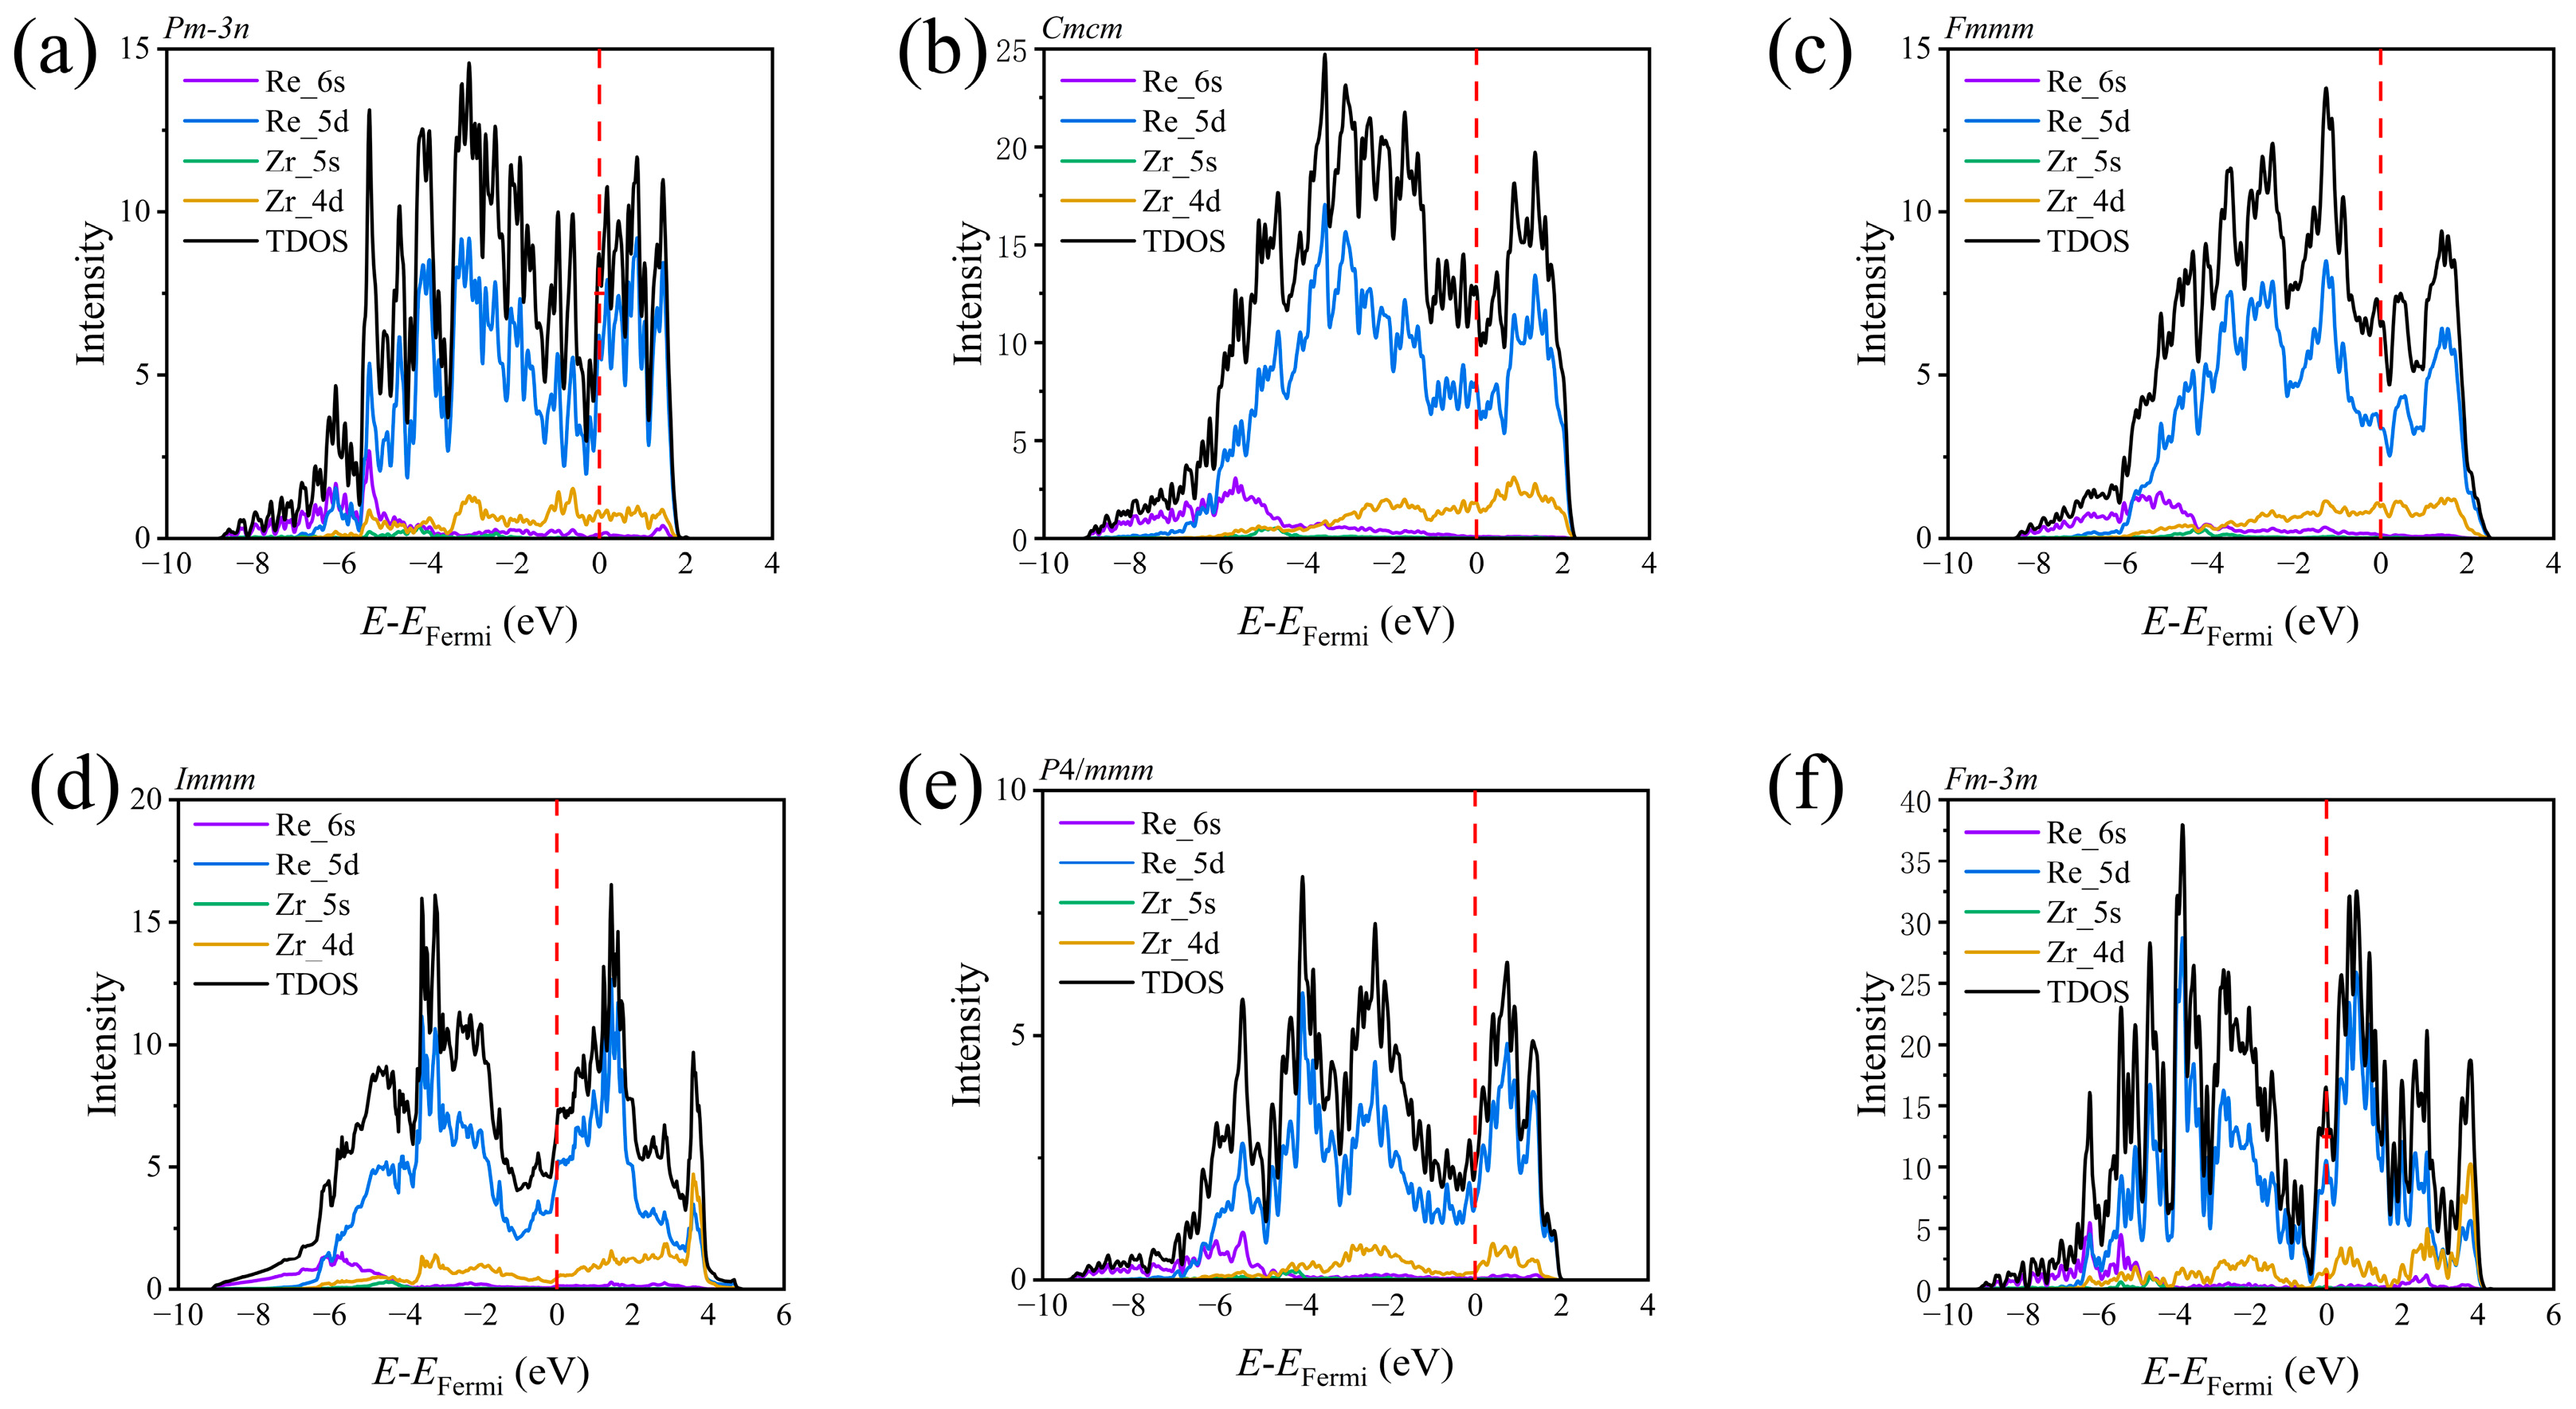
3Zr. The calculated band structures, densities of states, and electron localization maps are shown in
Figure 10,
Figure 11 and
Figure 12, respectively.
As shown in
Figure 10 and
Figure 11, multiple bands cross the Fermi level
EF in every phase, and the corresponding total density of states remains finite at
EF, consistently confirming the metallic character of all six Re
3Zr structures. The projected density of states further shows that the states around
EF are dominated by Re-5d orbitals, with a smaller but non-negligible contribution from Zr-4d orbitals. The broad energetic overlap between the Re-5d and Zr-4d states throughout the valence region and near
EF is consistent with appreciable Re–Zr d–d hybridization, whereas the Re-6s states are concentrated mainly at lower energies and the Zr-5s contribution remains weak over the displayed energy range. Despite differences in the detailed band dispersions and density-of-states profiles among the polymorphs, they share the same essential electronic features: Re-5d-dominated metallic states at
EF and appreciable Re–Zr d–d hybridization.
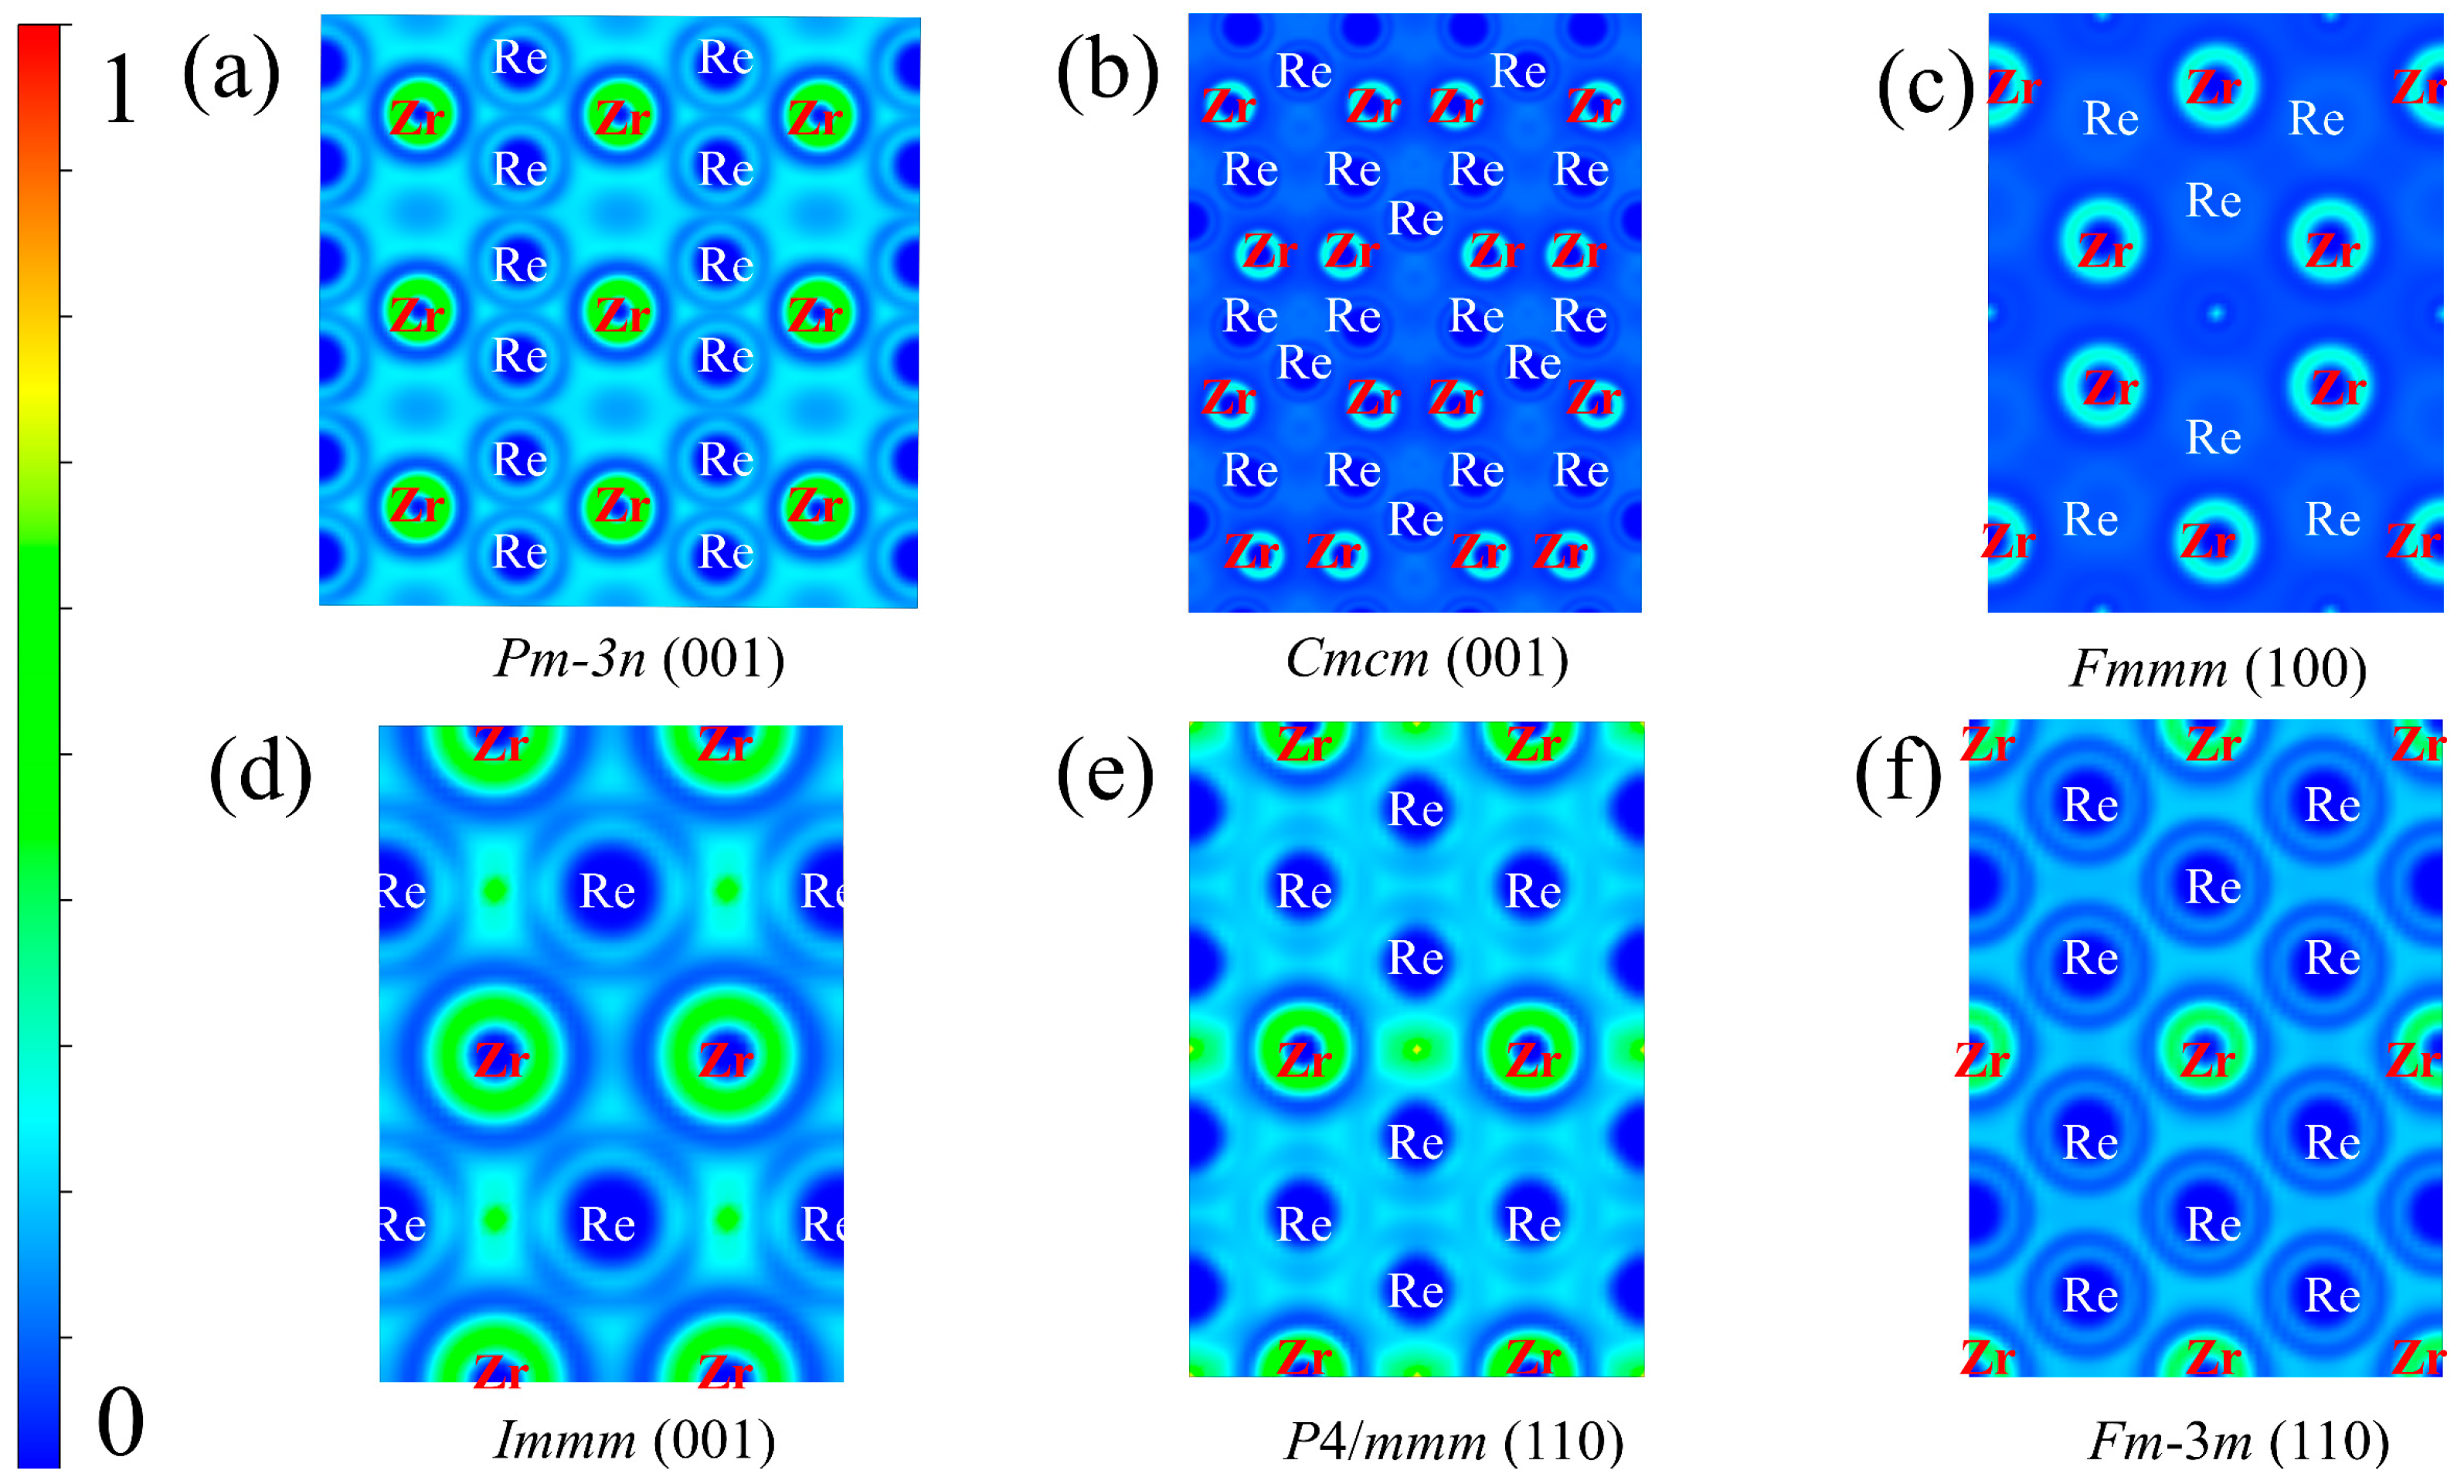
The bonding nature was further characterized using the electron localization function (ELF) [
33], as shown in
Figure 12. In all six phases, the interatomic regions are dominated by low ELF values (blue–cyan), with no continuous high-ELF basins between Re and Zr. Together with the bands crossing E
F and the finite density of states at E
F, this feature indicates predominantly delocalized metallic bonding in Re
3Zr. The enhanced ELF around Zr is largely atom-centered and does not indicate strong two-center Re–Zr covalent bonding.
Fmmm exhibits the weakest interstitial localization, consistent with its low shear modulus and hardness. By comparison, localized ELF maxima at selected interatomic sites in
Immm and
P4/mmm suggest a modest directional bonding component, in agreement with their higher shear stiffness. The relatively uniform ELF distribution in
Fm−3m is also consistent with its nearly isotropic elastic response. Overall, structural symmetry modifies the spatial localization of valence electrons without changing the predominantly metallic bonding framework.
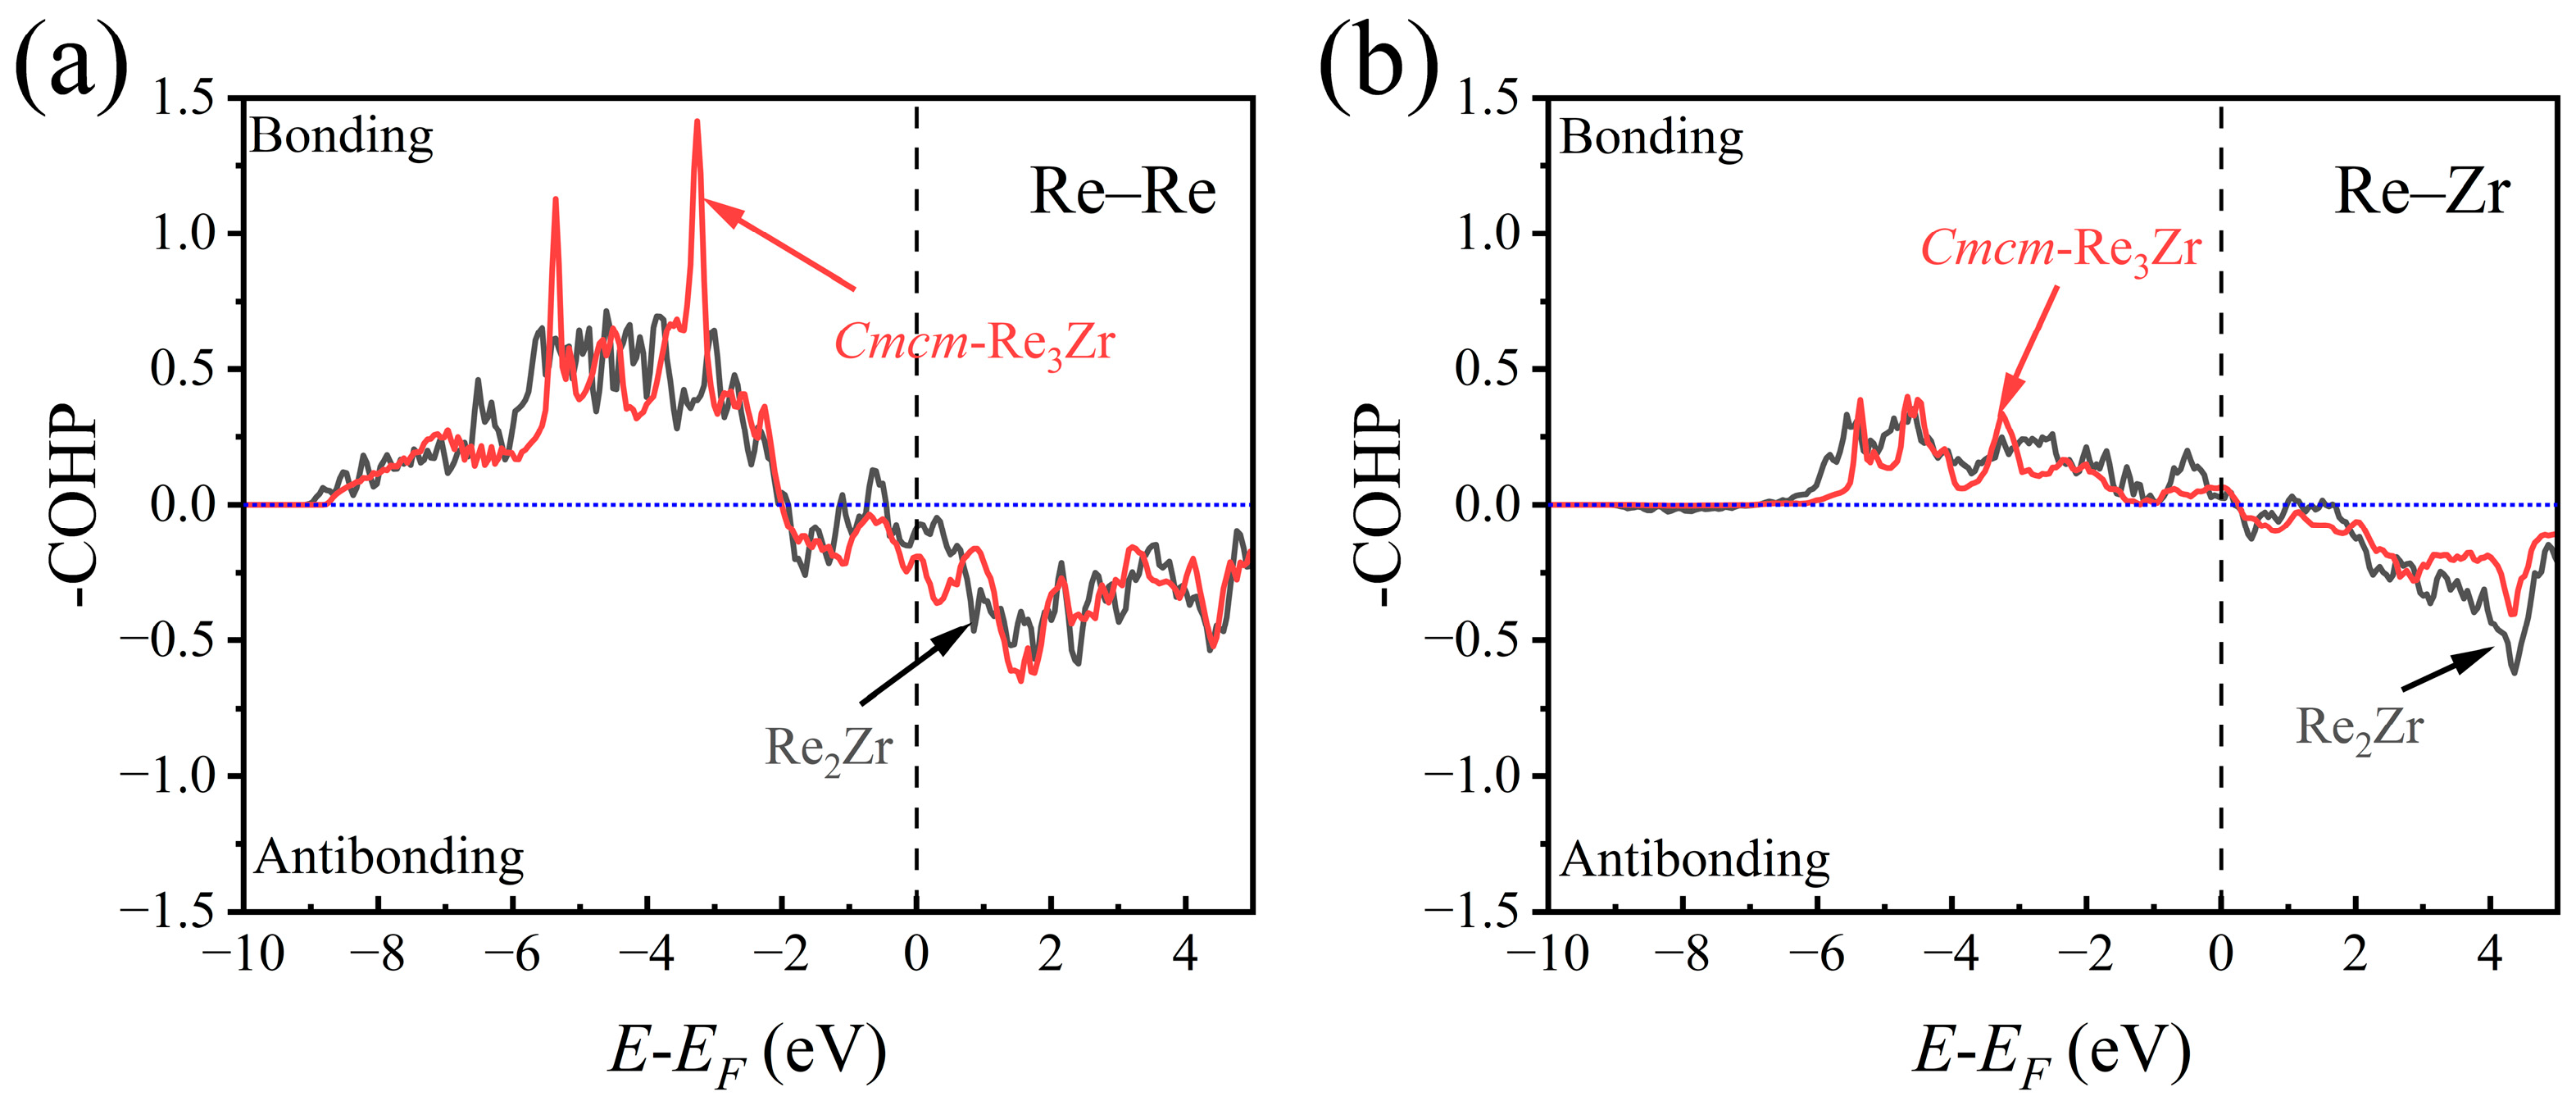
To complement the qualitative ELF analysis, the bonding interactions in
Cmcm were further quantified using COHP and −ICOHP analysis and compared with those in Re
2Zr. As summarized in
Table 7, the strongest Re–Re interaction in
Cmcm has a −ICOHP value of 2.18 eV bond
−1 at 2.560 Å, comparable to 2.11 eV bond
−1 at 2.566 Å in Re
2Zr. The short Re–Zr interaction in
Cmcm reaches 1.63 eV bond
−1 at 2.887 Å, whereas the maximum value in Re
2Zr is approximately 1.09 eV bond
−1. The corresponding −COHP curves in
Figure 13 show substantial bonding contributions below the Fermi level, with partial antibonding contributions near
EF. These results reveal appreciable local Re–Re and Re–Zr bonding contributions in
Cmcm while remaining consistent with the predominantly delocalized metallic bonding picture inferred from the ELF and electronic structures.