Article

Size-Effect-Based Forming Behavior and Multi-Objective Die Optimization of Metallic Fuel Cell Bipolar Plates


1
Shandong Tietou Energy Investment Group Co., Ltd., Jinan 250000, China
2
Shandong Tiefa New Energy Co., Ltd., Jinan 250000, China
3
College of New Energy, China University of Petroleum (East China), Qingdao 266580, China
4
College of Mechanical and Electrical Engineering, Shandong University of Science and Technology, Qingdao 266590, China
5
Beijing Wei Yi Technology Research Institute Co., Ltd., Beijing 100144, China
*
Authors to whom correspondence should be addressed.
Materials 2026, 19(16), 3519; https://doi.org/10.3390/ma19163519
Submission received: 11 June 2026 / Revised: 6 August 2026 / Accepted: 14 August 2026 / Published: 19 August 2026
(This article belongs to the Section Energy Materials)

Abstract

Ultra-thin metal bipolar plates are critical components of proton exchange membrane fuel cells (PEMFCs), and their forming characteristics decisively influence service performance. This study proposes a constitutive model incorporating size effects to elucidate how sheet thickness and grain size govern stress–strain responses and formability of ultra-thin plates. The verified model is employed in finite element analysis for formability of ultra-thin plates. Based on the results of simulation, key stamping die parameters were optimized using Random Forest and XGBoost surrogate models. Results indicate that increasing grain sizes reduces grain boundary density, leading to stress localization within coarse grains and promoting local thinning. This effect increases stored elastic energy and simultaneously raises the maximum stress, thinning rate, and springback angle. Conversely, the increasing sheet thickness strengthens triaxial constraint and raises forming stress, while suppressing thinning and springback through enhanced strain redistribution and plastic dissipation. Thus, grain coarsening degrades formability overall, whereas increasing thickness introduces a trade-off between higher forming stress and improved dimensional stability. Both surrogate models demonstrated high predictive accuracy on unseen data (maximum error is 2.01%), identifying a non-standard parameter combination (α = 16.0°, R = 0.30 mm, h = 0.48 mm, W = 1.46 mm, S = 0.73 mm) that yields a thinning rate of 4.43% and a springback angle of 0.151°, a level of precision that is difficult to achieve using conventional orthogonal experimental design. This result was verified by additional finite element simulations. The proposed constitutive model and optimization approach provide a theoretical framework and practical guideline for micro-scale bipolar plate die design.

1. Introduction

The metallic bipolar plate is a core component of proton exchange membrane fuel cells (PEMFCs), accounting for approximately 60% of the stack volume. It serves to connect individual cells in series, separate fuel from oxidant gases, and provide mechanical support [1]. While microscopic innovations such as heterointerface catalysts [2] and single-atom catalysts [3] have significantly enhanced electrochemical performance, translating these advances into system-level benefits critically depends on the macroscopic components. Specifically, the forming accuracy of ultra-thin metallic bipolar plates significantly influences electrical contact resistance, gas sealing integrity, and long-term durability [4,5]. In plates with thicknesses of 0.05–0.1 mm, only a few grain layers exist through the thickness; consequently, variations in grain size and crystallographic orientation induce significant mechanical anisotropy [6]. The dimensional accuracy of the stamped flow channels directly governs the interfacial contact resistance between the bipolar plate and the gas diffusion layer, the uniformity of reactant gas distribution, and the integrity of the sealing interface. Consequently, minimizing thickness variation and springback during the stamping process is essential for ensuring the electrochemical performance and long-term durability of PEMFC stacks. However, existing theoretical models rarely account for the coupled effects of sheet thickness and grain size on stress–strain responses during forming, and the influence of die geometry parameters on forming accuracy remains insufficiently understood. Therefore, reliably predicting forming-induced stress and deformation, combined with rational optimization of die parameters, is essential for guiding the stamping process design of ultra-thin metallic bipolar plates for PEMFC applications.
Various forming techniques, including hydroforming, rubber pad forming, and conventional stamping, have been extensively investigated for the manufacturing of metallic bipolar plates. Among these methods, stamping has emerged as the predominant industrial choice due to its high production efficiency, low operational cost, and inherent process simplicity [4,7]. Despite these advantages, the stamping of ultra-thin metal sheets is inherently susceptible to multiple forming defects, including excessive localized thinning, fracture at micro-channel corners, wrinkling, and springback, all of which severely compromise the dimensional accuracy and long-term service performance of the final product. To address these challenges, extensive research efforts have been dedicated to understanding the influence of die geometric parameters and process variables on forming quality. Bong et al. [8] and Zhang et al. [9] demonstrated that multi-stage stamping processes can optimize stress and strain distribution while improving the aspect ratio of micro-channels; Li et al. [10] revealed a significant nonlinear coupling effect between die clearance and fillet radius that must be carefully balanced; Khatir et al. [11] and Bong et al. [9] confirmed that increasing the fillet radius effectively reduces the maximum thinning rate and enhances achievable forming depth; and Acar et al. [12] and Seddighi et al. [13] showed that optimized blank holder designs can effectively suppress wrinkling while improving thickness uniformity across the formed part. In terms of forming accuracy prediction, Hu et al. [14] and Modanloo et al. [15] demonstrated that the finite element method (FEM) is a widely employed and efficient tool for evaluating thickness distribution and predicting fracture initiation, and Tran et al. [16] developed hybrid optimization models combining artificial neural networks with genetic algorithms that demonstrate robust capabilities in tuning process parameters. Nevertheless, springback, defined as the elastic recovery resulting from the release of non-uniformly distributed residual stresses after load removal [17], remains a critical bottleneck limiting dimensional precision. This challenge is particularly pronounced in the micro-plastic forming of ultra-thin sheets with a thickness of 0.05 to 0.1 mm, where only a few grain layers exist through the thickness direction. The resulting size effect, strongly influenced by the ratio of sheet thickness to average grain size (t/d), significantly alters the mechanical response of the material [18], and Diehl et al. [19] demonstrated that conventional macroscopic constitutive models are inadequate for accurately predicting micro-scale springback behavior [20]. In summary, while existing studies by Kolahdooz et al. [21], Mohammadtabar et al. [22], Huang et al. [23], and Zhang et al. [24] have collectively established a valuable empirical foundation for bipolar plate forming, a systematic understanding of the coupled effects of die geometry and process parameters on both thinning and springback under size-effect conditions for ultra-thin 304 stainless steel bipolar plates remains notably lacking. There is a growing demand for developing a high-fidelity prediction framework and a rational parameter optimization strategy specifically tailored to micro-stamping processes.
Building on this foundation, researchers have employed various optimization strategies to improve the forming quality of metallic bipolar plates. Response surface methodology (RSM), integrated with finite element analysis (FEA) and damage criteria, has been widely adopted to systematically identify the dominant process parameters and establish predictive models for key performance indicators. These studies consistently reveal that die corner radius, clearance, and friction coefficient are the primary determinants of thinning and filling depth, while stamping speed exerts a relatively minor influence [25,26]. The resulting regression models have demonstrated high predictive accuracy for filling rate and springback, facilitating the fabrication of deep flow channels in ultra-thin stainless steel sheets [27,28]. However, RSM relies on low-order polynomial approximations, which inherently limits its capacity to capture highly nonlinear and strongly coupled relationships among process variables. The Taguchi method has also been applied to evaluate the coupled effects of die geometry and process conditions on forming quality, confirming that corner radius, channel geometry, and blank holder force are the dominant factors governing thinning rate and springback [29,30,31]. While robust for screening important factors, this method is restricted to discrete factor levels and does not support continuous design-space exploration or gradient-based refinement. To overcome these limitations, meta-heuristic algorithms have been introduced. Coupling genetic algorithms (GA) with RSM reduced prediction errors by approximately 53% compared with RSM alone [32], and comparative analyses of multiple meta-heuristic approaches have further confirmed the robustness of GA in handling complex parameter spaces [33]. Nevertheless, GA-based methods often rely on RSM-fitted surrogate models, thereby inheriting the polynomial approximation limitations of the underlying response surface. In a related effort, Yu et al. [34] proposed a multi-objective particle swarm optimization (MOPSO) framework targeting simultaneous minimization of thickening and thinning rates. Despite their predictive capabilities, those methods are constrained by low-order polynomial assumptions whose high nonlinearity and strong coupling are inherently limited. Furthermore, it is mainly confined to single- or simple bi-objective optimizations, lacking efficient strategies for high-dimensional synergistic optimization of metrics such as thinning and springback. Consequently, it is urgent to introduce advanced algorithms that combine robust nonlinear mapping with high computational efficiency, thereby overcoming the bottlenecks in complex multi-objective forming quality control.
Despite the accumulation of experimental and finite element (FE) data, two critical challenges remain in the precision forming of metallic bipolar plates for PEMFCs. First, while intrinsic size effects, arising from the comparable scales of sheet thickness and grain size, are well-documented in fundamental micro-forming [6], they are often simplified or decoupled from practical multi-objective optimization frameworks for complex channel geometries. Second, the non-linear coupling effects between die geometric parameters under these size-dependent constraints have not been systematically characterized. To address these gaps, this study integrates the surface layer model and composite layer model to elucidate size-dependent deformation mechanisms during stamping. Subsequently, Random Forest (RF) and XGBoost surrogate models are employed to capture these complex mappings. The primary objective is to determine the optimal trade-offs among multiple objectives by comprehensively considering key die geometric parameters, including punch fillet radius, die fillet radius, channel depth, and channel width. This result is validated through additional finite element simulations.

2. Experimental Details

2.1. Materials and Heat Treatment Tests

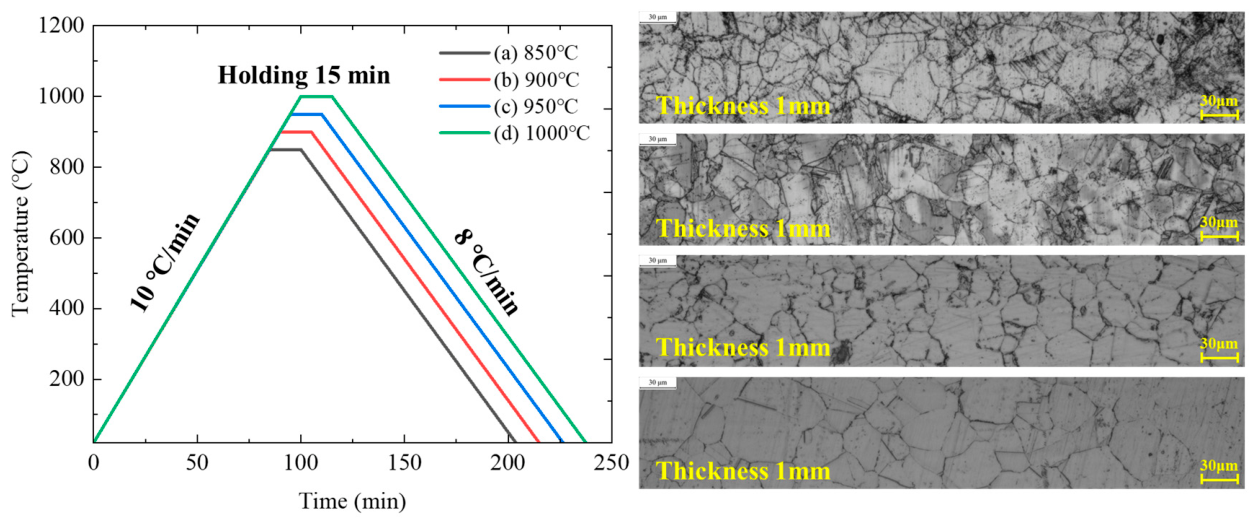
Commercial 304 stainless steel (SS) thin sheets supplied by Zhongxi (Shandong) Metal Technology Co. Ltd. (Jinan, China) were used as the base material. The as-received 304 SS sheets were in cold-rolled annealed condition with a nominal thickness ranging from 0.05 mm to 0.15 mm. To obtain a range of grain sizes, heat treatments were conducted at four temperatures (850 °C, 900 °C, 950 °C, and 1000 °C) across five sheet thicknesses (0.05 mm, 0.08 mm, 0.10 mm, 0.12 mm, and 0.15 mm) using a miniature open-ended tube furnace. Prior to heat treatment, all sheets were ultrasonically cleaned in acetone for 15 min to remove surface contaminants and rolling oils. No mechanical pre-treatment (e.g., polishing or etching) was performed before heat treatment to avoid introducing surface deformation that could affect subsequent grain growth behavior. The corresponding microstructures of 304 SS sheets with a thickness of 0.10 mm after different heat treatment temperatures are presented in Figure 1. In detail, the specimens were heated from room temperature to the target temperature at a heating rate of 10 °C/min, followed by an isothermal holding period of 15 min. Subsequently, the specimens were furnace-cooled to room temperature at a controlled rate of 8 °C/min. Throughout the entire thermal cycle, a constant argon flow rate of 0.5 L/min was maintained. The average grain size was quantified using the linear intercept method in accordance with GB/T 6394-2017 [35]. For each specimen, statistical analysis was performed on three randomly selected fields of view at 500× magnification. The mean grain size was calculated using the equation D = L/(N × M), where L represents the total test line length, N is the number of intersections, and M denotes the magnification.

2.2. Uniaxial Tensile Tests

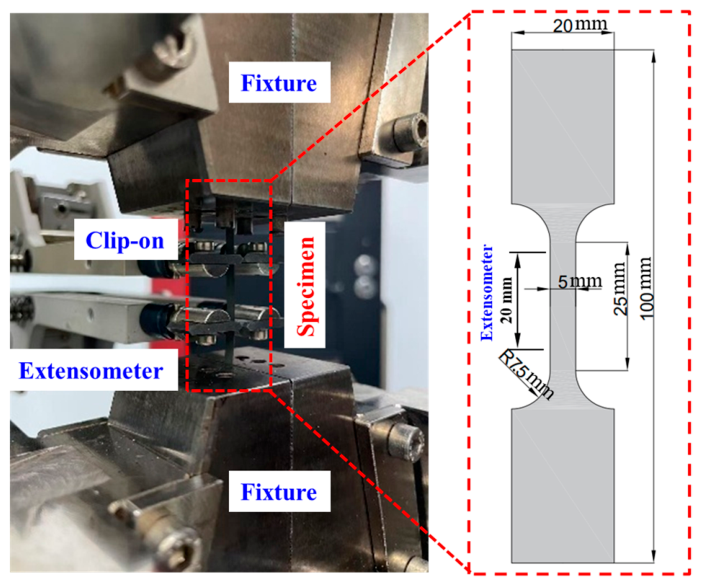
Uniaxial tensile tests were conducted to characterize the mechanical behavior of 304 SS ultra-thin sheets under the coupled influence of grain coarsening and thickness reduction. Specifically, the dimensionless ratio t/Dm (sheet thickness to average grain size) was adopted as the governing parameter to quantify the relative contribution of surface grains versus interior grains to the overall mechanical response. By systematically varying the heat treatment temperature and selecting sheets of different initial thicknesses, a wide range of t/Dm ratios was achieved, enabling a comprehensive investigation of size effects across the transition from bulk-like to surface-dominated deformation. The tests were conducted following ASTM E8. The specimen geometry conformed to the standard’s thin-sheet configuration without dimensional adaptation, with a gauge width of 5 mm and a gauge length of 25 mm. The detailed dimensions and the experimental configuration are illustrated in Figure 2. The monotonic tensile tests were conducted on an MTS servo-hydraulic machine (5 kN) at ambient temperature. Tensile tests were performed at a crosshead displacement rate of 0.5 mm/min. With a gauge length of 25 mm, this corresponds to an initial engineering strain rate of approximately 3.3 × 10⁻⁴s−1. The clip-on extensometer had an initial gauge length of 20 mm, which is shorter than the specimen gauge length of 25 mm. The extensometer was carefully removed when the measured strain reached the maximum range of the extensometer (ε = 0.15). Beyond this point, the strain was determined from the crosshead displacement signal of the MTS testing machine through an iterative correction procedure. To accommodate the extremely thin specimens, a specialized clip-on extensometer was employed to ensure accurate strain measurement without inducing local stress concentrations. In addition, repeated tests (two specimens per condition) were conducted to ensure the reliability of experimental results. The surface flaws were assessed via visual inspection under 10× magnification using an optical microscope. To minimize experimental scatter arising from inherent material defects, only heat treatment specimens without scratches, pits and edge cracks were selected. Because the specimens were extremely thin, abrasive paper was bonded to the gripping surfaces to enhance friction and prevent slippage during loading. The abrasive paper was bonded exclusively to the gripping tabs to prevent slippage during loading. Since it did not extend into the gauge section, the measured mechanical response was unaffected.

3. Finite Element Modeling Incorporating Size Effects

3.1. Constitutive Model Incorporating Size Effects

Based on the framework, the composite model and the surface layer model, the flow stress is defined based on the variation of yield strength with the t/Dm ratio. The composite model treats each grain as comprising a hard grain boundary and a soft interior. The single-grain flow stress σs(ε) is as follows [36]:
σ s ε = λ σ i ε + 1 λ σ b ε
where σi(ε) and σb(ε) are the grain interior and boundary flow stress, respectively. Unit: MPa. λ is the volume fraction of the grain interior.
Assuming the average grain size is Dm (unit: mm) and the grain boundary layer thickness is tg (unit: mm), the relationship between them can be described by the following equation [36]:
t g = k D m n ( 0 < n < 1 )
where k and n are material constants, defined as 0.133 and 0.7 [20], respectively. These values have been validated for 304 SS and similar FCC materials [20].
By substituting the grain with an equivalent sphere, where the grain size equals the diameter of the equivalent sphere, the volume of a single grain can be expressed as follows:
V g = 4 3 π D m 2 3
λ = 4 3 π D m t g 2 3 V g = 1 2 t g D m 3
The single-grain flow stress can then be expressed as follows
σ s ε = 1 2 t g D m 3 σ i ε + 1 1 2 t g D m 3 σ b ε
Furthermore, the surface layer model is introduced. It assumes that the material comprises interior grains and surface grains. Accordingly, the macroscopic flow stress σ(ε) is divided into two components:
σ ε = η σ i n n e r ε + 1 η σ surf ε
where σinner(ε) and σsurf(ε) are the interior and surface layer flow stresses, MPa. η is the volume fraction of interior grains.
The intragranular flow stress σinner(ε) is given by σs(ε), neglecting surface layer grain boundary strengthening. Assuming the surface layer flow stress σsurf(ε) equals the intragranular value σi(ε), we obtain the following:
σ ε = η σ s ε + 1 η σ i ε = 1 + η λ η σ i ε + η ( 1 λ ) σ b ε
Given that the bipolar plate is a plate specimen, its overall volume is expressed as follows:
V p = w × l × t
where w is the width, l is the length, mm, and t is the plate thickness, mm.
By approximating the surface layer thickness as half the average grain size, and assuming the grains are uniformly distributed spheres, the number of grains within the surface layer can be calculated as follows:
S g = π D m 2 2
n 1 = 2 a × l S g
n 2 = 2 a × t S g
n 3 = 2 l × t S g
n b = n 1 + n 2 + n 3
where n1, n2 and n3 represent the approximate number of grains on the three types of surfaces of the bipolar plate (i.e., the top and bottom, left and right, and front and back surfaces), respectively, and nb is the total number of grains in the surface layer of the bipolar plate.
The number of grains in the interior of the material is given by the following:
n g = V g V i
V i = a D m l D m t D m
where ng is the number of grains in the interior of the bipolar plate material, and Vi is the volume of the material after excluding the surface layer, mm3.
Based on the number of grains, the volume fraction of interior grains in the bipolar plate material can be expressed as follows:
η = n g n b + n g
Substituting Equations (4) and (16) into Equation (7) yields the following:
σ ε = 1 + η 1 2 t g D m 3 1 σ i ε + η 1 1 2 t g D m 3 σ b ε
Substituting Equations (2) and (3) into Equations (3)–(17), the flow stress of the bipolar plate material can be expressed as follows:
σ ε = 1 + η 1 0.266 D m 0.3 3 1 σ i ε + η 1 1 0.266 D m 0.3 3 σ b ε
To comprehensively reveal the effects of grain size and sheet thickness on the internal stress, it is necessary to decouple and quantify two independent stress response mechanisms based on experimental data:
(1)
Grain-size-dominated: Constant thickness t with varying average grain size Dm.
(2)
Thickness-dominated: Constant grain size Dm with varying thickness t.
Taking the first case as an example, the flow stress functions σi(ε) and σb(ε) corresponding solely to grain size variation can be inversely identified by solving Equation (18) simultaneously. This yields the grain-size-dominated flow stress, denoted as σDm(ε) (obtained by fitting with fixed thickness and varying grain size). Similarly, the thickness-dominated flow stress, denoted as σt(ε) (obtained by fitting with fixed grain size and varying thickness), can be derived from the second case.
Based on Refs. [19,36], at the micro/meso-scale, the yield strength increases approximately linearly with the ratio of thickness to grain size (t/Dm). Accordingly, a linear weighted superposition strategy is introduced to construct the final comprehensive constitutive relation by integrating the two types of flow stresses after size-effect correction:
σ ε = γ D m σ D m ε + γ t m σ t ε / 2
where 1/2 is the normalization constant, γDm + γt = 2. γDm and γt represent the influence factors of size effects induced by grain size and sheet thickness variations, respectively, defined as follows:
γ D m = 1 + σ y D 0 , t 0 σ D m ( D 0 , t 0 ) σ D m ( D 0 , t 0 )
γ t m = 1 + σ y D 0 , t 0 σ t m ( D 0 , t 0 ) σ t m ( D 0 , t 0 )
here, t0 and D0 are the target thickness and average grain size of the bipolar plate material, respectively; σDm(D0,t0) and σt(D0,t0) are the yield strengths calculated from the σDm(ε) and σt(ε) curves, respectively; and σy(D0,t0) is the experimentally measured yield strength of the target material.

3.2. Finite Element Geometric Modeling

Given the significantly high width-to-thickness ratio of the sheet metal, the stress component normal to the sheet surface is negligible, thereby validating the plane-stress assumption. Consequently, a two-dimensional geometric model was employed to efficiently resolve the transverse deformation mechanics, specifically focusing on through-thickness stress gradients. It is important to note that while this 2D simplification provides a robust framework for analyzing cross-sectional formability, it does not account for in-plane anisotropy or complex 3D edge effects, which are considered secondary factors in the context of the current investigation. A two-dimensional geometric model incorporating grain/grain boundary structures is essential, which characterizes the stress–strain response and microstructural evolution during stamping. In this paper, a representative volume element model (2D polycrystalline model) was established to verify the accuracy of the proposed constitutive model and a three-channel stamping finite element model was proposed to investigate the formability of ultra-thin metal bipolar plates.
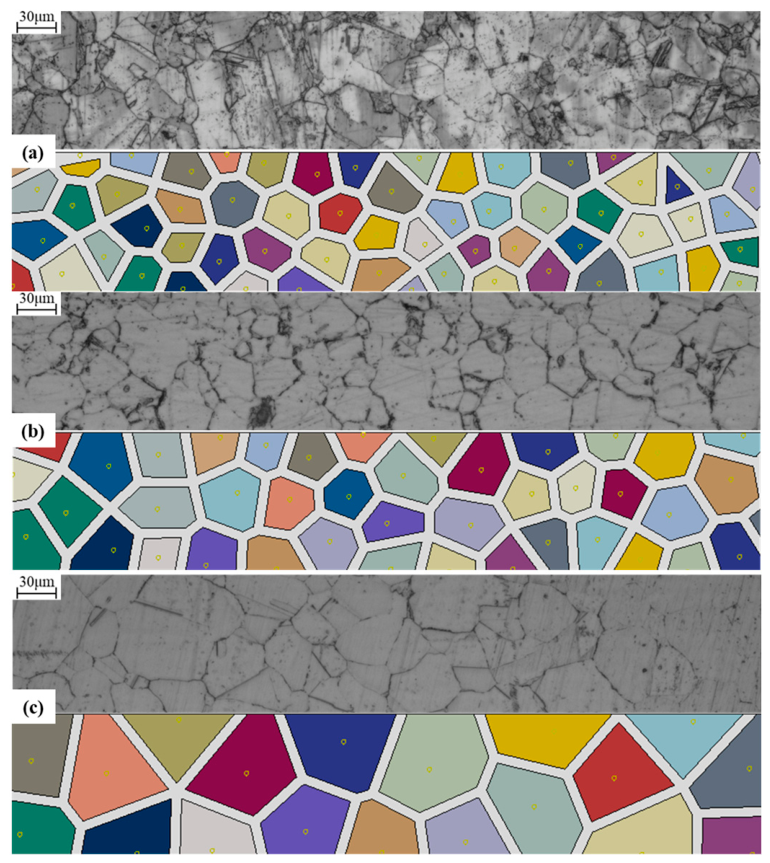
A 2D polycrystalline model for 304 stainless steel was constructed via Voronoi tessellation. First, the number of Voronoi seeds was quantitatively determined based on the measured average grain diameter (Dm) and the required model dimensions. These seeds were then spatially distributed using a random function (rand) before the Voronoi algorithm was applied to partition the grain regions. To explicitly model the grain boundaries, a geometric offset operation was applied to the Voronoi edges based on Dm. Figure 3 validates the model’s fidelity by comparing the generated Voronoi morphologies with experimental metallographic microstructures for Dm = 24, 30 and 51 μm (white: grain boundaries; colored: grain interiors). To account for the stochastic nature of the Voronoi tessellation, five independent random realizations were generated for each grain-size condition.
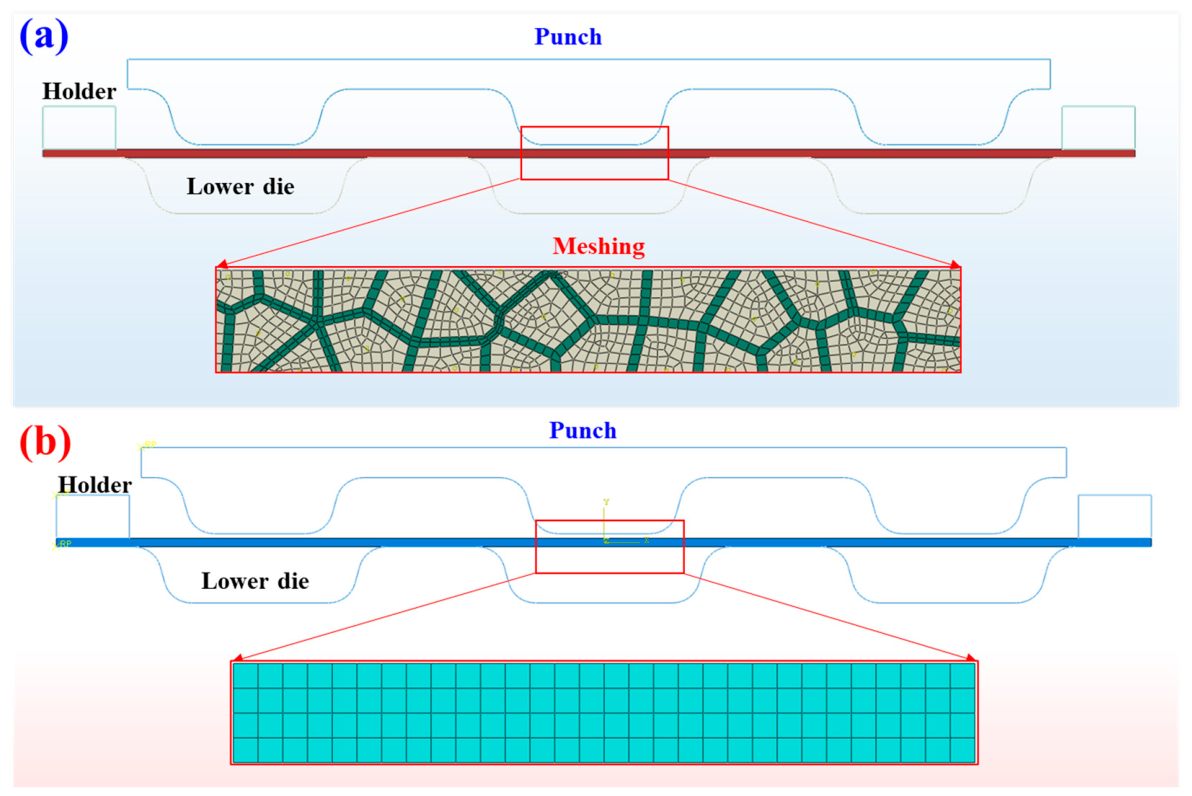
Based on this, a 2D three-channel stamping finite element model was established (Figure 4a). The sheet thickness is 0.1 mm with an average grain size of 0.05 mm. The geometric parameters of the flow channel are: width W = 1.5 mm, draft angle α = 15°, corner radius R = 0.3 mm, channel depth h = 0.65 mm, and rib width S = 1 mm. Given that the hardness of the punch, die, and blank holder significantly exceeds that of the sheet metal, these stamping components were modeled as analytical rigid bodies, with an isotropic point mass inertia of 0.05 t assigned to the punch. The sheet was discretized using the explicit plane stress elements (CPS4R) with a density of 7.93 g/cm3. Distinct constitutive parameters for the grain interiors and grain boundaries were implemented via user-defined subroutines. All interactions in the model were defined using surface-to-surface contact with a penalty friction formulation (friction coefficient of 0.1 and finite sliding algorithm). A mesh convergence study was conducted by simulating the stamping process with five element sizes: 5 μm, 9.3 μm, 14.7 μm, 19.2 μm and 25 μm (characteristic element edge length in the deformation zone). The maximum von Mises stress and the minimum thickness were compared across the five cases. The difference between the two finest meshes was less than 5.7%, confirming mesh convergence. The workpiece was meshed using quadrilateral elements with an approximate global size of 9.3 μm. Since the punch, die, and blank holder were modeled as analytical rigid bodies, they were meshed with a finer approximate global size of 1 μm. The die and blank holder were fully fixed. The punch was displaced at a constant speed of 0.065 mm/s for 10 s, followed by an unloading displacement of 0.5 mm.
For comparison, a homogenized model without grain microstructures is presented in Figure 4b. While the homogenized continuum model is effective for predicting the macroscopic stress field, it inherently averages out local material heterogeneity. To overcome this limitation, the polycrystalline model with explicit grain structure was established. Unlike the continuum approach, this model explicitly resolves the stress evolution within grains and at grain boundaries, thereby providing a detailed understanding of the local deformation mechanisms that govern macroscopic formability.

4. Results and Discussion

4.1. Experimental Results

The measured grain sizes are summarized in Table 1. Taking the 0.10 mm sheet as an example, the average grain size (d) increased from 20 ± 1 μm at 850 °C to 24 ± 2 μm at 900 °C and 30 ± 2 μm at 950 °C, with the most pronounced coarsening occurring between 950 °C and 1000 °C (an increase of 21 μm). This temperature-driven trend was consistent across all thicknesses. The influence of sheet thickness, however, varied with heat-treatment temperature: at 850–950 °C, increasing the thickness from 0.05 mm to 0.15 mm raised d by 19–24 μm, indicating a pronounced thickness dependence in this range, whereas at 1000 °C the corresponding increase was only 7 μm. These results indicate that both temperature and sheet thickness affect grain growth within the investigated range; thickness exerts a more prominent influence at lower annealing temperatures, whereas temperature-driven growth dominates at 1000 °C, thereby reducing the relative contribution of thickness. The reported error bars (±) correspond to one standard deviation derived from nine independent measurements.
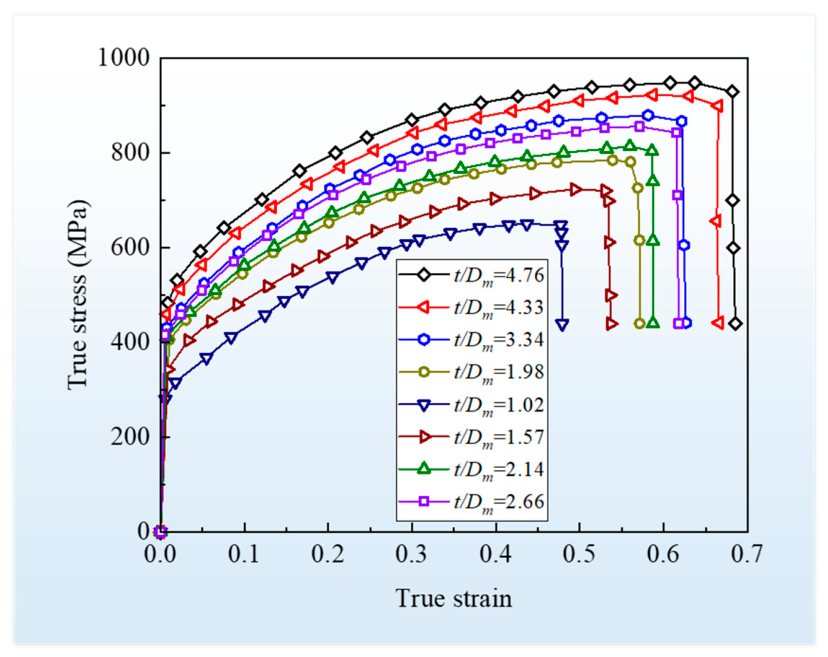
The ratio of sheet thickness to average grain size (t/Dm) was adopted to characterize the number of through-thickness grain layers. As shown in Figure 5, flow stress increases monotonically with t/Dm, i.e., yield strength rises from 280 MPa (t/Dm = 1.02) to 483 MPa (t/Dm = 4.76), ultimate tensile strength from 650 MPa to 948 MPa, and true strain from 0.48 to 0.68. Mechanistically, a higher t/Dm ratio indicates a greater number of through-thickness grain layers, resulting in a higher overall grain boundary density. Since grain boundaries act as obstacles to dislocation motion and promote dislocation pile-up, the increased boundary density enhances the resistance to plastic deformation, which manifests macroscopically as elevated flow stress [37].

4.2. Validation of the Constitutive Models

To establish a constitutive model for bipolar plates that accounts for the coupled size effects of grain size and sheet thickness, the two unknown component flow stresses in Equation (18), σi(ε) and σb(ε), must first be determined. Based on the uniaxial tensile test results presented in Section 2.2, true stress–strain curves were obtained for four groups of 304 stainless steel sheet specimens with the following parameters.
Step 1: Acquisition of experimental data. Based on the uniaxial tensile tests described in Section 2.2, true stress–strain curves were obtained for four groups of 304 stainless steel specimens, covering two sheet thicknesses (t = 0.05 mm and 0.15 mm) and two average grain sizes (Dm corresponding to heat treatment temperatures of 850 °C and 1000 °C).
Step 2: Identification of σDm(ε) and σt(ε). For each of the four specimen groups, the measured thickness t, average grain size Dm, and experimental stress–strain data σ(ε) were substituted into Equation (18). This yielded a system of equations from which the grain-size-dominated flow stress σDm(ε) and the thickness-dominated flow stress σt(ε) were derived. Specifically, σDm(ε) captures the contribution of grain size to the flow stress, while σt(ε) captures the contribution of sheet thickness.
Step 3: Relationship between σi(ε), σb(ε), σDm(ε), and σt(ε). It should be clarified that σDm(ε) and σt(ε) are not independent of σi(ε) and σb(ε). According to Equation (18), σDm(ε) and σt(ε) are derived from σi(ε) and σb(ε) through the grain-size- and thickness-dependent weighting factors, respectively.
Once σDm(ε) and σt(ε) are determined from Step 2, the underlying σi(ε) and σb(ε) can be back-calculated if needed, or the model can proceed directly to the superposition step.
Step 4: Prediction for a target specimen (example: t = 0.12 mm). For a target specimen with t = 0.12 mm and its corresponding average grain size Dm:
(a)
The values of t and Dm are substituted into the previously derived σDm(ε) and σt(ε) functions to obtain the grain-size-dominated and thickness-dominated true stress–strain curves, respectively.
(b)
The yield strengths σDm(D0,t0) and σt(D0,t0) are evaluated at the initial conditions, and together with the experimentally measured overall yield strength σy(D0,t0), the weighting coefficients in Equation (19) are determined.
(c)
The final equivalent true stress–strain relationship is synthesized via the weighted superposition defined in Equation (19).
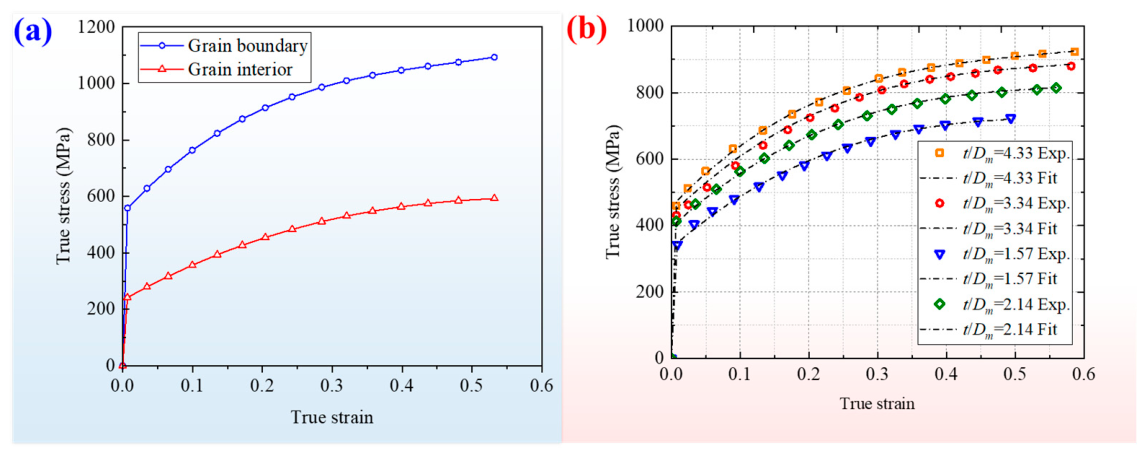
Figure 6a shows that the stress differential between grain boundaries and interiors widens with strain, attributed to dislocation pile-up and higher boundary dislocation density. This result is in close accordance with that reported in Ref. [37]. Following the same procedure, the overall macroscopic stress–strain curves as well as the individual responses of grain boundaries and grain interiors were solved for various combinations of sheet thickness and average grain size (t/d = 4.33, 3.34, 1.57 and 2.14). As presented in Figure 6b, the fitted curves align closely with the experimental points, which were not used for parameter fitting but reserved for independent validation. The maximum deviation along the data line of 21.26 MPa occurs at t/Dm = 3.34, with a relative error of 4.6%. The relative error is defined as the difference between the FE-predicted results and the experimental measurements, normalized by the corresponding experimental values. These results demonstrate that the proposed constitutive model can accurately characterize the true stress–strain behavior of ultra-thin bipolar plate materials.
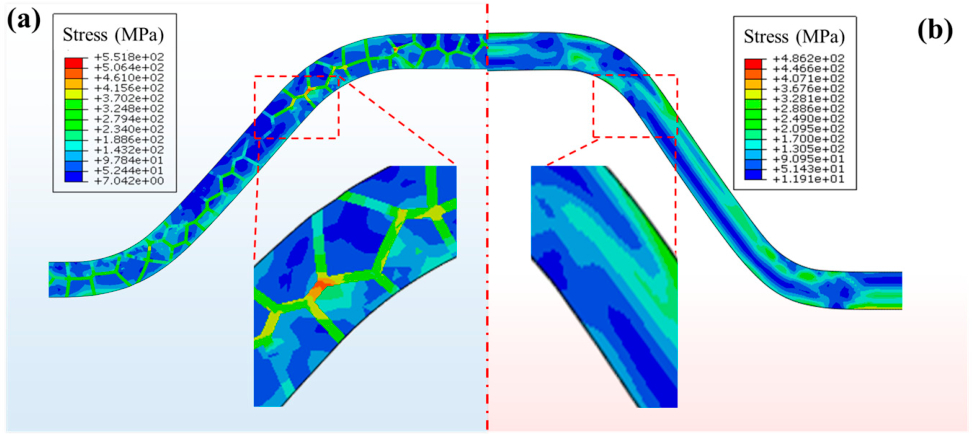
The models with explicit resolved grain microstructures exhibit a markedly different stress distribution from that of the homogenized model, as shown in Figure 7. In the homogeneous model, the stress field is relatively uniform, with no notable local stress concentration, and the peak stress reaches 486.2 MPa at the channel fillet. In contrast, the model incorporating grain boundaries shows clear stress localization at boundary regions, raising the maximum von Mises stress to 551.8 MPa. Under the same loading conditions, neglecting grain-scale heterogeneity inevitably introduces prediction deviations, because the homogenized approach fails to capture the dislocation-pinning effect of grain boundaries and the associated local stress concentrations. While this numerical contrast demonstrates that the homogenized model cannot capture grain-scale stress localization, the definitive conclusion that explicit grain structures are ‘necessary’ requires experimental validation. Such validation is beyond the scope of the present study. However, the grain-resolved model is expected to provide more physically realistic predictions because the stress concentrations at grain boundaries are known to influence deformation mechanisms in ultra-thin sheets.

4.3. Effects of Grain Size and Plate Thickness on Stress Behavior

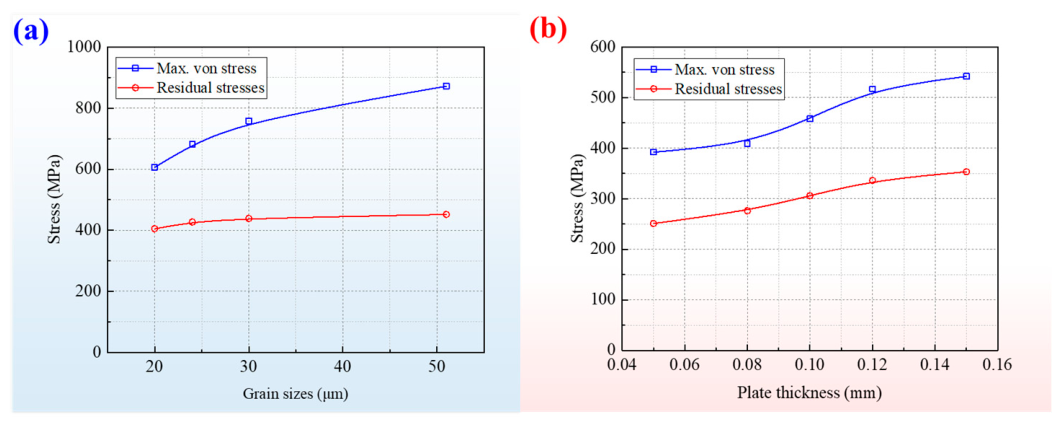
The effects of grain size and plate thickness on the maximum von Mises stress are illustrated in Figure 8a,b, respectively. During the stamping stage, the maximum von Mises stress increases monotonically with grain size. For average grain sizes of 20 μm, 24 μm, 30 μm, and 51 μm, the corresponding maximum stresses are 606 MPa, 681 MPa, 758 MPa, and 872 MPa, respectively, representing relative increases of 12.4%, 25.1%, and 44.4% with respect to the 20 μm baseline. After unloading, the residual stresses are 405 MPa, 427 MPa, 439 MPa, and 452 MPa, respectively, with smaller relative increases of 5.4%, 8.4%, and 11.6%, respectively. These results indicate that an increase in the average grain size leads to a significant intensification of the local stress concentration at the fillet. This phenomenon can be attributed to the fact that, at a constant sheet thickness, a larger grain size reduces the number of grains across the thickness direction, thereby increasing deformation inhomogeneity. Consequently, the coarser grains are more prone to severe strain localization at the fillet, resulting in elevated peak and residual stress levels.
As shown in Figure 8b, the influence of plate thickness on the maximum von Mises stress follows an identical trend to that of grain size. As the plate thickness increases from 0.05 mm to 0.15 mm, the maximum von Mises stress rises from 394.6 MPa to 545.1 MPa, and the residual stress increases from 251.4 MPa to 352.0 MPa. These results imply that, within the investigated range, finer grains and reduced plate thickness both help in lowering forming and residual stresses. A lower stress level is advantageous for reducing the risk of damage in metallic bipolar plates during elevated temperature operation.

4.4. Effects of Grain Size and Plate Thickness on Thinning Rate

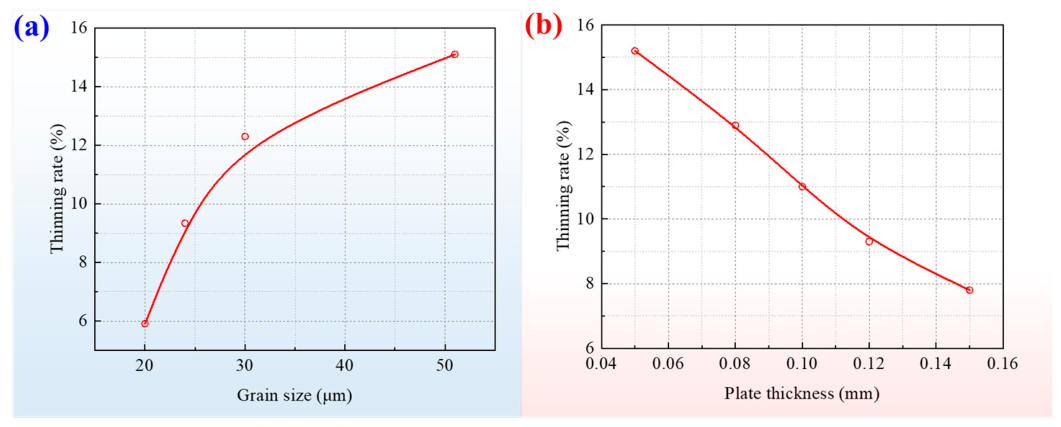
The effects of grain size and sheet thickness on the maximum thinning rate are illustrated in Figure 9a,b, respectively. Thinning rate = (initial thickness- final thickness)/initial thickness × 100%. During stamping, the maximum thinning rate increases monotonically with grain size. For average grain sizes of 20 μm, 24 μm, 30 μm, and 51 μm (thickness 0.1 mm), the corresponding thinning rates are 5.91%, 9.34%, 14.3%, and 15.1%, respectively. This indicates that resistance to localized thinning deteriorates significantly as grain size increases. Mechanistically, for a given plate thickness, a smaller average grain size yields a higher density of grain boundaries, allowing the plastic deformation to be distributed over a larger number of grains. This promotes more homogeneous plastic flow and suppresses strain localization. Conversely, coarse grains concentrate plastic strain into fewer grains, accelerating local thickness reduction.
As shown in Figure 9b, the plate thickness affects thinning in an opposite manner to grain size. As the plate thickness increases from 0.05 mm to 0.15 mm (gain size 51 μm), the maximum thinning rate decreases from 15.2% to 7.8%. Thicker sheets exhibit stronger resistance to thickness reduction due to enhanced through-thickness constraints and altered stress states. In ultra-thin sheets, the weak lateral constraints imposed by free surfaces facilitate dislocation escape, reduce strain hardening capacity, and promote a plane-stress state dominated by thinning. With increasing thickness, multiple grain layers develop through the thickness direction, giving rise to a more triaxial stress state in which through-thickness compressive stresses help resist further thinning. Furthermore, the increased material volume facilitates redistribution of local plastic strain: hard grains constrain excessive deformation of neighboring soft grains, promoting lateral strain spreading rather than shear band localization. Collectively, these mechanisms enable thicker sheets to achieve more homogeneous through-thickness deformation, delayed necking onset, and a significantly reduced maximum thinning rate. The simulation results directly attribute the reduced thinning in thicker samples to the intensified through-thickness constraints and the consequent stress-state transition. While microscopic mechanisms such as dislocation escape and shear-band suppression were not explicitly modeled, the observed macroscopic stability aligns with these established theories, suggesting they act as the underlying physical basis for the delayed necking observed in our continuum model.

4.5. Effects of Grain Size and Plate Thickness on Springback

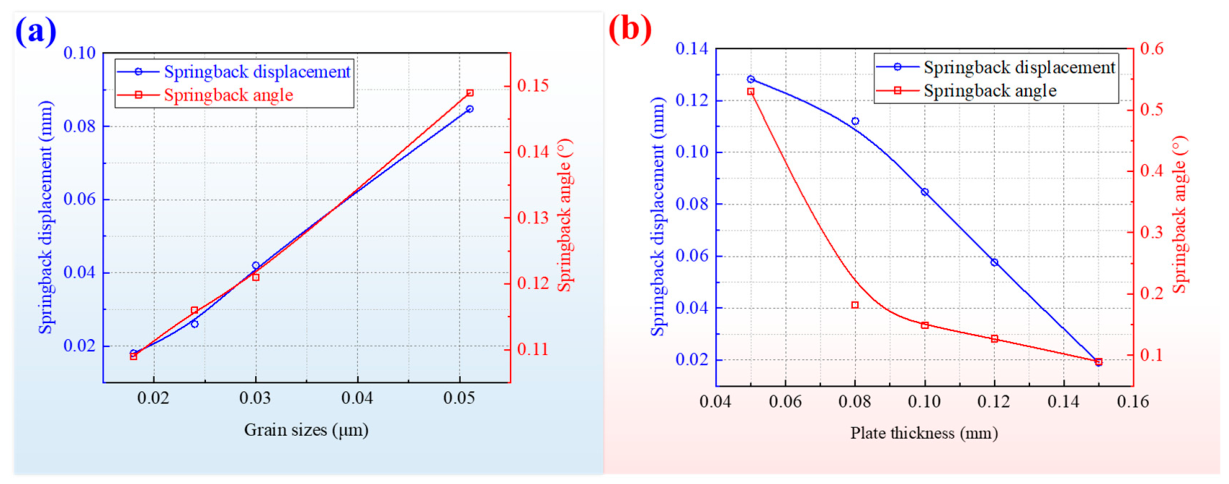
The effects of grain size on springback displacement and springback angle are illustrated in Figure 10a. A node set is defined by selecting the right endpoint of the upper surface of the left rib, and the left and right endpoints of the intermediate channel. The springback angle is determined by the difference in the angle of this node set before and after unloading. The springback displacement is defined as the displacement of the intermediate channel along the y-axis before and after unloading. Both metrics increase with increasing grain size: as the average grain size increases from 20 μm to 50 μm, the springback displacement rises from 0.018 mm to 0.083 mm, and the springback angle increases from 0.1° to 0.149°. During stamping, grain boundaries serve as obstacles to dislocation motion. Sheets with larger grain sizes possess a lower overall grain boundary density, which reduces resistance to plastic flow and results in a greater proportion of elastic strain accumulation at a given load level. Upon unloading, the higher stored elastic strain energy drives more pronounced springback. Furthermore, in coarse-grained sheets, intragranular dislocation slip accommodates a larger fraction of the total deformation, facilitating more complete elastic strain release and thereby amplifying the springback response. The above mechanistic interpretation is adopted from Ref. [37] and is not directly derived from the present simulations. Figure 10b presents the calculated springback displacement and springback angle as functions of plate thickness. As the sheet thickness increases from 0.05 mm to 0.15 mm, both the springback displacement and springback angle decrease monotonically from 0.124 mm to 0.020 mm and from 0.54° to 0.09°, respectively. This trend is primarily attributed to the microstructural evolution in ultra-thin sheets. The increase in springback with decreasing sheet thickness can be attributed to three factors: (i) thinner sheets have lower bending rigidity (∝t3), resulting in a larger elastic fraction of the total deformation; (ii) the higher surface-grain fraction in thinner sheets reduces the flow stress, thereby increasing the elastic-to-total strain ratio; and (iii) the resulting through-thickness stress heterogeneity amplifies the bending moment driving elastic recovery. It should be noted that a quantitative decomposition of these contributions is beyond the scope of the present work.

5. Optimization of Die Parameters for Bipolar Plates

In addition to grain size and plate thickness, die geometric parameters play a critical role in determining the forming quality of bipolar plates. In high-precision stamping, geometric parameters such as draft angle (α), fillet radius (R), channel depth (h), channel width (W) and rib width (S) are nonlinearly coupled with forming-quality indicators, including thinning rate and springback angle. To address this complexity, an intelligent optimization framework integrating a machine-learning-based surrogate model with a global heuristic optimization algorithm was developed.

5.1. Data Preprocessing and Regression Models

During data preprocessing, 41 sets of structured simulation data, summarized in Table 2, were first imported using the Pandas library. To eliminate numerical biases arising from differences in parameter scales and units, the StandardScaler method was applied to standardize all input features, transforming them into a distribution with zero mean and unit variance.
Five critical process parameters were selected as the input feature matrix X. The thinning rate and springback angle were designated as the output response matrix Y. The complete dataset was then randomly partitioned into training and testing sets according to a predefined ratio. This partitioning strategy was used to evaluate the model’s generalization ability on unseen data while reducing the risk of overfitting caused by memorization of training samples.
To achieve high-accuracy response prediction within seconds across a multidimensional process-parameter space, machine-learning-based surrogate models were used in place of computationally expensive conventional FEM simulations in this study. Specifically, Random Forest (RF) and XGBoost regression algorithms were employed to construct high-fidelity surrogate models. To eliminate potential interference between output variables during the simultaneous prediction of thinning rate and springback angle, the MultiOutputRegressor framework was adopted to decouple the multi-output prediction task. This strategy enables each response variable to be modeled independently, thereby improving both the stability and reliability of the predictive models.

5.2. Analysis and Optimization Results

After the surrogate models were trained and their predictive accuracy verified on the test set, the optimization stage was initiated. The objective was to identify the optimal parameter configuration within the physically feasible five-dimensional space that simultaneously minimizes the thinning rate and springback angle.
The Differential Evolution (DE) algorithm was specifically selected to overcome the gradient-vanishing trap inherent in tree-based surrogate models. Because the multidimensional response surfaces constructed by Random Forest and XGBoost are microscopically discrete, exhibiting step-like or flat landscapes, their local gradients are typically zero. Conventional gradient-based optimizers, such as SLSQP, are prone to premature convergence and entrapment in local optima within these flat regions. To address this, the differential_evolution function from the SciPy Optimize library was employed. As a gradient-free, population-based global heuristic, DE initializes a random population within the bounded parameter space and drives evolution through mutation, crossover, and selection operations based on inter-individual differences.
To accommodate the objectives within a single-objective DE framework, a composite fitness function was formulated to transform the multi-objective forming requirements into a scalar minimization task:
O b j e c t i v e = χ 1 δ ^ + χ 1 f ^
where + denotes co-directional optimization, δ and f are the thinning rate and springback angle, and χ1 and χ2 are the weight coefficients (χ1 = χ2 = 0.5), respectively.
Through successive population evolution, the DE algorithm automatically searches the entire design space to identify the process-parameter combination that achieves concurrent minimization of the thinning rate (δ) and maximization of the springback angle (f) (Table 3).
According to the validation results (Table 4), both surrogate models exhibited high predictive accuracy on previously unseen data. In particular, the mean absolute errors associated with the predicted springback angle (f) were maintained at very low levels, confirming the reliability of the surrogate-assisted optimization. In terms of global optimization, the RF-DE framework demonstrated superior engineering applicability. Finally, the related finite element simulations were conducted using two different die sizes to evaluate their relative superiority. The results are summarized in Table 5. The non-standard parameter combination identified by this framework (α = 16.0°, R = 0.30 mm, h = 0.48 mm, W = 1.46 mm, S = 0.73 mm) successfully reduced the predicted thinning rate to 4.43% while simultaneously achieving a predicted springback angle of 0.151°. Such decimal-precision parameter configurations represent a solution space that is inaccessible to traditional orthogonal experimental design methods.

6. Conclusions

This study systematically investigated the effects of grain size and sheet thickness on the formability in micro-stamping of ultra-thin 304 stainless steel sheets. Random Forest (RF) and XGBoost surrogate models coupled with Differential Evolution (DE) were employed to optimize key stamping die parameters. The main conclusions are summarized as follows:
(1)
Increasing the grain size from 20 μm to 51 μm raises the maximum von Mises stress, thinning rate, and springback angle, indicating a clear deterioration in formability. These deteriorations are attributed to reduced grain boundary density, which promotes stress concentration, localizes plastic strain within coarse grains, and increases stored elastic energy.
(2)
Increasing the plate thickness from 0.05 mm to 0.15 mm increases the maximum von Mises stress due to enhanced triaxial constraint, but suppresses both the thinning rate and the springback angle, benefiting from improved strain redistribution and plastic dissipation capacity.
(3)
Grain coarsening consistently degrades formability by simultaneously increasing stress, thinning and springback, whereas plate thickening introduces a trade-off between higher forming stress and improved dimensional stability. Therefore, grain refinement and appropriate thickness selection should be considered together in ultra-thin sheet stamping.
(4)
The RF-DE framework identified an optimal non-standard parameter combination that achieves a predicted thinning rate of 4.43% and a springback angle of 0.151°. This shows the capability of surrogate-assisted global optimization to access a parameter space beyond the resolution of conventional orthogonal experimental design.

Author Contributions

Conceptualization and methodology, J.Z. (Jianghan Zhong) and Y.Y.; software and data curation, C.M.; validation, S.W. and Y.C.; formal analysis, T.W.; investigation, visualization and resources, S.L.; writing—original draft preparation, J.Z. (Jianbin Zhu), Y.Y. and F.X.; writing—review and editing, Y.Y., F.X., J.Z. (Jianbin Zhu); supervision and project administration, F.X. All authors have read and agreed to the published version of the manuscript.

Funding

This work was supported by the National Natural Science Foundation of China (Grant No. 52304143, 52574198), Shandong Provincial Transportation Science and Technology Program (2025BJN03), Shandong Province Higher Education Institutions Youth Innovation Team Development Program (Science and Technology Category) (Grant No. 2024KJH061), Young Talent of Lifting Engineering for Science and Technology in Shandong (Grant No. SDAST2025QTA055), Jining City key research and development project (Grant No. 2024KJHZ010), and the Open Research Project of CAD/CAM Fujian Province University Engineering Research Center (Grant No. K202501).

Institutional Review Board Statement

Not applicable.

Informed Consent Statement

Not applicable.

Data Availability Statement

The raw data supporting the conclusions of this article will be made available by the authors on request.

Conflicts of Interest

Authors Jianbin Zhu, Shusheng Liu, Chao Ma, and Tao Wang were employed by the Shandong Tietou Energy Investment Group Co., Ltd. Authors Siming Wang and Yuanding Cheng were employed by the Shandong Tiefa New Energy Co., Ltd. Author Feng Xu was employed by the Beijing Wei Yi Technology Research Institute Co., Ltd. The remaining authors declare no conflicts of interest.

References

  1. Karimi, S.; Fraser, N.; Roberts, B.; Foulkes, F.R. A Review of Metallic Bipolar Plates for Proton Exchange Membrane Fuel Cells: Materials and Fabrication Methods. Adv. Mater. Sci. Eng. 2012, 2012, 828070. [Google Scholar] [CrossRef] [Scilit]
  2. Sekhar, Y.C.; Cho, S. Advances in Methanol Oxidation Catalysts and System-Level Engineering for Direct Methanol Fuel Cells. Chem. Commun. 2026, 62, 7925–7942. [Google Scholar] [CrossRef] [Scilit] [PubMed]
  3. Sekhar, Y.C.; Cho, S. Single-Atom Catalysts for Fuel-Cell Cathodes: Atomic-Level Design, Mechanistic Insights, and Practical Challenges. Processes 2026, 14, 1473. [Google Scholar] [CrossRef] [Scilit]
  4. Barzegari, M.M.; Khatir, F.A. Study of Thickness Distribution and Dimensional Accuracy of Stamped Metallic Bipolar Plates. Int. J. Hydrogen Energy 2019, 44, 31360–31371. [Google Scholar] [CrossRef] [Scilit]
  5. Song, Y.; Zhang, C.; Ling, C.Y.; Han, M.; Yong, R.-Y.; Sun, D.; Chen, J. Review on Current Research of Materials, Fabrication and Application for Bipolar Plate in Proton Exchange Membrane Fuel Cell. Int. J. Hydrogen Energy 2020, 45, 29832–29847. [Google Scholar] [CrossRef] [Scilit]
  6. Pham, C.H.; Thuillier, S.; Manach, P.E.R.Y. Mechanical Properties Involved in the Micro-Forming of Ultra-Thin Stainless Steel Sheets. Metall. Mater. Trans. A 2015, 46, 3502–3515. [Google Scholar] [CrossRef] [Scilit]
  7. Karacan, K.; Celik, S.; Toros, S.; Alkan, M.; Aydin, U. Investigation of formability of metallic bipolar plates via stamping for light-weight PEM fuel cells. Int. J. Hydrogen Energy 2020, 45, 35149–35161. [Google Scholar] [CrossRef] [Scilit]
  8. Bong, H.J.; Lee, J.; Kim, J.-H.; Barlat, F.; Lee, M.-G. Two-stage forming approach for manufacturing ferritic stainless steel bipolar plates in PEM fuel cell: Experiments and numerical simulations. Int. J. Hydrogen Energy 2017, 42, 6965–6977. [Google Scholar] [CrossRef] [Scilit]
  9. Zhang, R.; Xu, Z.; Peng, L.; Lai, X.; Fu, M. Modelling of ultrathin steel sheet in two-stage tensile deformation considering strain path change and grain size effect and application in multi-stage microforming. Int. J. Mach. Tools Manuf. 2021, 164, 103713. [Google Scholar] [CrossRef] [Scilit]
  10. Li, X.; Lan, S.; Xu, Z.; Jiang, T.; Peng, L. Thin metallic wave-like channel bipolar plates for proton exchange membrane fuel cells: Deformation behavior, formability analysis and process design. J. Power Sources 2019, 444, 227217. [Google Scholar] [CrossRef] [Scilit]
  11. Khatir, F.A.; Barzegari, M.; Talebi-Ghadikolaee, H.; Seddighi, S. Integration of design of experiment and finite element method for the study of geometrical parameters in metallic bipolar plates for PEMFCs. Int. J. Hydrogen Energy 2021, 46, 39469–39482. [Google Scholar] [CrossRef] [Scilit]
  12. Acar, M.C.; Korkmaz, H.G.; Toros, S.; Müller, M. Investigation and evaluation of formability of thin metallic bipolar plates by stamping process. Int. J. Hydrogen Energy 2025, 99, 203–211. [Google Scholar] [CrossRef] [Scilit]
  13. Seddighi, S.; Barzegari, M.M.; Talebi-Ghadikolaee, H. Numerical-experimental investigation of using rubber blank holder on wrinkling of metallic bipolar plates formed by stamping process. Int. J. Hydrogen Energy 2023, 48, 23967–23991. [Google Scholar] [CrossRef] [Scilit]
  14. Hu, Q.; Zhang, D.; Fu, H.; Huang, K. Investigation of stamping process of metallic bipolar plates in PEM fuel cell—Numerical simulation and experiments. Int. J. Hydrogen Energy 2014, 39, 13770–13776. [Google Scholar] [CrossRef] [Scilit]
  15. Modanloo, V.; Talebi-Ghadikolaee, H.; Alimirzaloo, V.; Elyasi, M. Fracture prediction in the stamping of titanium bipolar plate for PEM fuel cells. Int. J. Hydrogen Energy 2021, 46, 5729–5739. [Google Scholar] [CrossRef] [Scilit]
  16. Tran, M.T.; Wang, H.; Lee, H.W.; Kim, D.-K. Crystal plasticity finite element analysis of size effect on the formability of ultrathin ferritic stainless steel sheet for fuel cell bipolar plate. Int. J. Plast. 2022, 154, 103298. [Google Scholar] [CrossRef] [Scilit]
  17. Liu, J.G.; Fu, M.W.; Lu, J.; Chan, W. Influence of size effect on the springback of sheet metal foils in micro-bending. Comput. Mater. Sci. 2011, 50, 2604–2614. [Google Scholar] [CrossRef] [Scilit]
  18. Chun, B.; Kim, H.; Lee, J. Modeling the Bauschinger effect for sheet metals, part II: Applications. Int. J. Plast. 2002, 18, 597–616. [Google Scholar] [CrossRef] [Scilit]
  19. Diehl, A.; Engel, U.; Geiger, M. Influence of microstructure on the mechanical properties and the forming behaviour of very thin metal foils. Int. J. Adv. Manuf. Technol. 2008, 47, 53–61. [Google Scholar] [CrossRef] [Scilit]
  20. Ho, K.; Lin, J.; Dean, T. Modelling of springback in creep forming thick aluminum sheets. Int. J. Plast. 2004, 20, 733–751. [Google Scholar] [CrossRef] [Scilit]
  21. Kolahdooz, R.; Asghari, S.; Rashid-Nadimi, S.; Amirfazli, A. Integration of finite element analysis and design of experiment for the investigation of critical factors in rubber pad forming of metallic bipolar plates for PEM fuel cells. Int. J. Hydrogen Energy 2017, 42, 575–589. [Google Scholar] [CrossRef] [Scilit]
  22. Mohammadtabar, N.; Bakhshi-Jooybari, M.; Hosseinipour, S.J.; Gorji, A.H. Feasibility study of a double-step hydroforming process for fabrication of fuel cell bipolar plates with slotted interdigitated serpentine flow field. Int. J. Adv. Manuf. Technol. 2016, 85, 765–777. [Google Scholar] [CrossRef] [Scilit]
  23. Huang, Y.; Garg, A.; Asghari, S.; Peng, X.; Le, M.L.P. Robust model for optimization of forming process for metallic bipolar plates of cleaner energy production system. Int. J. Hydrogen Energy 2018, 43, 341–353. [Google Scholar] [CrossRef] [Scilit]
  24. Zhang, J.; Wang, R.C.; Zeng, Y. Hydroforming rules and quality control parameters analysis for metal bipolar plate. Eng. Fail. Anal. 2022, 132, 105919. [Google Scholar] [CrossRef] [Scilit]
  25. Zhao, F.Q.; Gao, Z.Y.; Huang, Q.X.; Cheng, X.; Zhang, H.; Ma, C.; Chen, S.; Ding, X. Optimizing die parameters of microstamping process for PEMFC 316L bipolar plate using NCL fracture criterion and response surface methodology. Int. J. Adv. Manuf. Technol. 2024, 132, 1679–1696. [Google Scholar] [CrossRef] [Scilit]
  26. Modanloo, V.; Alimirzaloo, V.; Elyasi, M. Optimal design of stamping process for fabrication of titanium bipolar plates using the integration of finite element and response surface methods. Arab. J. Sci. Eng. 2020, 45, 1097–1107. [Google Scholar] [CrossRef] [Scilit]
  27. Zhang, H.; Zhao, F.Q.; Cheng, X.J. Simulation and experimental study on multi-step stamping forming of ultra thin sheet of stainless steel. Die Mould. Ind. 2022, 48, 6–10. [Google Scholar]
  28. Zhao, F.Q.; Cheng, X.J.; Gao, Z.Y.; Zhang, H.; Chang, X.D. Influence of mold parameters on damage value of SS316L stainless steel bipolar plate step flow channel stamping forming. J. Plast. Eng. 2023, 30, 49–56. [Google Scholar]
  29. Wang, Y.G.; He, S.R.; Gu, M.; Gao, F.; Xiong, K.H. Numerical analysis and springback compensation of metal bipolar plate stamping forming. J. Plast. Eng. 2024, 31, 43–50. [Google Scholar]
  30. Huang, K.J.; Hwang, S.J.; Lai, W.H. Evaluation of forming quality and spring-back of fuel cell metallic bipolar plate during stamping via simulations. J. Aeronaut. Astronaut. Aviat. 2015, 47, 131–142. [Google Scholar]
  31. Huang, C.W. Study on Formability and Channel Design of Stainless Steel Bipolar Plate for PEMFC. Master’s Thesis, National Cheng Kung University, Tainan, Taiwan, 2016. [Google Scholar]
  32. Modanloo, V.; Alimirzaloo, V.; Elyasi, M. Prediction of formability of the metallic bipolar plates for PEM fuel cell in stamping process using meta-heuristics algorithms. Modares Mech. Eng. 2023, 23, 521–530. [Google Scholar]
  33. Modanloo, V.; Mashayekhi, A.; Akhoundi, B. A comparative analysis of predictive models for estimating the formability of stamped titanium bipolar plates for proton exchange membrane fuel cells. Int. J. Hydrogen Energy 2024, 56, 894–902. [Google Scholar] [CrossRef] [Scilit]
  34. Yu, S.H.; Zhao, R.M.; Li, J.Q.; He, X.; Jiang, X. Process optimization of sheet metal stamping based on multi-objective particle swarm algorithm. Hot Work. Technol. 2014, 43, 144–150. [Google Scholar]
  35. GB/T 6394-2017; Determination of the Estimated Grain Size of Metals. Standards Press of China: Beijing, China, 2017.
  36. Molotnikov, A.; Lapovok, R.; Davies, C.H.J.; Cao, W.; Estrin, Y. Size effect on the tensile strength of fine-grained copper. Scr. Mater. 2008, 59, 1182–1185. [Google Scholar] [CrossRef] [Scilit]
  37. Estrin, Y.; Tóth, L.S.; Molinari, A.; Bréchet, Y. A dislocation-based model for all hardening stages in large strain deformation. Acta Mater. 1998, 46, 5509–5522. [Google Scholar] [CrossRef] [Scilit]
Figure 1. Microstructures of 304 SS sheets (0.1 mm) corresponding to different heat treatment temperatures.
Materials 19 03519 g001
Figure 2. Experimental setup and specimen dimensions for uniaxial tensile tests.
Materials 19 03519 g002
Figure 3. Comparison between metallographic structures and Voronoi-generated microstructures for 304 SS with different average grain sizes: (a) 24 μm, (b) 30 μm and (c) 51 μm.
Materials 19 03519 g003
Figure 4. Finite element models for bipolar plate stamping: (a) polycrystalline model with explicit grain structure; (b) homogenized continuum model.
Materials 19 03519 g004
Figure 5. True stress–true strain curves for specimens with different thickness-to-average-grain-size ratios.
Materials 19 03519 g005
Figure 6. Validation of the constitutive model: (a) true stress–true strain curves of grain boundary and grain interior; (b) comparison between predicted and experimental macroscopic curves for various t/Dm ratios.
Materials 19 03519 g006
Figure 7. Comparison of stress distributions between (a) the model considering grain microstructures and (b) the homogenized model without grain microstructures.
Materials 19 03519 g007
Figure 8. Effects of (a) grain size and (b) plate thickness on the maximum von Mises stress during stamping and after unloading.
Materials 19 03519 g008
Figure 9. Effects of (a) grain size and (b) plate thickness on the maximum thinning rate.
Materials 19 03519 g009
Figure 10. Effects of (a) grain size and (b) plate thickness on springback displacement and springback angle.
Materials 19 03519 g010
Table 1. Measured grain sizes of 304 SS sheets under various heat treatment temperatures (μm).
t/mm0.050.080.100.120.15
T/°C
8508 ± 118 ± 220 ± 126 ± 230 ± 3
90011 ± 219 ± 224 ± 230 ± 335 ± 4
95028 ± 329 ± 330 ± 239 ± 347 ± 5
100049 ± 550 ± 451 ± 455 ± 756 ± 5
Table 2. Thinning rate and springback angle under different structural parameters.
No.αR/mmW/mmh/mmS/mmTR/%SA/°
1150.150.51.20.75.910.28
2100.150.51.30.87.050.14
3100.150.61.30.89.820.30
4150.30.551.41.14.770.62
550.10.451.30.810.960.53
650.150.61.30.810.970.64
7150.10.551.40.912.330.21
8150.30.651.512.970.57
9150.20.451.30.94.860.25
10150.30.61.20.94.770.43
1150.10.451.51.241.050.57
12200.250.51.20.83.480.49
13150.20.451.51.15.170.47
14200.150.51.515.770.65
1550.150.651.51.236.740.79
16200.150.61.517.860.37
17250.150.451.51.27.770.43
1850.150.61.51.219.970.68
19150.20.51.30.95.540.32
20100.250.51.51.26.650.37
21200.150.51.319.610.84
22150.20.51.415.760.40
23100.250.61.20.85.470.37
24150.20.551.20.98.180.41
25100.250.51.51.15.110.15
26200.150.61.3111.580.35
27200.250.61.20.84.440.45
2850.250.61.30.96.000.98
29150.20.61.417.700.53
30200.250.551.20.95.100.44
3150.20.551.40.96.200.37
32100.150.61.51.215.810.44
33100.250.61.30.95.650.31
34150.250.651.317.630.47
35100.150.51.51.211.520.34
36250.250.651.30.94.510.57
37200.250.61.41.16.730.59
38250.10.51.51.213.720.65
39150.20.551.41.18.570.52
4050.250.651.51.17.670.88
41250.150.651.51.211.940.35
Table 3. Comparison of optimal process parameters and corresponding responses obtained using the RF-DE and XGBoost-DE models.
αRWhSPredicted Thinning Rate (δ)Predicted Springback Angle (f)
Random Forest + Differential Evolution16.030.301.460.480.734.000.14
XGBoost + Differential Evolution17.210.261.260.450.805.500.14
Table 4. Comparison of mean absolute error (MAE) between the RF and XGBoost surrogate models.
Train SetTest Set
Thinning Rate (δ)Springback
Angle (f)
Thinning Rate (δ)Springback Angle (f)
Random Forest + Differential Evolution2.960.381.560.94
XGBoost + Differential Evolution1.640.582.010.46
Table 5. Comparison of simulated results of FEM with different structural parameters.
αRWhSSimulated Thinning Rate (δ)Simulated Springback Angle (f)
160.301.460.480.734.430.151
170.261.260.450.806.310.155
Disclaimer/Publisher’s Note: The statements, opinions and data contained in all publications are solely those of the individual author(s) and contributor(s) and not of MDPI and/or the editor(s). MDPI and/or the editor(s) disclaim responsibility for any injury to people or property resulting from any ideas, methods, instructions or products referred to in the content.