Article

Effective Measurement of the Influence of an Ovoidal Particle Shape on the Tortuosity and Permeability: Theoretical and Numerical Studies


1
School of Materials Science and Engineering, Hebei University of Technology, Tianjin 300401, China
2
School of Civil and Transportation Engineering, Hebei University of Technology, Tianjin 300401, China
3
Key Laboratory of Green Construction and Intelligent Maintenance for Civil Engineering of Hebei Province, School of Civil Engineering & Mechanics, Yanshan University, Qinhuangdao 066004, China
*
Author to whom correspondence should be addressed.
Materials 2026, 19(16), 3498; https://doi.org/10.3390/ma19163498 (registering DOI)
Submission received: 3 July 2026 / Revised: 16 August 2026 / Accepted: 17 August 2026 / Published: 18 August 2026

Abstract

An ovoid is a common particle, which is usually formed by constant extrusion and friction during running water handling. However, there is still debate over how the form of ovoidal particles affects the tortuosity and water permeability of particle packing systems. The tortuosity and permeability of the particle packing system are examined in relation to the shape and volume fraction of the particles in this work. The ovoid particle packing system is built using the Monte Carlo approach, and the tortuosity is obtained numerically. Then, the accuracy of the tortuosity prediction model is evaluated by comparing the theoretical derived tortuosities with the simulated results in this work and other literature. By combining the widely used Kozeny–Carman (K-C) formula with the derived theoretical tortuosity prediction model, we develop a modified K-C formula to predict the permeability of ovoidal particle packing systems. By comparing the model outputs with published experimental data and self-conducted lattice Boltzmann method (LBM) numerical simulations, we verify that the modified K-C formula achieves high prediction accuracy. According to the findings, when the aspect ratio c/a rises, the tortuosity first decreases and then increases, and the permeability first increases and then decreases.

1. Introduction

Particle packing systems are widely found in natural and manufactured porous composites, such as soil [1], sand [2,3], and cementitious materials [4,5]. Porous composites should, in general, be durable to lower maintenance expenses while in use. The durability of porous composite is closely related to its internal water transport behavior, since water is not only a direct participant in physical deterioration but also provides the medium for aggressive media to invade into the composites [6,7,8,9,10]. Due to the variable shape and spatial arrangement of the particles, the water transport path is winding and rugged, which makes it hard to accurately assess the porous composites’ permeability. Therefore, controlling the permeability and durability of porous composites requires precisely assessing how the particle form affects the tortuosity of water transport pathways and determining the quantitative link between tortuosity and permeability.
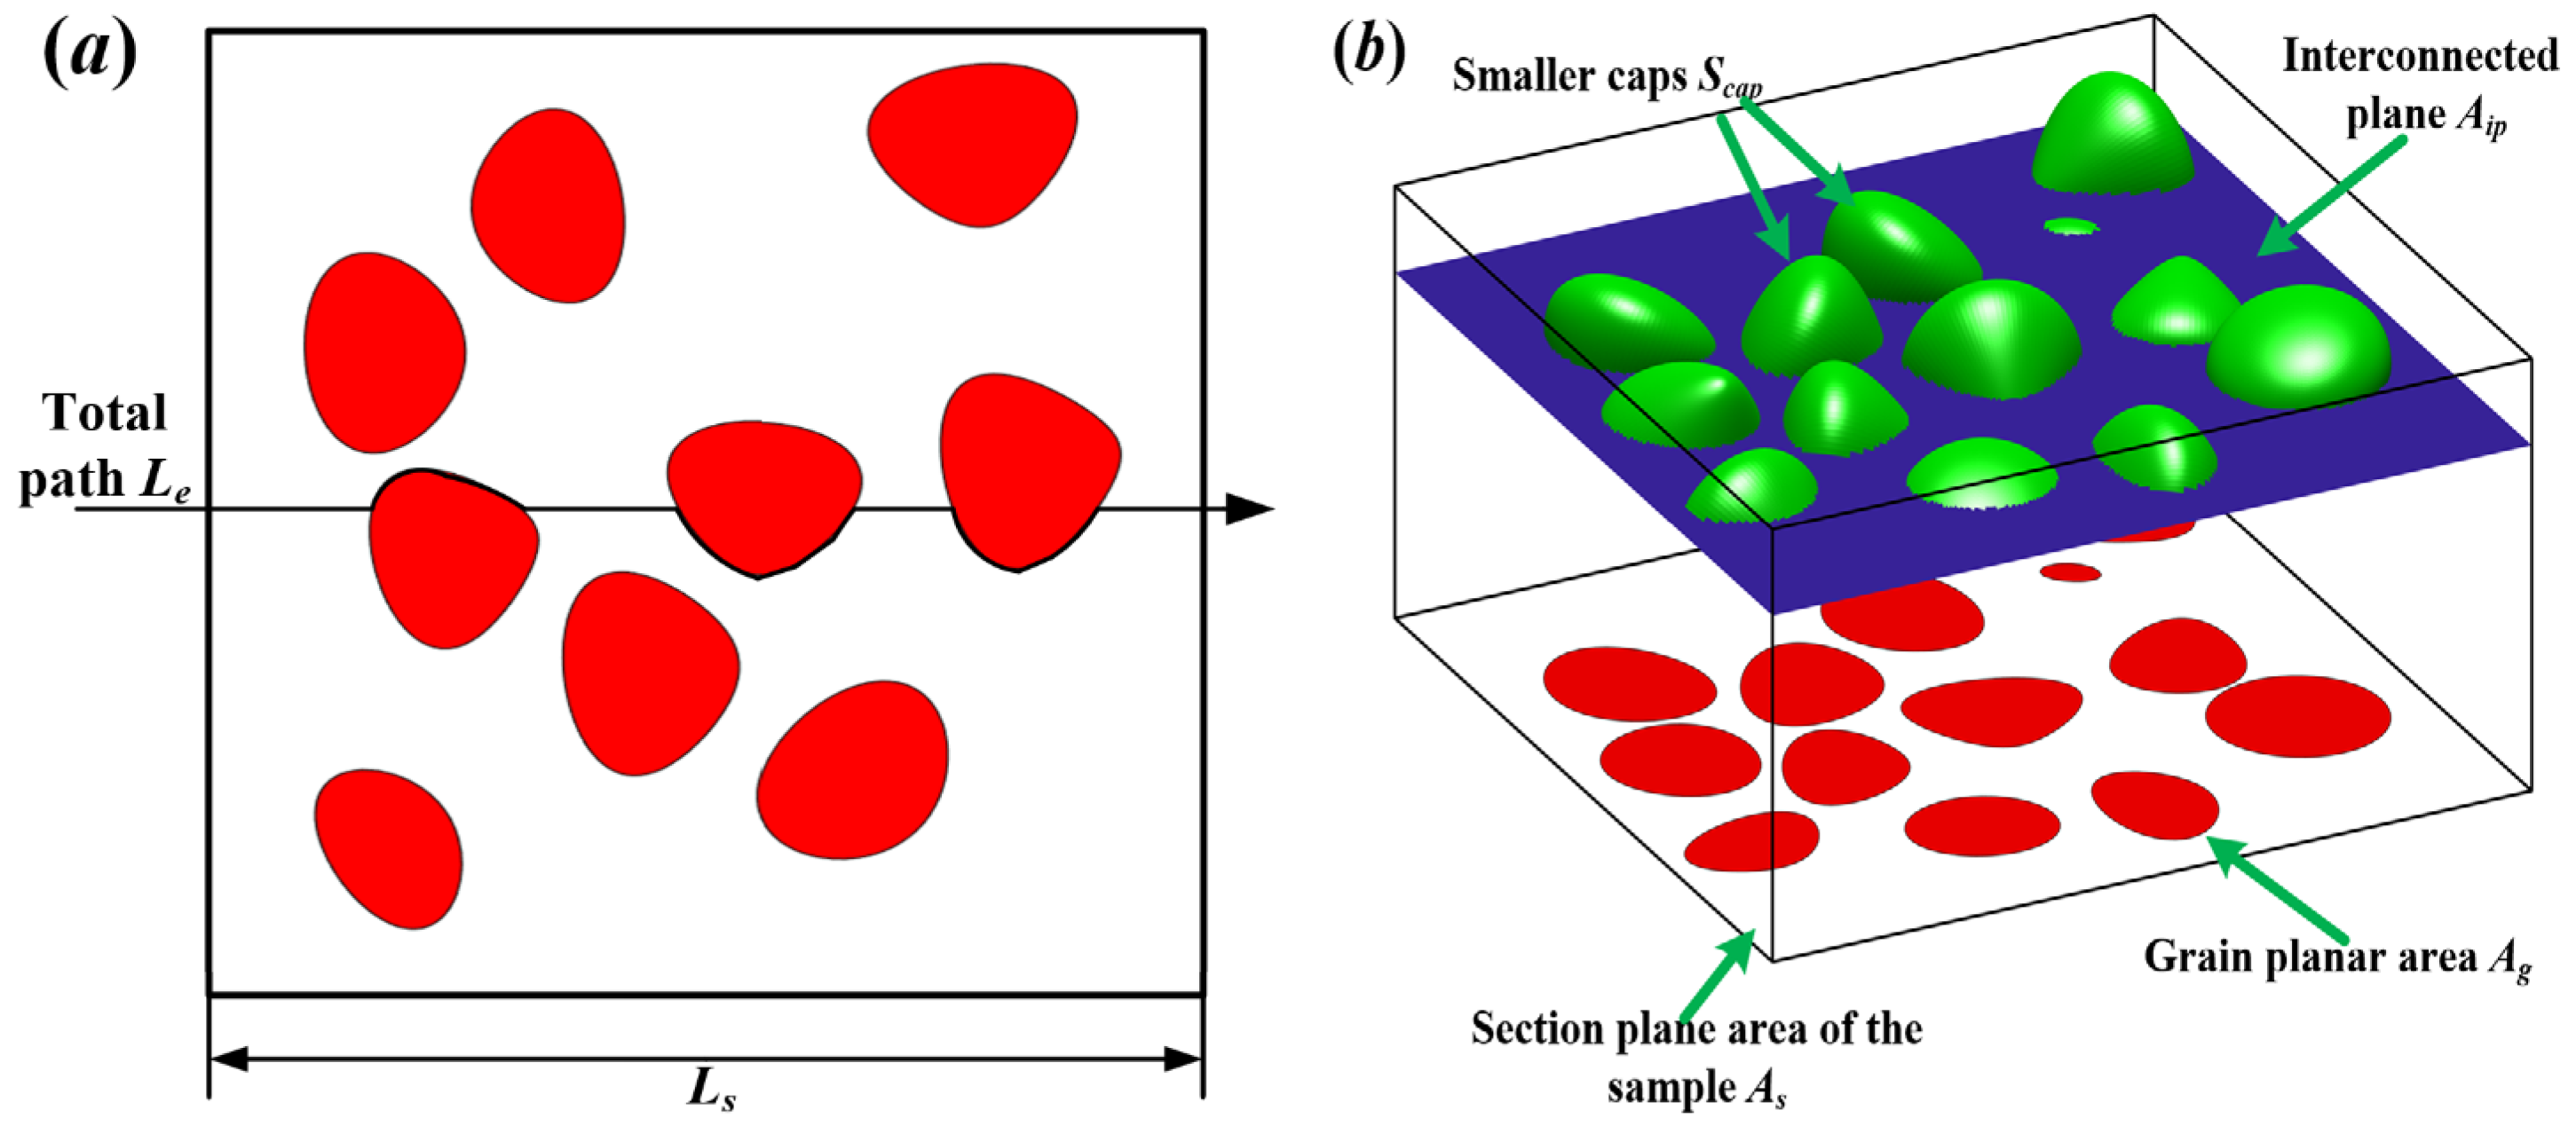
The definitions of water transport paths include both linear tortuosity τl [11] and planar tortuosity τp [12]. The linear tortuosity τl is the proportion of the total length of the transport path Le to the length of the sample edges Ls, as shown in Equation (1a); the linear tortuosity τl has good applicability in characterizing the transport path tortuosity in two-dimensional space. In order to characterize the transport path tortuosity in the three dimensional porous composite, Stroeven [12] and Li et al. [13] adopted the planar tortuosity τp, which was considered the proportion of total area of the fluid and gas flowing to the cross-sectional area of the sample, as shown in Equation (1b). Compared with the linear tortuosity τl, the planar tortuosity τp can more comprehensively characterize the porous composite transport paths with tortuosity; therefore, the planar tortuosity τp is employed in this work.
τ l = L e L s
τ p = S e A s
where τl is the linear tortuosity; Le is the total length of the tortuous path; Ls is the sample length; τp is the planar tortuosity; Se is the total area on the tortuous surface; As is the cross-sectional area of the sample.
The theoretical derivations and numerical methods are usually adopted to investigate the tortuosity of particle packing system. For example, a model of tortuosity is presented [14], according to regular triangle arrangement and square pitch arrangement in two-dimensional microstructures. Wu et al. [15,16] studied how the representative elementary volume affects the degree of transport path tortuosity. Yu and Li [17] developed an overlapping particle packing model and obtained an approximation of the tortuosity near the percolation threshold. Assuming particles are unrestrictedly in porous composites, Yun et al. [18] propose a linear tortuosity prediction formula for spherical, cubic, and plate packing systems. It is challenging to efficiently determine the tortuosity of the actual porous composite using the aforementioned tortuosity prediction models since the present models fix the particle arrangement, which is inconsistent with an actual random particle packing system. To determine how ovoidal particle constitution affects the tortuosity and permeability, this work generates an ovoidal particle packing system based on the mathematical expression of the ovoid particles [19], as shown in Equation (2).
F o v o i d ( x , y , z ) = 1 T z c + 1 × x a 2 + 1 T z c + 1 × y b 2 + z c 2 1 = 0
where Fovoid is the formula for the ovoid particle. The ovoid’s semi-axis lengths in the x, y, and z axes are expressed as a, b, and c, respectively; in addition, the semi-axis length b is equal to the semi-axis length c in this work; and T is the tapering parameter.
To illustrate how the tortuosity of the transport path affects the permeability, a series of empirical/semi-empirical models are proposed [20,21,22]. One of the most widely used models is the K-C formula [6], as shown in Equation (3). In the initial study, the K-C formula constant Ck ≈ 5 was an accepted empirical value [23,24,25]. However, with further study, it was found that the K-C formula constant Ck is not a constant but a quantity [26,27] that varies with the internal composition of the particle packing system. For example, for the peat layer, Mathavan et al. [28] discovered Ck = 3.4. Kyan et al. [29] discovered that when the particle volume fraction VV,g was 0.05 or lower, there was an exponential connection between Ck and VV,g. To determine the K-C formula constant Ck for different particle packing systems, to measure the link between the tortuosity τ and the K-C formula constant Ck, Equation (4) was developed [30]. Therefore, it will be possible to estimate the permeability k of the ovoid particle packing system by quantitatively describing the impact of the particle shape and volume fraction on the tortuosity τ and the shape parameter Cf.
k = 1 V V , g 3 C k V V , g 2 S V , g 2
C k = C f τ 2
where k is the permeability; Vg is the volume fraction of the particles; SV,g is the specific surface area of the particles; Ck is the K-C formula’s constant, as shown in Equation (4); Cf is the shape parameter; and τ is the tortuosity.
It can be found that there are some limitations of traditional regular tortuosity–permeability prediction models: fixed constant K-C formula and incomplete multi-parameter coupling research. To characterize the effect of the internal composition (i.e., particle shapes, volume fractions, and size distributions) of ovoid particles on the planar tortuosity of the transport path and water permeability, this work is organized into the following sections: Section 2 theoretically derives the transport path tortuosity in the ovoid particle packing system and determines the theoretical model’s dependability through comparing the theoretical model with the numerical simulation results, which reveals the effect of the internal composition of the particle packing system on the planar tortuosity τp. Section 3 determines the permeability k of the particle packing system using the lattice Boltzmann method (LBM). A modified K-C formula for the mono-sized particle packing system (MPPS) and poly-sized ovoid particle packing system (PPPS) is proposed by combining the theoretical tortuosity prediction model with the shape parameter Cf prediction formula. The relationship between Cf and the shape and volume fraction of the ovoid particles is determined.

2. A Theoretical Model of Tortuosity

2.1. Mono-Sized Ovoid Particle Packing System (MPPS)

In the particle packing system, the linear tortuosity τl and the planar tortuosity τp are shown in Figure 1. The linear tortuosity τl is the proportion of the fluid flow length to the specimen edge length. Analogous to the linear tortuosity, the planar tortuosity τp is the ratio of the total area over which the fluid flows St to the cross-section area of the specimen As, i.e., the ratio of the total area of the connecting plane Aip and the surface area of each smaller cap Scap to the specimen’s cross-section area As, as expressed by Equation (5).
τ p = S e A s = S c a p + A i p A s = S A , c a p + A A , i p
where SA,cap is the ratio of Scap to As; AA,ip represents the connecting plane’s area fraction.
Delesse’s law [31] states that the area fraction AA,g of a component is equal to the volume fraction VV,g of that component in three-dimensional space on a random cross section. AA,ip, which refers to the proportion of the interconnecting planes’ area Aip to the specimen cross-section area As, can be found by Equation (6).
A A , i p = A i p A s = A s A g A s = 1 A A , g = 1 V V , g
where Ag is the section area of all particles that the section plan intercepts.; AA,g is the particle area fraction, which is equal to Ag/As; VV,g is the volume fraction of particles.
In order to solve for the surface area of all smaller caps Scap, one must find the average surface area of all smaller caps <Scap> and the number of particles per unit area NA. It should be remembered that SA,cap is equal to the product of <Scap> and NA, as stated in Equation (7).
S A , c a p = N A S c a p
For the MPPS, assuming that the ovoidal particles of equivalent diameter Dagg are arranged randomly in a cubic box with sides L, the possibility that the particle crossed the section is B1Dagg/L, where B1 is the proportion of the particle caliper diameter B to the equivalent diameter Dagg. The equivalent diameter Dagg is the diameter of a corresponding sphere having the same volume as the particle under consideration. Furthermore, the number of ovoid particles that intersect the cross section Nidp is equal to B1NaggDagg/L, where Nagg is the quantity of ovoid particles in the box. Therefore, NA,m, the number of ovoid particles per unit area intercepted by the cross section, can be obtained by Equation (8a). Equation (8b) can be used to get the entire number of particles Nagg in the box once the particle volume fraction VV,g is known. Equation (8c) displays the relationship between particle’s volume fraction VV,g and NA,m, by substituting Equation (8b) into Equation (8a).
N A , m = N i d p L 2 = B 1 N a g g D a g g L 3 = N V , m D a g g
N a g g = V V , g L 3 V a g g 1 D a g g 3
N A , m = B 1 N a g g D a g g L 3 = 6 B 1 V V , g π D a g g 2
B = 2 0 2 π d θ π 2 π 2 d ϕ { ( x θ x θ ) [ ( x θ × x ϕ ) x ϕ ϕ ] + ( x ϕ x ϕ ) [ ( x θ × x ϕ ) x θ θ ] 2 ( x θ x ϕ ) [ ( x θ × x θ ) x θ ϕ ] } × [ 2 ( x θ x θ ) ( x ϕ x θ ) 2 ( x θ x ϕ ) 2 ] 1 ,
x = a ( T sin θ + 1 ) cos θ cos φ , b ( T sin θ + 1 ) cos θ sin φ , c sin θ
x φ = a sin φ cos θ ( T sin θ + 1 ) b cos φ cos θ ( T sin θ + 1 ) 0
x θ = a T cos φ cos 2 θ a cos φ sin θ ( T sin θ + 1 ) b T sin φ cos 2 θ b sin φ sin θ ( T sin θ + 1 ) c cos θ
x θ θ = a cos φ cos θ ( T sin θ + 1 ) 3 a T cos φ cos θ sin θ b sin φ cos θ ( T sin θ + 1 ) 3 b T sin φ cos θ sin θ c sin θ
x φ φ = a cos φ cos θ ( T sin θ + 1 ) b sin φ cos θ ( T sin θ + 1 ) 0
x θ φ = a sin φ sin θ ( T sin θ + 1 ) a T cos 2 θ sin φ b T cos φ cos 2 θ b cos φ sin θ ( T sin θ + 1 ) 0
where Vagg1 is the proportion of a single particle’s volume Vagg to the cubic equivalent diameter of a particle Dagg; Vagg1 = π/6 for the ovoid particle; NV,m is the total amount of particles per unit volume for MPPS; x represents the vector from the center of ovoid to the surface point P(θ, φ); xθ and xφ denote the first partial derivatives of x; xθθ, xφφ and xθφ are the second partial derivatives of x. θ ∈ [−π/2, π/2] and φ ∈ [−π, π] of the ovoid are respectively the polar angle and azimuth angle of the point P(θ, φ) of the ellipsoid without applying tapering deformation.
After getting NA,m, which is the total number of ovoid particles per unit area intercepted by the cross-section plane, according to Equation (7), the next step is to obtain the average value of the overlap area of the fluid with all particles <Scap>. In order to determine <Scap>, a systematical cap sample method (SCSM) [32] is employed. The proportion of the average value of the overlap area of the fluid with all particles <Scap> to the particle surface area Sagg is considered as the average particle crown area parameter Pave, as expressed in Equation (9). Then, <Scap> can be calculated by Equation (10).
P a v e = S c a p S a g g
S c a p = P a v e S a g g 1 D a g g 2
S a g g 1 = S a g g D a g g 2
where the particle surface area Sagg divided by the square of its equivalent diameter Dagg is known as Sagg1, as expressed by Equation (11).
The proportion of area to all minor caps SA,cap can be calculated by substituting Equations (8c)–(11) into Equation (7), as shown by Equation (12). Then, the planar tortuosity τp,m of MPPS is established by substituting Equations (6) and (12) into Equation (5), as indicated in Equation (13).
S A , c a p m = N A , m S c a p = 6 B 1 V V , g π D a g g 2 P a v e S a g g 1 D a g g 2 = 6 B 1 V V , g P a v e S a g g 1 π
τ p , m = 1 V V , g + 6 B 1 V V , g P a v e S a g g 1 π
where VV,g is the volume fraction of the ovoid particle; B1 is the proportion of the particle caliper diameter to the equivalent diameter Dagg; Pave is the average particle crown area parameter; Sagg1 is the proportion of the particle surface area Sagg to its equivalent diameter Dagg squared.
To obtain planar tortuosity τp,m, as indicated by Equation (13), establishing the average particle crown area parameter Pave is essential. Therefore, in this work, an SCSM is applied to obtain the average value of the overlap area of the fluid with all particles <Scap> and the average particle crown area parameter Pave.
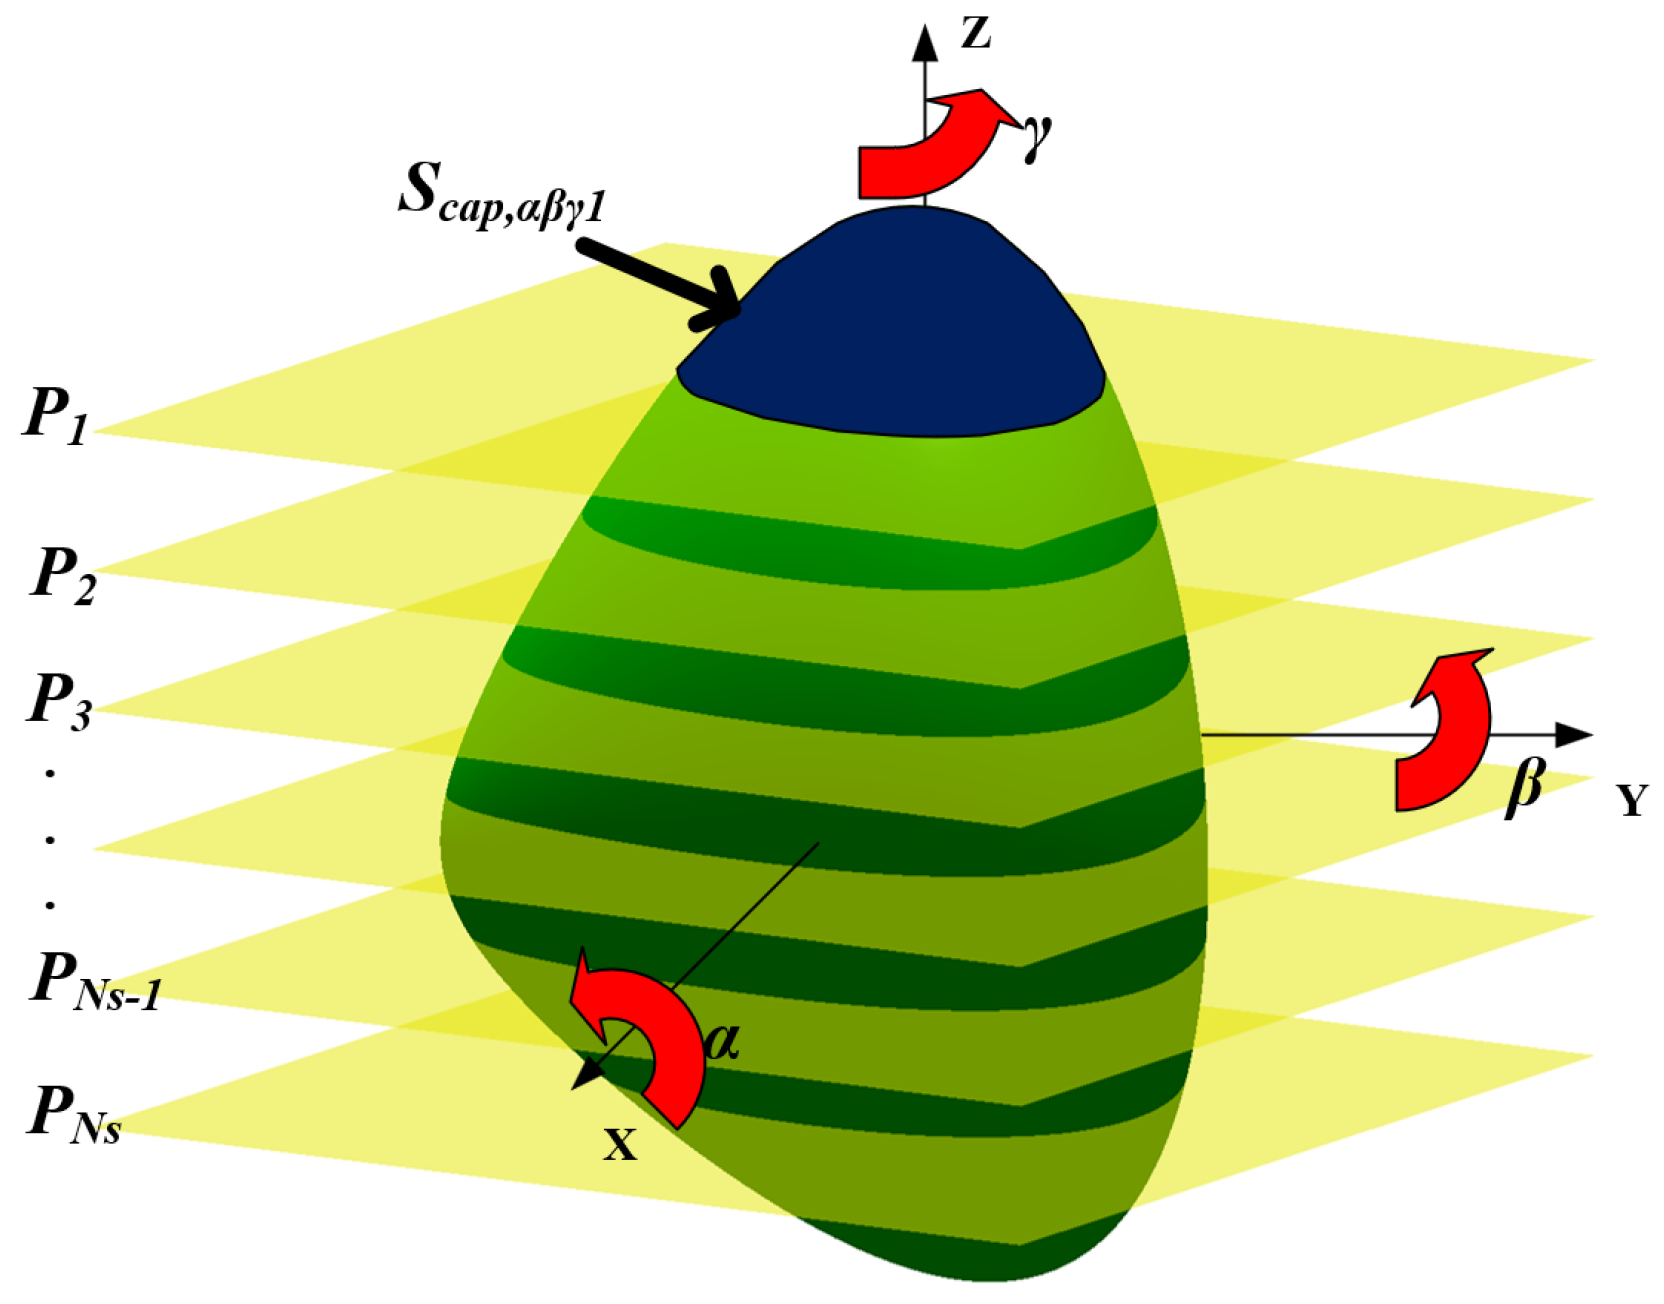
To calculate the average value of the overlap surface area of the fluid with all particles <Scap>, it is necessary to take into account all potential position correlations between the section plane and particle, as displayed in Figure 2. The method accounts for the surface area of the particle in contact with the external medium Scap,i and takes a range of parallel planes Pi to represent the possible positional relationships and profiles between particles, when angles of rotation α, β and γ are given. We average all values of Scap,i, as expressed in Equation (14). The accuracy of <Scap> is affected by the quantity of cross sections Ns and the intervals of rotation ∆α, ∆β and ∆γ.
S c a p = Δ α + 1 Δ β + 1 Δ γ + 1 S c a p , α β γ i 8 π 3 N s
where the options α, β, γ are the rotations corresponding to the x, y and z axes, respectively; Ns denotes the quantity of cross-section planes in a particular orientation.; ∆α, ∆β and ∆γ are distances between two neighboring orientations (rad).
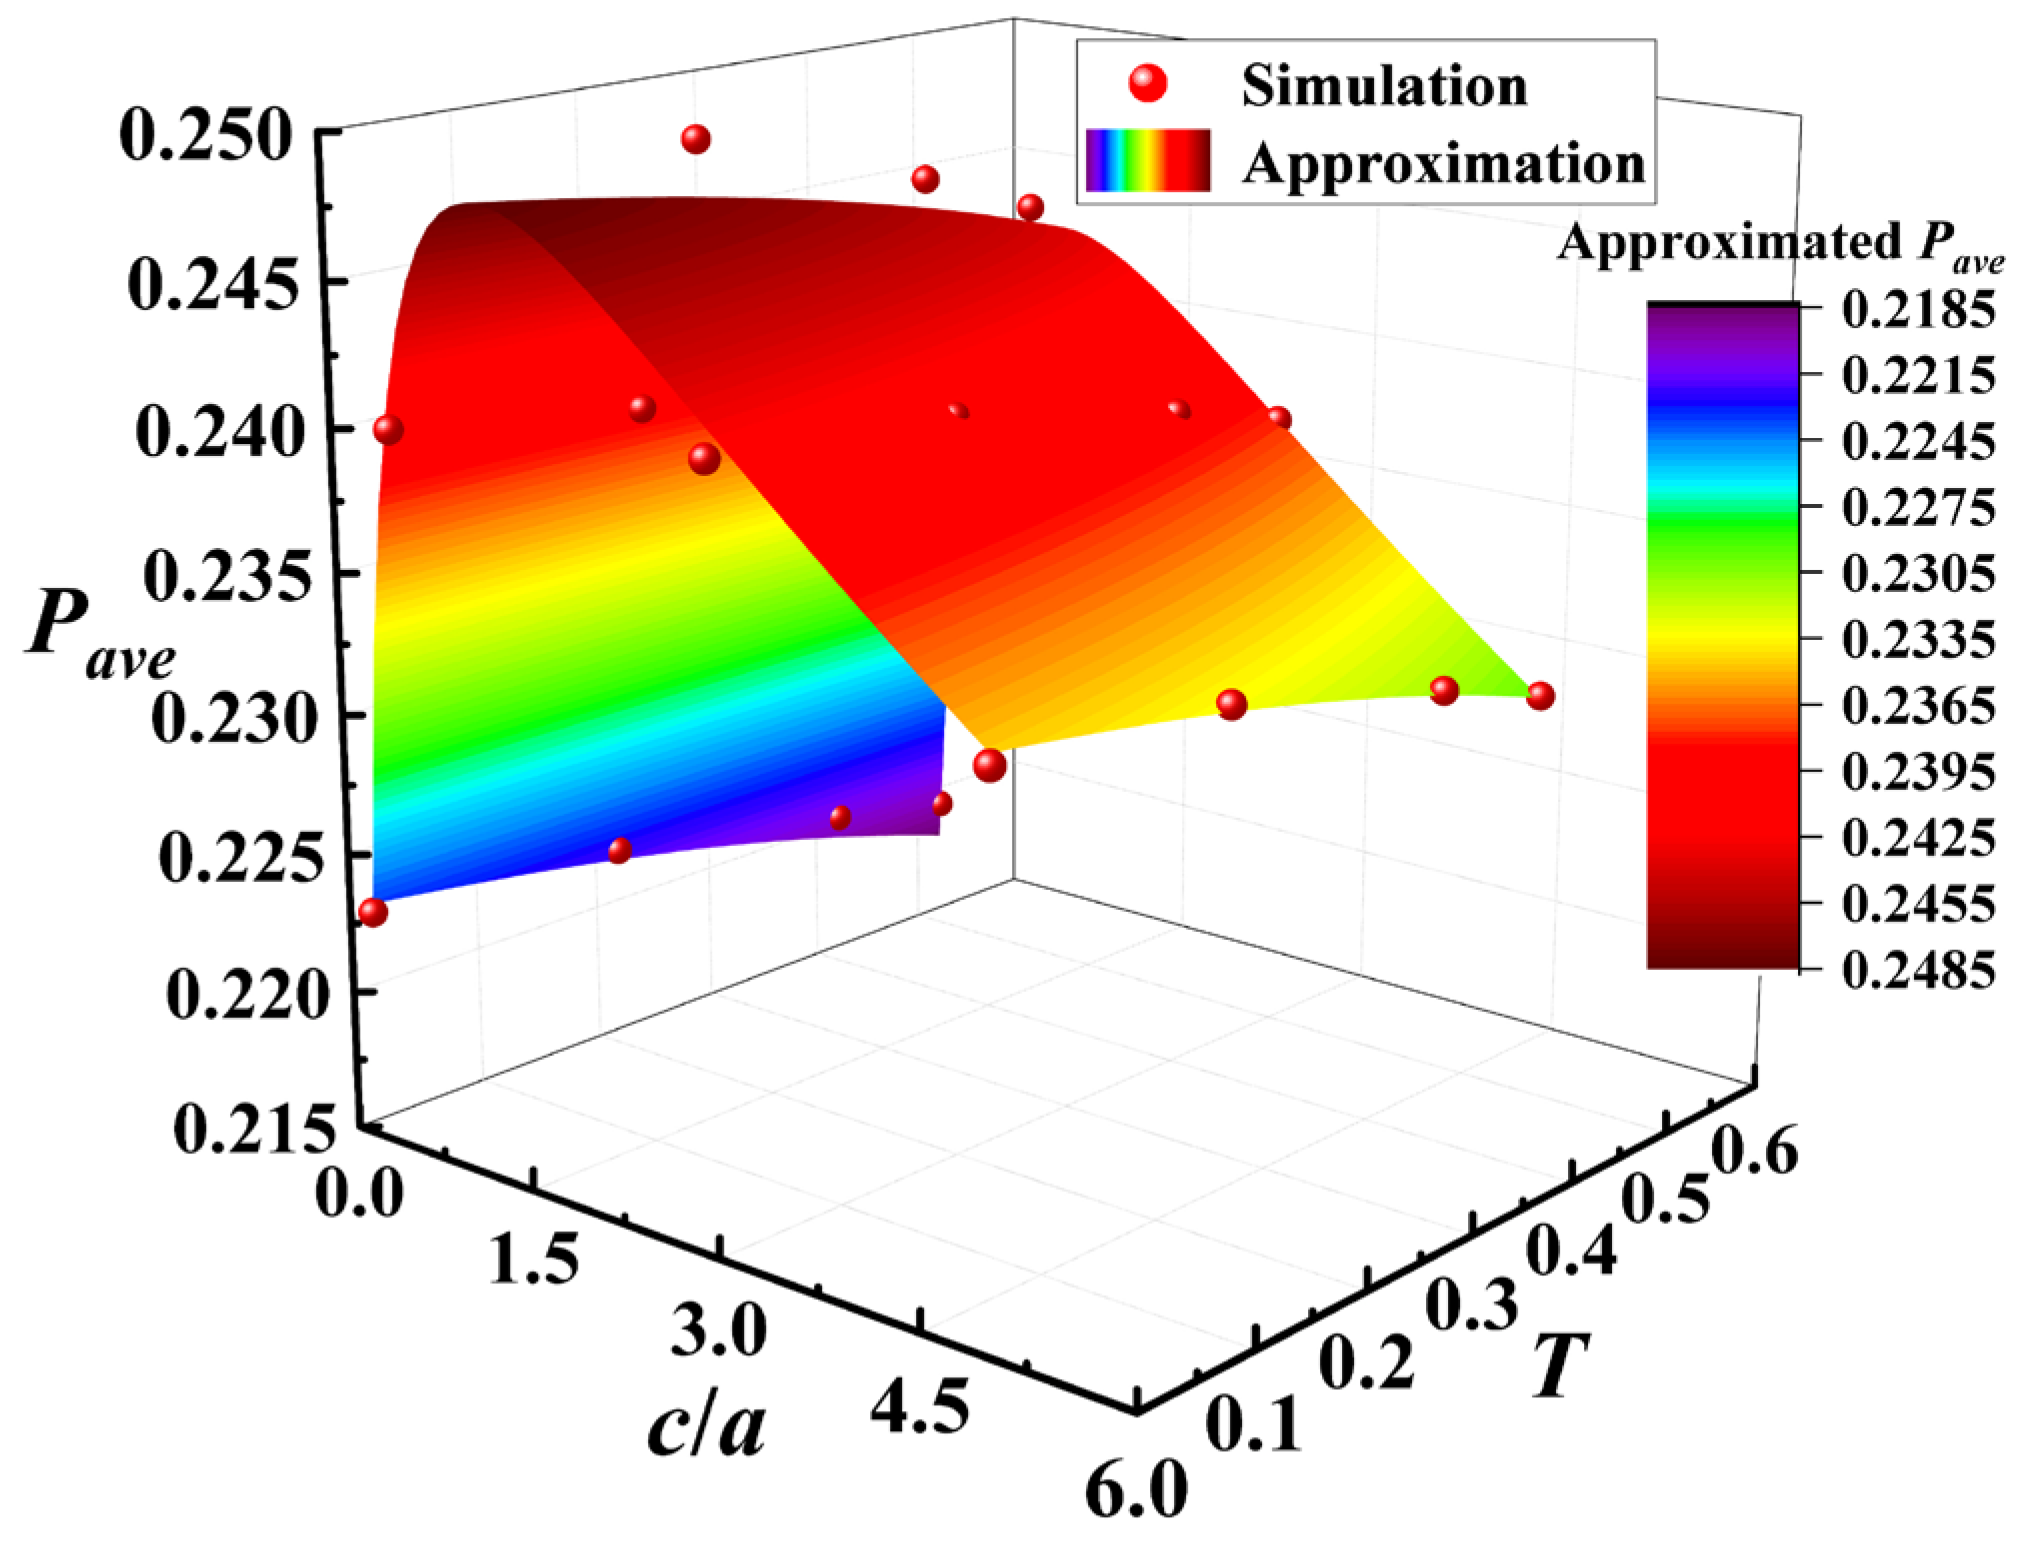
Through the previously mentioned SCSM, Figure 3 shows how the average particle crown area parameter Pave varies for various aspect ratios c/a and tapering parameter T. Findings indicate that when the tapering parameter T increases, Pave falls. For a given T, as the aspect ratio c/a grows, Pave first rises and then falls, and Pave reaches its maximum at c/a = 1.0. Nonetheless, the SCSM’s computation of Pave requires a lot more time. Therefore, in order to facilitate practical application, an approximation formula is developed, as provided by Equation (15). Here, the approximation formula exhibits excellent consistency with the numerical simulation data, achieving a high coefficient of determination R2 = 0.973. Moreover, the planar tortuosity τp can be obtained by replacing the fitted average particle crown area parameter Pave from Equation (15) into Equation (13), as indicated in Equation (16).
P a v e = a 1 ln a 2 ( 1 + c / a ) + a 3 exp 2 ( T ) + a 4 ln ( 1 + c / a ) + a 5
where a1~a5 are fitting parameters, which can be found in Table 1.
τ p , m = 1 V V , g + 6 B 1 V V , g ( a 1 ln a 2 ( 1 + c / a ) + a 3 exp ( 2 T ) + a 4 ln ( 1 + c / a ) + a 5 ) S a g g 1 π

2.2. Poly-Sized Ovoid Particle Packing System (PPPS)

Similar to MPPS, according to Equation (8), NA,p(Dagg) is the number of ovoid particles with equivalent diameter Dagg per unit area intercepted by the cross section intercepted for PPPS, and NV,p(Dagg) is the number of ovoid particles with equivalent diameter Dagg per unit volume of container intercepted by the cross section intercepted for PPPS, as shown in Equation (17). NV,p(Dagg) and the probability density function of the volume-based size distribution fV,size(Dagg) are related, as demonstrated by Formula (18). In addition to fV,size(Dagg), the probability density function of the number-based size distribution fN,size(Dagg) is also used in theoretical and numerical calculations. The numerical correlation between fV,size(Dagg) and fN,size(Dagg) is expressed by Equation (19). The relationship between NA,p(Dagg) and the probability density function of number-based fN,size(Dagg) is established by substituting Equations (18) and (19) into Equation (17), as expressed in Equation (20).
N A , p ( D a g g ) = D a g g N V , p ( D a g g )
N V , p ( D a g g ) = B 1 V V , g f V , s i z e ( D a g g ) d D a g g V a g g 1 D a g g 3
f V , s i z e ( D a g g ) d D a g g = V a g g 1 D a g g 3 f N , s i z e ( D a g g ) d D a g g D a g g , min D a g g , max f N , s i z e ( D a g g ) V a g g 1 D a g g 3 d D a g g
N A , p ( D a g g ) = B 1 V V , g D a g g f N , s i z e ( D a g g ) d D a g g D a g g , min D a g g , max f N , s i z e ( D a g g ) V a g g 1 D a g g 3 d D a g g
where NA,p(Dagg) is the number of ovoid particles with equivalent diameter Dagg per unit area intercepted by the cross section intercepted for PPPS; fV,size(Dagg) is the probability density function of the volume-based size distribution; fN,size(Dagg) is the probability density function of the number-based particle size distribution; B1 is the proportion of the particle caliper diameter to the equivalent diameter Dagg.
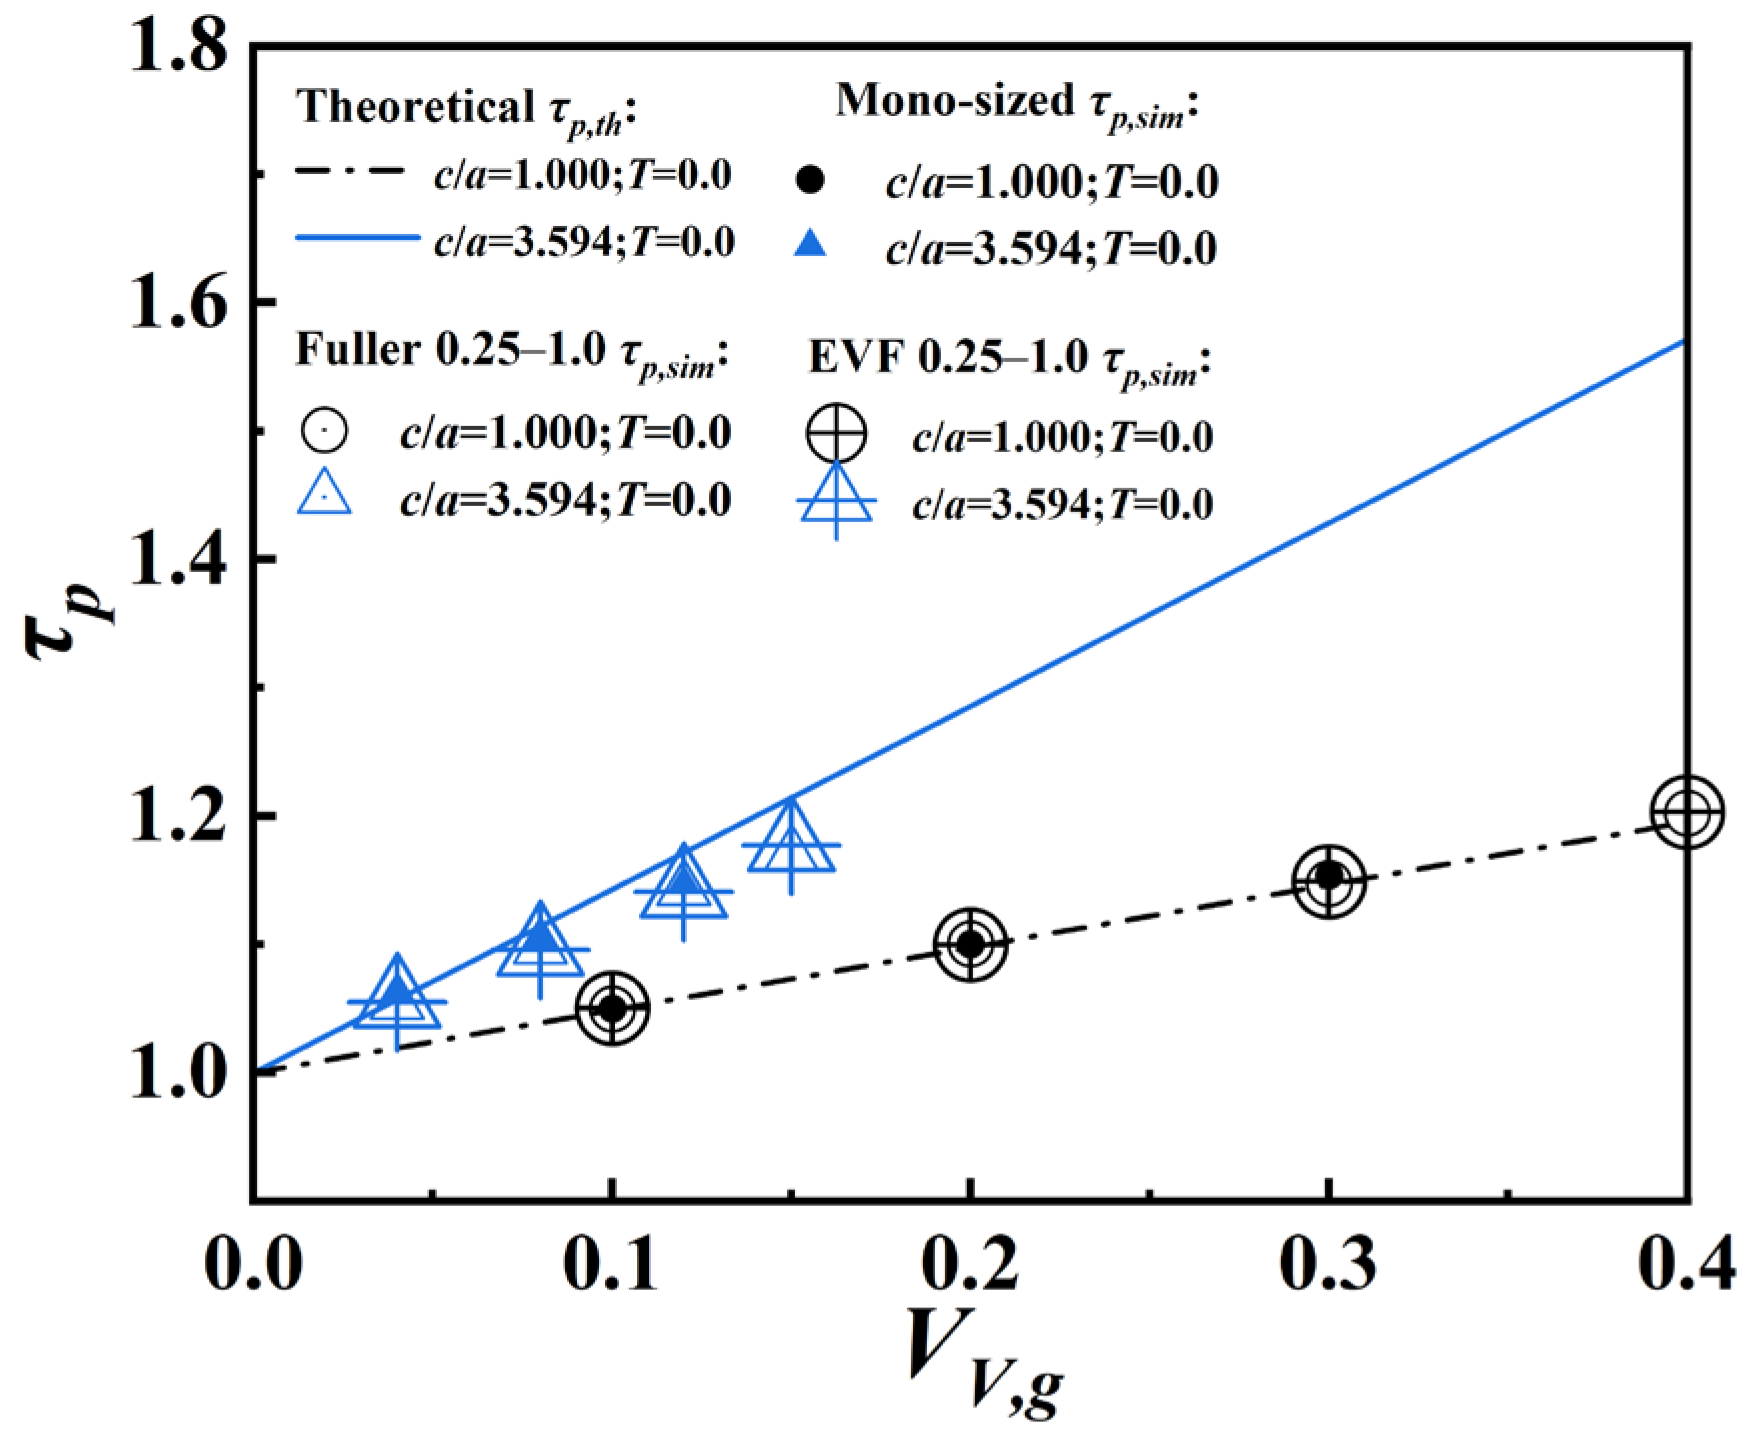
The area fraction of all smaller caps for the PPPS SA,capp is the integration of the multiplication of NA,p(Dagg) and <Scap(Dagg)>, as expressed by Equation (21), and can be obtained by substituting <Scap> in Equation (10) and NA,p(Dagg) in Equation (20) into Equation (21), as indicated in Equation (22). Substituting AA,ip in Equation (6) and SA,capp in Equation (22) into Equation (5), the planar tortuosity τp,p of PPPS can be calculated, as indicated in Equation (23a). It can be revealed that the planar tortuosity τp is irrelevant to the particle size distribution. To verify the reliability of the tortuosity theory, Figure 4 presents a comparison between the numerical data from Li et al. [32] and the theoretical tortuosity τp derived from Equation (23a). For analyzing the size distribution of the particles, the Fuller function as stated in Equation (23b) and the Equivalent Volume Function as displayed in Equation (23c) are used. Figure 4 presents consistent agreement between the theoretical tortuosity τp and numerical simulation data, the coefficient of determination for particles c/a = 1.000, T = 0.0 is R2 = 0.9954 and for c/a = 3.594, T = 0.0 is R2 = 0.6811. The proposed tortuosity model exhibits nearly perfect consistency with the data for near-spherical ovoids, while its predictive capacity deteriorates significantly for elongated particles. The weak fitting degree for elongated ovoids arises from narrow constricted pore throats and abundant stagnant flow regions generated by slender particle random packing, which break the stereological geometric assumptions underpinning our planar tortuosity derivation. Moreover, Figure 4 suggests that the tortuosity τp,m value of MPPS is similar to those τp,p of PPPS, which demonstrates that the planar tortuosity is irrelevant to the particle size distribution.
S A , c a p p = D a g g , min D a g g , max N A , p ( D a g g ) S c a p ( D a g g ) d D a g g
S A , c a p p = D a g g , min D a g g , max B 1 V V , g P a v e S a g g 1 D a g g 3 f N , s i z e ( D a g g ) D a g g , min D a g g , max f N , s i z e ( D a g g ) V a g g 1 D a g g 3 d D a g g d D a g g = 6 B 1 V V , g P a v e S a g g 1 π
τ p , p = 1 V V , g + 6 B 1 V V , g P a v e S a g g 1 π
f N , s i z e F u l l e r ( D a g g ) = 5 D a g g 3.5 2 ( D a g g , min 2.5 D a g g , max 2.5 )
f N , s i z e E V F ( D a g g ) = 3 D a g g 4 ( D a g g , min 3 D a g g , max 3 )
where SA,capp is the area fraction of all small caps for PPPS; Pave is the average particle crown area parameter; Sagg1 is the particle surface area Sagg divided by the square of its equivalent diameter Dagg; τp,p is the planar tortuosity for PPPS.
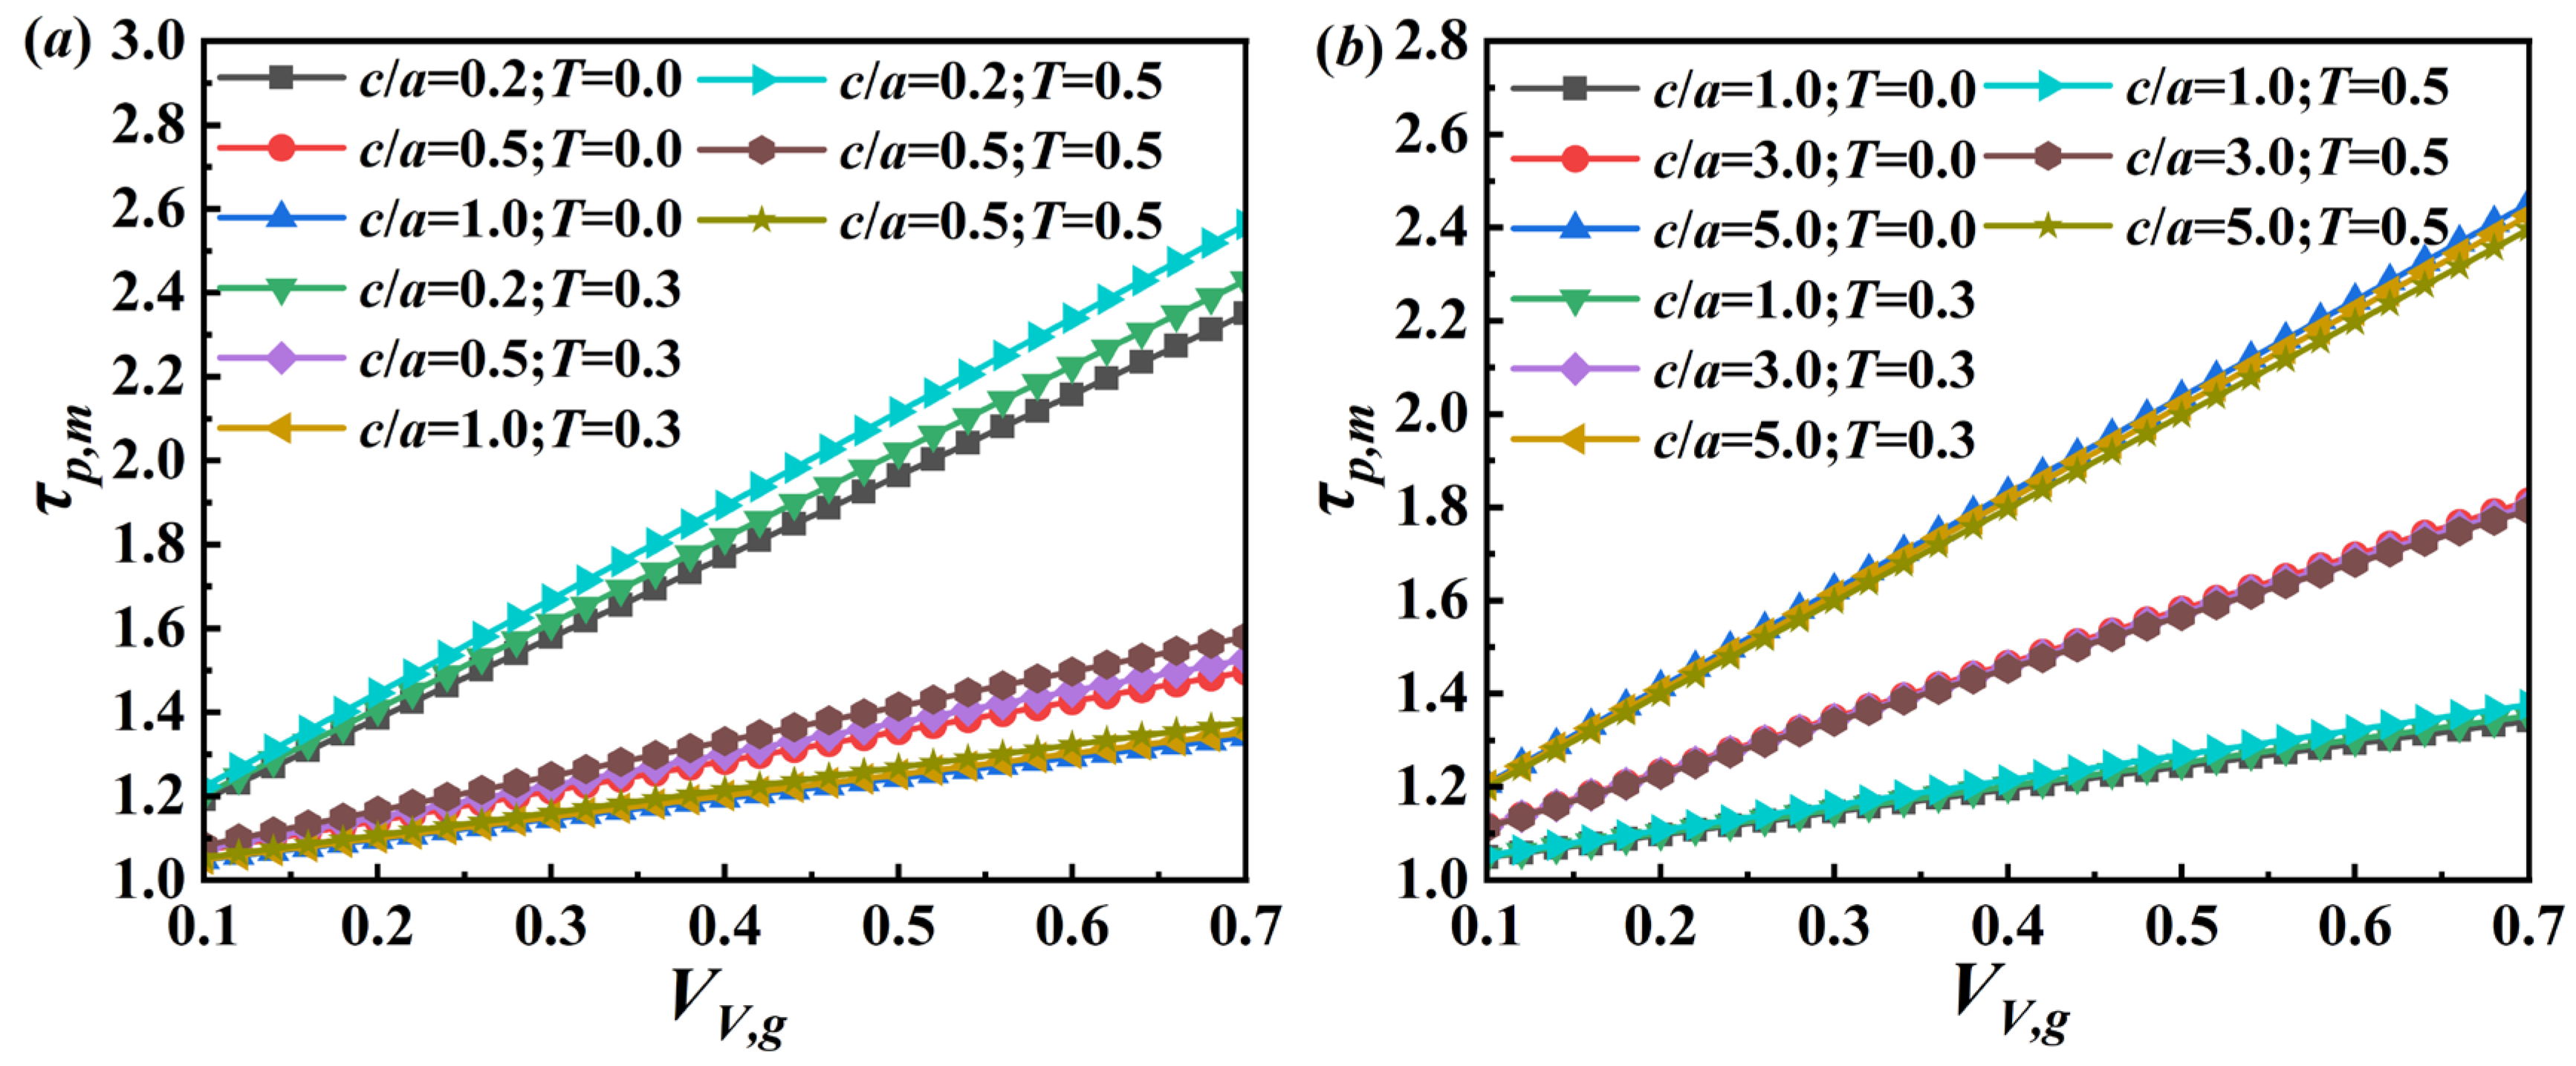
Considering the previously mentioned theoretical model of planar tortuosity, Figure 5 shows how the tortuosity–volume fraction curves vary with the aspect ratio c/a and tapering parameter T. The results demonstrate that when the volume fraction rises, the tortuosity increases. When tapering parameter T and the volume fraction are given, with an aspect ratio of c/a greater than 1.0, the tortuosity τp,m of the particle packing system grows; when the particle aspect ratio c/a is less than 1.0, the tortuosity τp,m of the particle packing system falls as c/a increases, and the tortuosity τp,m of c/a = 1.0 and T = 0.0 has minimal value.

3. The Effect of Ovoid Particle Composition on the K-C Formula

To investigate how the permeability k of the particle packing system is affected by the particle’s volume fraction and shape, the lattice Boltzmann method (LBM) is employed. The LBM simulates the fluid flow in granular media and can be applied for the solution of the permeability k by discretizing complicated particles into simple lattices. Moreover, it should be noted that τp is planar geometrical tortuosity, which differs distinctly from hydraulic tortuosity. Planar tortuosity is quantified based on the stereological area ratio of pore cross sections and characterizes the geometric feature of pore networks from a sectional perspective. Hydraulic tortuosity, by contrast, describes the winding length of actual fluid streamlines and is calculated from flow velocity fields. These two parameters correspond to different physical characterization dimensions of porous media pore structures.

3.1. The Lattice Boltzmann Method

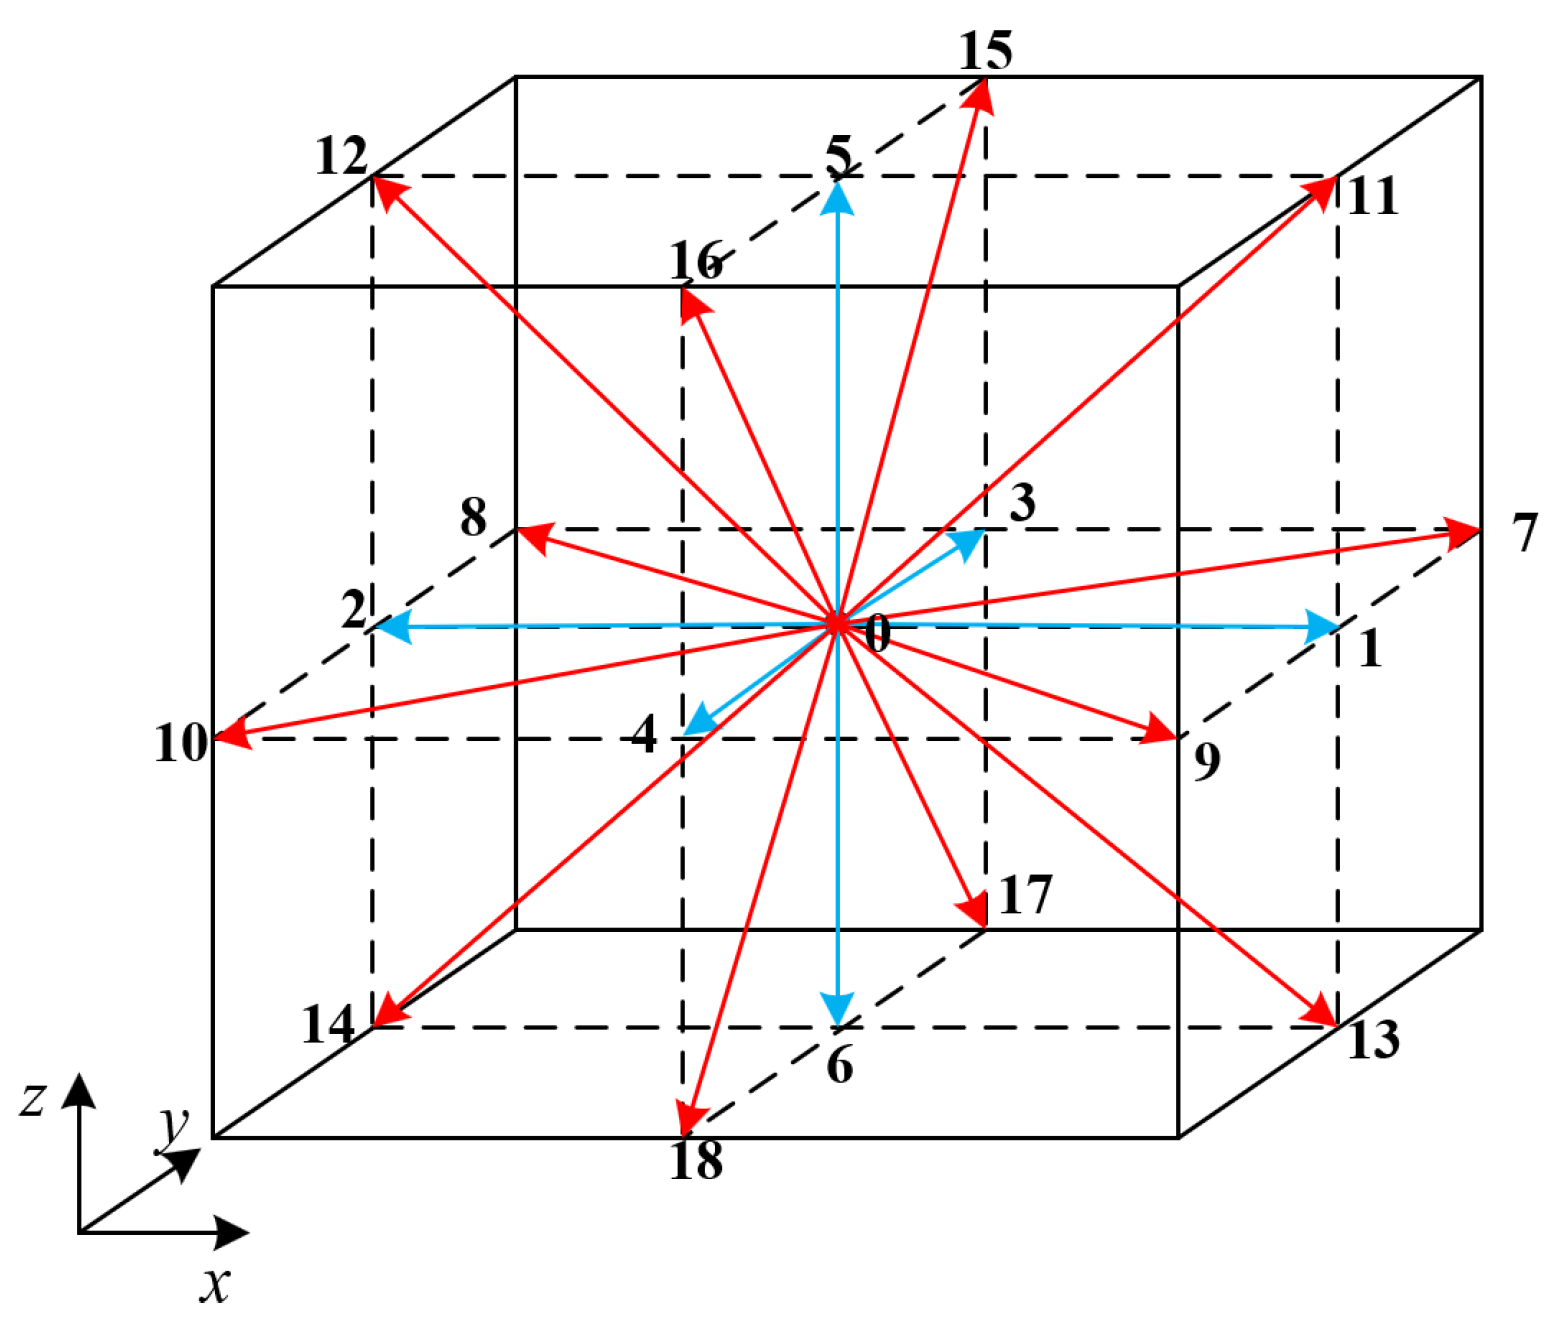
As shown in Figure 6, the particles in this work are discretized using a three-dimensional D3Q19 lattice with 19 velocities. Under the LBM condition, the collision propagation formula is formulated as Equation (24a).
f α x + e α Δ t , t + Δ t = f α x , t 1 τ r e l f α x , t f α e q x , t
where fα(x,t) is the particle probability distribution function with speed eα at point x and time t; eα represents the microscopic speed vector that corresponds to allowable directions on the lattice, as given by Equation (24b). The number of allowable speed directions is denoted by the subscript α. According to Equation (24c), τrel represents the dimensionless relaxation time; fαeq(x,t) is the equilibrium particle probability distribution function, as displayed in Equation (24d).
e α = 0 1 1 0 0 0 0 1 1 1 1 1 1 1 1 0 0 0 1 0 0 0 1 1 0 0 1 1 1 1 0 0 0 0 1 1 1 1 0 0 0 0 0 1 1 0 0 0 0 1 1 1 1 1 1 1 1
τ r e l = k v δ t c s 2 + 1 2
f α e q ( x , t ) = ρ w α 1 + e α u c s 2 + ( e α u ) 2 2 c s 4 u 2 2 c s 2
where the density of the fluid, represented by ρ (mu/lu3), can be determined by Equation (25a); kv represents the flow’s kinetic viscosity (lu2/ts), and with a value of 1/6, it causes the relaxed time τrel = 1; cs is the lattice rate of sound (lu/ts), which has the value (1/3)1/2 (∆x/δt) [33]; δt is the time step (ts), and δt = 1 ts; w means the weight factor (w0 = 1/3 for α = 0; w0 = 1/18 for α = 1~6; w0 = 1/36 for α = 7~18); u is the speed (lu/ts), which is calculated using Equation (25b).
ρ = ρ x , t = α f α x , t
u = u x , t = 1 ρ α f α e α
To investigate the particle permeability in this work, three different border conditions (i.e., the input/output pressure border condition, the half-way bounce-back border condition and the periodic border condition) are adopted. Firstly, the input and output pressure border conditions are subject to the non-equilibrium bounce-back rule. [34]. If the input and output borders are perpendicular to the x-direction, and both the output density (ρout) and the input density (ρin) are fixed, following the transmission process, the components of the distribution function at the input border (i.e., f1, f7, f9, f11, f13) or output border (i.e., f2, f8, f10, f12, f14) are uncertain. From the remaining previously identified components, the unidentified components can be achieved, as shown in Equations (26) and (27). Afterwards, in order to identify the unidentified components of the particle distribution functions of the nodes of opposite borders from the known components, the periodic boundary condition is immediately applied to the remaining box edges. Under the circumstances, the function components that leave one border will travel straight to the contrary border. In addition, when dealing with the flow–solid boundary, the half-way bounce-back border rule is used in this work. It is presumed that a solid wall is situated halfway between the fluid and solid nodes in this instance. The distribution functions scatter from the adjacent rigid nodes where the fluid is flowing back to the flow node along the direction of movement.
In the input border (i.e., left border):
u x , i n = 1 1 ρ i n f 3 + f 4 + f 5 + f 6 + f 15 + f 16 + f 17 + f 18 + f 0 + 2 f 2 + f 8 + f 10 + f 12 + f 14
f 1 = f 2 + 1 3 ρ i n u x , i n
f 7 = f 10 + 1 6 ρ i n u x , i n 1 2 f 3 + f 15 + f 17 f 4 + f 16 + f 18
f 9 = f 8 + 1 6 ρ i n u x , i n 1 2 f 3 + f 15 + f 17 f 4 + f 16 + f 18
f 11 = f 14 + 1 6 ρ i n u x , i n 1 2 f 5 + f 15 + f 16 f 6 + f 17 + f 18
f 13 = f 12 + 1 6 ρ i n u x , i n 1 2 f 5 + f 15 + f 16 f 6 + f 17 + f 18
p i n = c s 2 ρ i n = 1 3 ρ i n
In the output border (i.e., right border):
u x , o u t = 1 + 1 ρ o u t f 3 + f 4 + f 5 + f 6 + f 15 + f 16 + f 17 + f 18 + f 0 + 2 f 1 + f 7 + f 9 + f 11 + f 13
f 2 = f 1 1 3 ρ o u t u x , o u t
f 8 = f 9 1 6 ρ o u t u x , o u t 1 2 f 3 + f 15 + f 17 f 4 + f 16 + f 18
f 10 = f 7 1 6 ρ o u t u x , o u t 1 2 f 3 + f 15 + f 17 f 4 + f 16 + f 18
f 12 = f 13 1 6 ρ o u t u x , o u t 1 2 f 5 + f 15 + f 16 f 6 + f 17 + f 18
f 14 = f 11 1 6 ρ o u t u x , o u t 1 2 f 5 + f 15 + f 16 f 6 + f 17 + f 18
ρ o u t = c s 2 ρ o u t = 1 3 ρ o u t
To simulate fluid flow, there is a pressure difference (i.e., x-direction) at the sample input and outflow in the LBM simulation. The nodes on the opposite side of the border are regarded as neighbors, and the other sides are regarded as periodic borders. For the flow–solid interface, the half-way bounce-back borders were applied. Equation (28) provides the equilibrium flow standards for speed ux across an entire region. If the aforementioned formula is satisfied, the permeability k will be determined easily. The characteristic permeability of the LBM kLB may be computed by employing Equation (29) provided that the steady-state flow requirement is met, and the value of the pressure variation is oriented in the x-axis. Next, a correspondence between actual mechanical units and LBM units establish the link between the permeability k of the real physical system and the permeability kLB of LBM [33], as indicated in Equation (30).
u x t + δ t u x t 2 u x t + δ t 2 1.0 × 10 5
k L B = k v Δ P u x = k v L 1 P i n P o u t u x
k = k L B L 0 2
where <ux> represents the average speed in the x-axis (lu/ts); L0 represents the size of the mapping between real material units and LBM units (m2/lu2); Pin and Pout represent the pressures at the border of the intake and outflow (mu/(lu*ts2)), respectively; L1 denotes the border’s length of the cubed sample.
All numerical tests adopt a cubic computational domain with uniform side length L = 100 μm, D3Q19 LBM mesh resolution 100 × 100 × 100, and single lattice step Δx = 1 μm. The ovoid geometric variable ranges are as follows: aspect ratio c/a ∈ [0.2,5.0], tapering parameter T ∈ [0,0.5]. For each fixed parameter combination, 10 independent Monte Carlo spatial and rotational random realizations are simulated to calculate the mean values and standard deviation as statistical uncertainty. All packing assemblies strictly prohibit inter-particle overlap, and the sampling workflow contains following fixed steps. Randomly sample mass center coordinates inside the cubic domain for each ovoid particle; conduct uniform Euler angle rotation sampling on x/y/z axes to determine the particle spatial orientation; implement inter-particle surface distance detection; discard and re-sample overlapping coordinate/orientation groups; iterate sampling until the target volume fraction converges with a relative error less than 0.1%.

3.2. Modified K-C Formula

According to Equations (3) and (4), it can be determined that the shape parameter Cf and tortuosity τ have an impact on the K-C constant Ck. Regarding the tortuosity, the influence of particle shape and volume fraction on the planar tortuosity τp are quantitatively characterized in Section 2’s tortuosity theoretical model; however, it is unknown that how these factors affect Cf, which is not beneficial for the performance of the K-C formula. In order to derive Ck, the permeability k from LBM is first inserted into Equation (31). Substituting the K-C constant Ck and the planar tortuosity τp by the theoretical model into Equation (32) obtains shape parameter Cf.
C k = 1 V V , g 3 k S V , g 2 V V , g 2
C f = C k τ p 2
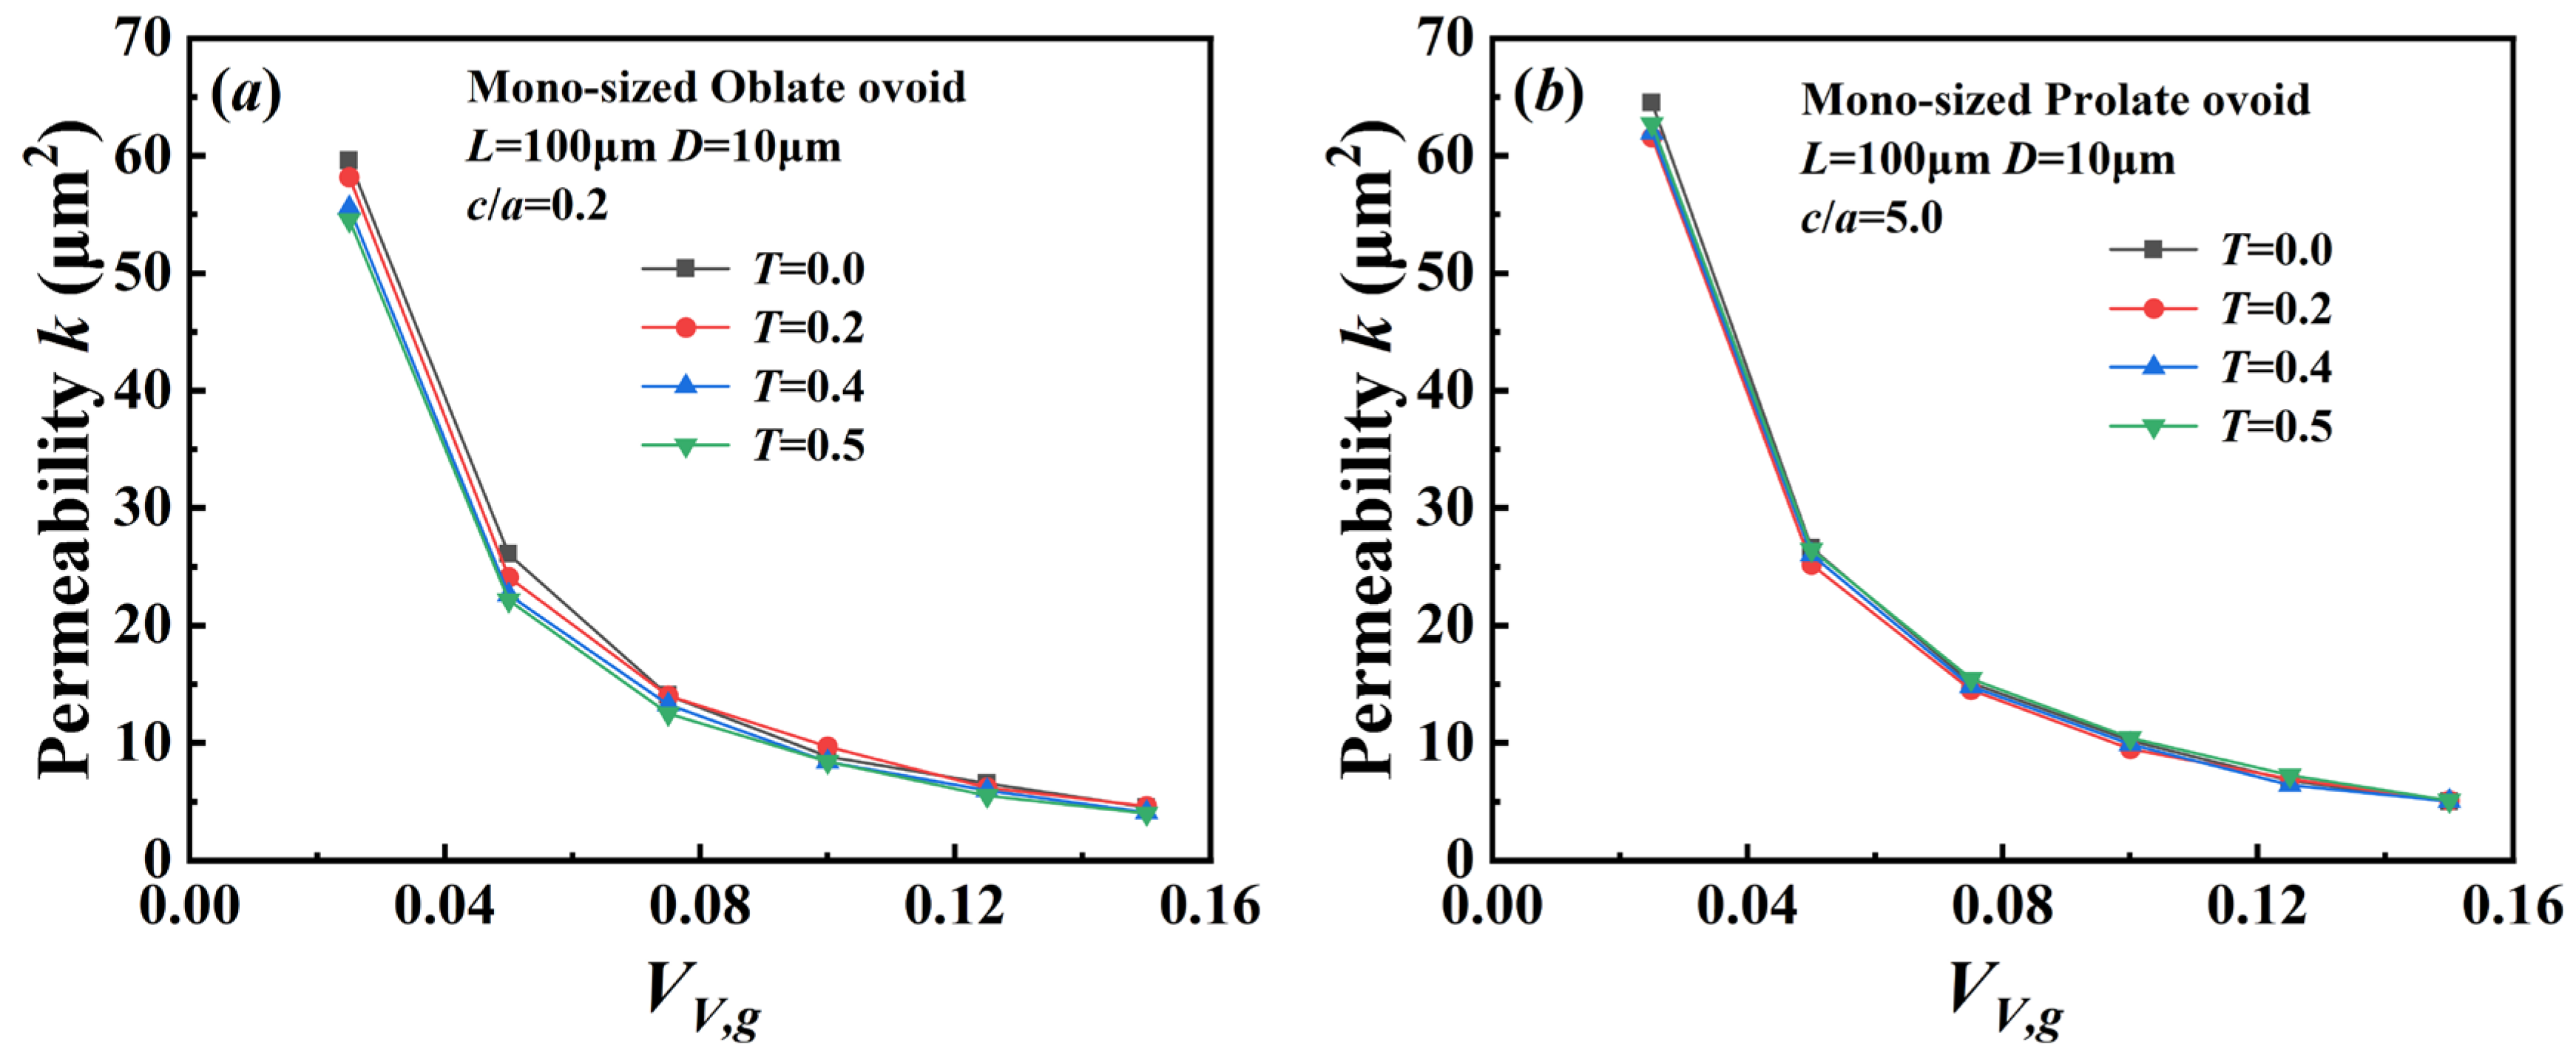
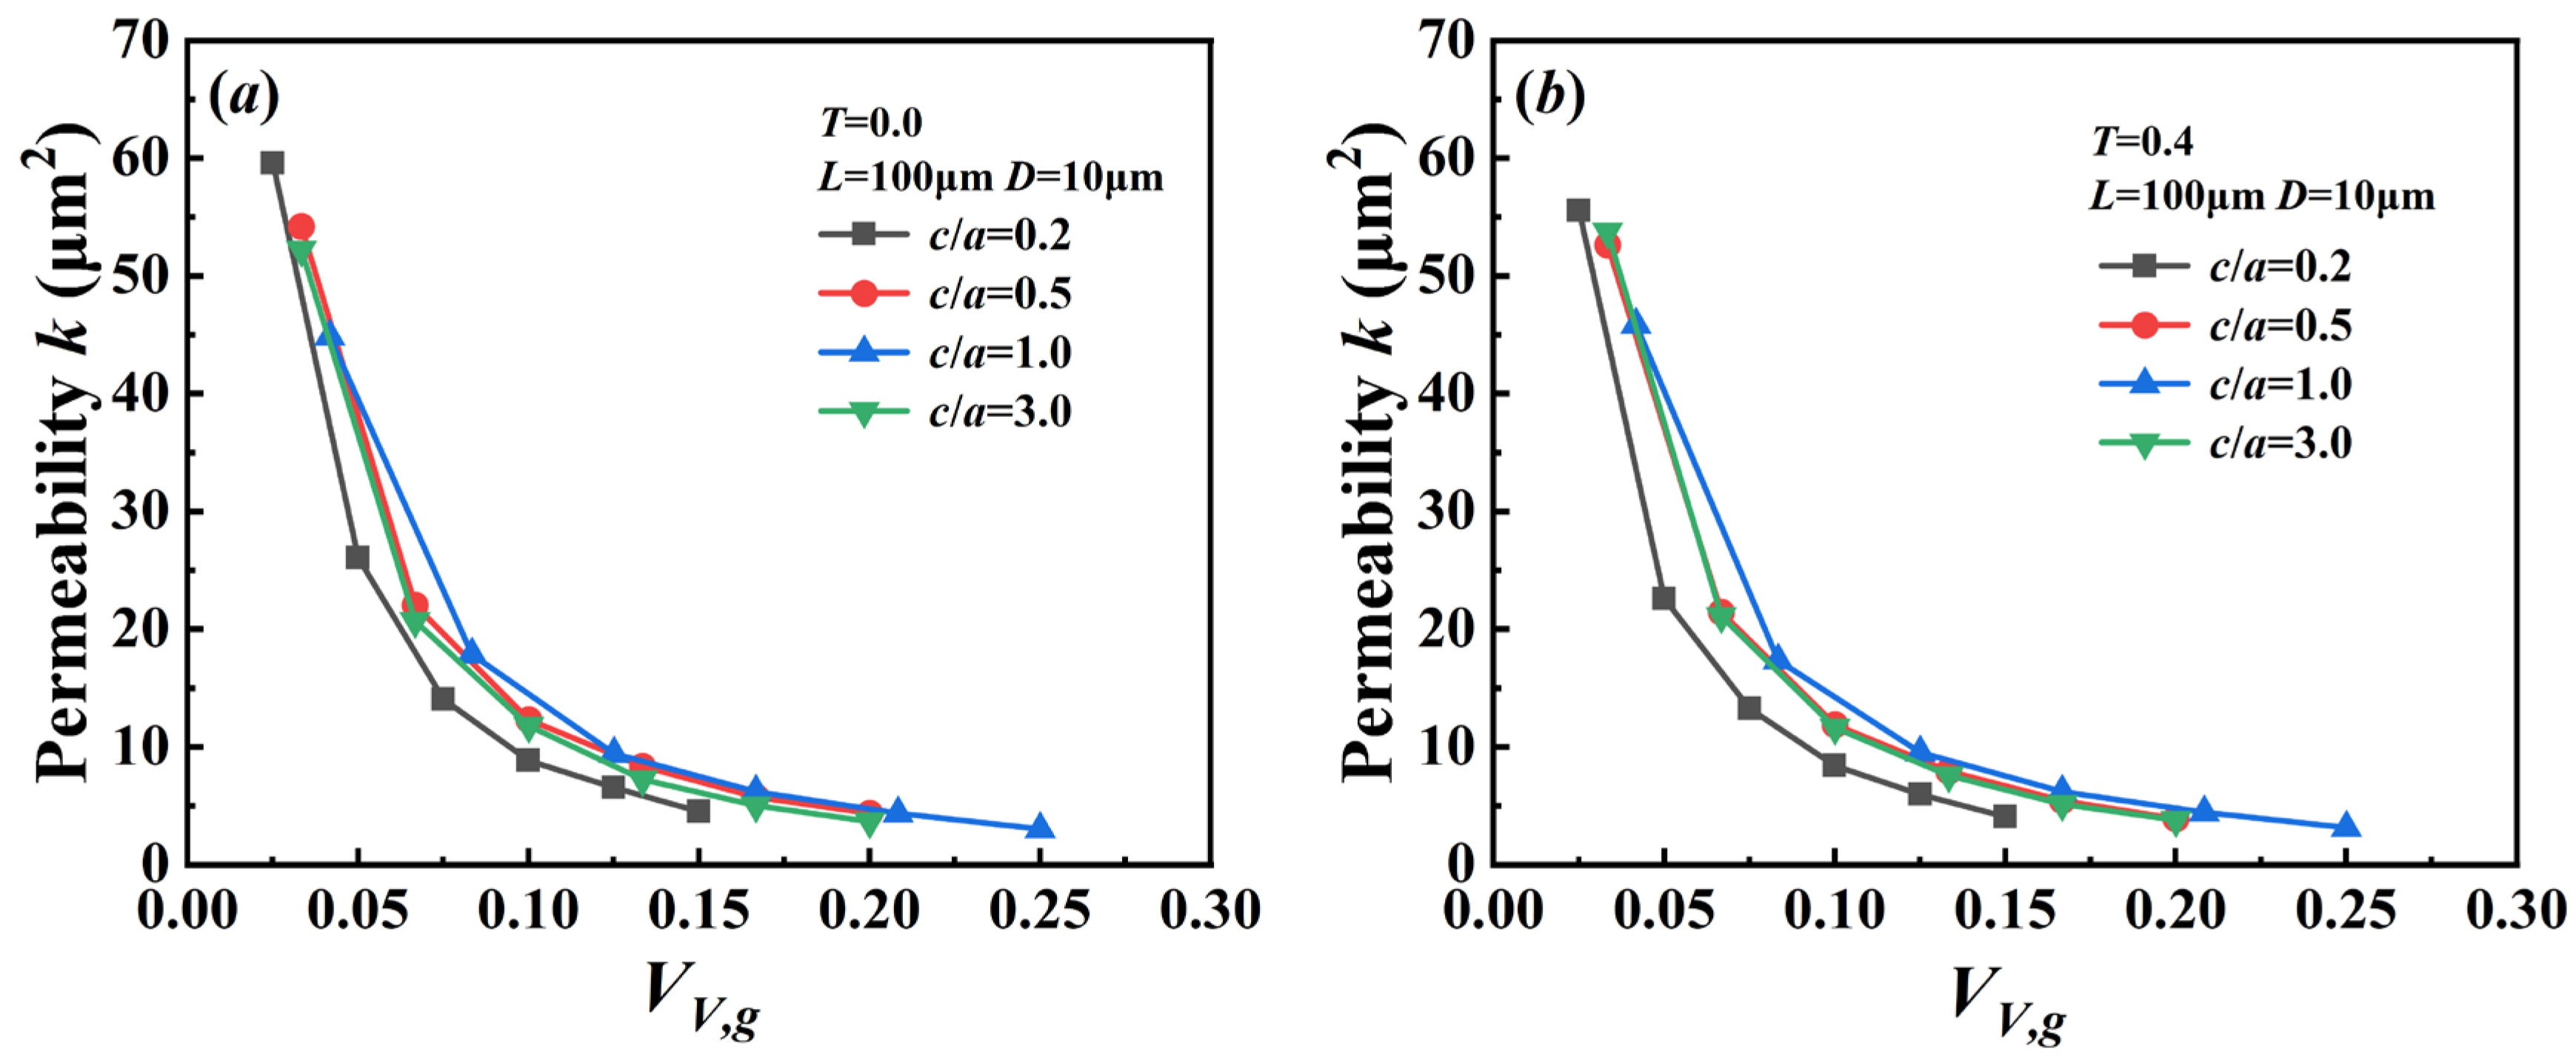
We explore how the volume fraction and shape of the ovoidal particles affect shape parameter Cf and the permeability k of the porous composites. We also investigate the effect of the ovoidal particle shape and volume fraction on the permeability k and the shape parameter Cf of the porous composites. The permeability k of the particle packing system was obtained according to the LBM model as shown in Figure 7 and Figure 8. The permeability k is observed to decrease as the volume fraction increases. Given the tapering parameter T and volume fraction VV,g, the permeability k first rises and subsequently falls as the aspect ratio c/a increases, with the aspect ratio c/a = 1.0, the maximum permeability is achieved.
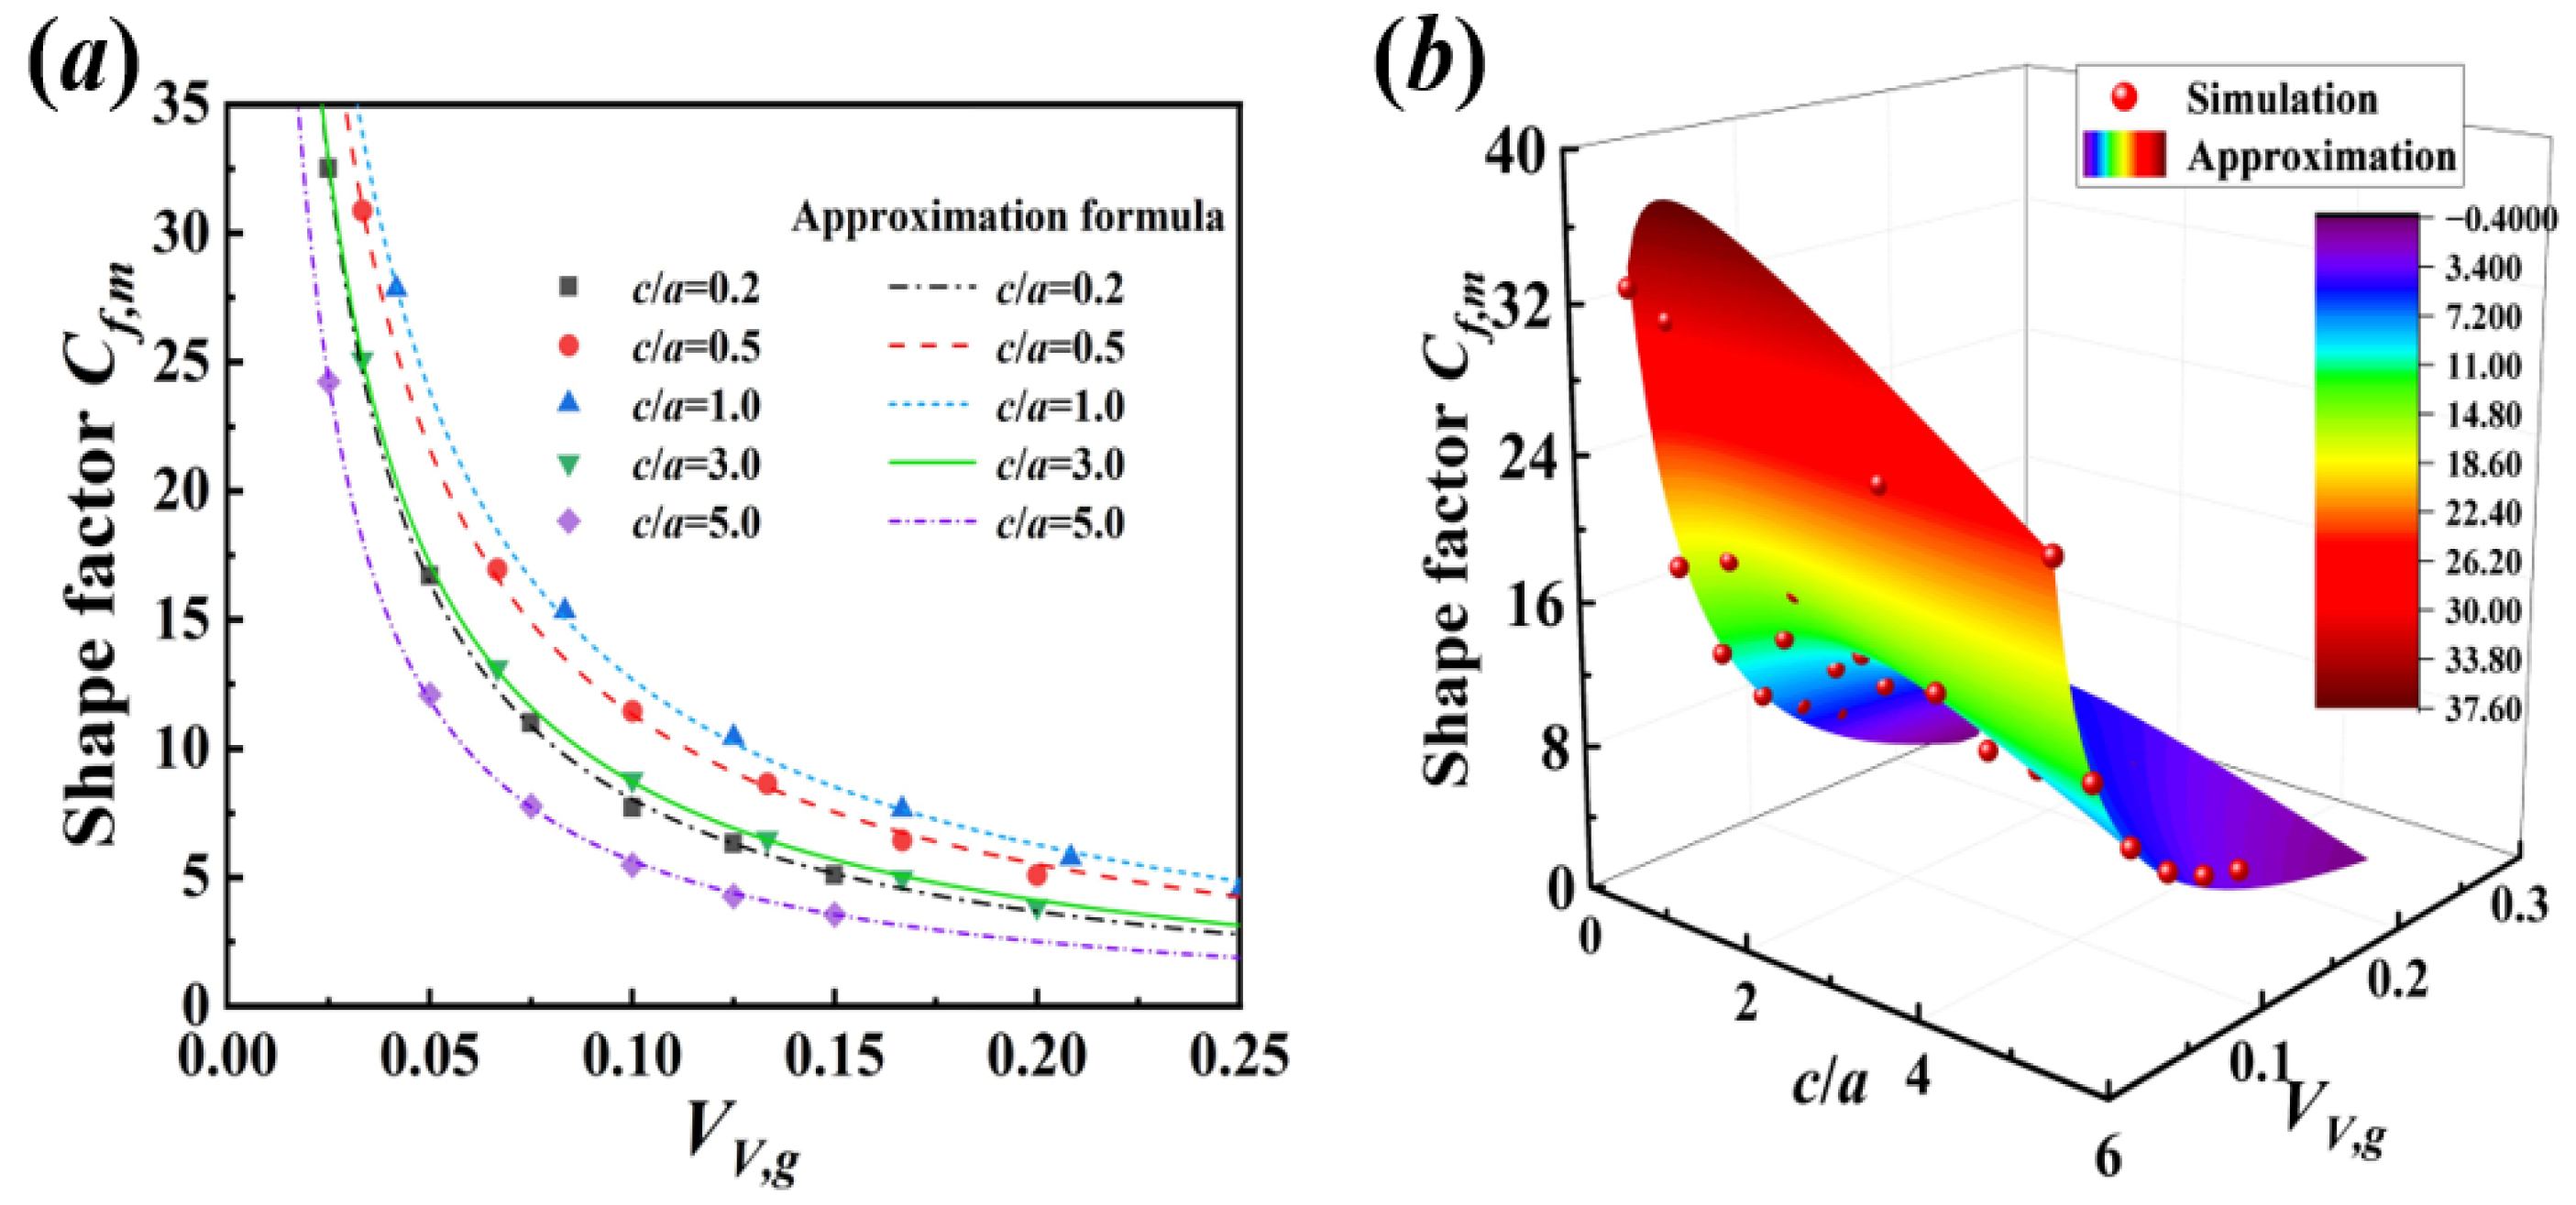
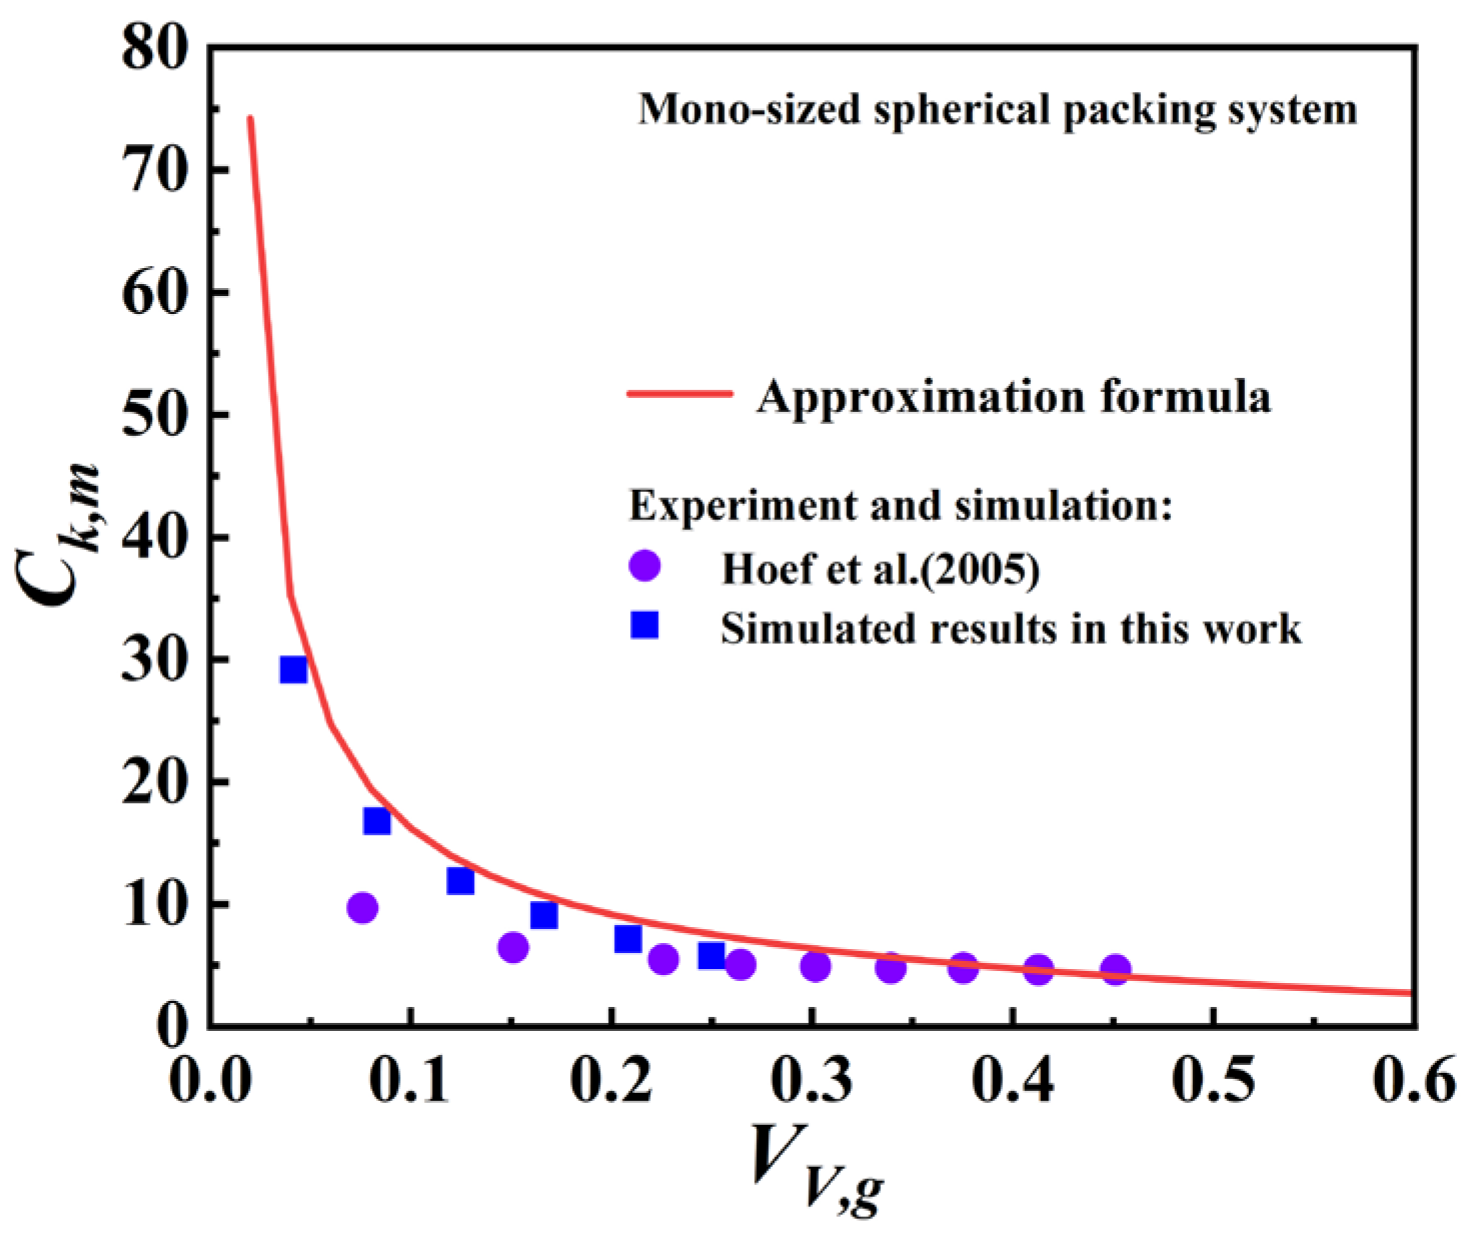
By substituting the permeability k from Figure 8 into Equations (31) and (32), the shape parameter Cf was obtained. Figure 9 indicates the variation in the shape parameter Cf,m with the volume fraction VV,g in the MPPS, and the results show that the shape parameter Cf,m is not constant and instead declines as the particle volume fraction VV,g increases. An approximate formula is proposed in this work, as shown in Equation (33), which can characterize quantitatively the influence of the aspect ratio c/a and volume fraction VV,g of the ovoid particles on the shape parameter Cf. Figure 9 compares the shape parameters Cf,m obtained from the fitted formulation and the simulation; the fitted expression of Cf achieves a determination coefficient R2 = 0.9872, which shows good agreement between both values. Then, the K-C formula constants Ck,m for mono-sized particles can be found by substituting the tortuosity τp from Equation (13) and the shape parameter Cf obtained in Equation (33) into Equation (4). To confirm the credibility of the obtained approximation of Ck,m, Figure 10 compares the approximated Ck,m derived in Equations (4), (14) and (33) with the simulated Ck,m in this work and preceding investigations [35,36]. The results demonstrate that the approximation of Ck,m agrees well with the simulation results, which confirms the reliability of the formulation proposed in this paper for the calculation of the K-C formula constant Ck,m.
C f , m = 3.41 ( c / a ) 0.65 + 4.55 V V , g 0.63 1.06 ( c / a ) V V , g 0.33
where Cf,m is the shape parameter of the MPPS.
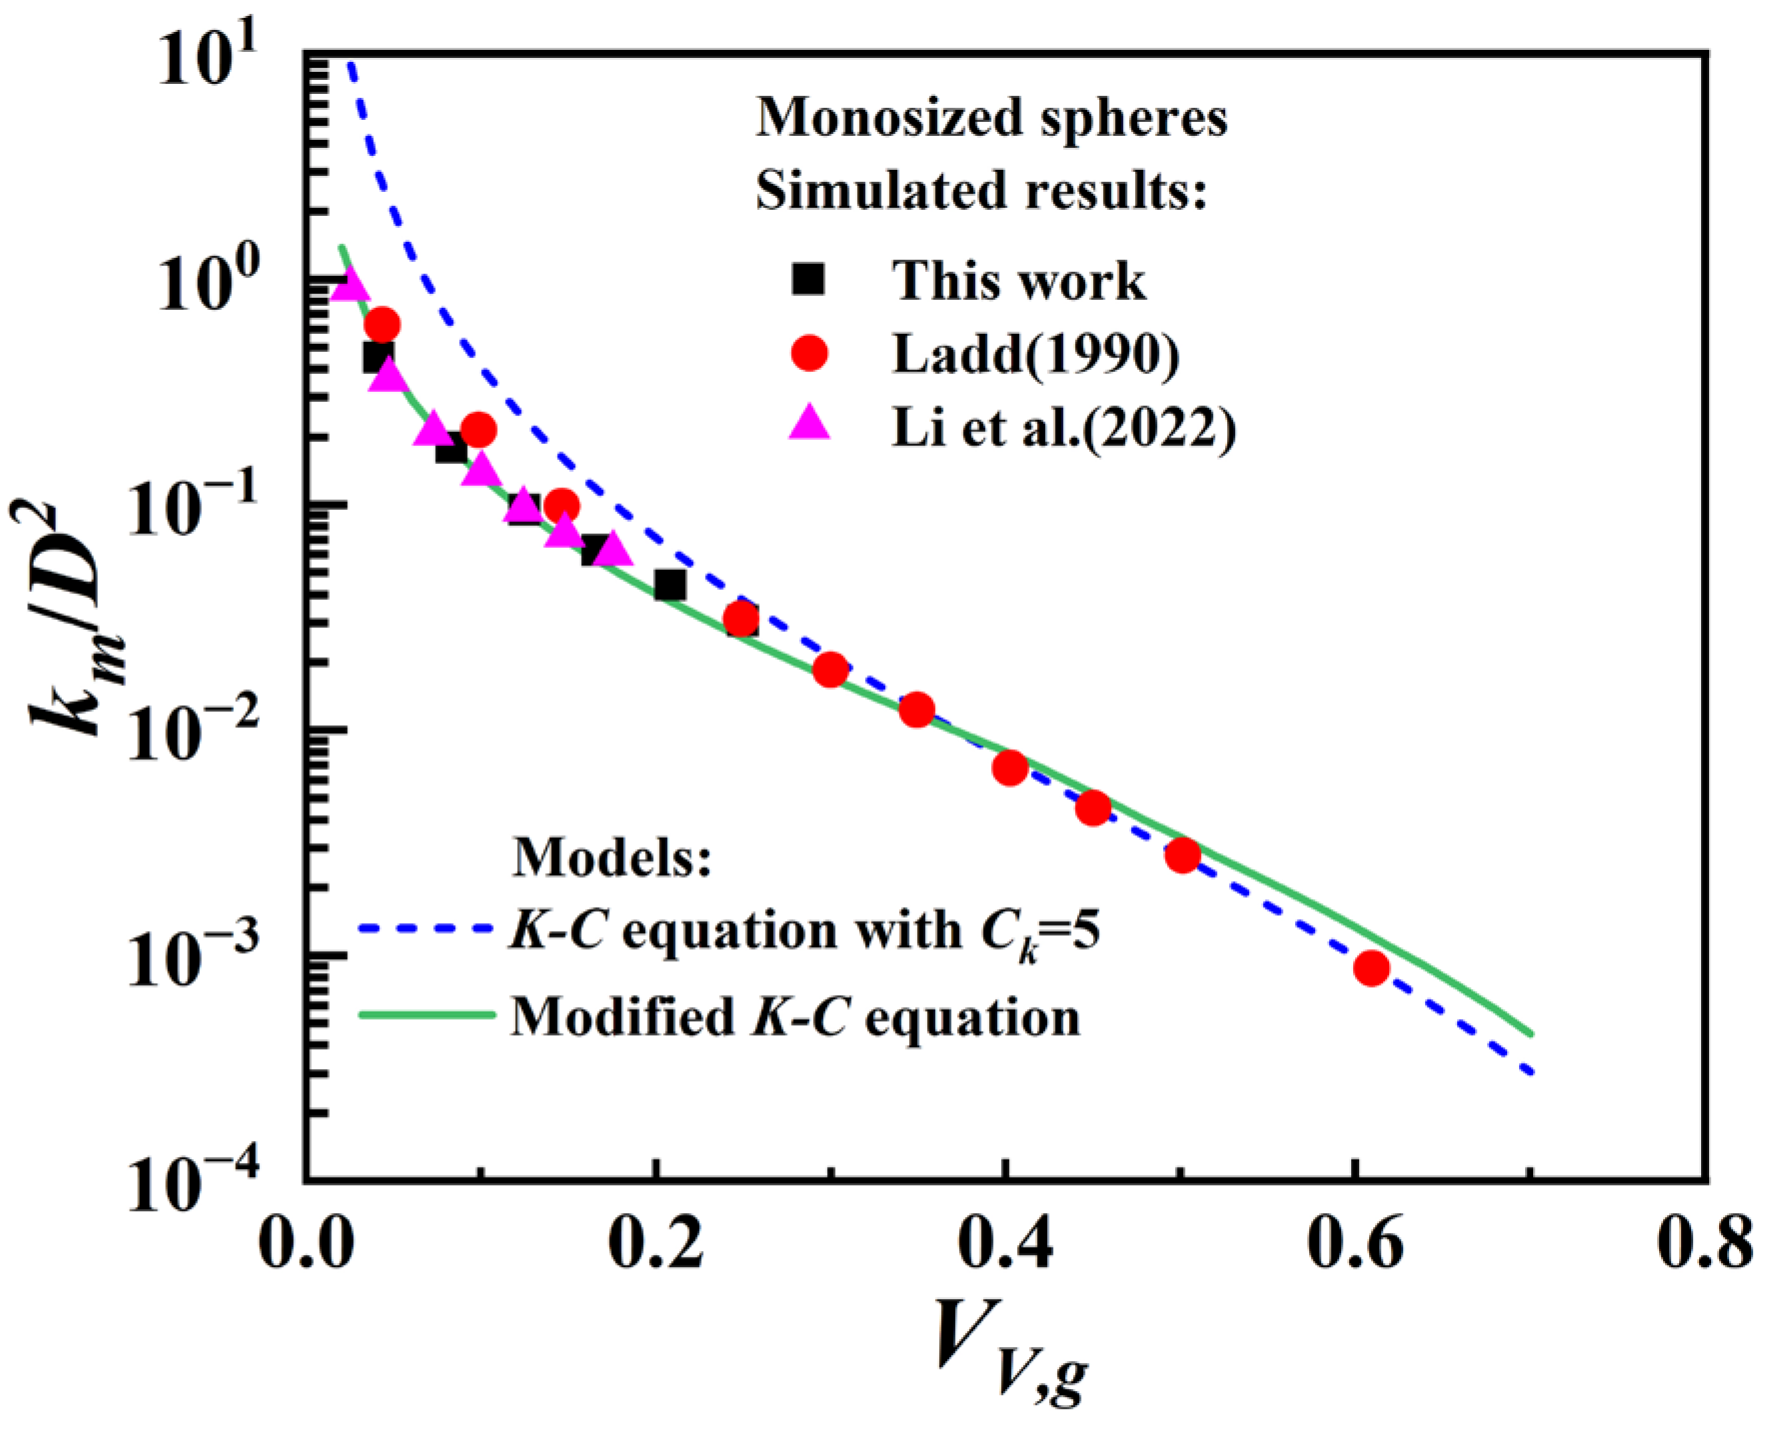
Combining the approximate formula of the shape parameter Cf,m and the tortuosity τp,m for the MPPS, a modified K-C formula is proposed to calculate the permeability km of the MPPS, as shown in Equation (34). The permeability km obtained from the modified K-C formula is compared with the numerical simulation data [37,38] obtained from the existing study in Figure 11, and it can be seen that the results obtained from the modified K-C formula are in agreement with the existing numerical simulation data. In addition, the modified K-C formula improves the reliability of permeability km predictions for low-volume fraction particle packing systems compared to the regular K-C formula with Ck = 5. It should be noted that all the external model validation presented in Figure 10 and Figure 11 relies solely on datasets of monodisperse spherical particles from the published literature.
k m = 1 V V , g 3 C f , m 1 V V , g + 6 V V , g B 1 P a v e S a g g 1 π 2 S V , g 2 V V , g 2
In order to evaluate how poly-sized particles affect the K-C constant Ck,p for PPPS, Vidal et al. [38] presents an expression for the K-C formula constants Ck,p for PPPS and the K-C constants Ck,m for the MPPS, as shown in Equation (35). Considering that the particle size distributions derived above have no influence on tortuosity, so by substituting Equation (4), that is Ck = Cfτ2 to Equation (35), the relationship of Cf,m and Cf,p can be simplified into the ratio relationship as displayed in Equation (36). Substituting the shape parameter Cf,m obtained from Equation (33) into Equation (36), the shape parameter solution formula applicable to PPPS can be derived. Then, a modified K-C formula that is applied to calculate the permeability kp for PPPS is developed in this work, as indicated in Equation (37). Moreover, it should be noted that the external permeability verification based on the published literature data is restricted to monodispersed spherical particle assemblies. Therefore, the permeability predictions for ovoid particles proposed in this work are only verified using the internal LBM simulation data adopted for shape factor fitting, without independent external benchmark validation for non-spherical granular media.
C k , p C k , m = 0.22 S k + 4 4
C k , p C k , m = τ p , p 2 C f , p τ p , m 2 C f , m = C f , p C f , m = 0.22 S k + 4 4
k p = 1 V V , g 3 C f , m 0.22 S k + 4 4 1 V V , g + 6 V V , g B 1 P a v e S a g g 1 π 2 S V , g 2 V V , g 2
S k = D a g g , min D a g g , max D < D > 3 f N ( D ) d D D a g g , min D a g g , max D < D > 2 f N ( D ) d D 3 / 2
< D > = D a g g , min D a g g , max D f N ( D ) d D
where Sk is the skewness of the particle size distribution [38], as shown in Equation (38); fN(D) is the number-based probability density function of the particle size distribution; D is the equivalent diameter; <D> represents the average of the equivalent diameters.

4. Conclusions

Based on the ovoidal particle packing system, this work investigates the influence of the particle shape, volume fraction and size distribution on the tortuosity and permeability of the particle packing system. In this work, the prediction formula for calculating the tortuosity is theoretically derived, and the reliability of the prediction formula is verified by comparing it with the numerical simulation results. It should be noted that the established model is only applicable to spherical, ellipsoidal and ovoid particles with random non-overlapping packing, and its performance for irregular particles remains limited. These are the primary conclusions: (1) For a given tapering parameter T, when c/a is less than 1.0, the tortuosity τp falls as the aspect ratio increases; when c/a is greater than 1.0, the tortuosity τp rises as the aspect ratio c/a increases; the minimized tortuosity is obtained when c/a = 1.0. The tortuosity τp rises as the tapering parameter T increases for a particular aspect ratio c/a. (2) For the MPPS, the tortuosity τp is the same as for poly-sized particles; that is, the tortuosity τp is independent of the size distribution.
Based on the tortuosity prediction formula, the permeability of the particle packing system obtained from the lattice Boltzmann method, and the consequence of the shape of the particles and size distribution on the permeability characterized using a modified K-C formula, the results indicate the following: Permeability k increases for a certain tapering parameter T and subsequently falls as the aspect ratio c/a increases, and the maximum permeability is acquired with the aspect ratio of c/a = 1.0.

Author Contributions

Conceptualization, X.C.; Methodology, X.C. and J.L.; Software, X.C. and J.L.; Investigation, J.H.; Writing—original draft, J.H. and X.C.; Writing—review & editing, X.C. and J.L.; Funding acquisition, J.L. All authors have read and agreed to the published version of the manuscript.

Funding

This research was funded by the Natural Science Foundation of Hebei Province (No. E2025203058).

Data Availability Statement

The original contributions presented in this study are included in the article. Further inquiries can be directed to the corresponding author.

Conflicts of Interest

The authors declare no conflict of interest.

References

  1. Liu, Z.; Ye, W.; Zhang, Z.; Wang, Q.; Chen, Y.; Cui, Y. A nonlinear particle packing model for multi-sized granular soils. Constr. Build. Mater. 2019, 221, 274–282. [Google Scholar] [CrossRef] [Scilit]
  2. Sevostianova, E.; Leinauer, B.; Sevostianov, I. Quantitative characterization of the microstructure of a porous material in the context of tortuosity. Int. J. Eng. Sci. 2010, 48, 1693–1701. [Google Scholar] [CrossRef] [Scilit]
  3. Hafid, H.; Ovarlez, G.; Toussaint, F.; Jezequel, P.H.; Roussel, N. Effect of particle morphological parameters on sand grains packing properties and rheology of model mortars. Cem. Concr. Res. 2016, 80, 44–51. [Google Scholar] [CrossRef] [Scilit]
  4. Guihard, V.; Patapy, C.; Sanahuja, J.; Balayssac, J.; Taillade, F.; Steck, B. Effective medium theories in electromagnetism for the prediction of water content in cement pastes. Int. J. Eng. Sci. 2020, 150, 103273. [Google Scholar] [CrossRef] [Scilit]
  5. Su, X.; Yao, D.; Xu, W. Processing of viscoelastic data via a generalized fractional model. Int. J. Eng. Sci. 2021, 161, 103465. [Google Scholar] [CrossRef] [Scilit]
  6. Berndt, E.; Sevostianov, I. Multiscale modeling of fluid permeability of a non-homogeneous porous media. Int. J. Eng. Sci. 2012, 56, 99–110. [Google Scholar] [CrossRef] [Scilit]
  7. Demidov, I.V.; Vaisberg, L.A.; Blekhman, I.I. Vibrational dynamics of paramagnetic particles and processes of separation of granular materials. Int. J. Eng. Sci. 2019, 141, 141–156. [Google Scholar] [CrossRef] [Scilit]
  8. Lin, J.; Zhao, Q.; Chen, H.; Zhu, Z.; Li, M.; Zhao, D. Insight into the diffusivity of particulate composites considering percolation of soft interphases around hard fillers: From spherical to polyhedral particles. Powder Technol. 2021, 392, 459–472. [Google Scholar] [CrossRef] [Scilit]
  9. Rokhforouz, M.R.; Akhlaghi Amiri, H.A. Effects of grain size and shape distribution on pore-scale numerical simulation of two-phase flow in a heterogeneous porous medium. Adv. Water Resour. 2019, 124, 84–95. [Google Scholar] [CrossRef] [Scilit]
  10. Vilchevskaya, E.; Sevostianov, I. Effect of pore shapes on the overall electrical conductivity of cathode material in Li-ion batteries. Int. J. Eng. Sci. 2020, 146, 103187. [Google Scholar] [CrossRef] [Scilit]
  11. Cao, T.; Zhang, L.; Sun, G.; Wang, C.; Zhang, Y.; Yan, N.; Xu, A. Model for Predicting the Tortuosity of Transport Paths in Cement-Based Materials. Materials 2019, 12, 3623. [Google Scholar] [CrossRef] [Scilit] [PubMed]
  12. Stroeven, P. A stereological approach to roughness of fracture surfaces and tortuosity of transport paths in concrete. Cem. Concr. Compos. 2000, 22, 331–341. [Google Scholar] [CrossRef] [Scilit]
  13. Li, M.; Chen, H.; Liu, L.; Lin, J.; Ullah, K. Permeability of concrete considering the synergetic effect of crack’s shape- and size-polydispersities on the percolation. Constr. Build. Mater. 2022, 315, 125684. [Google Scholar] [CrossRef] [Scilit]
  14. Yun, M.; Yu, B.; Zhang, B.; Huang, M. A geometry model for tortuosity of streamtubes in porous media with spherical particles. Chin. Phys. Lett. 2005, 22, 1464–1467. [Google Scholar] [CrossRef] [Scilit]
  15. Wu, M.; Cheng, Z.; Wu, J.; Wu, J. Quantifying representative elementary volume of connectivity for translucent granular materials by light transmission micro-tomography. J. Hydrol. 2017, 545, 12–27. [Google Scholar] [CrossRef] [Scilit]
  16. Wu, M.; Cheng, Z.; Wu, J.; Wu, J. Estimation of representative elementary volume for DNAPL saturation and DNAPL-water interfacial areas in 2D heterogeneous porous media. J. Hydrol. 2017, 549, 12–26. [Google Scholar] [CrossRef] [Scilit]
  17. Yu, B.; Li, J. A geometry model for tortuosity of flow path in porous media. Chin. Phys. Lett. 2004, 21, 1569–1571. [Google Scholar] [CrossRef] [Scilit]
  18. Yun, M.; Yu, B.; Xu, P.; Wu, J. Geometrical Models for Tortuosity of Streamlines in Three-Dimensional Porous Media. Can. J. Chem. Eng. 2008, 84, 301–309. [Google Scholar] [CrossRef] [Scilit]
  19. Li, M.; Chen, H.; Lin, J. Efficient measurement of the percolation threshold for random systems of congruent overlapping ovoids. Powder Technol. 2020, 360, 598–607. [Google Scholar] [CrossRef] [Scilit]
  20. Lei, G.; Liao, Q.; Patil, S.; Zhao, Y. A new permeability model for argillaceous porous media under stress dependence with clay swelling. Int. J. Eng. Sci. 2021, 160, 103452. [Google Scholar] [CrossRef] [Scilit]
  21. Ren, X.W.; Santamarina, J.C. The hydraulic conductivity of sediments: A pore size perspective. Eng. Geol. 2018, 233, 48–54. [Google Scholar] [CrossRef] [Scilit]
  22. Xu, W.; Jiao, Y. Theoretical framework for percolation threshold, tortuosity and transport properties of porous materials containing 3D non-spherical pores. Int. J. Eng. Sci. 2019, 134, 31–46. [Google Scholar] [CrossRef] [Scilit]
  23. Kobayashi, I.; Owada, H.; Ishii, T.; Iizuka, A. Evaluation of specific surface area of bentonite-engineered barriers for Kozeny-Carman law. Soils Found. 2018, 58, 1071–1072. [Google Scholar] [CrossRef] [Scilit]
  24. Li, B.; Wong, R.C.K.; Heidari, S. A modified Kozeny-Carman model for estimating anisotropic permeability of soft mudrocks. Mar. Pet. Geol. 2018, 98, 356–368. [Google Scholar] [CrossRef] [Scilit]
  25. Nomura, S.; Yamamoto, Y.; Sakaguchi, H. Modified expression of Kozeny–Carman equation based on semilog–sigmoid function. Soils Found. 2018, 58, 1350–1357. [Google Scholar] [CrossRef] [Scilit]
  26. Luo, L.; Yu, B.; Cai, J.; Zeng, X. Numerical Simulation of Tortuosity for Fluid Flow in Two-Dimensional Pore Fractal Models of Porous Media. Fractals 2014, 22, 1450015. [Google Scholar] [CrossRef] [Scilit]
  27. Zhong, R.; Xu, M.; Vieira Netto, R.; Wille, K. Influence of pore tortuosity on hydraulic conductivity of pervious concrete: Characterization and modeling. Constr. Build. Mater. 2016, 125, 1158–1168. [Google Scholar] [CrossRef] [Scilit]
  28. Mathavan, G.N.; Viraraghavan, T. Coalescence/filtration of an oil-in-water emulsion in a peat bed. Water Res. 1992, 26, 91–98. [Google Scholar] [CrossRef] [Scilit]
  29. Kyan, C.P.; Wasan, D.T.; Kintner, R.C. Flow of single-phase fluids through fibrous beds. Ind. Eng. Chem. Fundam. 1970, 9, 596–603. [Google Scholar] [CrossRef] [Scilit]
  30. Nooruddin, H.A.; Hossain, M.E. Modified Kozeny–Carmen correlation for enhanced hydraulic flow unit characterization. J. Pet. Sci. Eng. 2011, 80, 107–115. [Google Scholar] [CrossRef] [Scilit]
  31. Mayhew, T.M.; Cruz Orive, L.M. Caveat on the use of the Delesse principle of areal analysis for estimating component volume densities. J. Microsc. 1974, 102, 195–207. [Google Scholar] [CrossRef] [Scilit]
  32. Li, M.; Chen, H.; Li, X.; Liu, L.; Lin, J. Permeability of granular media considering the effect of grain composition on tortuosity. Int. J. Eng. Sci. 2022, 174, 103658. [Google Scholar] [CrossRef] [Scilit]
  33. Lin, J.; Chen, H. Lattice Boltzmann simulation of fluid flow through random packing beds of Platonic particles: Effect of particle characteristics. Particuology 2019, 47, 41–53. [Google Scholar] [CrossRef] [Scilit]
  34. He, X.; Zou, Q.; Luo, L.; Dembo, M. Analytic solutions of simple flows and analysis of nonslip boundary conditions for the lattice Boltzmann BGK model. J. Stat. Phys. 1997, 87, 115–136. [Google Scholar] [CrossRef] [Scilit]
  35. Carman, P.C. Fluid flow through granular beds. Trans. Inst. Chem. Eng. 1937, 15, 150–166. [Google Scholar]
  36. Hoef, M.A.V.D.; Beetstra, R.; Kuipers, J.A.M. Lattice-Boltzmann simulations of low-Reynolds-number flow past mono- and bidisperse arrays of spheres: Results for the permeability and drag force. J. Fluid Mech. 2005, 528, 233–254. [Google Scholar] [CrossRef] [Scilit]
  37. Ladd, A.J.C. Hydrodynamic transport coefficients of random dispersions of hard spheres. J. Chem. Phys. 1990, 93, 3484–3494. [Google Scholar] [CrossRef] [Scilit]
  38. Vidal, D.; Ridgway, C.; Pianet, G.; Schoelkopf, J.; Roy, R.; Bertrand, F. Effect of particle size distribution and packing compression on fluid permeability as predicted by lattice-Boltzmann simulations. Comput. Chem. Eng. 2009, 33, 256–266. [Google Scholar] [CrossRef] [Scilit]
Figure 1. (a) Linear tortuosity τl and (b) planar tortuosity τp.
Materials 19 03498 g001
Figure 2. Illustration of using the SCSM to obtain the <Scap>.
Materials 19 03498 g002
Figure 3. The average particle crown area parameter Pave varies for various aspect ratios c/a and tapering parameter T.
Materials 19 03498 g003
Figure 4. Comparison of τp from the theoretical model with those from numerical simulations [32].
Materials 19 03498 g004
Figure 5. Effect of grain shape on geometric tortuosity τp,m: (a) oblate ovoid and (b) prolate ovoid.
Materials 19 03498 g005
Figure 6. Illustration of the D3Q19 model for LBM.
Materials 19 03498 g006
Figure 7. Effect of T on permeability k: (a) particle with c/a = 0.2; (b) particle with c/a = 5.0.
Materials 19 03498 g007
Figure 8. Effect of c/a on permeability k: (a) particle with T = 0.0; (b) particle with T = 0.4.
Materials 19 03498 g008
Figure 9. (a) Effect of grain shape on shape factor Cf,m. (b) Approximation of shape factor Cf,m.
Materials 19 03498 g009
Figure 10. Comparison of the approximation for Ck,m with other studies [36].
Materials 19 03498 g010
Figure 11. Comparison of the modified K-C equation with previous studies [32,37].
Materials 19 03498 g011
Table 1. The value of the fitting parameters in the approximation formula.
Fitting ParametersR2
a1a2a3a4a5
−6.42152−0.00532−0.00286−0.041786.713930.97382
Disclaimer/Publisher’s Note: The statements, opinions and data contained in all publications are solely those of the individual author(s) and contributor(s) and not of MDPI and/or the editor(s). MDPI and/or the editor(s) disclaim responsibility for any injury to people or property resulting from any ideas, methods, instructions or products referred to in the content.