1. Introduction
Proton exchange membrane fuel cells (PEMFCs) are regarded as one of the most promising electrochemical energy-conversion technologies for low-carbon transportation because of their high power density, high energy-conversion efficiency, rapid start-up capability, relatively low operating temperature, and near-zero local emissions [
1,
2]. Among the various components of a PEMFC stack, bipolar plates play a particularly critical role because they simultaneously provide mechanical support, collect and conduct current, distribute reactant gases, remove generated water, and assist thermal management. Their structural design and manufacturing quality therefore have direct effects on cell performance, stack reliability, and production cost. In addition, bipolar plates account for a considerable proportion of the stack cost, weight, and volume, making their lightweight and high-precision fabrication a key issue for PEMFC commercialization [
2,
3].
Metallic bipolar plates, especially stainless-steel bipolar plates, have attracted extensive attention as alternatives to conventional graphite plates owing to their high electrical and thermal conductivity, good gas impermeability, excellent mechanical strength, relatively low material cost, and suitability for thin-sheet mass production [
4]. Stainless-steel bipolar plates with thicknesses of approximately 0.1 mm or even lower can be produced by plastic-forming processes, which is advantageous for reducing stack volume and improving power density. However, the micro-channel structures required for gas distribution and water removal introduce severe local deformation during forming. Excessive thinning, wrinkling, springback, insufficient channel filling, and fracture may occur when ultra-thin sheets are subjected to complex micro-scale geometries. Therefore, the forming quality of metallic bipolar plates is not only a manufacturing concern but also a prerequisite for ensuring stable electrochemical performance and long-term stack durability.
Various forming technologies have been developed to improve the manufacturability of metallic bipolar plates. Bong et al. [
5] proposed a two-stage forming method for ferritic stainless-steel plates, while Xu et al. and Zhong et al. demonstrated that multi-stage deformation can increase the achievable microchannel geometry and reduce local forming severity in titanium sheets [
6,
7]. Hydroforming, rubber-pad forming, micro-roll forming, and hot stamping have also been investigated as alternatives to conventional rigid-die stamping [
7,
8,
9,
10,
11,
12,
13,
14,
15]. These processes redistribute the required deformation through different pressure paths, contact conditions, temperatures, or intermediate shapes. Nevertheless, stamping remains attractive for high-volume production because of its short cycle time, mature tooling route, and compatibility with ultra-thin metal sheets.
Recent studies have progressively expanded forming assessment beyond a single thinning value. Seddighi et al. experimentally and numerically investigated wrinkling control in a 0.1 mm SS304 parallel-serpentine plate using rubber blank-holder restraint [
16]. Guo et al. demonstrated the importance of forming temperature and lubrication for the dimensional accuracy of ultra-thin stainless-steel bipolar plates [
10]. Zhang et al. examined failure initiation in micro-stamped 316L sheets using measured tool geometry and an experimental forming-limit diagram [
17]. More recently, Acar et al. combined physical stamping and three-dimensional simulation for SS316L and CP-Ti plates and evaluated fracture, wrinkling, thinning, channel depth, blank-holder restraint, press velocity, and springback [
18]. These investigations show that bipolar-plate quality must be assessed through coupled defect, thickness, and dimensional criteria. However, the studied geometries remain conventional parallel, serpentine, or parallel-serpentine channels rather than repeated local sidewall bosses.
Numerical process design has also become more systematic and computationally efficient. Yang et al. incorporated material and tooling variability into robust process design, while Khatir et al. and Modanloo et al. applied design-of-experiments and response-surface methods to geometric and process optimization [
19,
20,
21]. Gassler et al. recently introduced a GPU-accelerated one-step solver for metallic bipolar-plate stamping and obtained qualitatively consistent strain and thinning distributions at substantially lower computational cost, although small quantitative differences from incremental simulations remained [
22]. Lan et al. further optimized forming parameters and forming strategy for an ultra-thin super-ferritic stainless-steel bipolar plate [
23]. These advances improve screening efficiency, but they continue to focus primarily on conventional channel profiles, global process variables, or numerical acceleration. The additional bending–stretching and material-flow restriction introduced by repeated sidewall protrusions has not been systematically isolated.
Experimental and numerical studies have established that channel depth, channel-to-rib ratio, fillet radius, die clearance, friction, blank-holder force, press force, and forming sequence strongly influence thickness distribution, channel filling, wrinkling, springback, and fracture [
16,
18,
19,
20,
21,
23,
24,
25,
26,
27,
28,
29,
30,
31,
32,
33,
34,
35]. Severe deformation is frequently concentrated at high-curvature sheet–tool contact transitions and in regions where material draw-in is restricted. However, the geometric variables in these studies generally modify the main channel cross-section or the overall forming route rather than introducing discrete protrusions repeatedly along a channel sidewall. In parallel, performance-oriented PEMFC research has demonstrated the fluid–dynamic benefits of local disturbances. Partially blocked channels, streamlined baffles, variable-height blocks, three-dimensional obstacles, tapered-baffle arrangements, and auxiliary channels can enhance transverse convection, under-rib oxygen transport, water removal, and current-density uniformity [
36,
37,
38,
39,
40,
41,
42,
43,
44]. Li et al. optimized a blocked regulated tri-serpentine field with variable block heights and auxiliary channels [
42], while Nguyen and Kim developed a staggered trap/block structure within a serpentine field [
44]. These studies demonstrate the electrochemical value of local obstacles, but their evaluation criteria are mainly pressure drop, oxygen transport, liquid-water distribution, current density, and power output rather than the stampability of ultra-thin metallic sheets.
The local features in most blocked or baffled flow fields are also geometrically different from the present design. Many occupy the channel centre or a substantial portion of the cross-section, are coupled with globally serpentine or tapered paths, or modify the overall channel trajectory. By contrast, each side-boss investigated here is a discrete transverse protrusion extending from the sidewall of an otherwise straight parallel channel. The global channel centerline, principal flow direction, main channel count, and nominal channel depth are retained, while additional boss root, boss top, and transition regions are introduced. Consequently, two mature research directions remain insufficiently connected. Metallic bipolar-plate forming studies have established deformation rules for conventional channels and global process variables. Flow-field-performance studies have established that local obstacles can improve mass transfer and water management. What remains insufficiently quantified is the additional single-step stamping demand generated by repeated performance-motivated sidewall protrusions in a 0.1 mm SS304 parallel-channel plate.
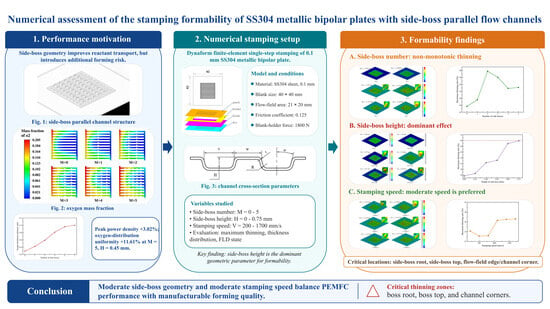
This study addresses that manufacturing gap through a Dynaform-based comparative assessment. The contributions are fourfold. First, a distinct side-boss geometry is defined in which discrete sidewall protrusions are introduced while the global parallel path is preserved. Second, the separate effects of side-boss number, side-boss height, and punch speed are quantified under common contact and blank-holder conditions. Third, the migration of minimum-thickness and high-risk regions from the conventional channel bottom toward the boss root, boss top, transition fillet, and channel corner is identified using thickness distribution, maximum thinning ratio, and estimated-FLD states. Fourth, the quantified trends are converted into manufacturing-oriented guidance for geometry selection and process design. The novelty of this work lies in isolating and quantifying the single-step stamping penalty introduced by repeated local sidewall bosses while retaining the global parallel-channel path, a manufacturability issue not systematically addressed in previous conventional channel-forming or performance-oriented obstacle-flow-field studies.
2. Numerical Model and Formability Evaluation
The numerical framework combines geometric parameterization, an SS304 elastic-plastic material model, contact and loading conditions, forming-limit-based assessment, mesh convergence, and comparison with published stamping evidence. This unified framework is used to quantify thickness evolution, local-necking tendency, and critical-region migration under controlled changes in side-boss geometry and punch speed.
2.1. Geometric Model and Parameter Design
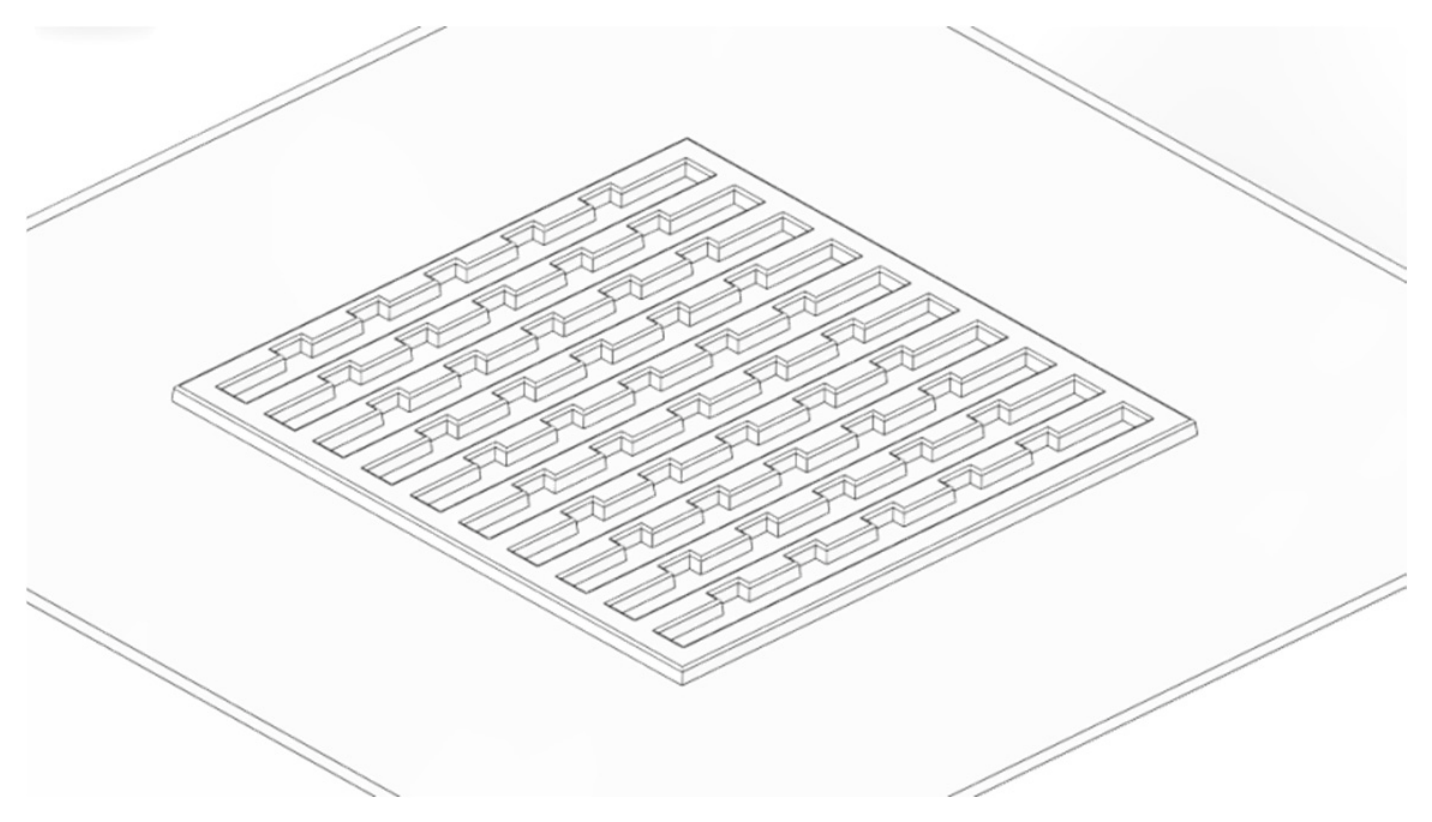
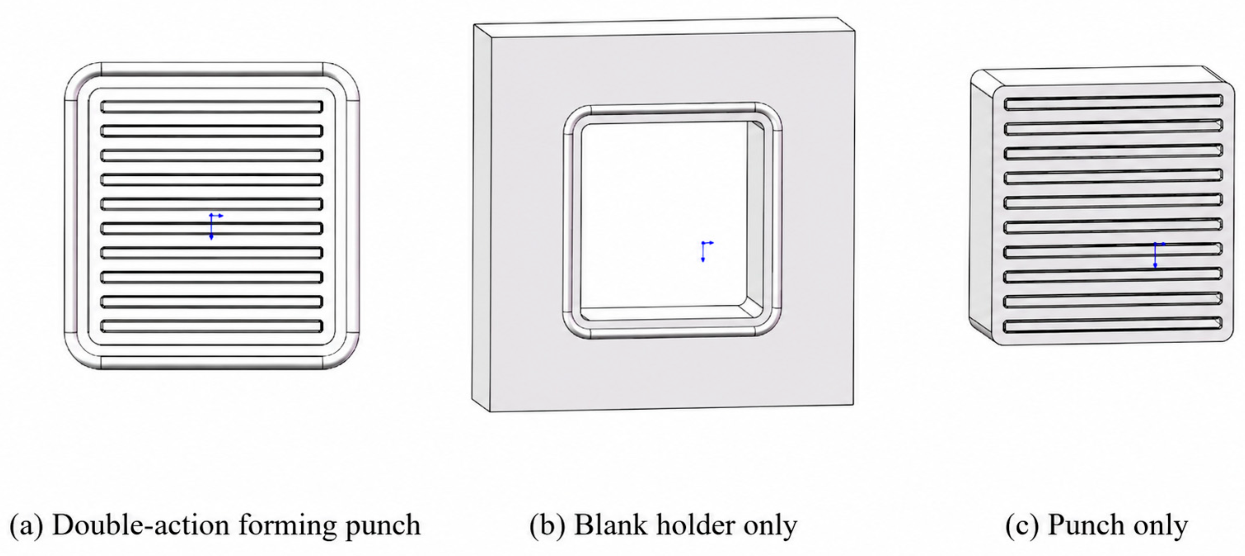
The metallic bipolar plate and stamping tools were created in SolidWorks 2022. The punch geometry and its repeated local side-boss features are illustrated in
Figure 1, while
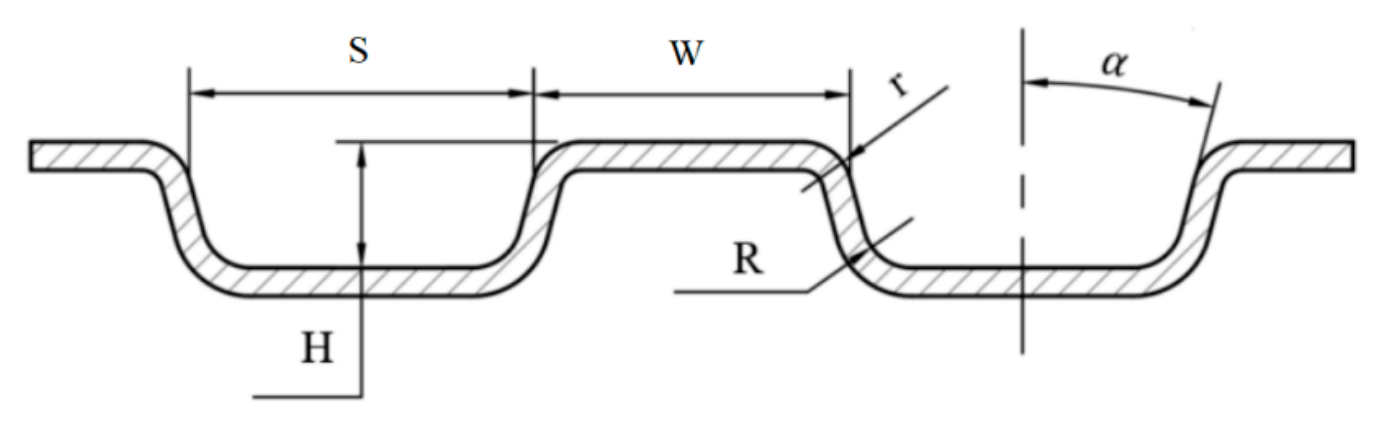
Figure 2 presents the simplified stamping assembly. The flow-field area was 21 mm × 20 mm, and the blank size was 40 mm × 40 mm with a thickness of 0.1 mm. From top to bottom, the tooling components were the punch, binder, blank, and die. The flow-channel cross-section and geometric definitions are provided in
Figure 3, where S is the channel width, W is the rib width, H is the channel depth, R is the inner fillet radius, r is the outer fillet radius, and α is the draft angle.
The friction coefficient and blank-holder force were fixed at 0.125 and 1800 N. The basic dimensions were selected to provide an engineering-relevant metallic bipolar-plate forming scale. The blank thickness was 0.10 mm, the nominal channel width and rib width were both 1.00 mm, the channel depth was 0.50 mm, and the active flow-field region was 21 mm × 20 mm. Ultra-thin stainless-steel sheets near 0.1 mm and channel widths on the order of 1 mm are commonly investigated in metallic bipolar-plate forming studies [
28,
30,
31,
35]. These dimensions therefore serve as the fixed baseline for evaluating the additional forming demand created by the side-bosses.
The parameter matrix connects performance-oriented geometry selection with systematic formability assessment. The electrochemical basis for selecting five repeated side-boss sets with a height of 0.45 mm is presented in
Section 3.1, whereas the remaining configurations provide controlled comparisons of feature density, protrusion severity, and punch speed response.
The number of repeated side-boss sets was varied as M = 0, 1, 2, 3, 4, and 5, where M = 0 denotes the unmodified parallel-channel baseline. The side-boss height Hb, defined as the transverse protrusion distance from the channel sidewall, was varied as 0, 0.15, 0.30, 0.45, 0.60, and 0.75 mm. Relative to the nominal channel width S = 1.0 mm, these values correspond to Hb/S = 0–0.75. The uniform 0.15 mm increment spans mild, moderate, performance-oriented, and high-severity protrusions. The 0.60 and 0.75 mm cases extend the range toward severe deformation and reveal the onset of rapid forming-margin reduction. The complete 40 mm × 40 mm blank was modelled because global material draw-in, binder restraint, interactions among adjacent boss sets, and non-periodic flow-field edges and corners all contribute to the forming response. This parameter space systematically links the performance-oriented reference geometry with its manufacturability.
2.2. Material Model and Stamping Conditions
The sheet blank was discretized using Belytschko–Tsay shell elements with five Gauss integration points through the thickness. The 0.1 mm SS304 blank was represented as a homogeneous, macroscopically isotropic elastic–plastic continuum. Plastic yielding was evaluated using an isotropic J
2/von Mises yield surface. The elastic properties and initial yield strength are summarized in
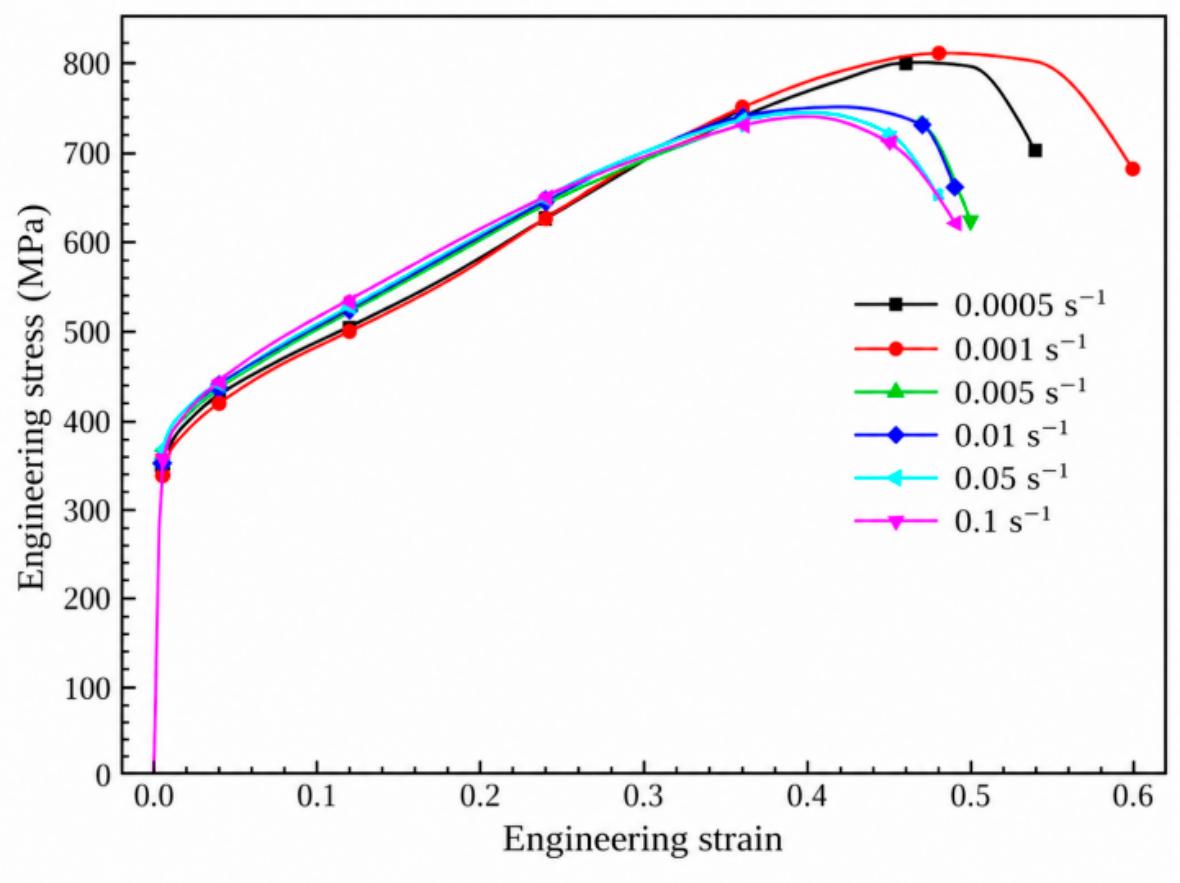
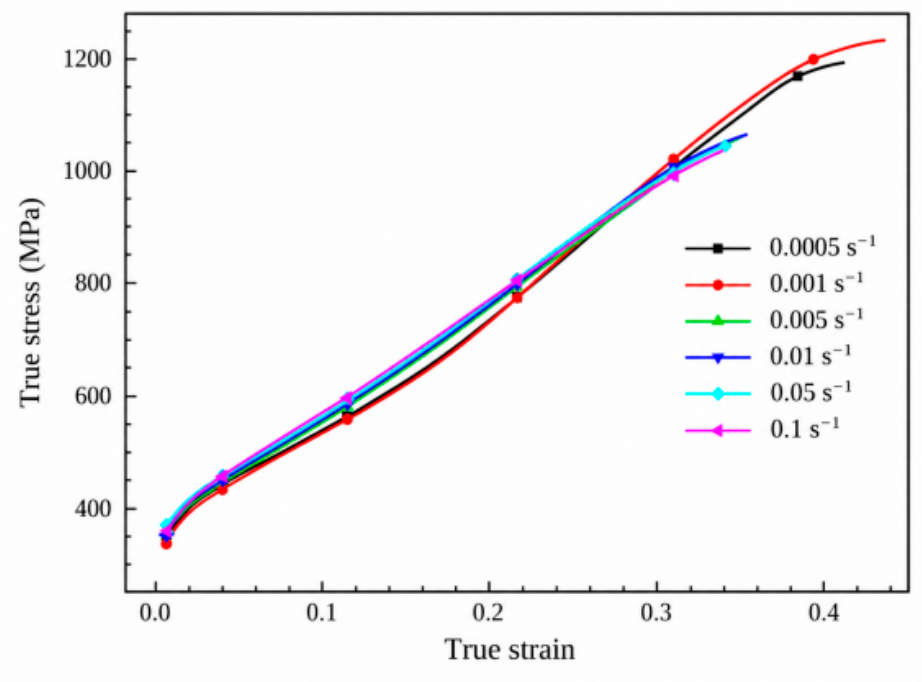
Table 1. The post-yield response was defined by piecewise tabulated true stress–plastic strain curves derived from the SUS304 tensile tests reported by Li et al. [
45]. The engineering and corresponding true stress–strain curves are shown in
Figure 4 and
Figure 5.
The tabulated true stress–plastic strain curves govern the post-yield response, while
n = 0.502 is used in the built-in forming-limit curve estimator. The curves span nominal tensile strain rates of 0.0005–0.1 s
−1 [
45], and recent SUS304/AISI 304 studies further confirm the rate-dependent strengthening and dynamic deformation characteristics of the alloy [
46,
47,
48]. Punch speed is prescribed as the tool kinematic condition, and the resulting local strain-rate field evolves with geometry, contact sequence, and deformation history. The value r = 1.0 provides a consistent isotropic reference for all cases, ensuring that the observed differences arise from the investigated geometric and process variables. The influence of plastic anisotropy on stainless-steel foil microformability is documented in Ref. [
49].
The material, contact, restraint, and tooling settings were maintained consistently throughout the parameter matrix, providing a common basis for isolating the effects of side-boss number, side-boss height, and punch speed.
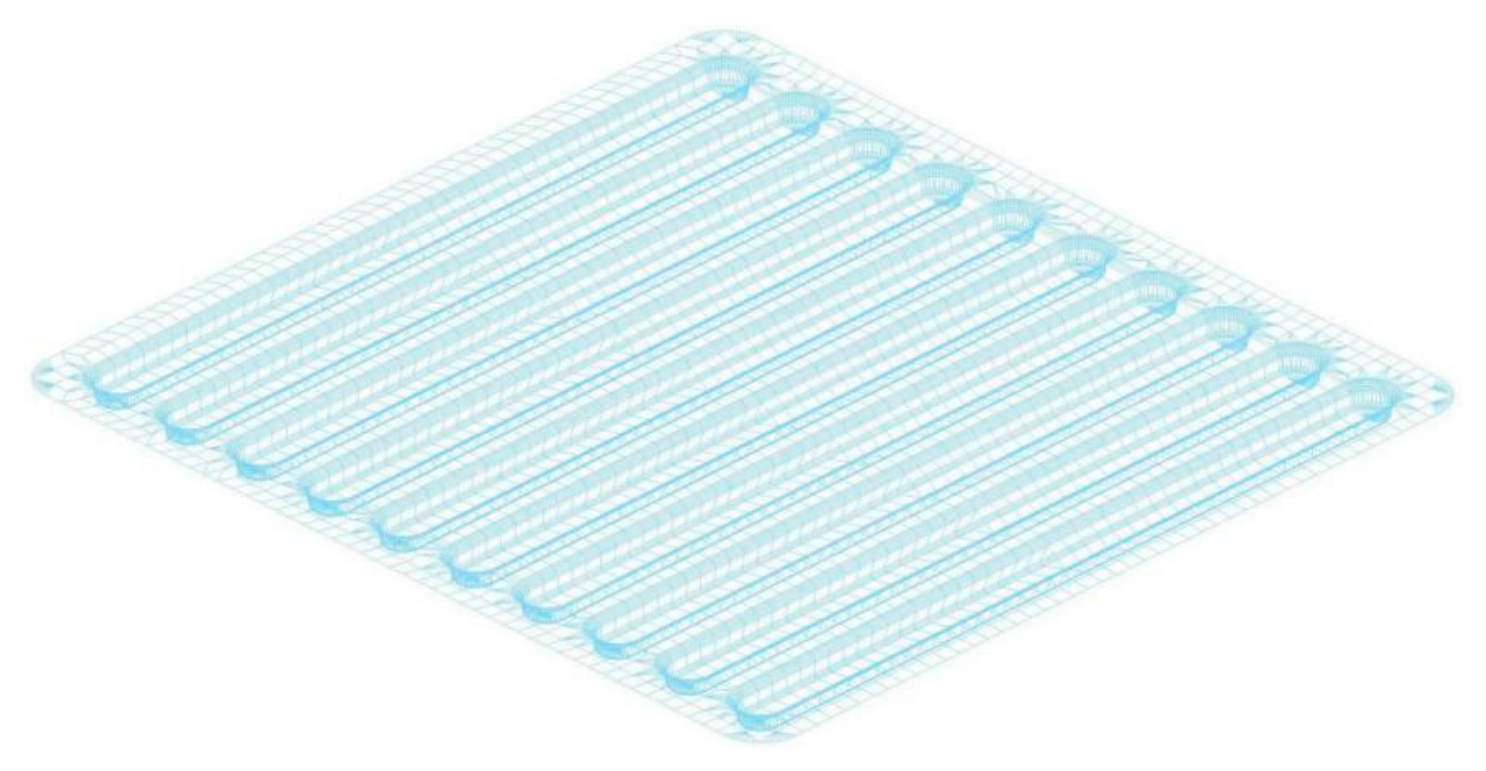
The tools were meshed primarily with quadrilateral elements. A graded local-refinement strategy was used for the blank: the smallest in-plane element size of 0.025 mm was assigned to side-boss roots, root chamfers, boss tops, channel-bottom fillets, sidewall transitions, and flow-field corners, whereas the mesh was gradually coarsened to a maximum of 0.4 mm in remote flange regions. The contact friction coefficient between the tools and blank was fixed at 0.125. The reference channel geometry was S = W = 1 mm, channel depth H = 0.5 mm, inner and outer fillet radii R = r = 0.1 mm, and draft angle α = 5°.
The forming sequence comprised Closing and Drawing. During Closing, the binder contacted the blank through a penalty contact formulation with a penalty factor of 0.15 and a closing gap of 0.11 mm. During Drawing, the punch advanced until final closure, with the same nominal gap. The binder and punch motion histories were prescribed using the Dynaform default velocity curve. The blank-holder force was calculated from F
BH = Aq, where A is the binder-projected blank area and q is the unit blank-holder pressure.
For the present blank, A was approximately 600 mm
2 and q was set to 3 MPa, giving F
BH = 1800 N. The selected friction coefficient μ = 0.125 and blank-holder force F
BH = 1800 N establish a consistent contact and restraint baseline for isolating the effects of side-boss geometry and punch speed. Their coupled influence on material draw-in is discussed in
Section 3.5. The numerical model and fixed analysis conditions are summarized in
Table 2.
2.3. Formability Evaluation Framework
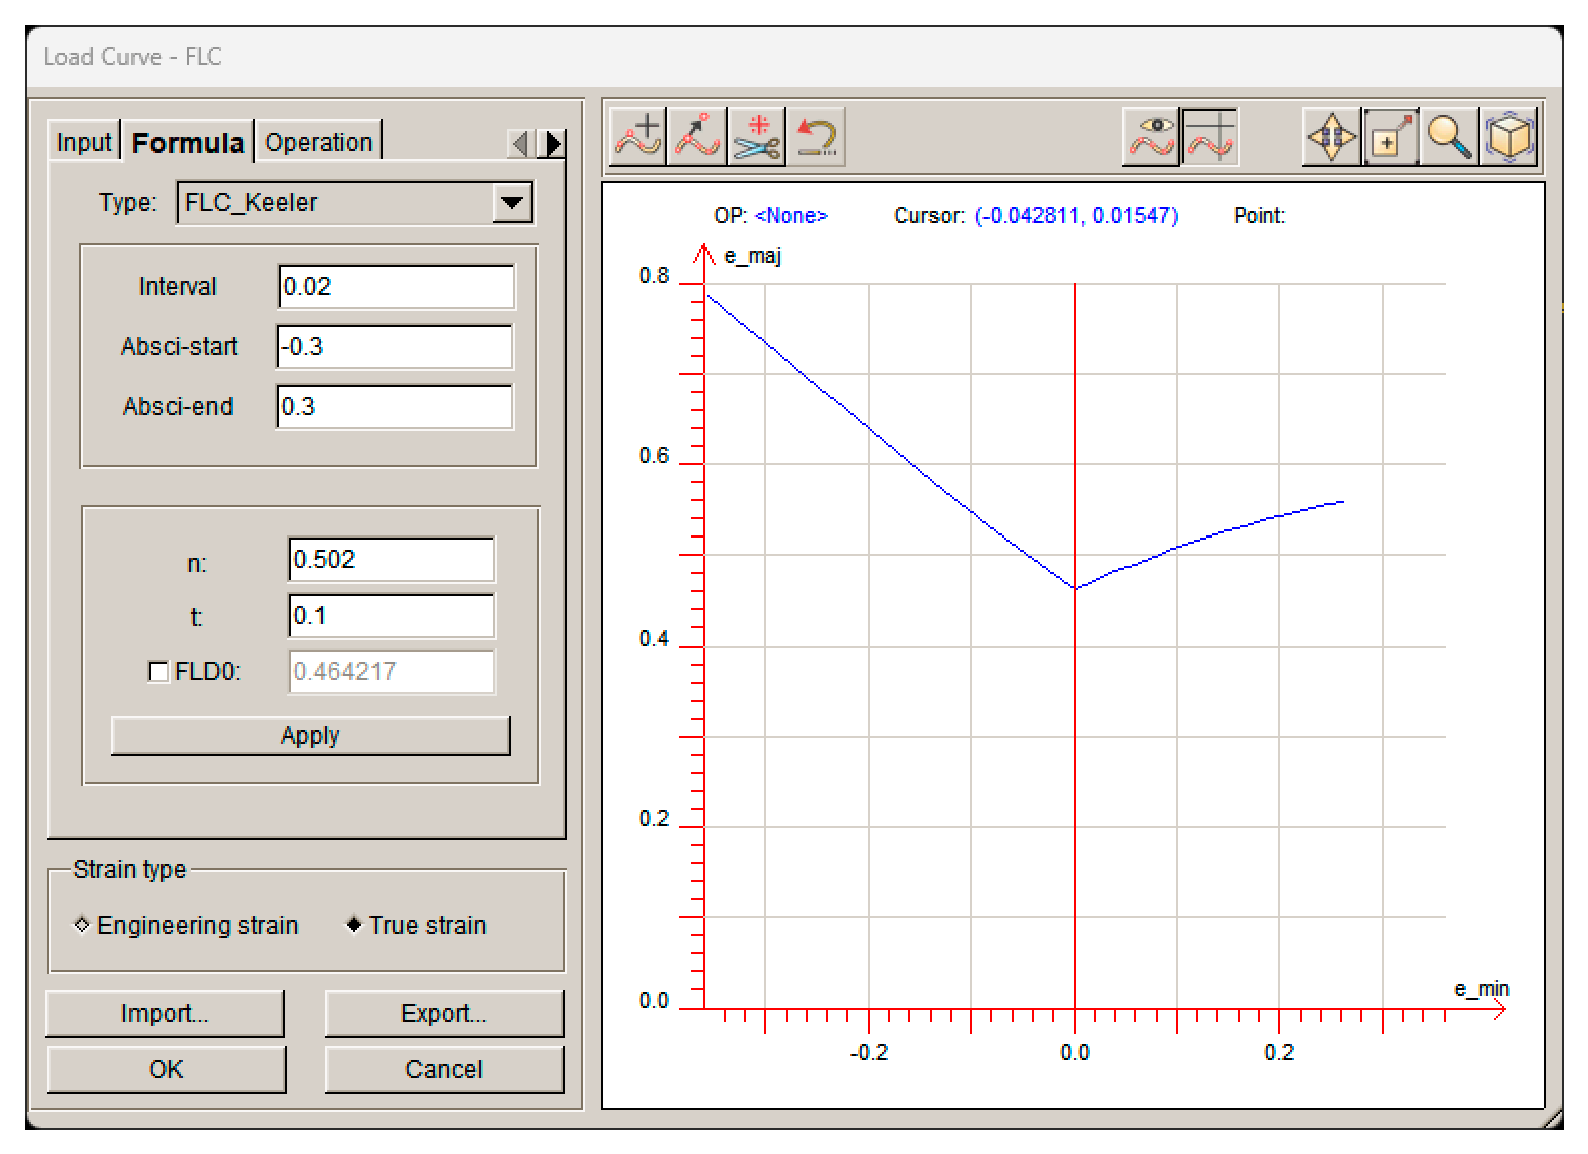
The Dynaform forming-limit diagram maps the calculated major and minor in-plane strains relative to a material forming-limit curve. The FLC may be defined from measured Nakajima or Marciniak strain data [
50] or generated using the software’s empirical estimation module. For the present comparative matrix, the curve was generated from the adopted sheet thickness,
n = 0.502, and r = 1.0, as shown in
Figure 6.
The calculated major–minor strain states were compared with the estimated FLC to characterize localized-necking initiation. The resulting categories are formulated as forming-risk states and provide a consistent strain-limit reference across the complete parameter matrix.
The Dynaform FLD maps also contain compressive or instability-related regions associated with wrinkling tendency. Tensile local-necking and compressive wrinkling are therefore treated as distinct forming responses. The operational categories used in the Results and Discussion are defined in
Table 3. The state assigned to each case considers the most severe spatially meaningful region together with its continuity and corresponding thickness localization; clustered points at a consistent geometric concentration carry greater weight than an isolated point.
Accordingly, the estimated FLD is evaluated together with maximum thinning ratio, thickness-distribution contours, and the locations of high-curvature deformation. This combined assessment links strain path, thinning magnitude, and geometric location.
2.4. Mesh Convergence and Model Credibility
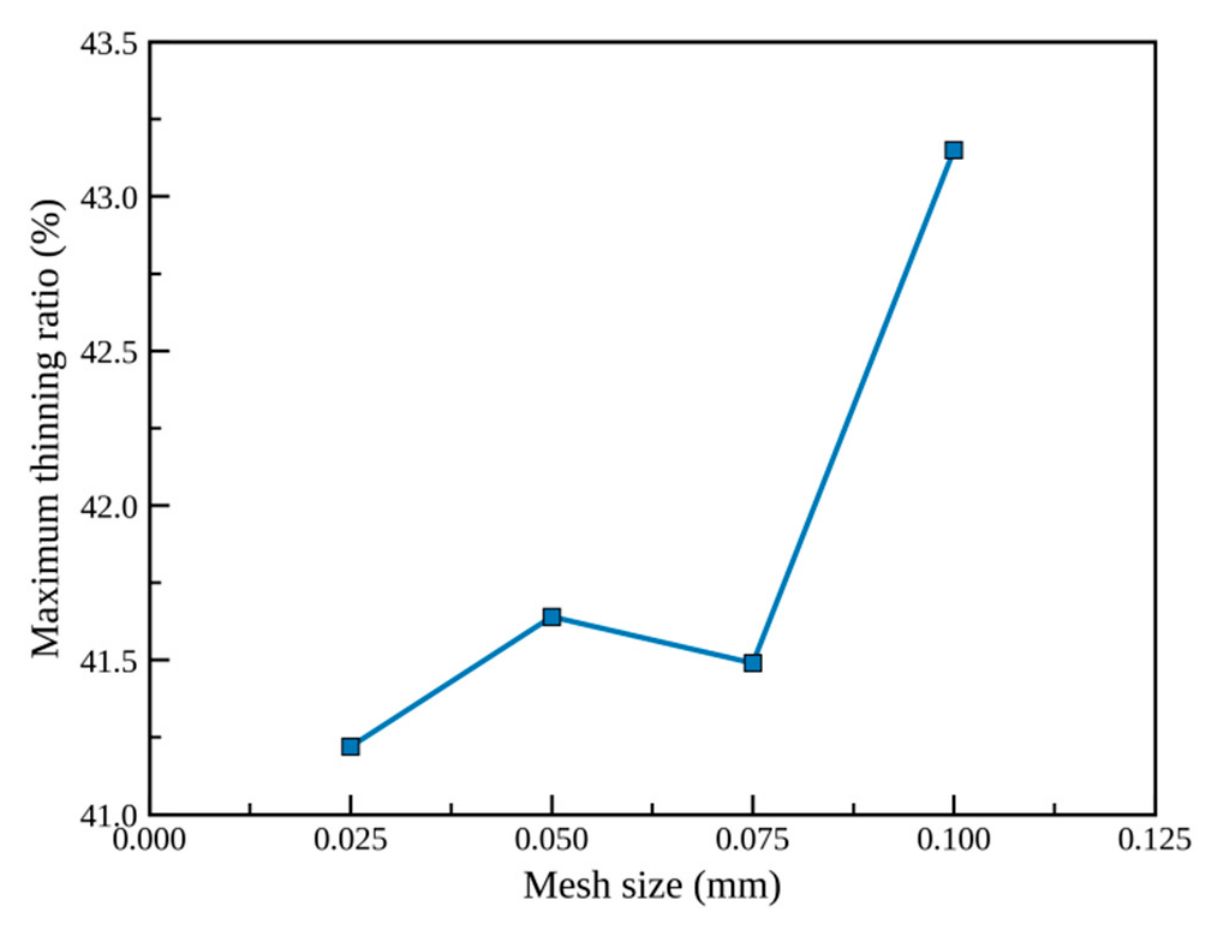
Mesh convergence was assessed before the parameter comparisons using identical material, contact, loading, and solver settings while varying only the local minimum element size. Local sizes of 0.100, 0.075, 0.050, and 0.025 mm were evaluated, and the resulting maximum-thinning response was used to select the final discretization.
The graded local-refinement strategy used to concentrate resolution in the active forming region is illustrated in
Figure 7. The finest elements were assigned to side-boss roots, root chamfers, boss tops, channel-bottom fillets, sidewall transitions, and flow-field corners, where curvature and strain gradients are highest, while remote flange regions were progressively coarsened. Because the reference fillet radius is 0.1 mm, a local size of 0.025 mm provides approximately four elements over a characteristic 0.1 mm fillet length, compared with approximately one element for the 0.100 mm mesh.
Mesh difference was evaluated using the 0.025 mm result as the reference:
where η
h is the maximum thinning ratio obtained using local element size h. Relative to the 0.025 mm reference, the 0.050 and 0.075 mm meshes differ by approximately 1.07% and 0.70%, respectively, whereas the 0.100 mm mesh differs by approximately 4.81%. The response stabilizes for the three finer meshes, while the 0.100 mm mesh under-resolves the high-curvature deformation.
Among the converged candidates, the 0.025 mm local mesh was selected for the final parameter study. A 0.050 mm mesh is adequate for preliminary screening, but it provides only approximately two elements across a 0.1 mm fillet. The 0.025 mm mesh provides approximately four elements over the same characteristic length and is therefore the most conservative choice for resolving the boss root, fillet, boss top, and corner locations that govern the conclusions.
The convergence trend is summarized graphically in
Figure 8 and quantitatively in
Table 4. The small response change relative to the coarser converged meshes, together with the improved geometric resolution, supports retention of the 0.025 mm local mesh. This selection is based on both stabilization of maximum thinning and spatial fidelity of the critical-location pattern.
In addition to mesh convergence, model credibility was evaluated against published experimental–numerical investigations using three common indicators: the order of thinning magnitude, the dominant strain-path response, and the localization of severe deformation at sheet–tool contact transitions.
Hu et al. [
30] showed that Dynaform reproduced the principal thickness and defect trends of stamped SS304 bipolar plates, including a comparatively stable intermediate-speed response. Talebi-Ghadikolaee et al. [
13] reported thickness and force-displacement errors of approximately 4.76% and 3.85%, respectively, together with a 33.45% critical thinning level dominated by plane-strain tension. These results provide a quantitative reference for the present thinning range and speed-dependent response.
Zhang et al. [
17] located severe thinning and local-necking initiation at high-curvature sheet–tool contact regions in approximately 0.1 mm stainless-steel sheets. Acar et al. [
18] likewise demonstrated the coupled influence of blank-holder restraint, forming velocity, contact transition, and springback. The boss roots, boss tops, local fillets, and flow-field corners identified here exhibit the same geometry-controlled localization mechanism.
Together, the mesh-convergence trend and the published experimental–numerical evidence establish consistent response magnitude, strain-path interpretation, and critical-location patterns for the present comparative analysis. A comparison of the present results with published experimental–numerical stamping studies is provided in
Table 5.
3. Performance and Formability Results and Discussion
The side-boss flow field must satisfy both electrochemical transport requirements and stamping-formability constraints. This section first establishes the performance basis for the reference geometry and then quantifies the effects of side-boss number, side-boss height, and punch speed on thinning, strain-path evolution, and critical-region migration.
All stamping cases are compared under the common material, contact, restraint, and tooling conditions summarized in
Table 2. The estimated-FLD states follow the definitions in
Table 3 and are interpreted jointly with thickness distribution and maximum thinning ratio.
3.1. Electrochemical Performance and Reference-Geometry Selection
The side-boss geometry was selected using a three-dimensional PEMFC performance model that connects the flow-field transport response with the subsequent manufacturability assessment.
The screening model represented the anode and cathode flow channels, gas-diffusion layers, catalyst layers, proton-exchange membrane, and bipolar-plate/current-collector domains. A three-dimensional, steady-state multiphysics formulation coupled mass and momentum conservation, reactant-species and water transport, electronic and protonic charge conservation, and Butler–Volmer electrochemical kinetics. Gas flow was treated as laminar, the gas mixture as ideal, the porous layers as homogeneous continua, and gravity was neglected. The governing framework and transport assumptions follow established PEMFC flow-field modelling practice [
36,
37,
38,
39,
40,
41,
42,
43,
44].
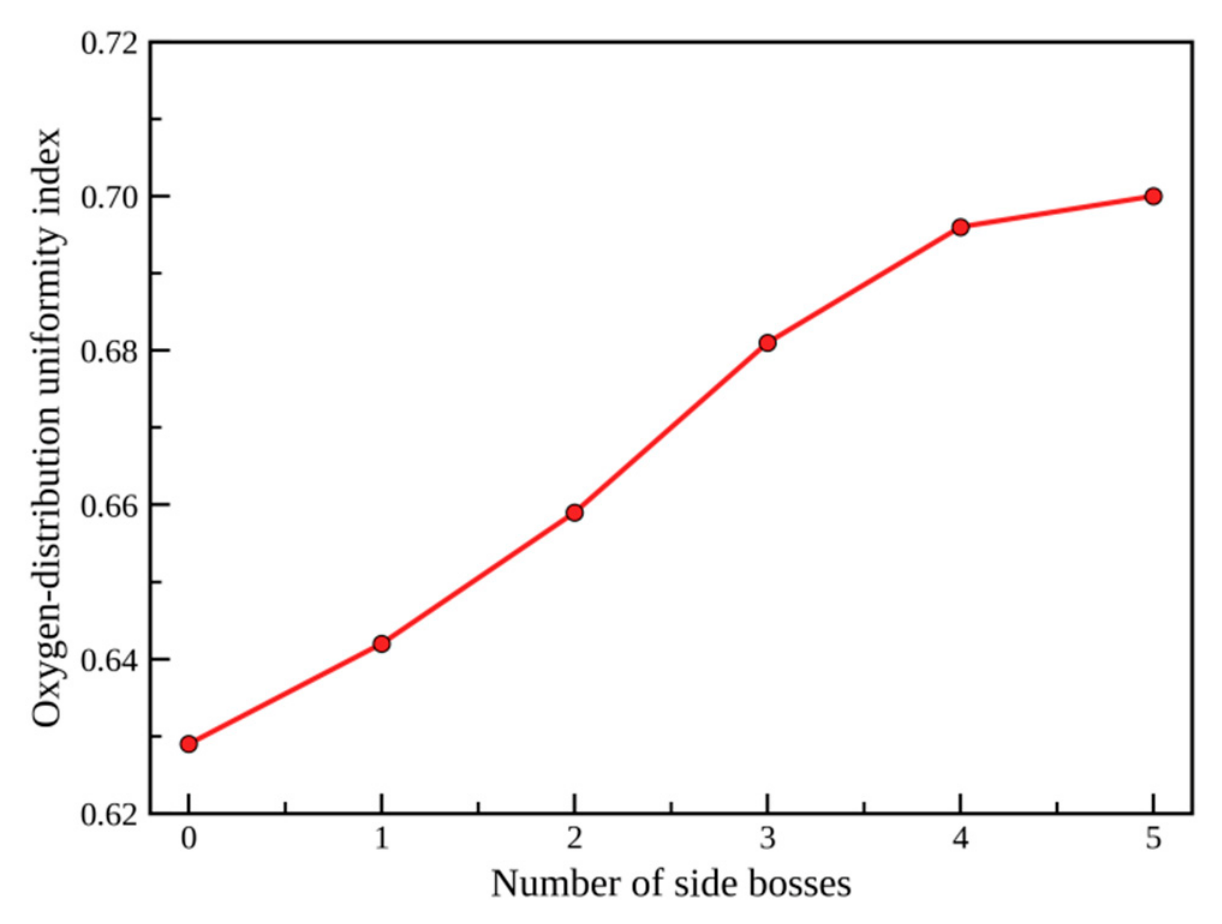
Identical material properties, operating temperature, inlet composition and flow conditions, outlet pressure, electrochemical parameters, solver tolerances, and mesh strategy were applied to all candidate geometries; only the number of side-boss sets was changed at Hb = 0.45 mm. Uniform inlet conditions, pressure outlets, no-slip solid walls, and zero normal species/charge fluxes at impermeable external boundaries were prescribed. Cell voltage was varied to generate the polarization and power-density curves, and the mesh was locally refined through the membrane electrode assembly and around the channel/side-boss transitions. The oxygen-distribution uniformity index at the cathode channel/GDL interface was evaluated as , where μO2 and σO2 are the area-weighted mean and standard deviation of oxygen mass fraction, respectively.
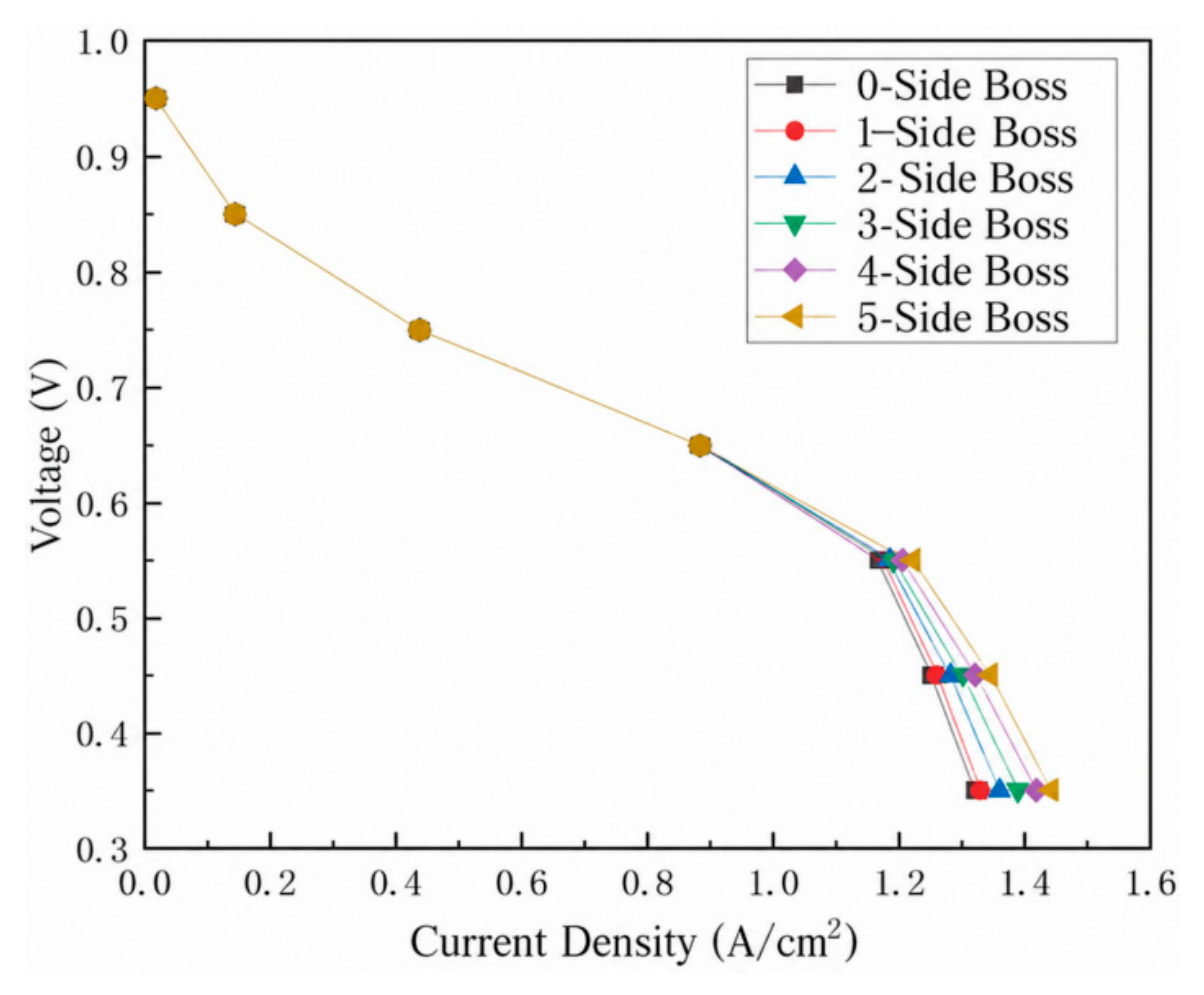
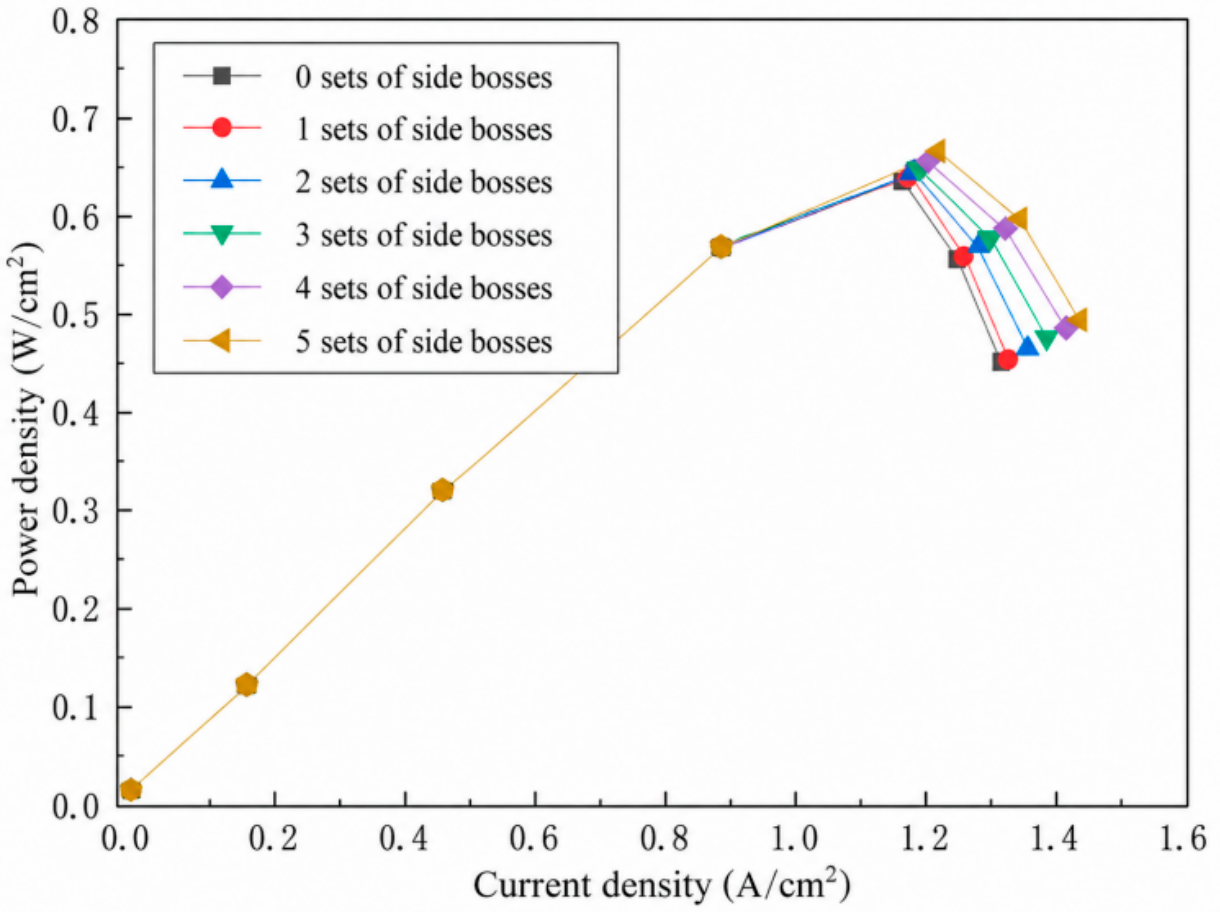
The polarization and power-density responses in
Figure 9 and
Figure 10 identify M = 5 and H
b = 0.45 mm as the performance-oriented reference geometry for the stamping study.
From the polarization curves and power density curves, the introduction of side-bosses helps improve the output performance of the parallel flow field. The curves in
Figure 9 and
Figure 10 indicate that the power density reaches its peak around 0.55 V. When the number of side-bosses is 5 and the height is 0.45 mm, the current density and power density show the best performance. Compared with the parallel flow field without side-bosses, the peak power density under this condition increases by 3.02%, and the oxygen distribution uniformity index increases by 11.61%. This result indicates that side-bosses do not merely increase geometric complexity; within a certain parameter range, they indeed demonstrate potential for performance improvement. To examine the transport mechanism underlying this gain,
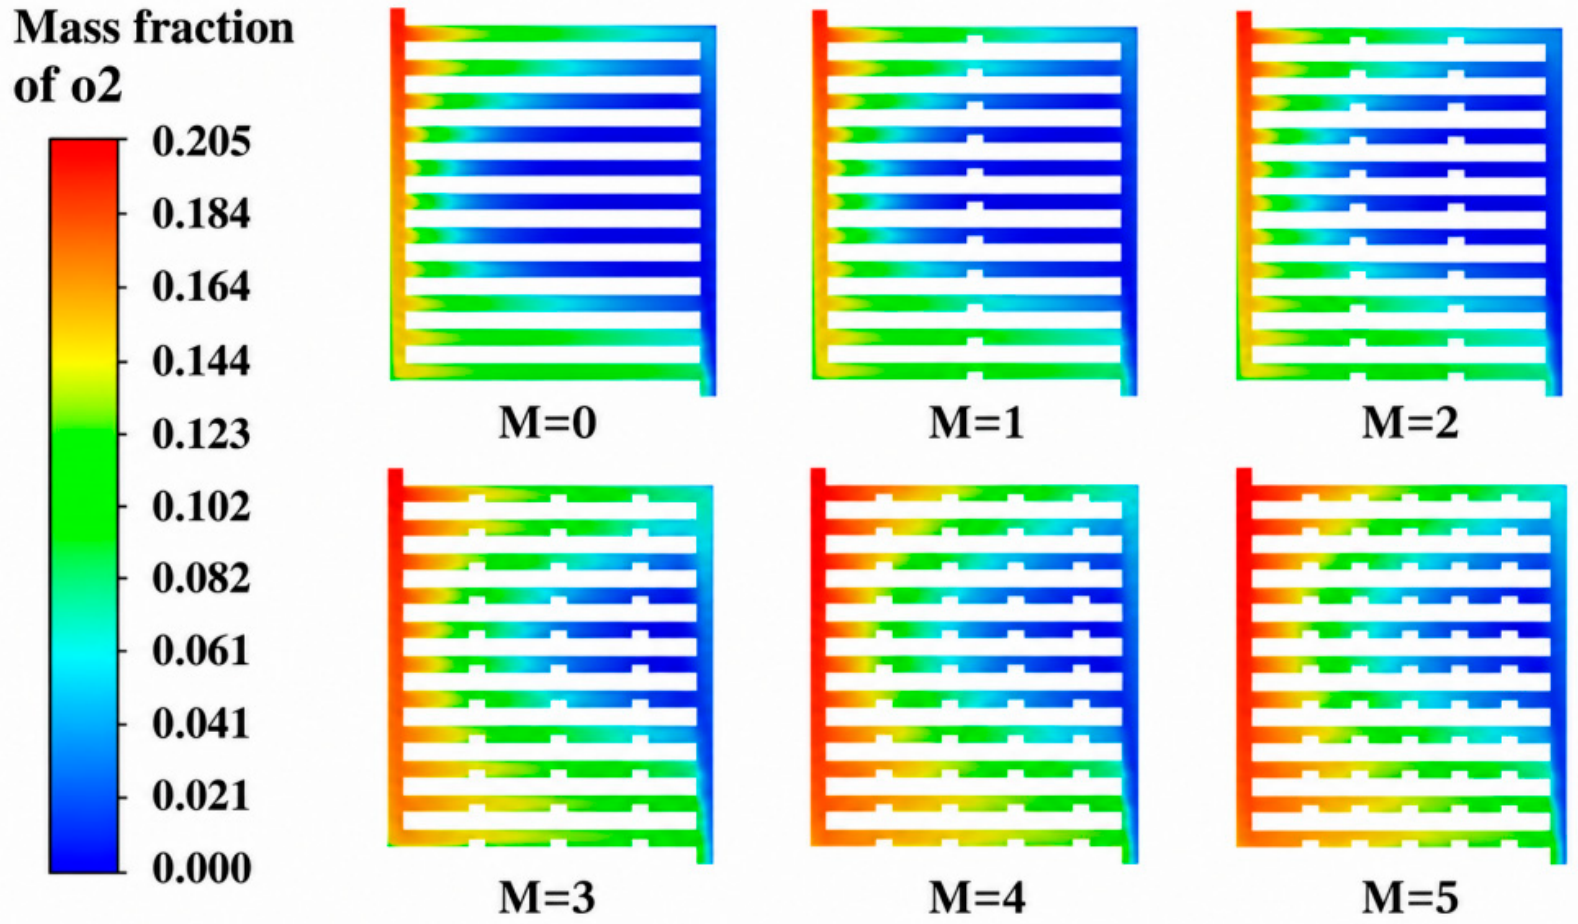
Figure 11 and
Figure 12 compare the cathode channel/GDL oxygen mass-fraction field and its distribution-uniformity index.
In terms of oxygen distribution, the parallel flow field presents an oxygen-deficient zone in the middle region near the outlet. The side-boss arrangement redirects gas flow and promotes oxygen transport toward the downstream channel and gas diffusion layer (GDL). As shown in
Figure 11 and
Figure 12, the low-oxygen region progressively contracts and the oxygen mass-fraction distribution becomes more uniform as the number of side-boss sets increases. With five sets, the oxygen-distribution uniformity improves by 11.61% relative to the conventional parallel flow field. Together with the 3.02% increase in peak power density, this result establishes the five-set geometry as the performance-oriented reference for the manufacturability analysis.
These results establish the electrochemical value of the five-set, 0.45 mm side-boss geometry. The following sections quantify its forming response and compare the effects of boss number, boss height, and punch speed on manufacturing feasibility.
3.2. Effect of Side-Boss Number on Formability
The number of repeated side-boss sets was varied from 0 to 5 while the height was fixed at 0.45 mm. The range spans a no-boss baseline and sparse-to-dense repeated layouts within the fixed 21 mm × 20 mm flow-field region without changing the principal channel count. The five-set case is retained because it was performance-motivated by the preliminary PEMFC simulations, whereas the remaining cases provide a controlled numerical screen of increasing local feature density.
The location trend is consistent with published metallic bipolar-plate studies. Feng et al. [
35] reported geometry-induced wrinkling near channel edges and raised features and cracking tendency near bottom fillets. Experimental–numerical investigations likewise identify tool-contact transitions and high-curvature regions as common thinning locations [
13,
17,
26,
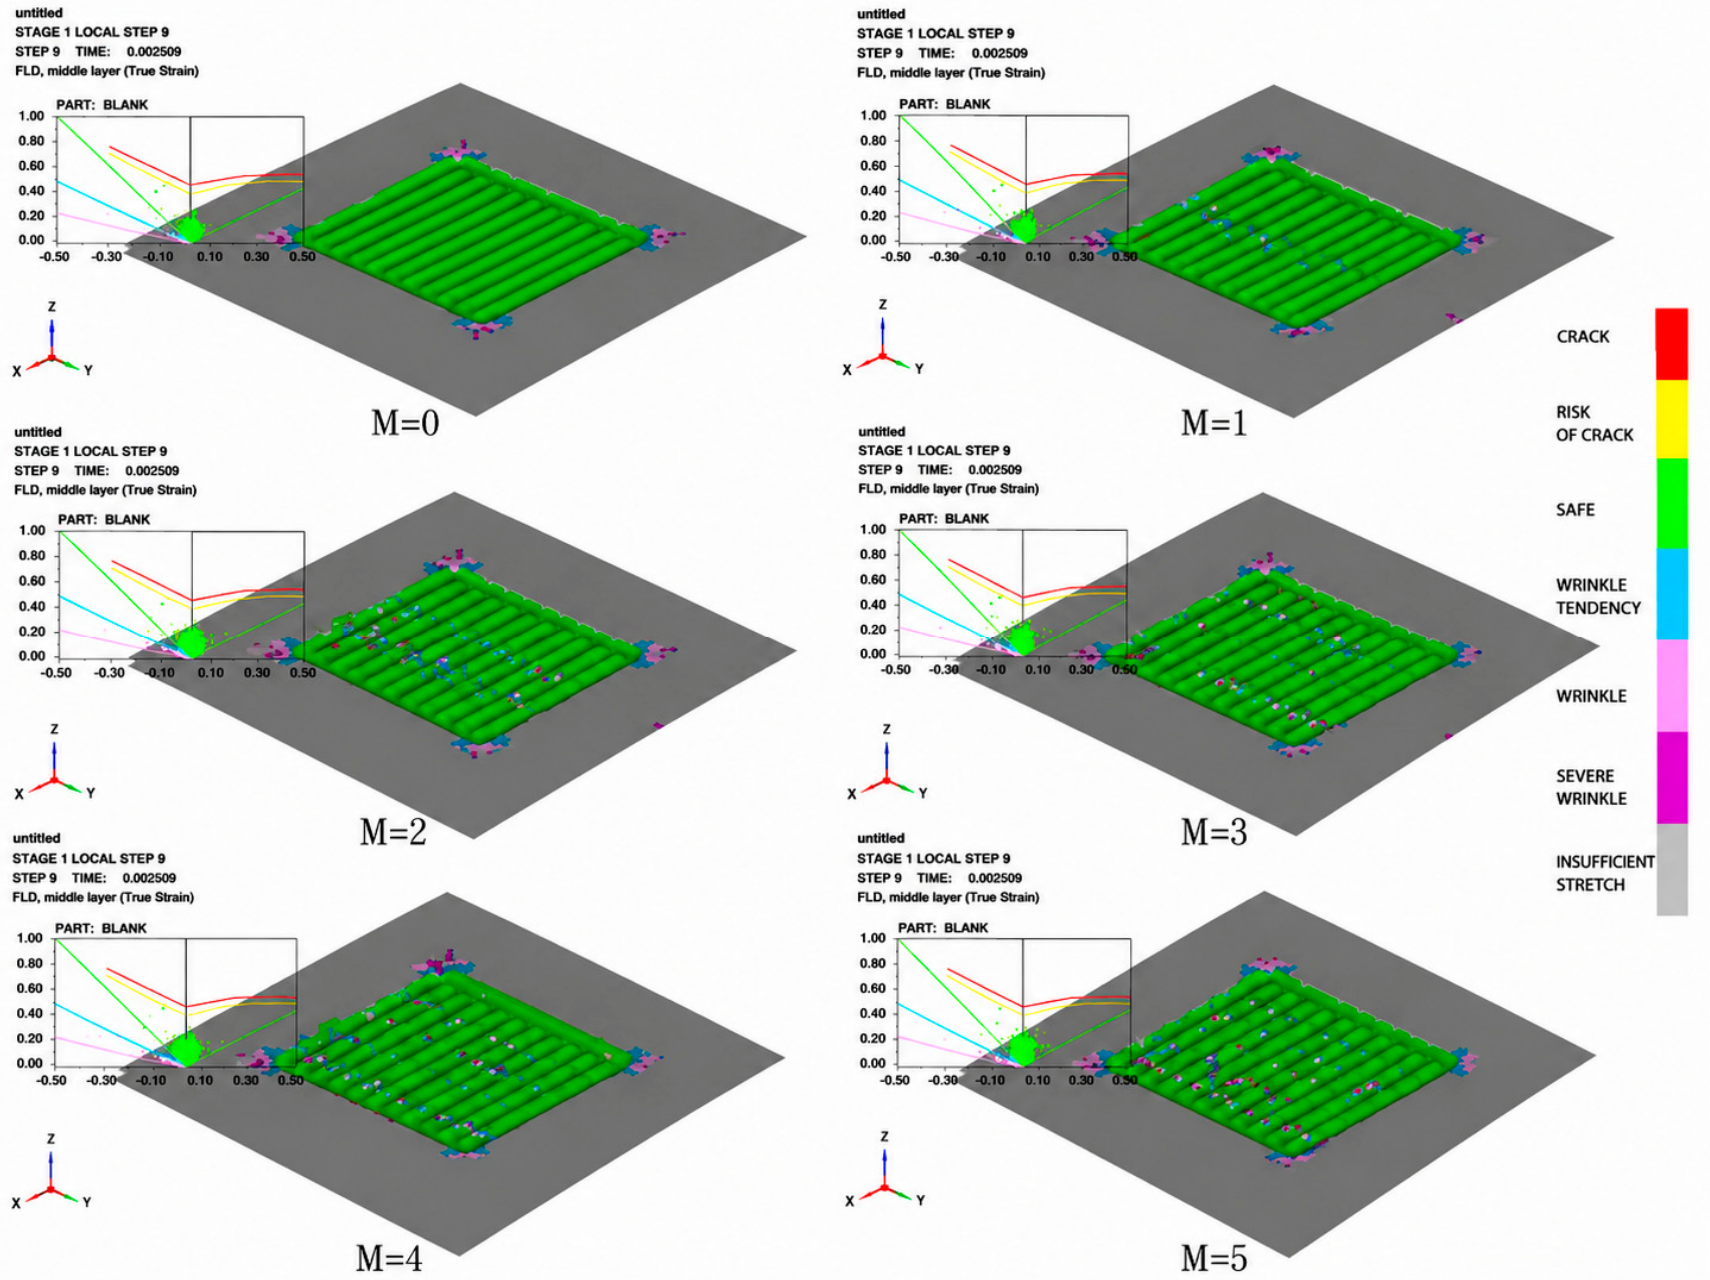
30]. The present side-boss geometry introduces additional high-curvature root and top regions, which explains why the critical location differs from the centre of the unmodified channel. This geometry-induced shift in strain path is compared across the six cases in the estimated-FLD maps of
Figure 13.
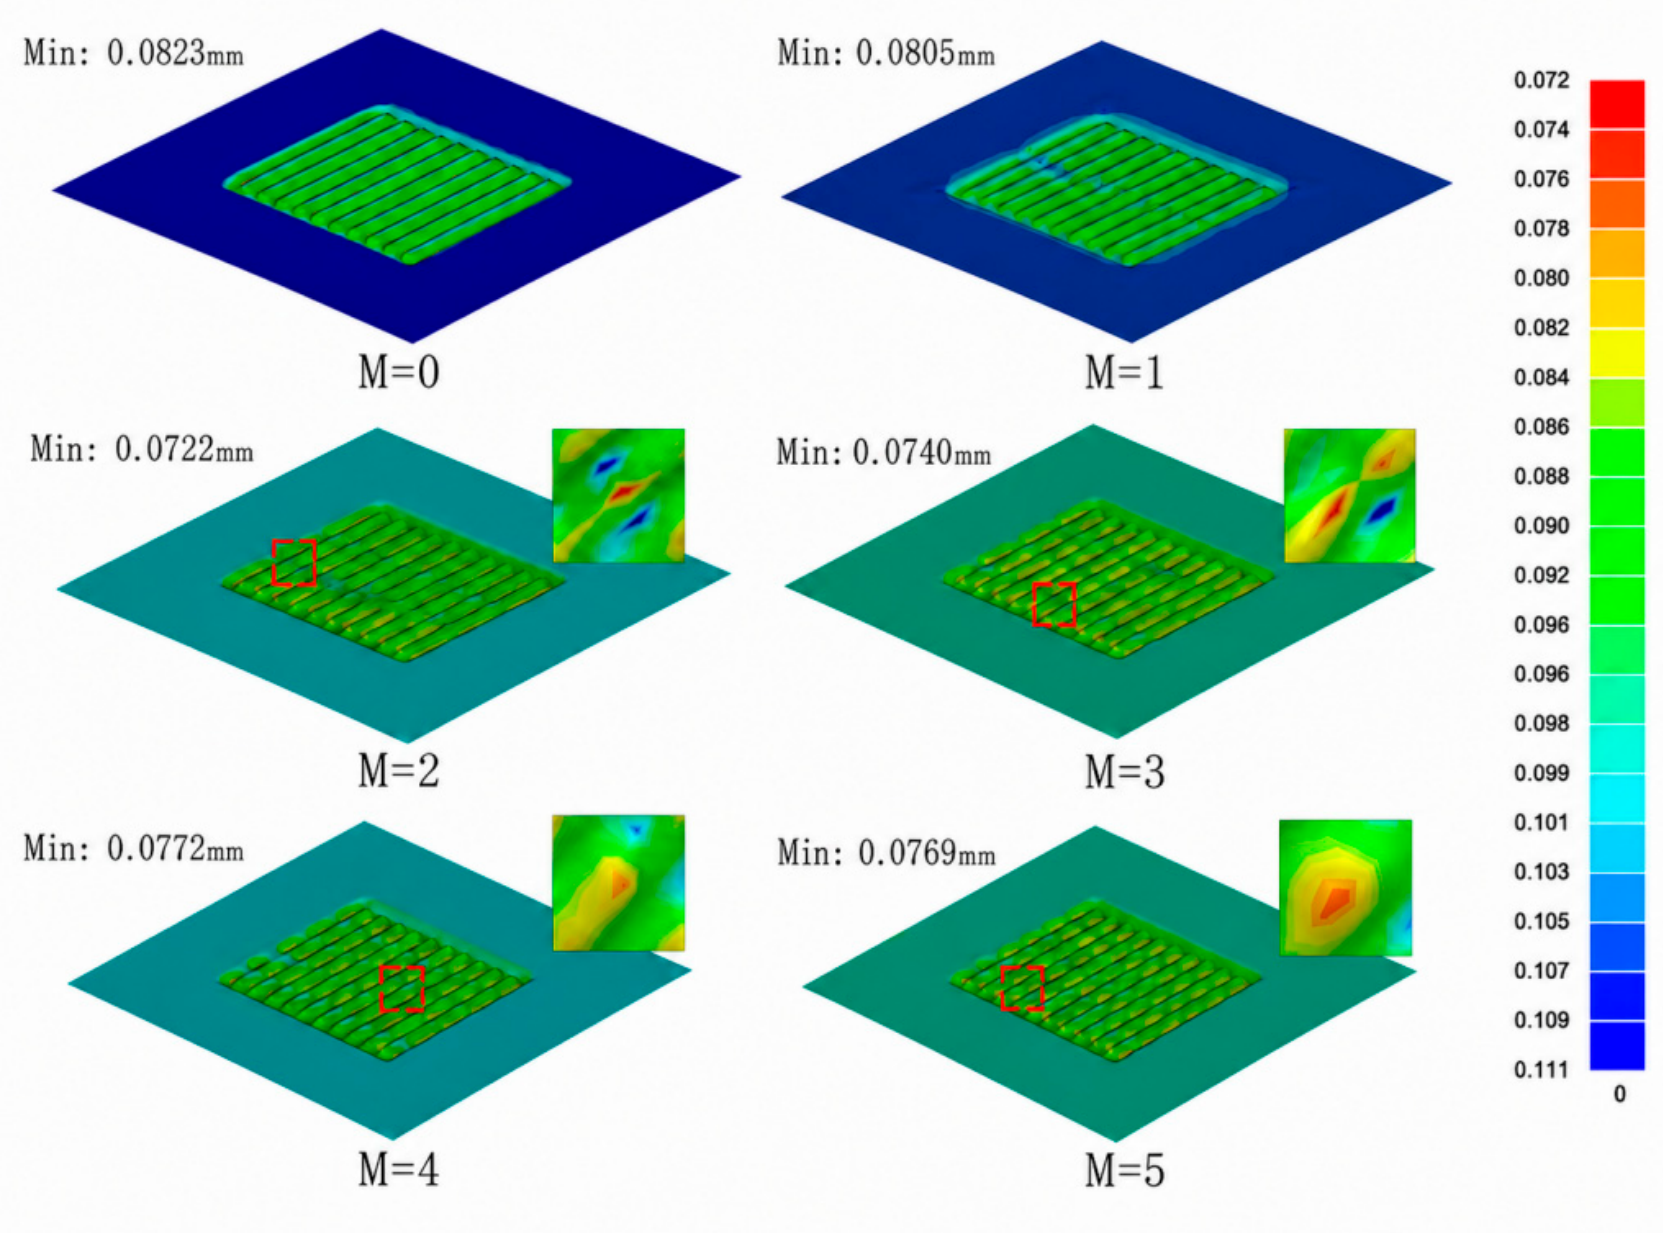
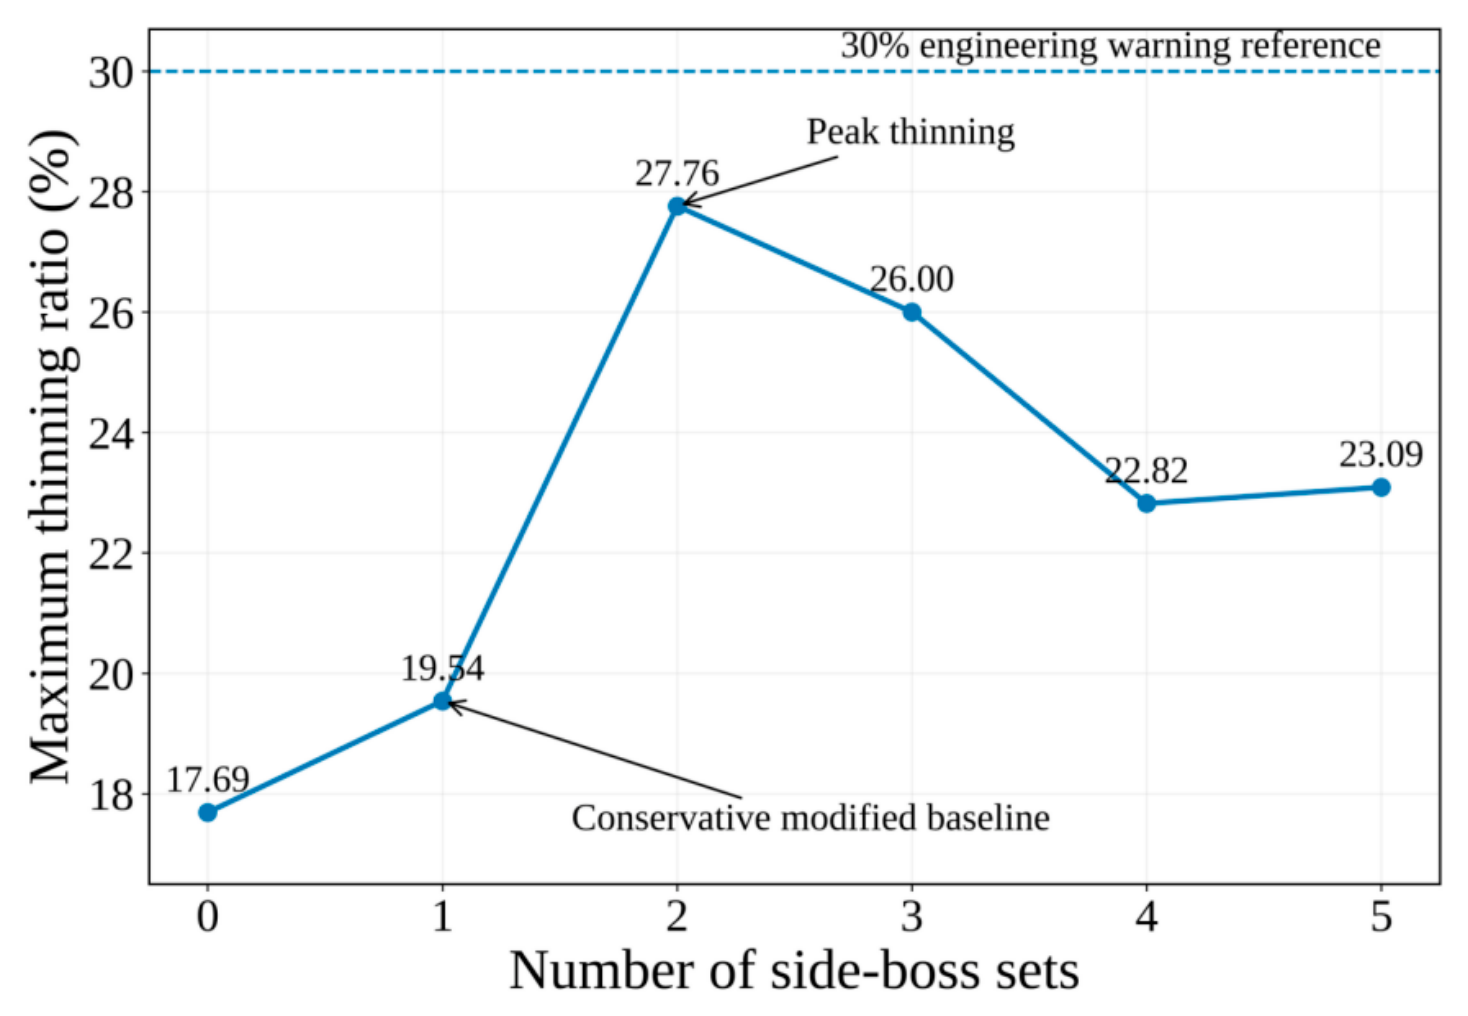
The thickness fields and maximum-thinning response are compared in
Figure 14 and
Figure 15, respectively. The maximum thinning ratios are 17.69%, 19.54%, 27.76%, 26.00%, 22.82%, and 23.09% for 0–5 side-boss sets, respectively. The response is non-monotonic. The initial introduction of one and two sets disrupts the uniform material-flow path and concentrates deformation at boss root chamfers. At three and four sets, neighbouring deformation zones redistribute the flow to some extent, reducing the scalar peak. At five sets, broader high-risk regions develop near boss tops and the flow-field edge even though the maximum thinning remains below that of the two-set case. This difference confirms that maximum thinning and estimated-FLD spatial continuity must be evaluated together.
Side-boss number therefore exhibits a non-monotonic response. One set gives the lowest thinning among the modified cases and remains below the estimated FLC. The two-set case shows local-necking tendency at the boss root chamfer, the three- and four-set cases approach the estimated FLC, and the five-set case develops spatially broader high-risk regions near the boss tops and flow-field edge. The five-set configuration therefore represents a clear performance–formability trade-off.
3.3. Effect of Side-Boss Height on Formability
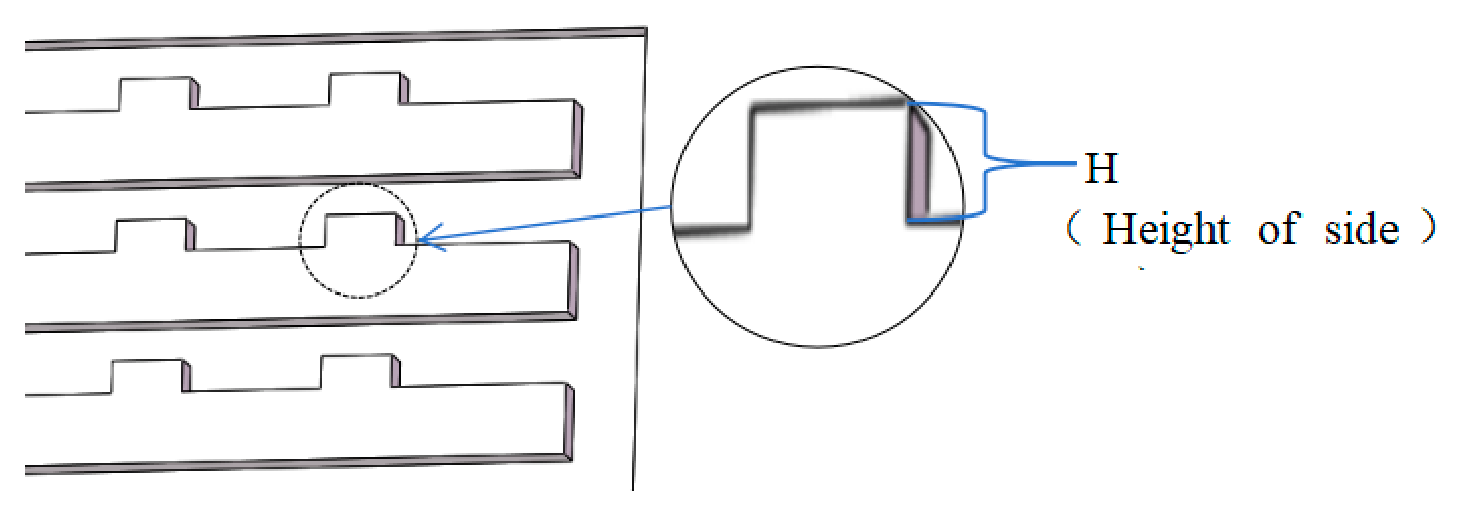
The height study used five side-boss sets to evaluate the performance-oriented configuration under progressively increasing forming severity. The geometric definition of H
b is given in
Figure 16, whereas
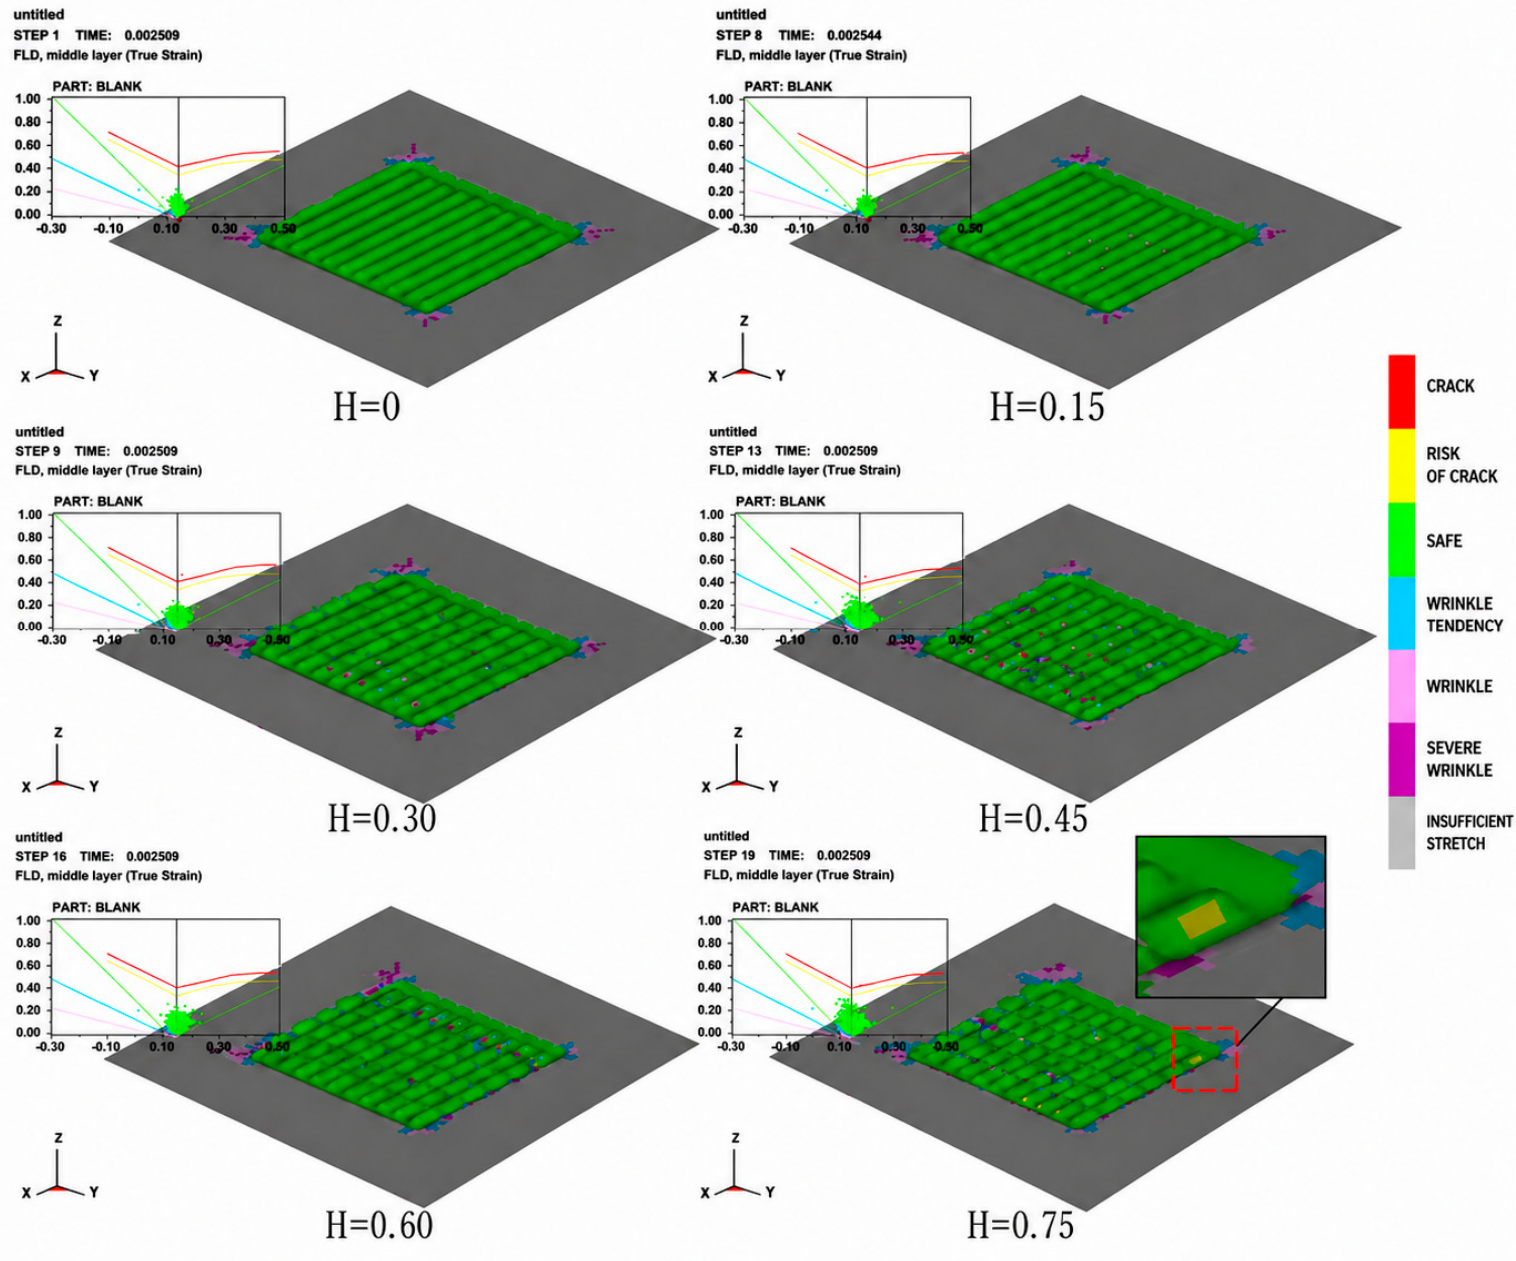
Figure 17 traces the corresponding evolution of the estimated-FLD response. Heights of 0, 0.15, 0.30, 0.45, 0.60, and 0.75 mm were selected at uniform 0.15 mm intervals. The upper values probe the high-severity range and reveal the transition from gradual to rapid loss of forming margin.
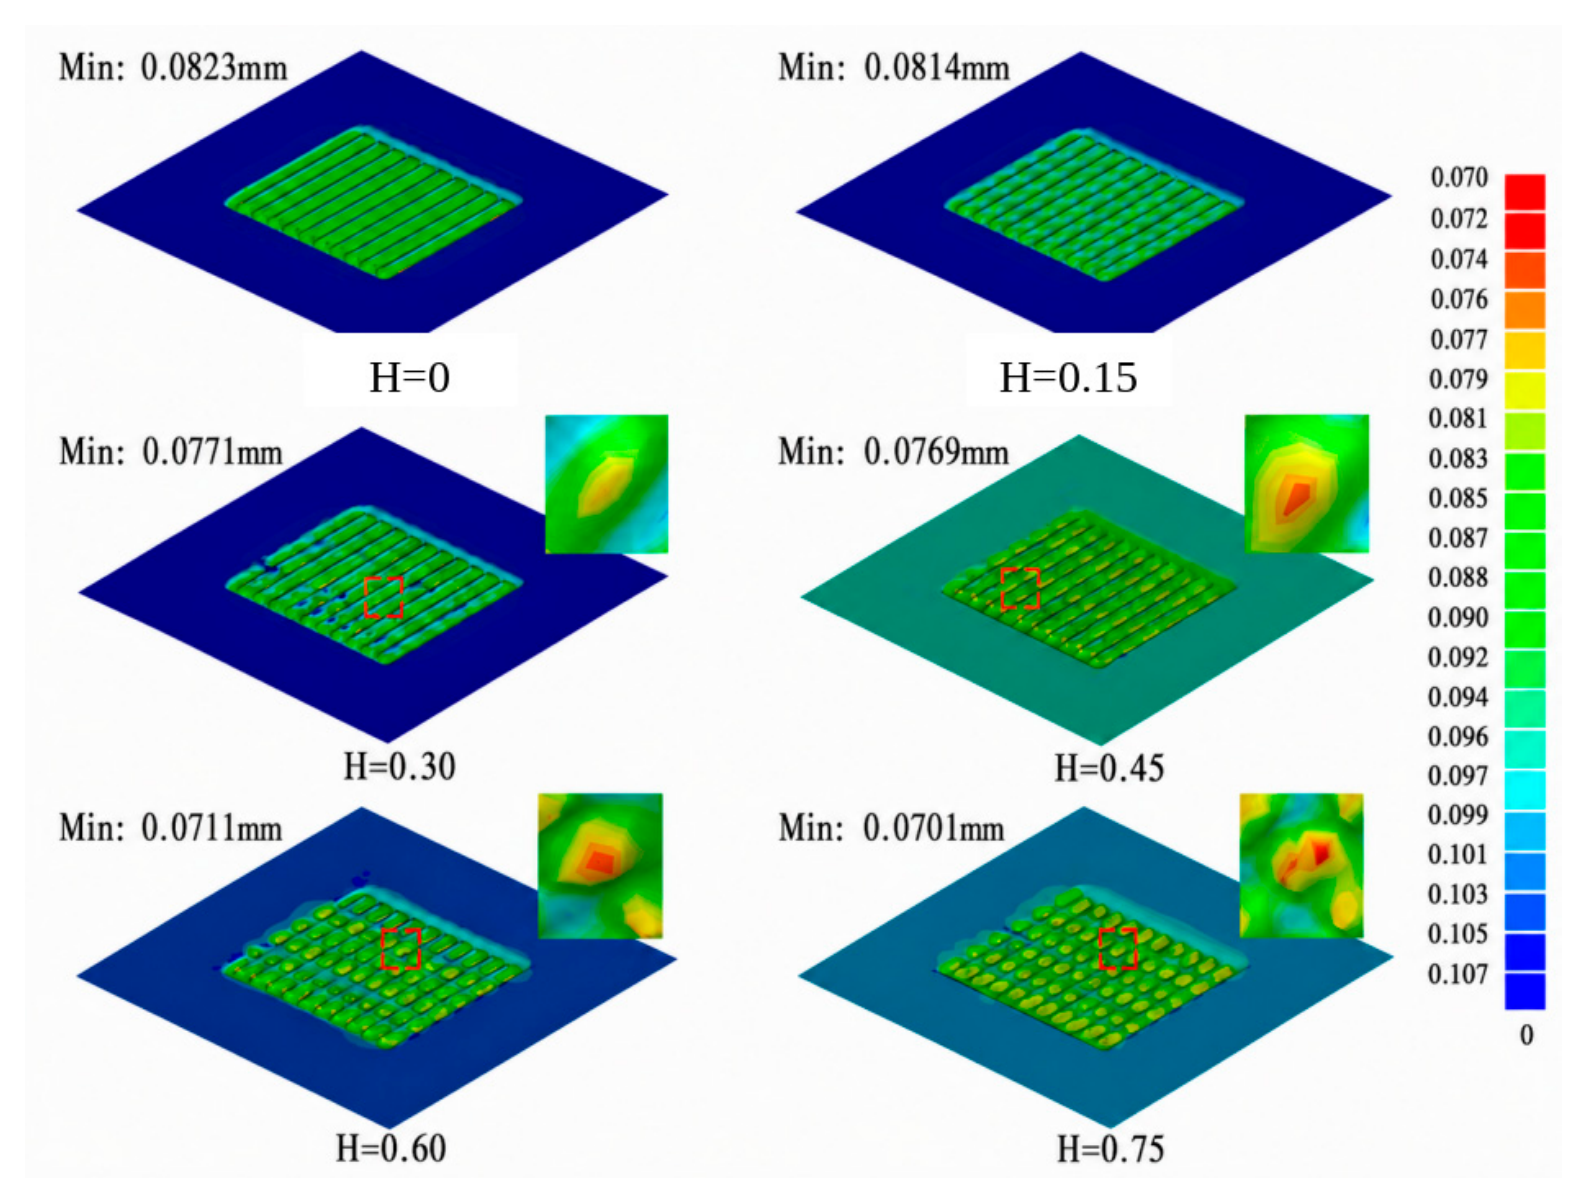
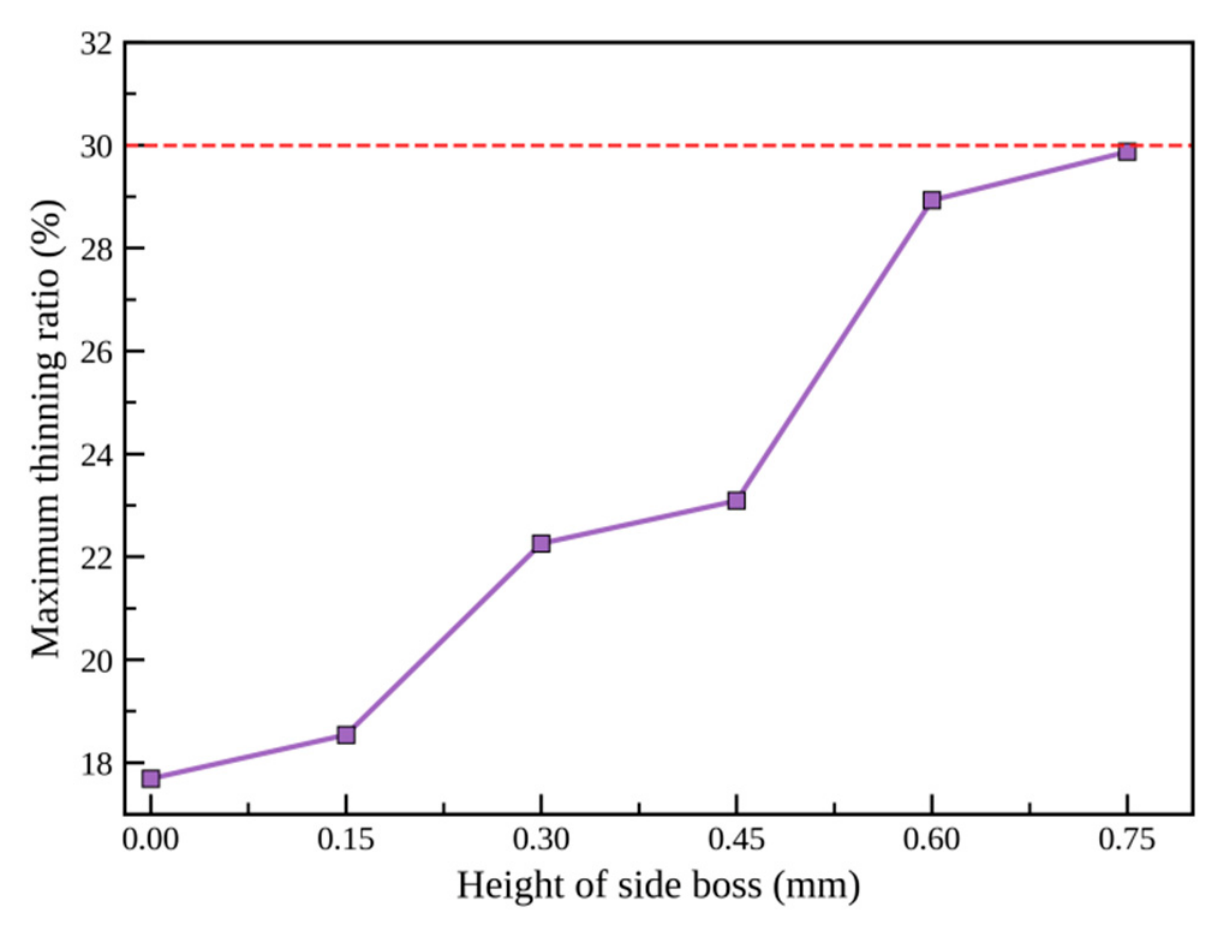
The thickness-field evolution and the associated maximum-thinning trend are compared in
Figure 18 and
Figure 19. As height increases from 0 to 0.75 mm, the maximum thinning ratio rises from 17.69% to 29.87%. The increase is moderate up to 0.45 mm, where the value is 23.09%, and becomes much steeper between 0.45 and 0.60 mm, reaching 28.93%. At 0.60 mm, isolated high-strain points approach or cross the estimated FLC. At 0.75 mm, the exceedance becomes spatially coherent and is accompanied by 29.87% thinning at the boss top and channel corner, identifying this case as an elevated local-necking-risk configuration.
The trend is physically consistent with increasing local bending–stretching demand and reduced material supply at steeper boss walls. A higher protrusion increases the geometric gradient at the boss root, enlarges the high-curvature contact zone, and increases the material draw-in required to fill the top and sidewall. Once the height exceeds approximately 0.45 mm, the strain field expands from a localized concentration toward a broader high-risk region. The transition between 0.45 and 0.60 mm reflects the combined influence of material response, friction, blank-holder restraint, local radii, and the forming-limit state and provides a practical threshold for process design under the reference conditions.
Industrial assessment additionally considers residual gas tightness, dimensional accuracy, springback, coating integrity, corrosion resistance, and production repeatability. Talebi-Ghadikolaee et al. [
13] reported a critical thinning magnitude of 33.45% for an experimentally investigated 0.1 mm stainless-steel stamping condition. The present 29.87% value is only 3.58 percentage points below that reference and is accompanied by a spatially coherent high-risk region.
Accordingly, H
b = 0.75 mm is classified as a narrow-margin, high-risk configuration for single-step stamping, while H
b = 0.60 mm already marks the onset of rapid forming deterioration. The dashed 30% line in
Figure 19 is used as an engineering warning reference that highlights this transition.
Under the present single-step process, side-boss height is the dominant geometric parameter. The Hb = 0.15 mm case remains below the estimated FLC with a maximum thinning ratio of 18.54%. The Hb = 0.30–0.45 mm cases form a transition range characterized by wrinkling tendency or proximity to the estimated FLC, whereas Hb ≥ 0.60 mm requires process modification to restore the forming margin.
3.4. Effect of Punch Speed on Formability
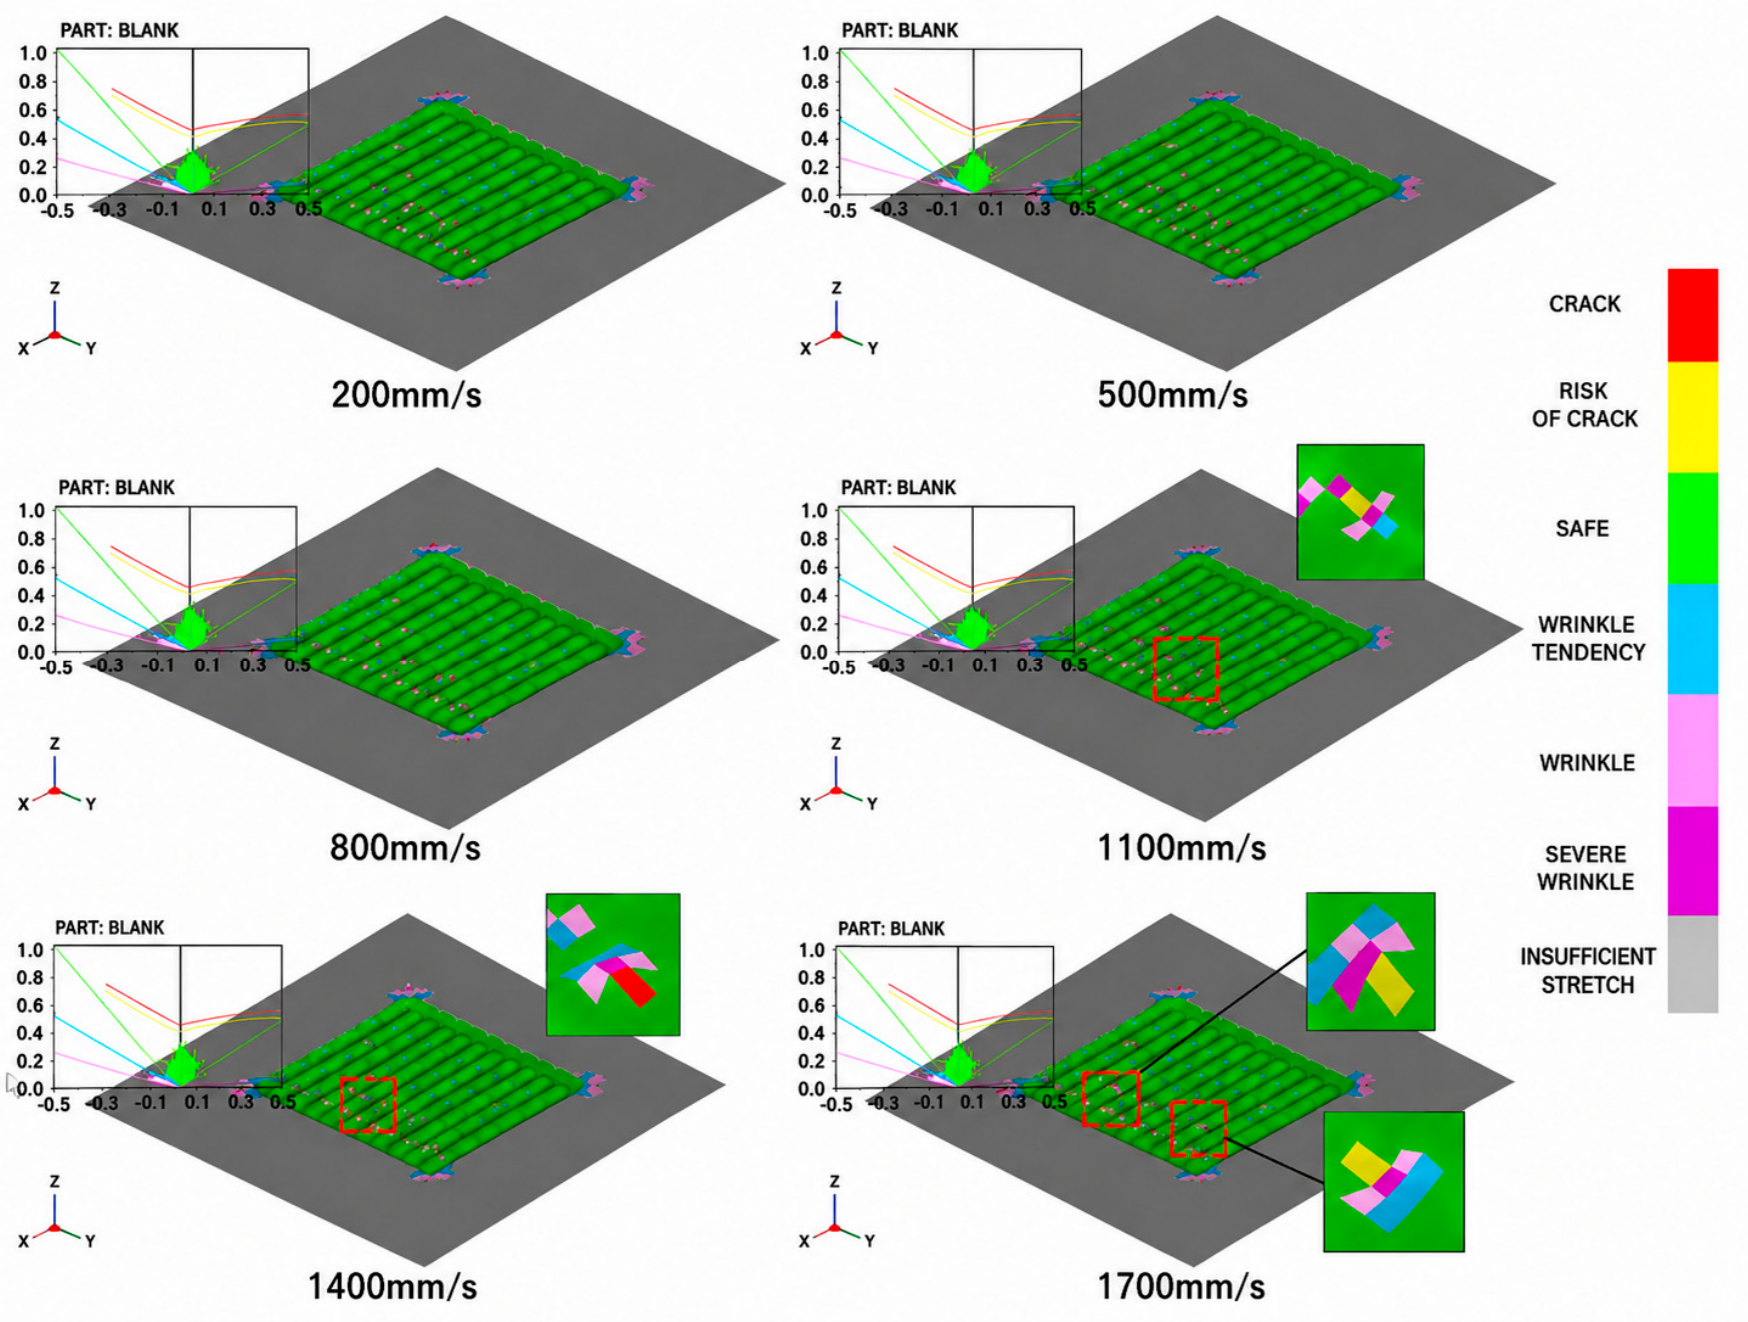
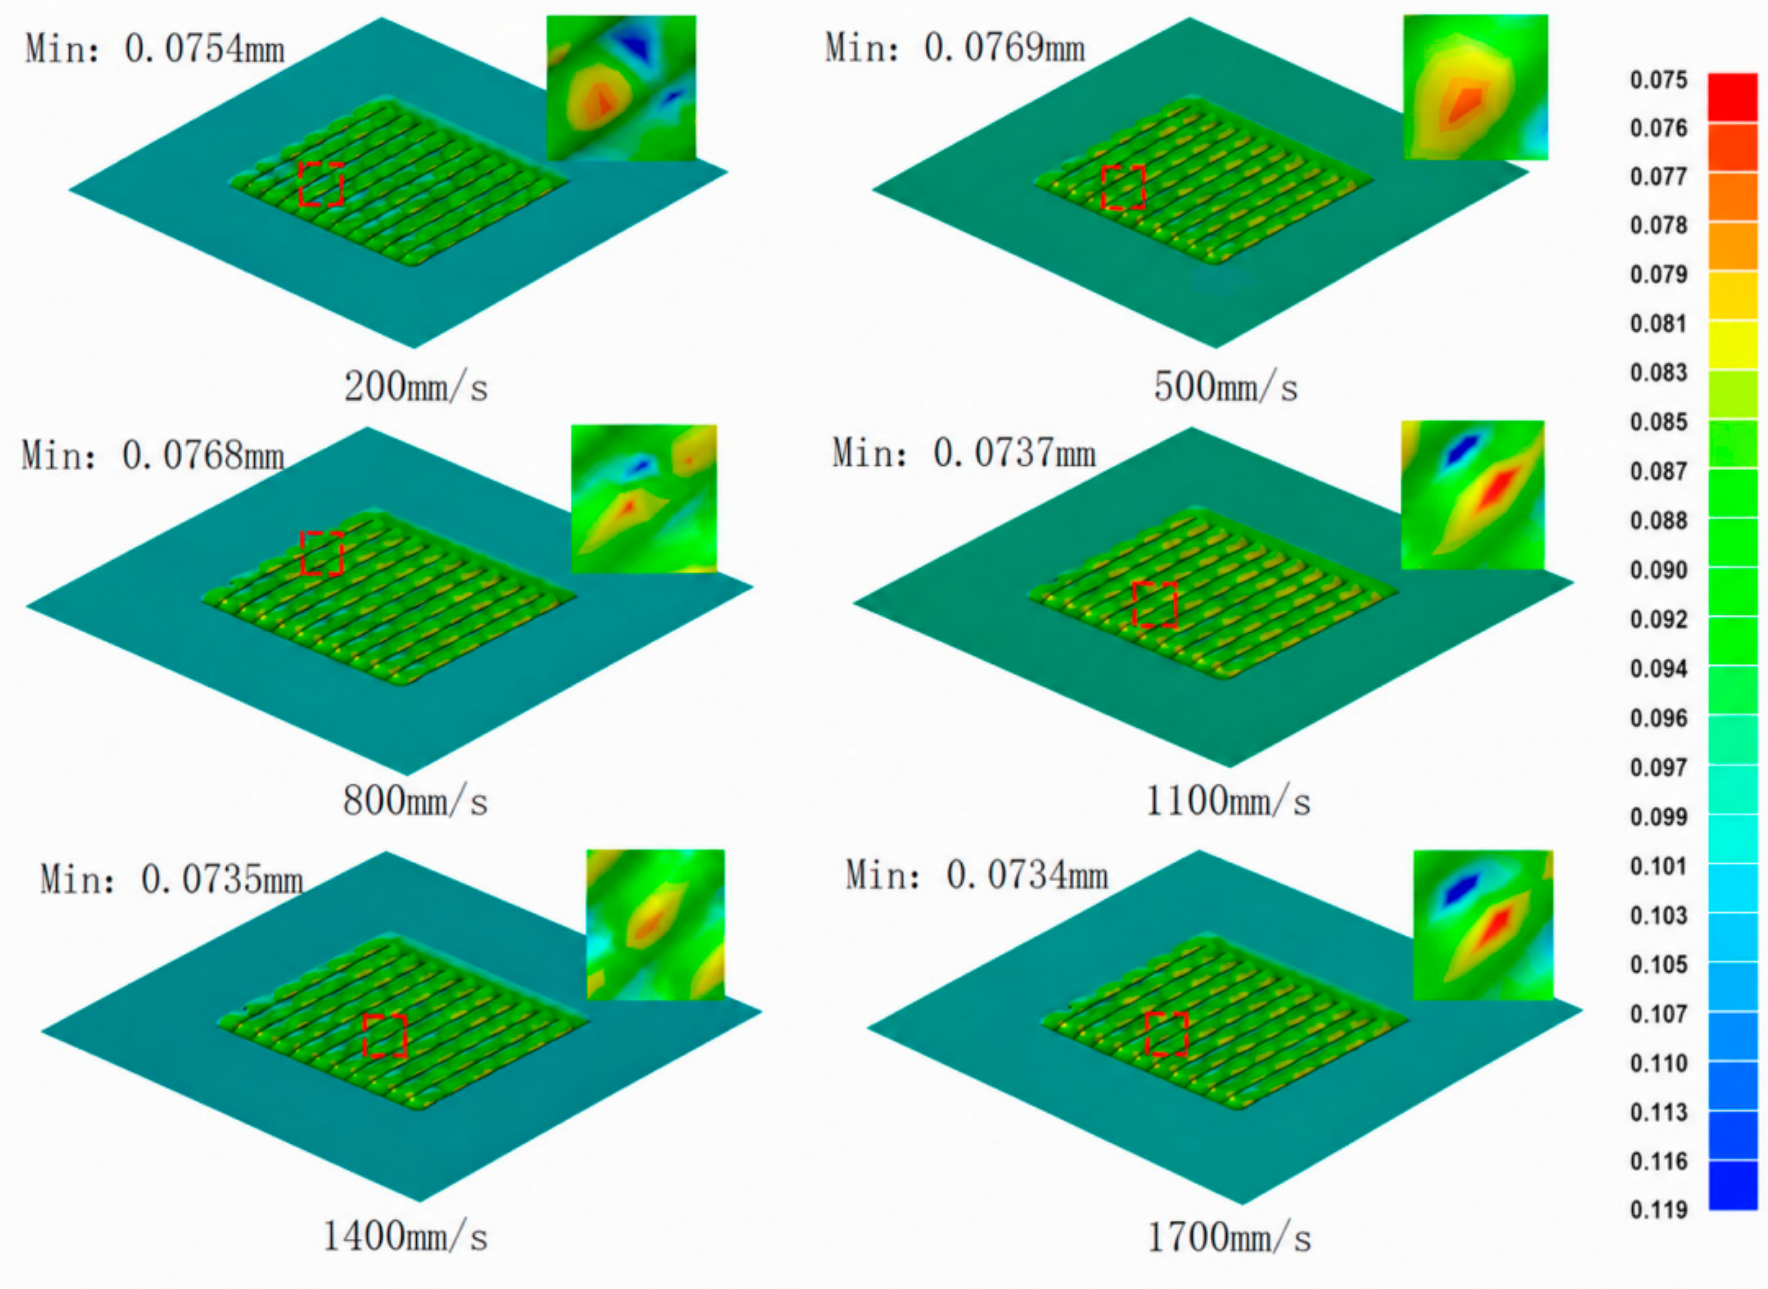
Punch speed was varied from 200 to 1700 mm/s while geometry, friction, and blank-holder force were fixed. The speed-dependent response reflects the combined influence of the adopted rate-dependent SS304 flow curves, evolving sheet–tool contact, inertia, and material-flow redistribution.
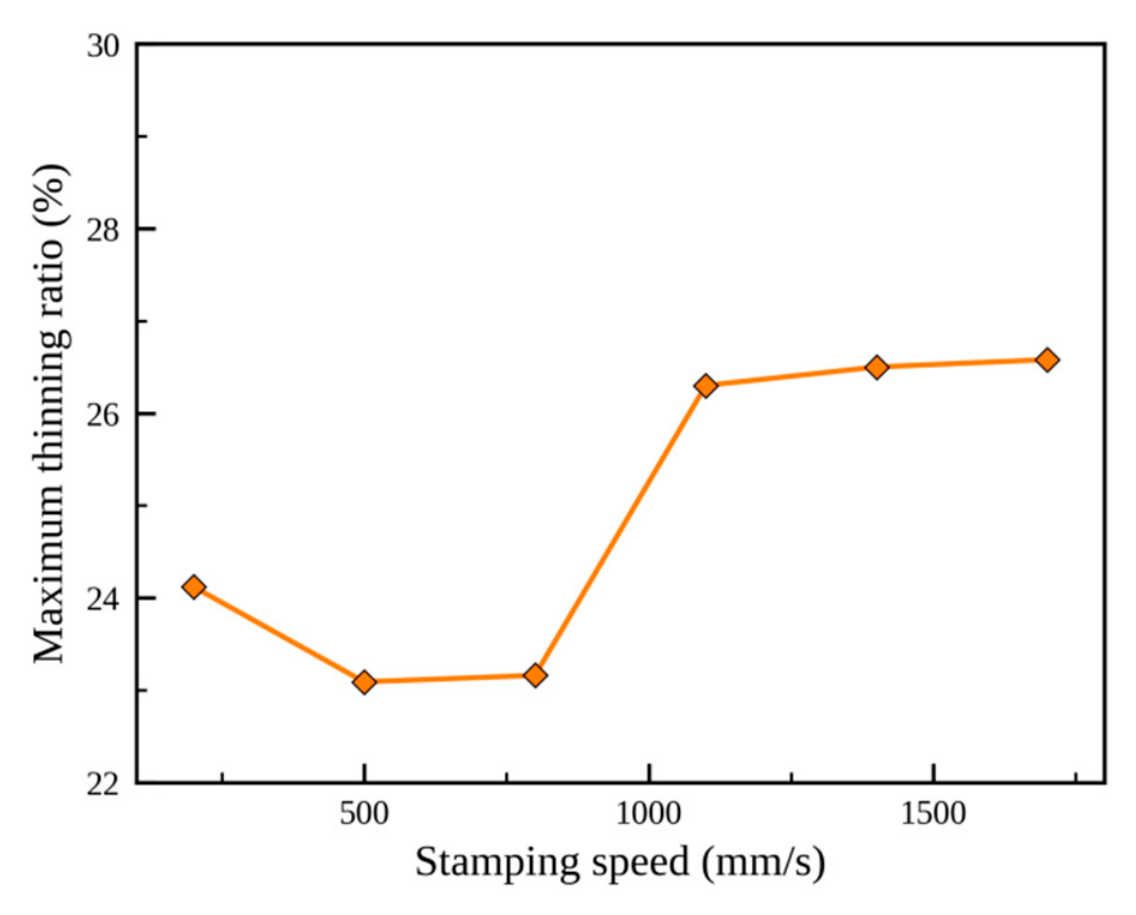
The maximum thinning ratios at 200, 500, and 800 mm/s are 24.60%, 23.09%, and 23.16%, respectively. The difference between 500 and 800 mm/s is only 0.07 percentage points, confirming a low-sensitivity interval over 200–800 mm/s. The 500 mm/s case gives the lowest discrete thinning value among the sampled speeds.
At 1100 mm/s, the maximum thinning ratio rises to 26.30% and local points near the side-boss roots reach the estimated-FLC warning region. The estimated-FLD maps in
Figure 20 show how the elevated-risk region broadens around the root and chamfer at 1400 and 1700 mm/s, while maximum thinning stabilizes at 26.50% and 26.58%, respectively. These results define a transition from a low-sensitivity regime to an elevated local-necking-risk regime near 1100 mm/s.
The transition near 1100 mm/s is consistent with the combined effects of rate-dependent strengthening, accelerated contact evolution, inertial constraint, and reduced redistribution time at the side-boss roots. As the speed increases further, the maximum thinning ratio approaches a plateau near 26.5%, indicating that the deformation pattern becomes increasingly governed by the fixed local geometry and contact path.
The corresponding thickness distributions and maximum-thinning trend are compared in
Figure 21 and
Figure 22. At 200, 500, and 800 mm/s, the maximum thinning ratios are 24.60%, 23.09%, and 23.16%, respectively. Relative to 200 mm/s, the 500 and 800 mm/s cases are lower by approximately 6.14% and 5.85%, while the difference between 500 and 800 mm/s is only 0.07 percentage points (approximately 0.30%). At 1100 mm/s, the ratio increases to 26.30%, which is 13.9% higher than the 500 mm/s case; the values then remain near 26.5% at 1400–1700 mm/s. The quantitative trend identifies 200–800 mm/s as a low-sensitivity interval and ≥1100 mm/s as an elevated-risk interval, with 500 mm/s selected as the representative process baseline.
Accordingly, 200–800 mm/s constitutes a low-sensitivity speed interval under the investigated conditions. The 500 mm/s case is retained as the representative baseline because it gives the lowest sampled thinning value, while 1100 mm/s marks the onset of the elevated-risk regime.
3.5. Manufacturing Implications and Design Guidance
The one-factor matrix resolves the dominant first-order effects and their physical coupling. Side-boss height controls the bending–stretching demand and material supply, boss number and pitch govern the overlap of adjacent strain fields, and punch speed modifies rate response, contact evolution, inertia, and redistribution. The factor-specific guidance below therefore applies to μ = 0.125, FBH = 1800 N, the present tooling geometry, and the adopted single-step stamping route.
For the high-severity 0.60–0.75 mm geometries, established forming routes offer different mechanisms for redistributing deformation: multi-stage stamping divides the total shape change into successive increments, hydroforming and flexible-die forming provide distributed support, and warm or hot forming reduces instantaneous flow stress. Their practical selection should balance filling accuracy, springback, surface condition, cycle time, and tooling cost. The quantitative thinning responses, critical locations, and corresponding estimated-FLD interpretations are summarized in
Table 6, while the factor-specific design guidance derived from the present simulations is presented in
Table 7.
One side-boss set, Hb ≤ 0.15 mm, and 200–500 mm/s define the conservative factor-wise forming domain. The performance-oriented M = 5, Hb = 0.45 mm configuration combines a 3.02% increase in peak power density and an 11.61% increase in oxygen-distribution uniformity with a maximum thinning ratio of 23.09%, thereby providing a quantitative performance–formability reference. Heights of 0.60 mm or greater and punch speeds of 1100 mm/s or greater form the elevated-risk domain under the investigated conditions.
5. Limitations and Future Work
The conclusions of this study are based on numerical simulation. Therefore, the predicted thickness distribution and FLD states should be regarded as comparative design indicators. Future work should include physical stamping tests, thickness measurements of formed samples, and comparison between measured and simulated forming results. Such validation is necessary before the proposed design window can be used for actual production tooling.
In addition, other process variables, such as blank-holder force, friction coefficient, die clearance, temperature, and multi-stage forming strategy, should be investigated to improve the robustness of the forming process.
For practical PEMFC applications, the forming feasibility discussed in this paper should eventually be combined with electrochemical performance, corrosion resistance, interfacial contact resistance, and surface coating durability in order to evaluate the overall suitability of side-boss metallic bipolar plates.



 ,
,