4.1. Constitutive Model
UVCAT is a hybrid forming process that integrates ultrasonic vibration into CAT. The forming behavior becomes inherently complex due to the coupling of multiple mechanisms, including stress relaxation, creep, dynamic stress effects, and springback [
26,
27]. To achieve precise control over this hybrid forming process, it is necessary to account not only for the elastic and plastic deformation of the alloy but also for the viscous deformation arising from these mechanisms. By incorporating elastic components into the Bingham model [
28,
29], a simplified elastoviscoplastic constitutive model can be expressed as follows:
Based on the elastoviscoplastic physical model, the viscoelastic Kelvin model is incorporated into the viscoplastic Bingham model, resulting in the following viscoplastic constitutive model:
In the equation,
H(t) = exp(−η
1−1Et). Considering the combined mechanisms of subsequent yielding, strain, strain rate, and elastic strain, the dynamic stress function based on viscoelastic plasticity can be derived as:
In the equation, εe(t) is the integral of Equation (2), and εvp(t) is the viscoplastic function, with η1 and η2 representing the viscosity strain coefficients of the elastic and plastic components, respectively. The above viscoplastic constitutive model reveals the mechanism of the volume effect in ultrasonic vibration-assisted creep-aging forming of aluminum. From the equation, it can be seen that the vibration frequency is directly proportional to the dynamic stress. When dynamic stress is excited by low-frequency ultrasonic vibration, it leads to an average stress that is lower than the deformation stress under quasi-static conditions. Additionally, the stress superposition effect caused by ultrasonic vibration is more significant at low frequencies.
In the UVCAT forming process, no surface effects exist. Therefore, based on the volume effect, the viscoplastic rheological model of 7055 aluminum under cyclic stress in one cycle, derived from dislocation theory, is as follows:
In the equation, when σ > 0, κd = −κ, when σ < 0, κd = κ, ε0 quasi-static strain, A and σa are the amplitude and excitation stress, respectively.
4.2. Boundary Conditions and Fe Modelling
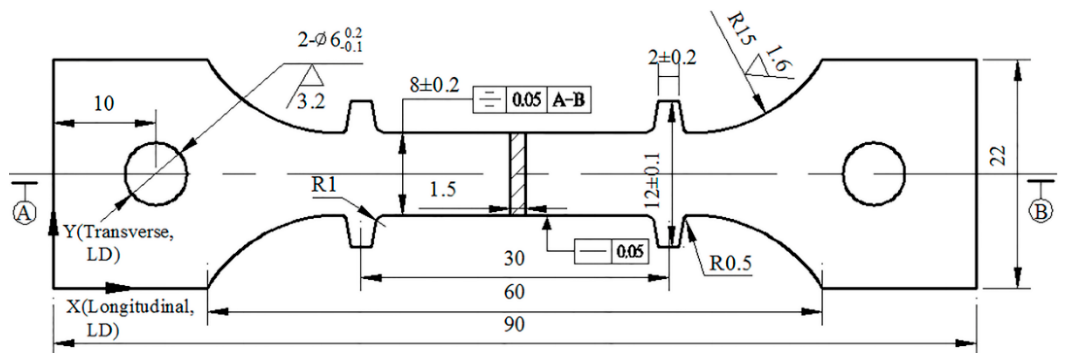
In the finite element modeling, the tensile specimen is divided into three sections: left, middle, and right. The left and right sections of the gauge length are set as analytical rigid bodies, while the middle section is set as a deformable body. The true stress–strain and creep strain data of the material can be obtained through experiments, and then, by using Equation (5), the required plasticity parameters for the simulation can be calculated. The formula for plastic strain
εpl is as follows:
In the equation,
σ and
ε′ represent the true stress and true strain, respectively,
εe is the elastic strain, E is the elastic modulus, and
σcr is the creep strain. The ultrasonic vibration signal is applied using the *Amplitude/Periodic type, with periodic motion applied to the right end of the specimen according to the amplitude curve (Equation (6)) [
30].
Given the minimal influence of interfacial friction during the UVCAT process, the effect of vibration on contact friction is neglected, i.e., surface effects are considered negligible. In the UVCAT simulation, vibration frequency and amplitude are treated as two independent variables to analyze their influence on the creep strain and stress during the creep tensile process, thereby enabling investigation of the stress superposition effect associated with the volumetric effects of ultrasonic vibration.
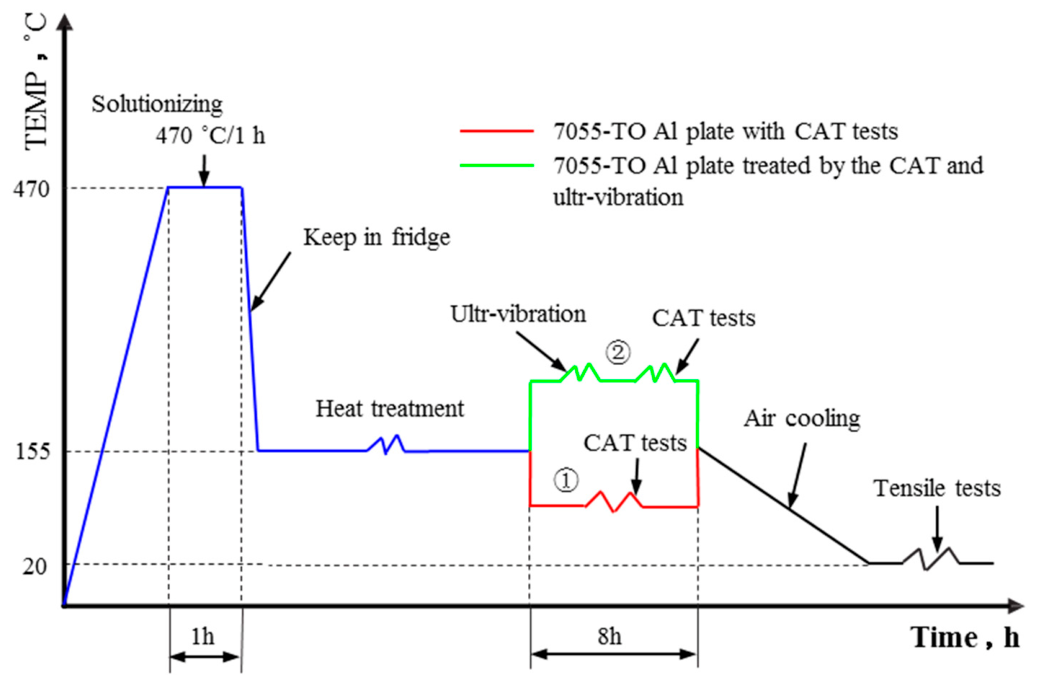
The simulation parameters are set as follows: creep tensile rate of 1 mm/min, creep temperature of 155 °C, and creep stress of 130 MPa. Ultrasonic vibration is applied after 2 h of creep, maintained continuously for 1 h, and then immediately ceased. The total creep tensile duration is 8 h. Based on the experimental conditions described above, the designed UVCAT simulation scheme is summarized in
Table 6. The simulation software and version used is Abaqus 2020.
4.3. Results and Analysis
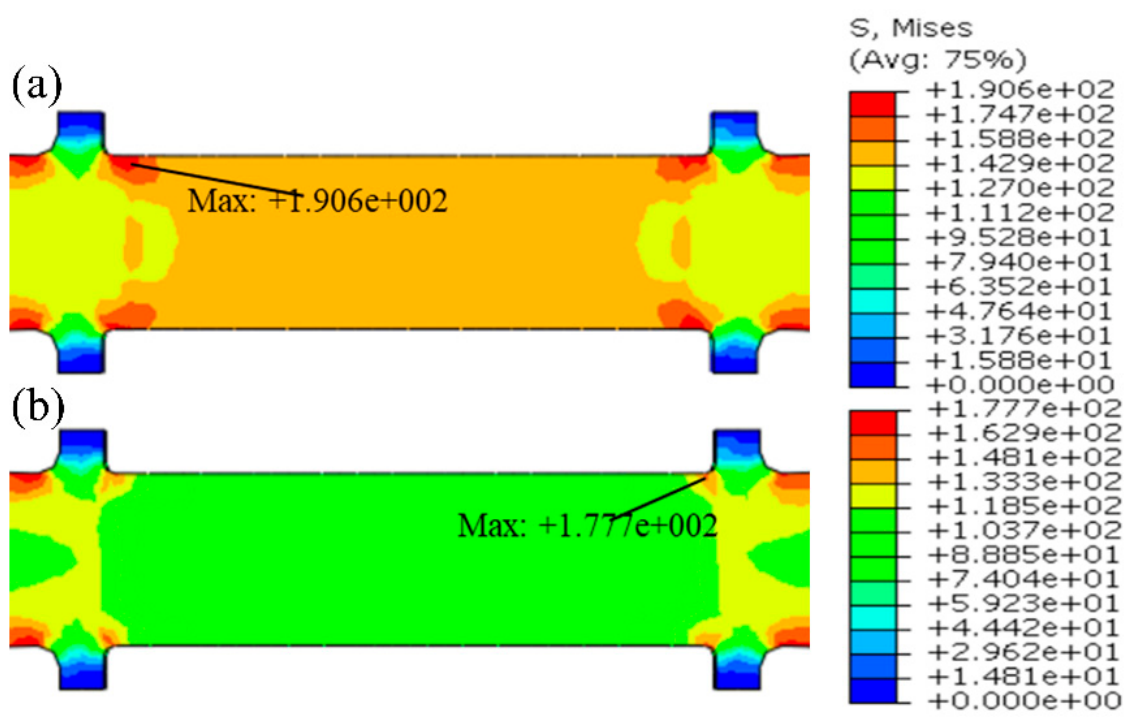
Figure 10 presents the stress distribution contours for the non-vibrated specimen and the specimen tested with a vibration amplitude of 12.53 μm. By comparing the simulation results with the experimental values, it can be observed that before unloading, the maximum stress in the non-vibrated specimen is 190.6 MPa, which is 4.4 MPa higher than the experimental value of 186.2 MPa. For the vibrated specimen, the simulated maximum stress is 177.7 MPa, which is 1.5 MPa higher than the experimental value of 176.2 MPa. The stress distribution also reveals a significant reduction in material stress under ultrasonic vibration, which is attributed to the softening effect induced by the vibration.
The comparison indicates that the discrepancies between the simulation results and the experimental data are within the acceptable engineering range, demonstrating that the established finite element model accurately describes the UVCAT process for the 7055 aluminum alloy.
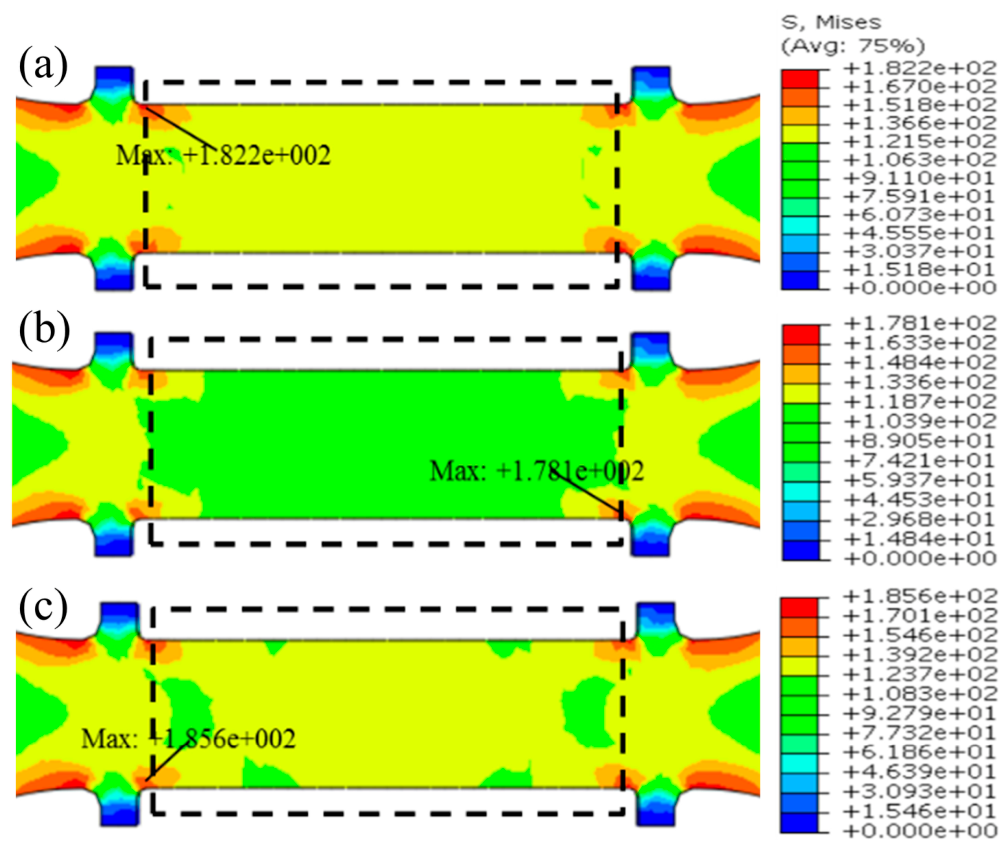
Figure 11 presents the stress distribution contours of the tensile specimens under different amplitude conditions. Focusing on the specimen gauge section (outlined by the black dashed line) in conjunction with
Figure 10a, the overall stress distribution appears broadly similar across the different amplitudes. However, the material’s susceptibility to softening exhibits amplitude-dependent behavior. The maximum stress values for amplitudes of 0, 8, 12, and 16 μm are 190.6, 182.2, 178.1, and 185.6 MPa, respectively. Evidently, the maximum stress decreases initially and then increases with increasing amplitude, reaching a minimum at an amplitude of 12 μm.
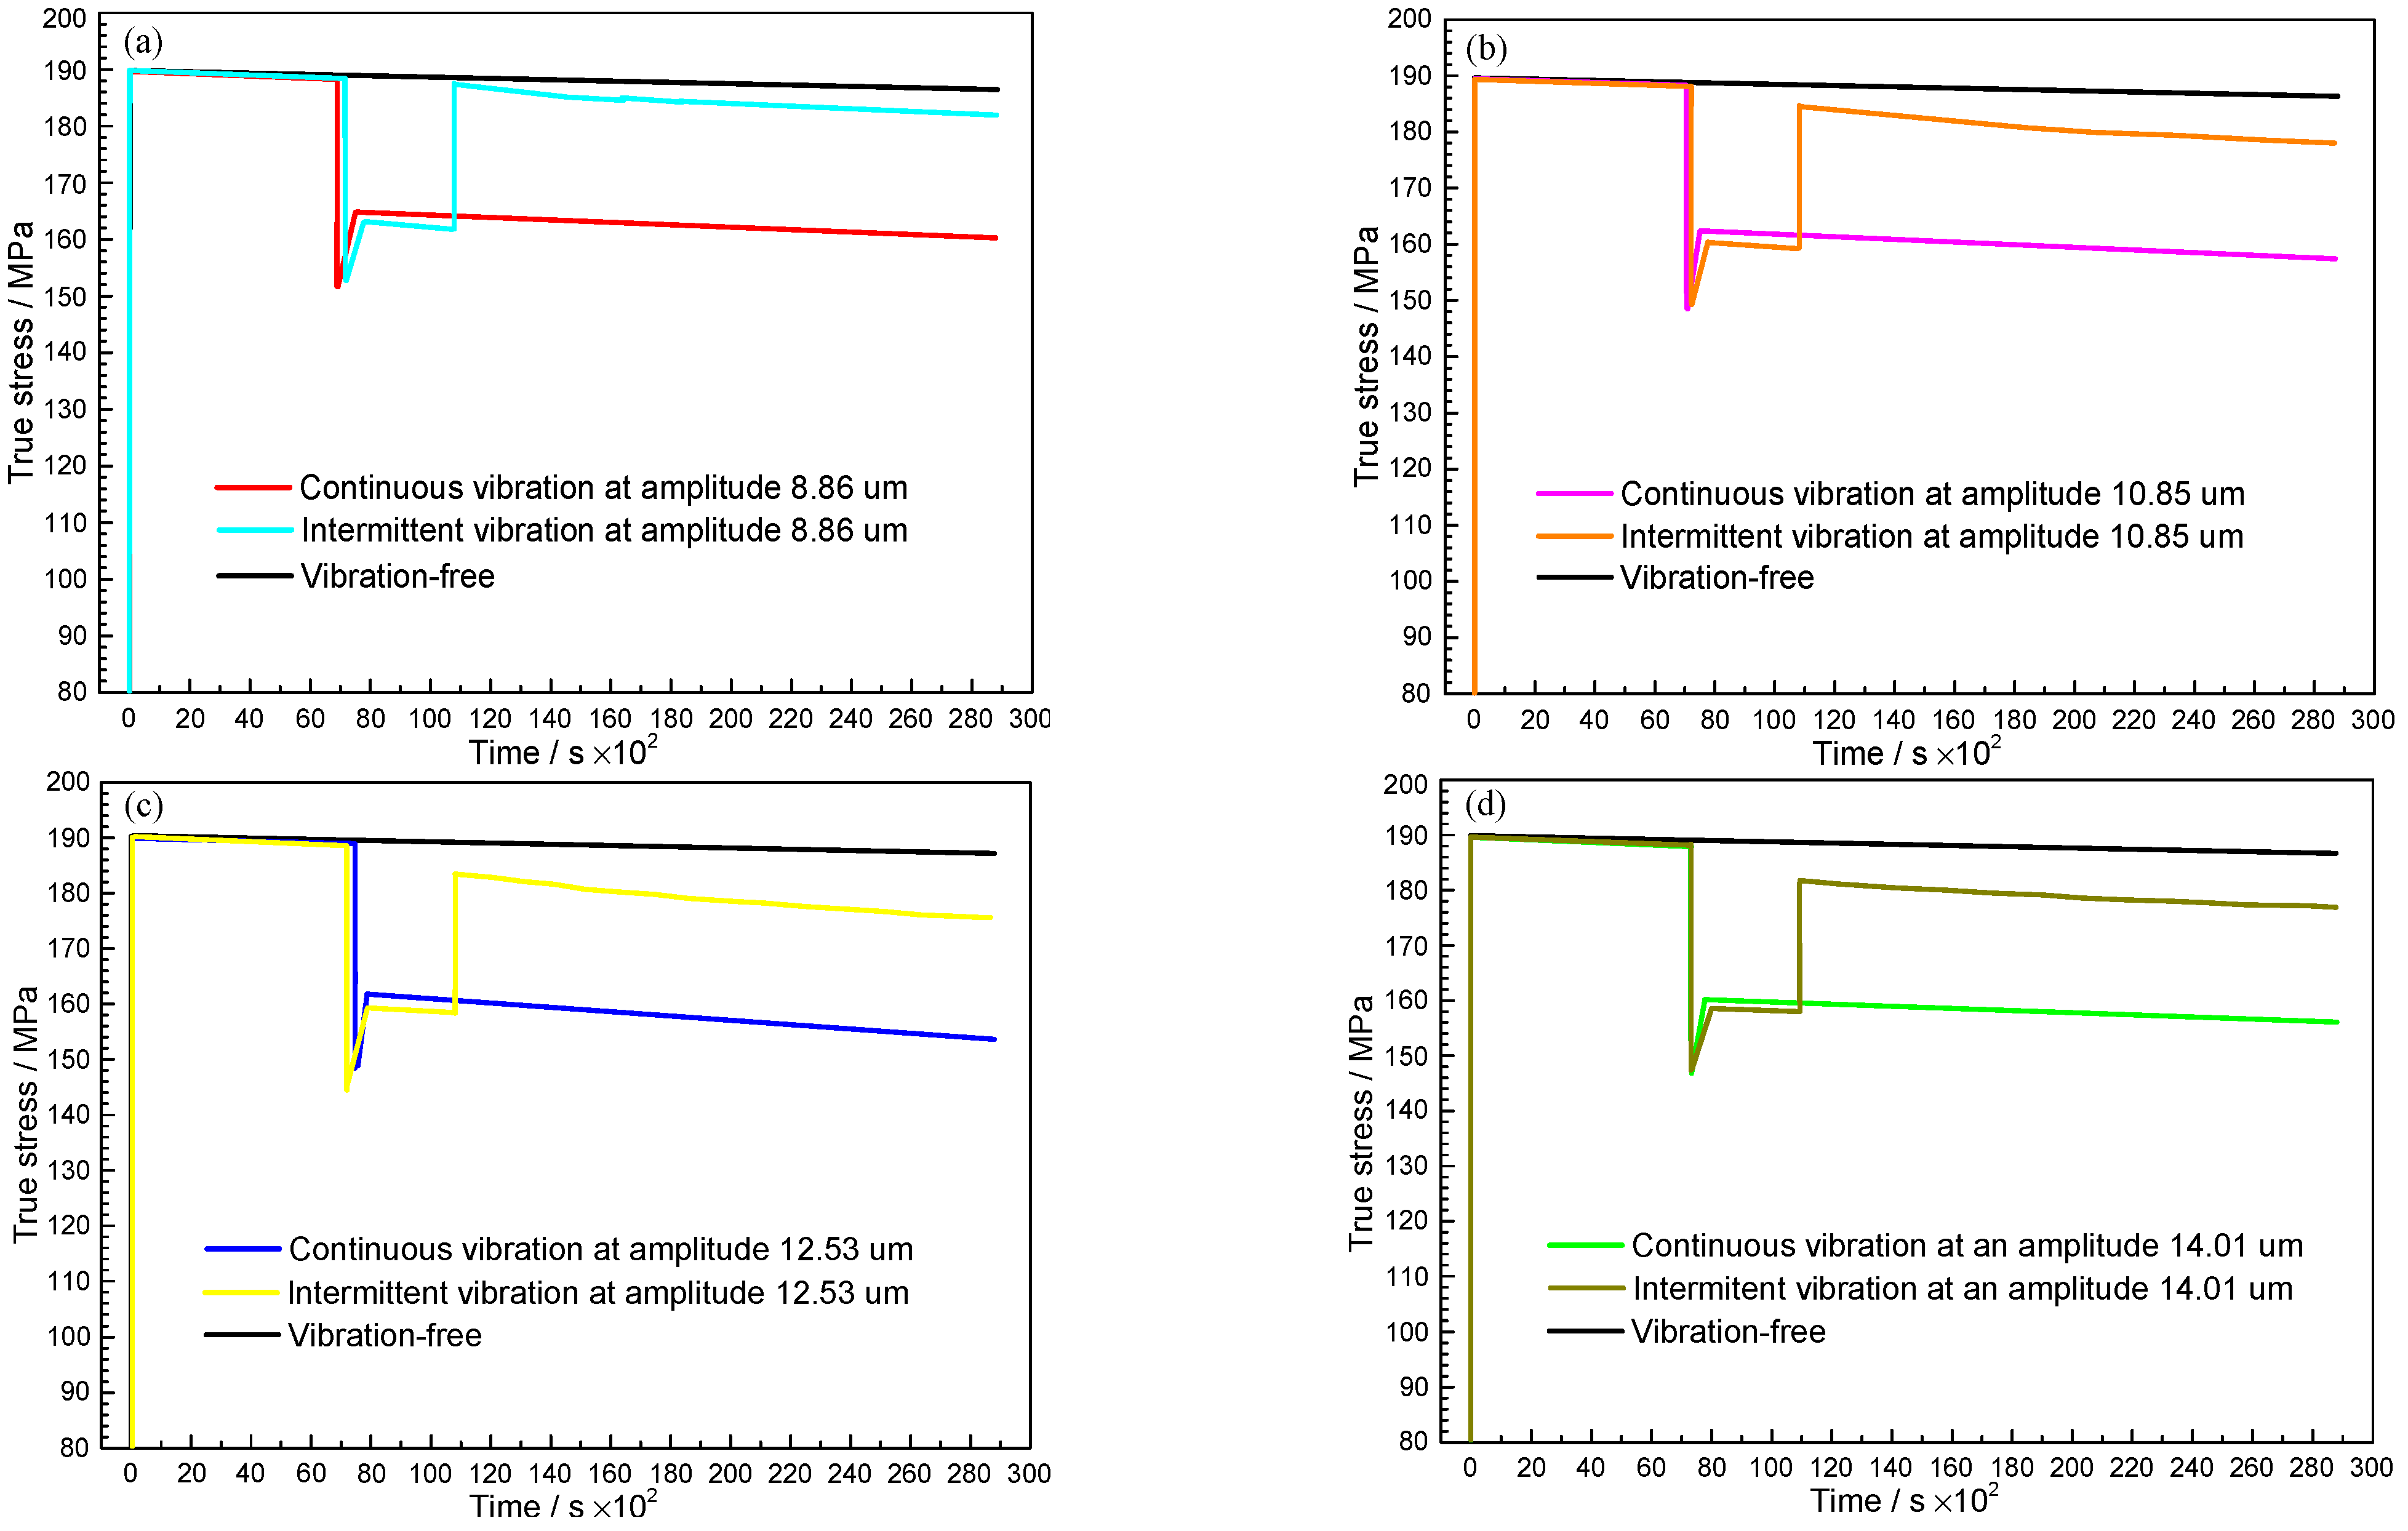
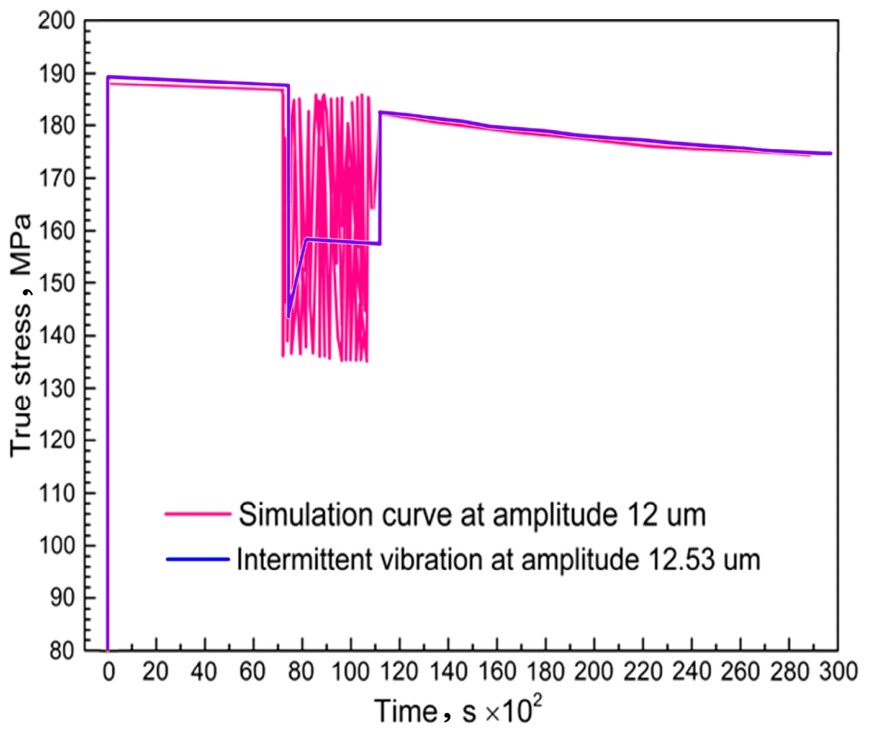
Figure 12 presents the true stress–time curves for the 7055 alloy during the UVCAT process, obtained from both experimental measurements and finite element simulations under comparable amplitude conditions. Both approaches employed a vibration frequency of 20 kHz, with an amplitude of 12.53 μm in the experiment and 12 μm in the simulation. The experimental data reflect the evolution of average stress over time under ultrasonic vibration, while the simulation data at an amplitude of 12 μm represent the stress superposition effect induced by the vibration.
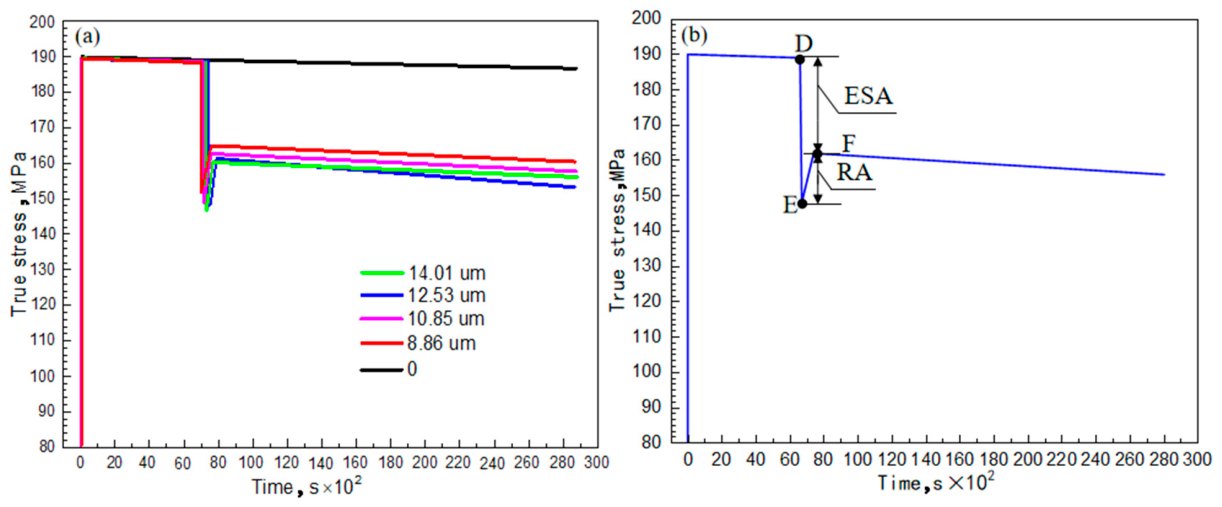
Comparing the two curves, upon the application of ultrasonic vibration, the flow stress exhibits an instantaneous and significant decrease. When the vibration ceases, the average flow stress shows an instantaneous recovery, after which the stress curve returns to a level approximately consistent with that of the creep tensile test without vibration. In the experiment, the ESA, defined as the reduction in average stress induced by vibration, is 28.4 MPa. In the simulation, the oscillation amplitude of the stress following vibration is 53.0 MPa, with an average stress of 161.5 MPa, yielding an ESA of 26.5 MPa. The difference between the simulated and experimental ESA values is 1.9 MPa.
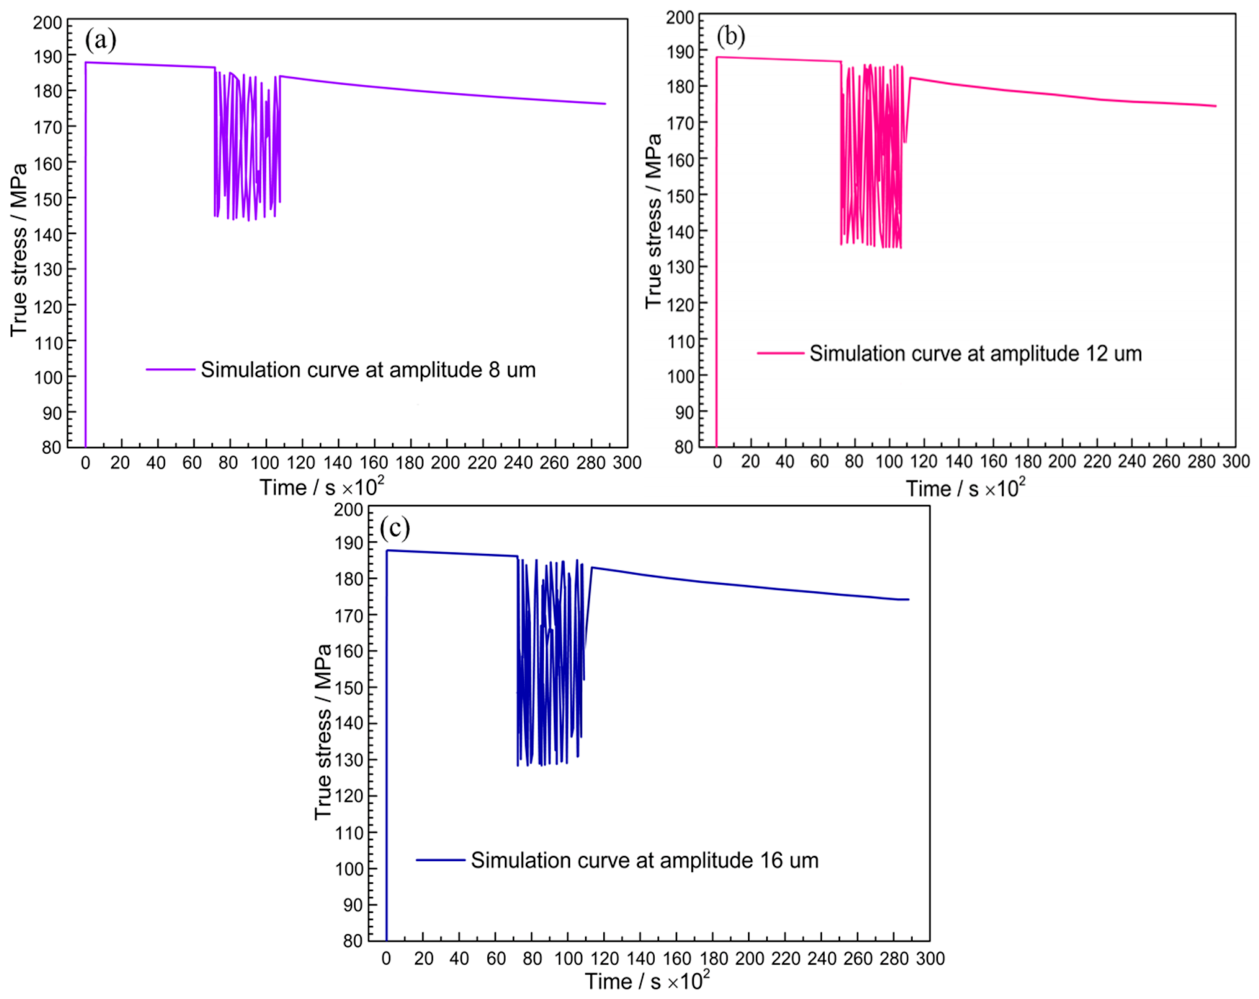
Figure 13 presents the simulated true stress–time curves for the creep tensile specimens under a vibration frequency of 20 kHz and varying amplitudes. Regardless of the applied amplitude, upon the superposition of ultrasonic vibration, the stress exhibits an instantaneous drop followed by a periodic oscillation process. When the vibration ceases, the stress rises instantaneously and quickly recovers to the level observed in the creep tensile specimen without vibration.
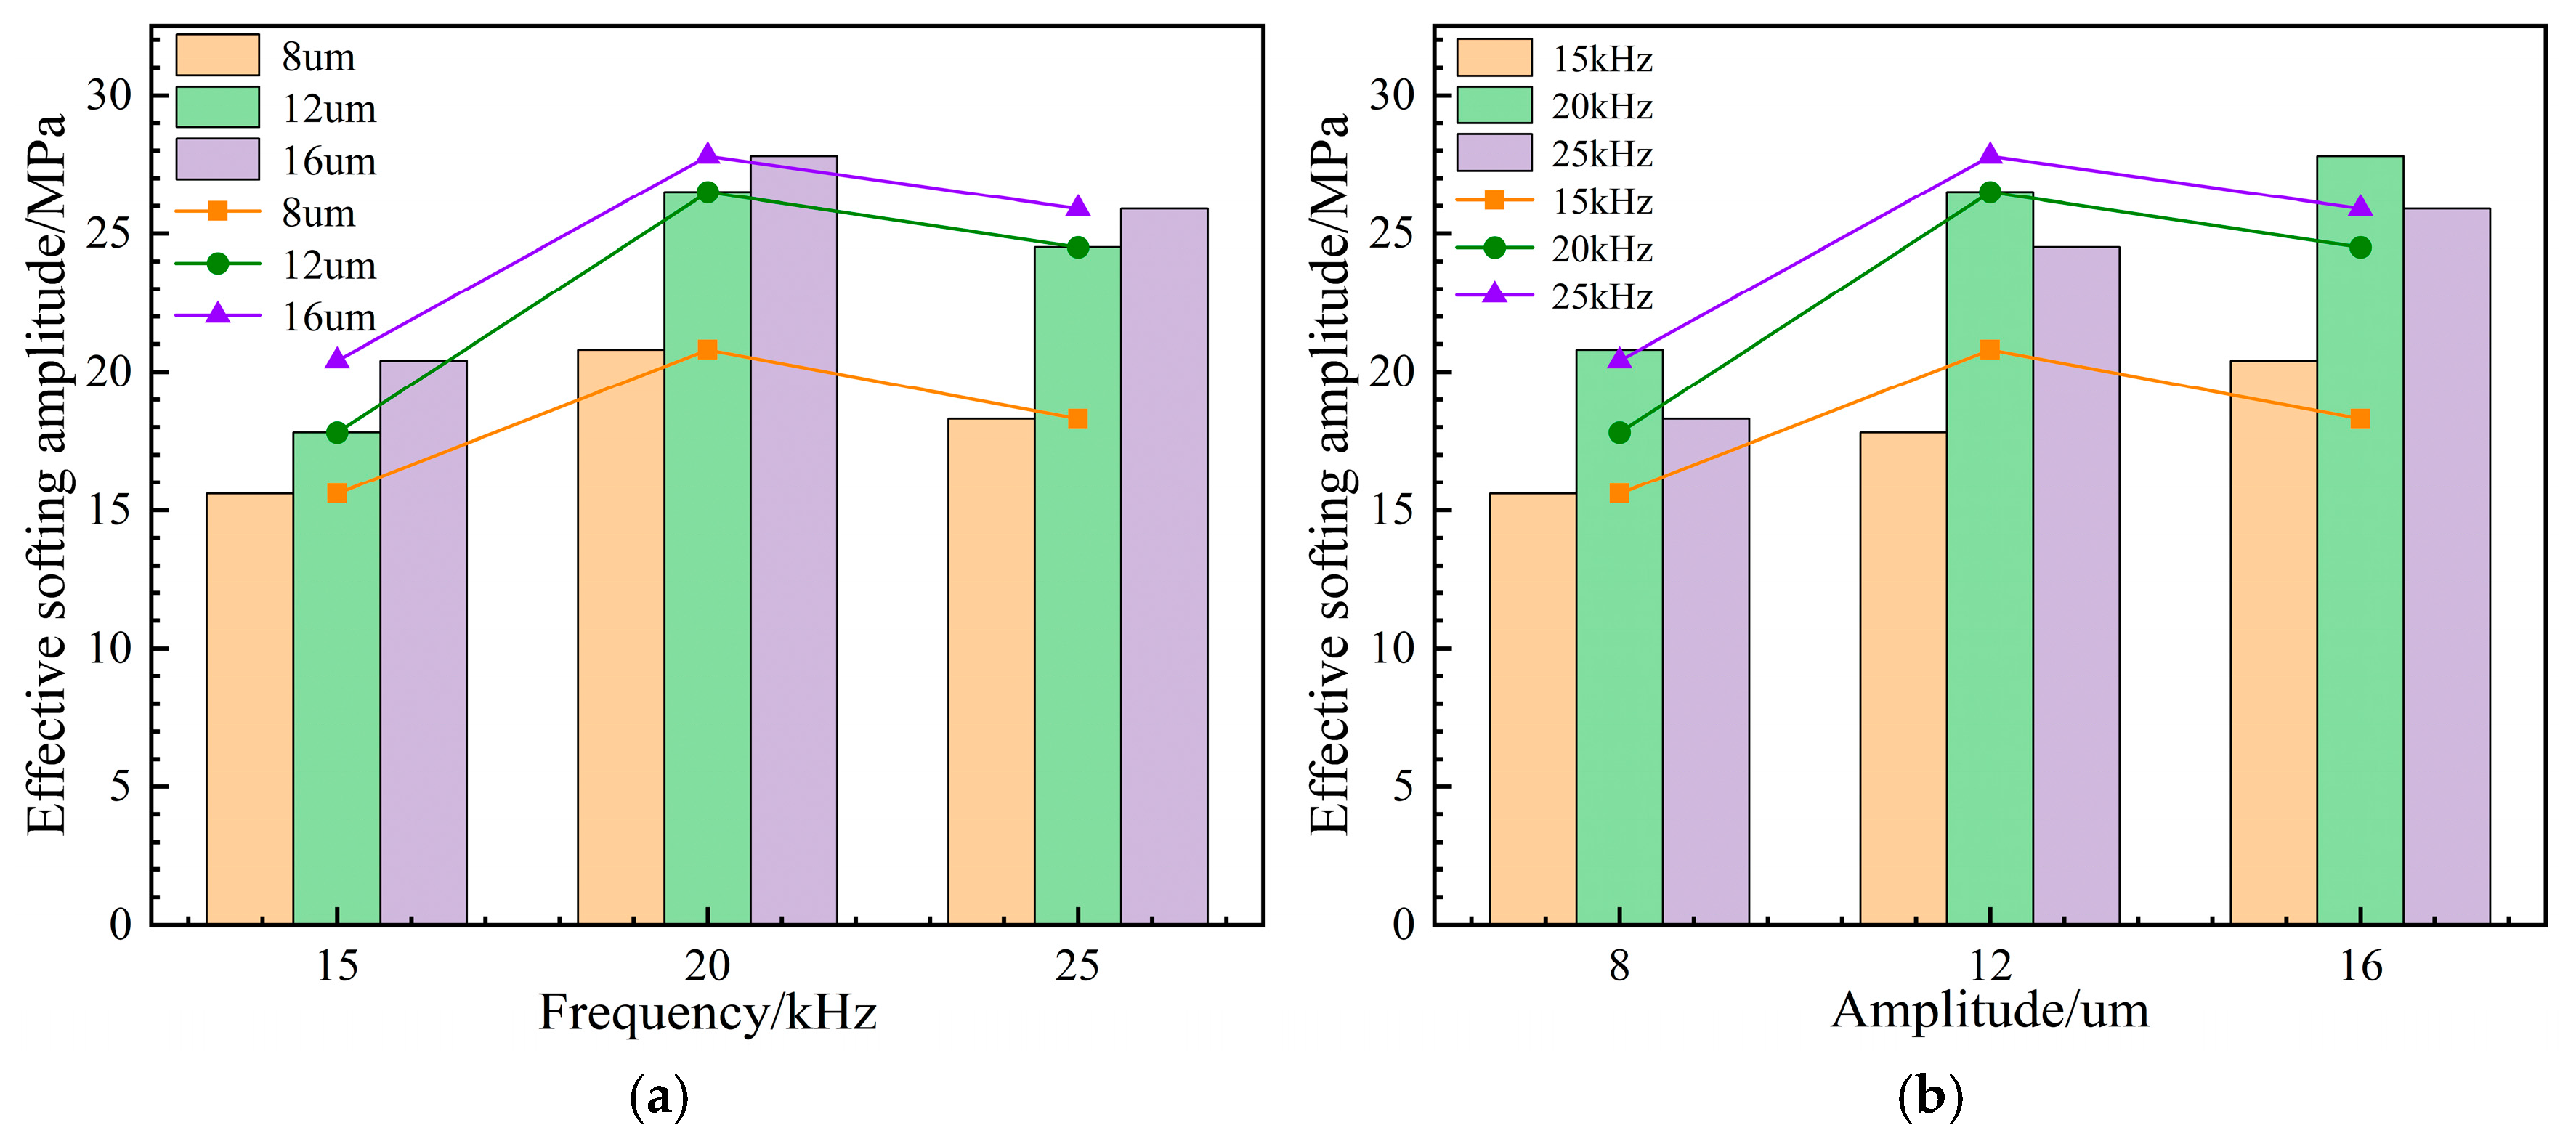
As the amplitude increases, the stress oscillation amplitude becomes more pronounced. For vibration amplitudes of 8, 12, and 16 μm, the oscillation amplitudes are 41.6, 53.0, and 55.6 MPa, with corresponding average stress values of 164.6, 161.5, and 156.7 MPa, respectively. The corresponding effective softening magnitudes (ESM) are 20.8, 26.5, and 27.8 MPa, respectively. For comparison, the experimentally determined ESM values at vibration amplitudes of 8.86 and 14.01 μm are 26.4 and 31.2 MPa, respectively, showing reasonable agreement with the simulated trends.
A comparison of the results reveals a notable discrepancy in the ESA between the experimental and simulation results. At a small amplitude (8 μm in the simulation vs. 8.86 μm in the experiment), the simulated ESA is considerably higher than the experimental value. In contrast, at larger amplitudes (>12 μm), the two sets of results are in reasonable agreement.
This discrepancy can be attributed to the fact that the finite element simulation captures only the stress superposition effect, whereas the reduction in flow stress observed experimentally arises from multiple contributing factors, including acoustic softening and thermally induced softening, in addition to stress superposition. Consequently, at small amplitudes, these additional factors exert a significant influence on the alloy’s flow behavior. Under moderate amplitude conditions, the stress superposition effect becomes the dominant mechanism. However, when the amplitude is excessively large, the effectiveness of stress superposition diminishes, leading to a less pronounced softening effect.
To elucidate the vibration-induced softening phenomenon in the simulation, the stress–strain data obtained from the ultrasonic vibration-assisted CAT experiment were employed as the constitutive model for the material, using a vibration frequency of 20 kHz and an amplitude of 12 μm as an example, while keeping other parameters unchanged.
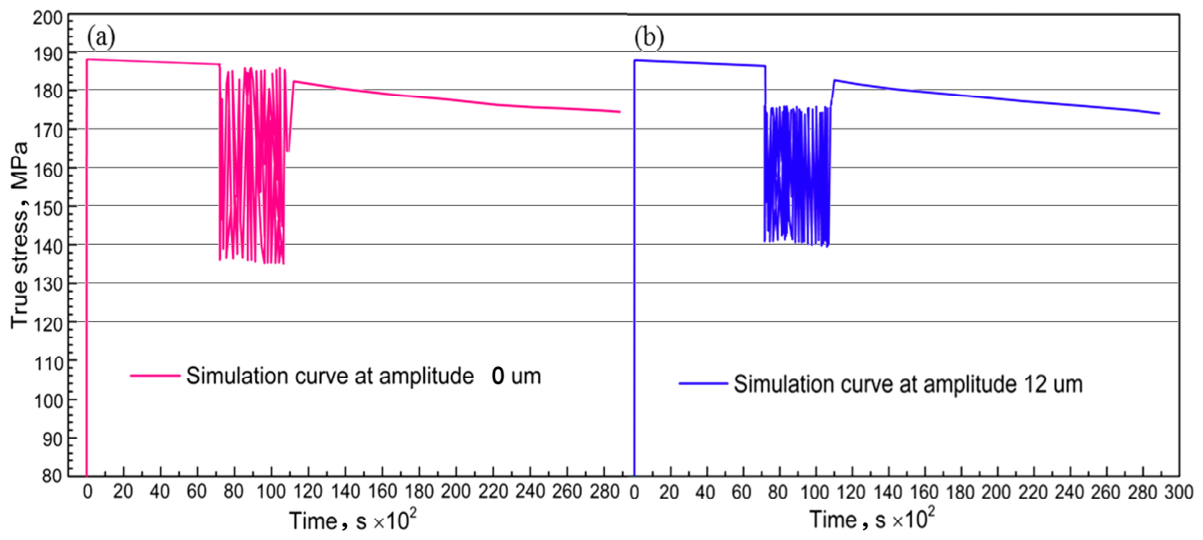
Figure 14a presents the stress–time curves obtained by applying different frequencies and amplitudes after establishing the material’s constitutive model based on the stress–strain data measured from the CAT experiment.
Figure 14b shows the stress–time relationship obtained through finite element simulation using the constitutive model constructed under the UVCAT experimental mode.
As shown in
Figure 14b, when the constitutive model established under the UVCAT experimental mode is applied in the simulation, the stress oscillation amplitude is 36.4 MPa, the average stress is 158.2 MPa, and the corresponding ESA is 27.9 MPa. In contrast, using the constitutive model derived from the non-vibrating CAT experiment yields an ESA of 26.5 MPa. From the previous UVCAT experimental results, under vibration parameters of 20 kHz and 12.53 μm, the experimentally determined ESA is 28.4 MPa.
A comparison of the results indicates that the simulation using the constitutive model derived from UVCAT experimental data produces results that are in closer agreement with the experimental values than those obtained using the CAT-based constitutive model. This suggests that employing stress–strain data from UVCAT experiments as the material’s constitutive model enables a more accurate representation of the hybrid aging forming behavior in simulations.