3.1. Metallographic Observation of Steel Sheets Before and After Corrosion
The experiment adopted the static uniform corrosion full-immersion test method. Steel sheets of 304 stainless steel, 310S heat-resistant steel, and 20 carbon steel were completely immersed in the liquid Sn-Bi-Zn metal at 600 °C in an air-isolated environment. The steel sheets were taken out at different time points to analyze the corrosion of the steel sheets by the molten metal.
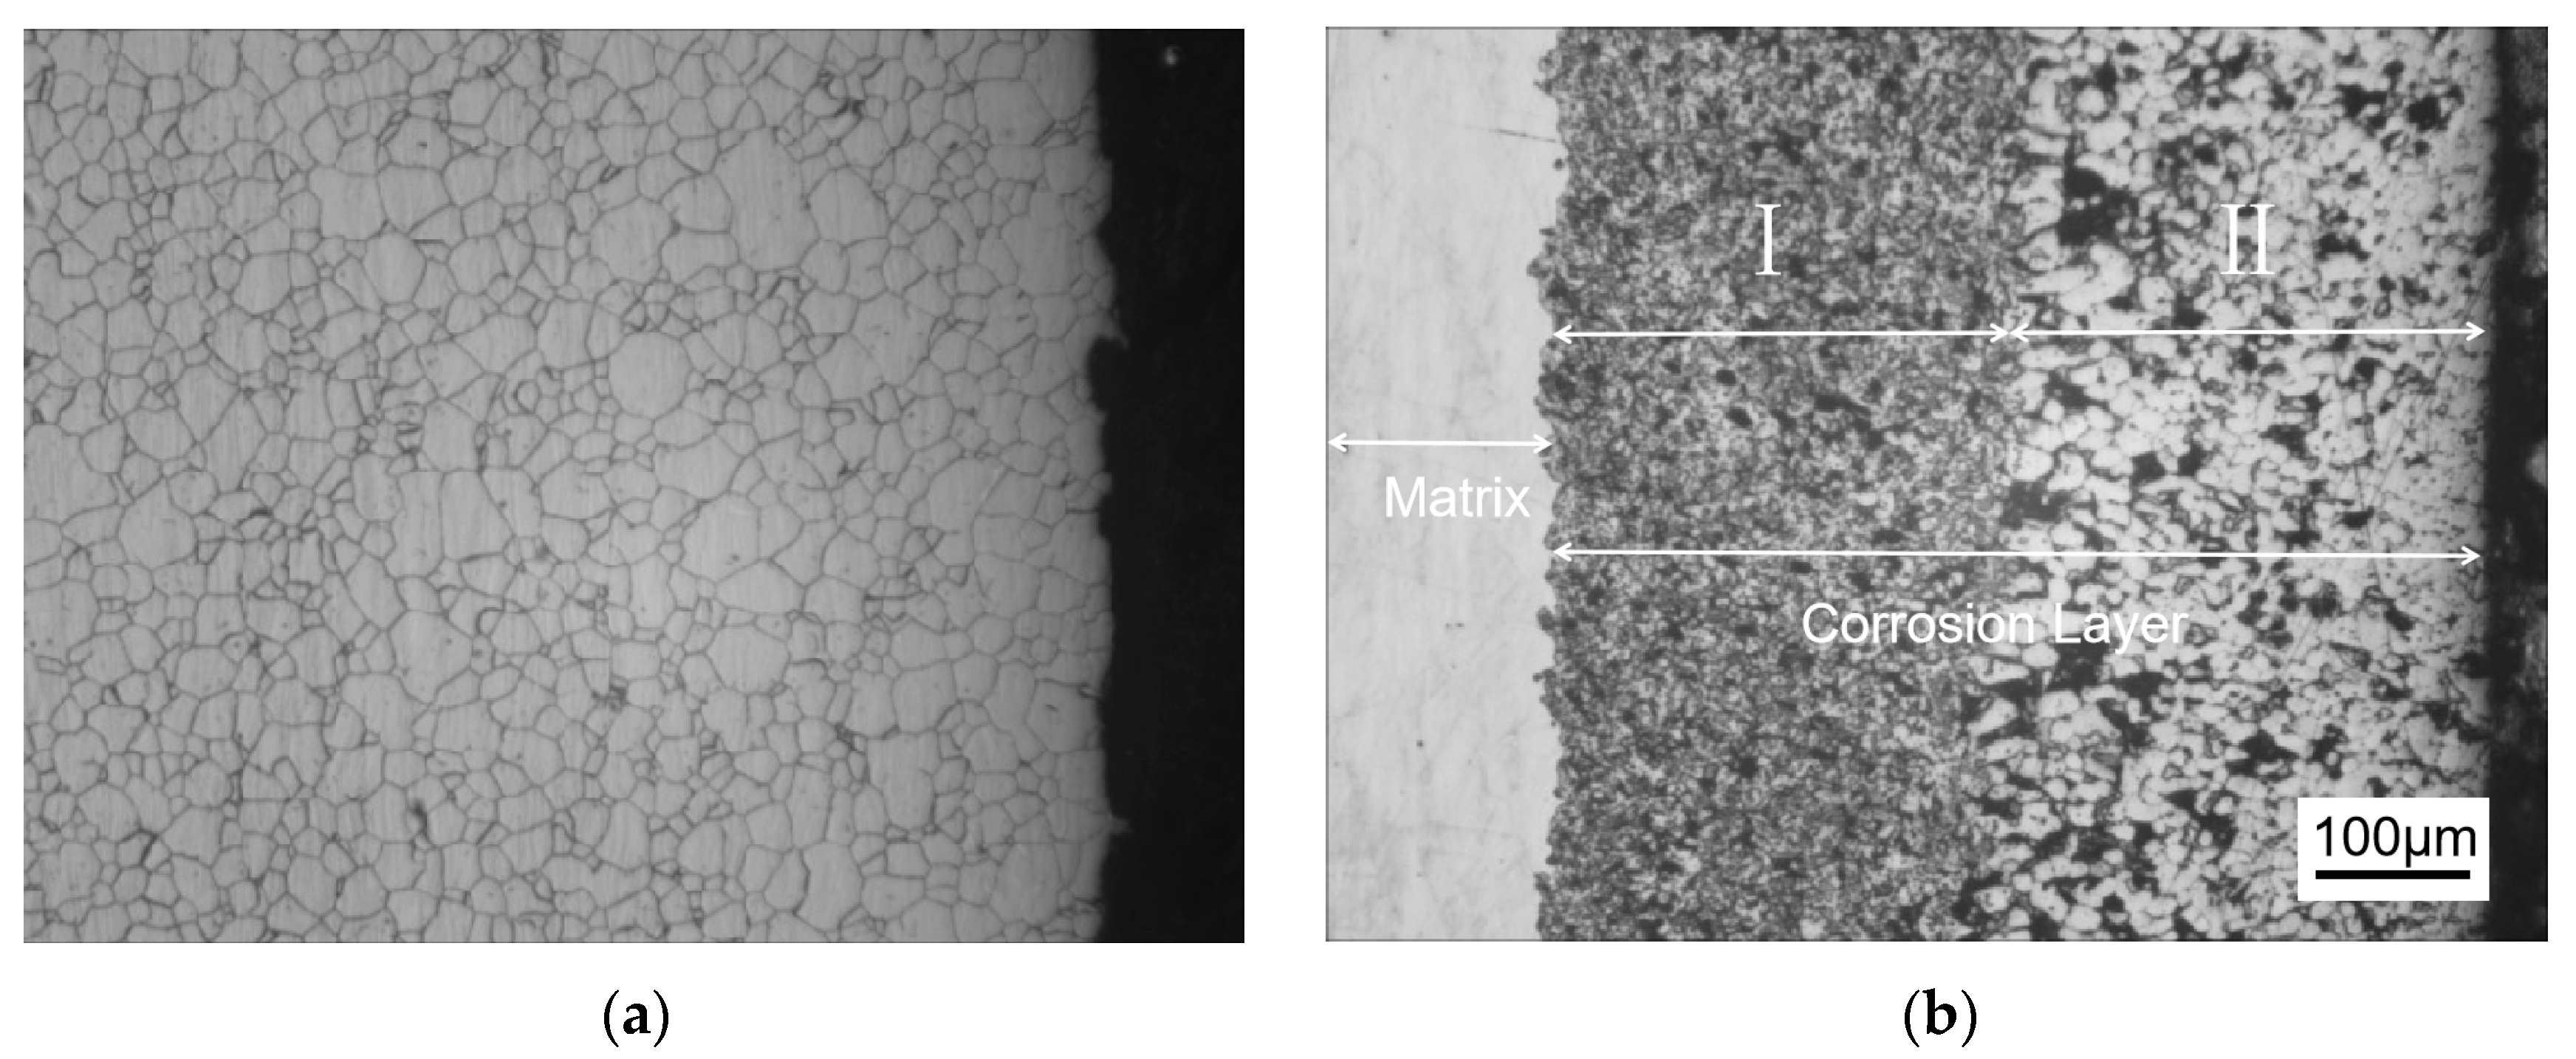
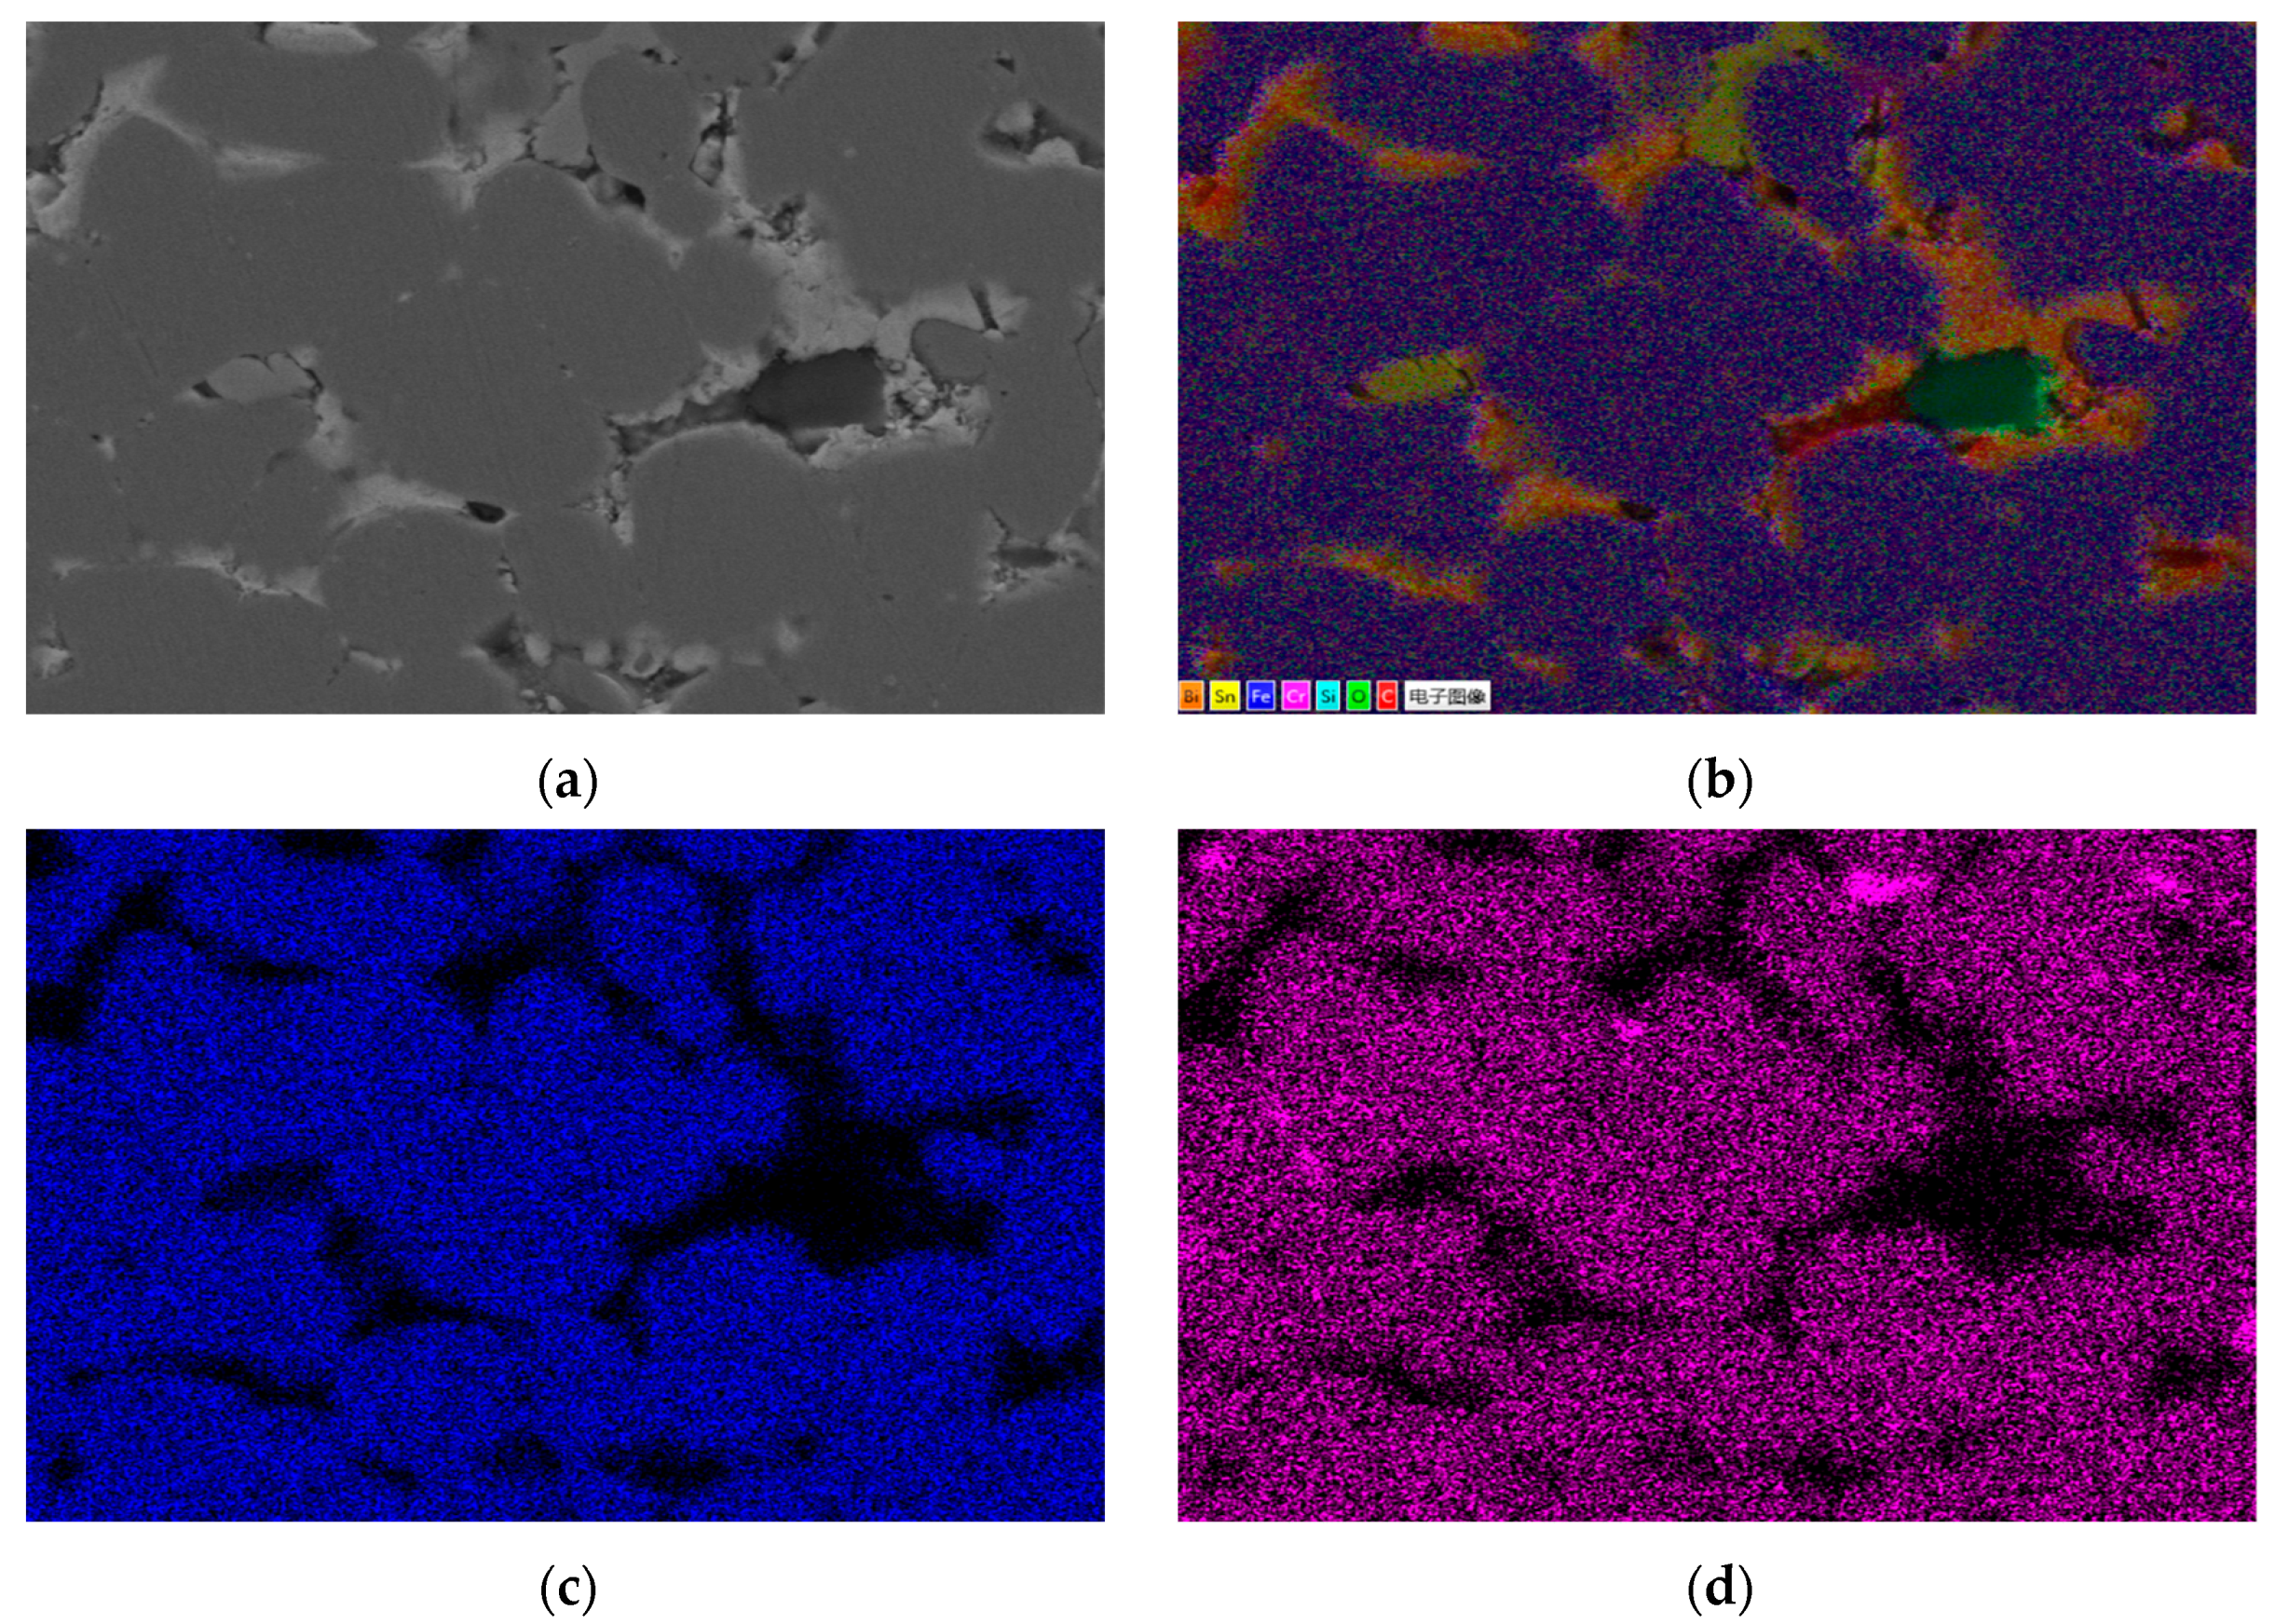
Figure 1 shows the metallographic structure of the 304 stainless steel section before and after corrosion for 180 h. The results showed that the corrosion layer of 304 stainless steel had a clear boundary with the substrate, and part I was close to the stainless steel substrate, with smaller grain size and denser structure than the substrate; Part II is the transition zone between the edge of the steel sheet and Part I, with coarser grains and obvious granular shapes compared to Part I, and a large number of pores. In Part II, as the corrosion layer deepens, the size of the pores gradually increases, and the number decreases.
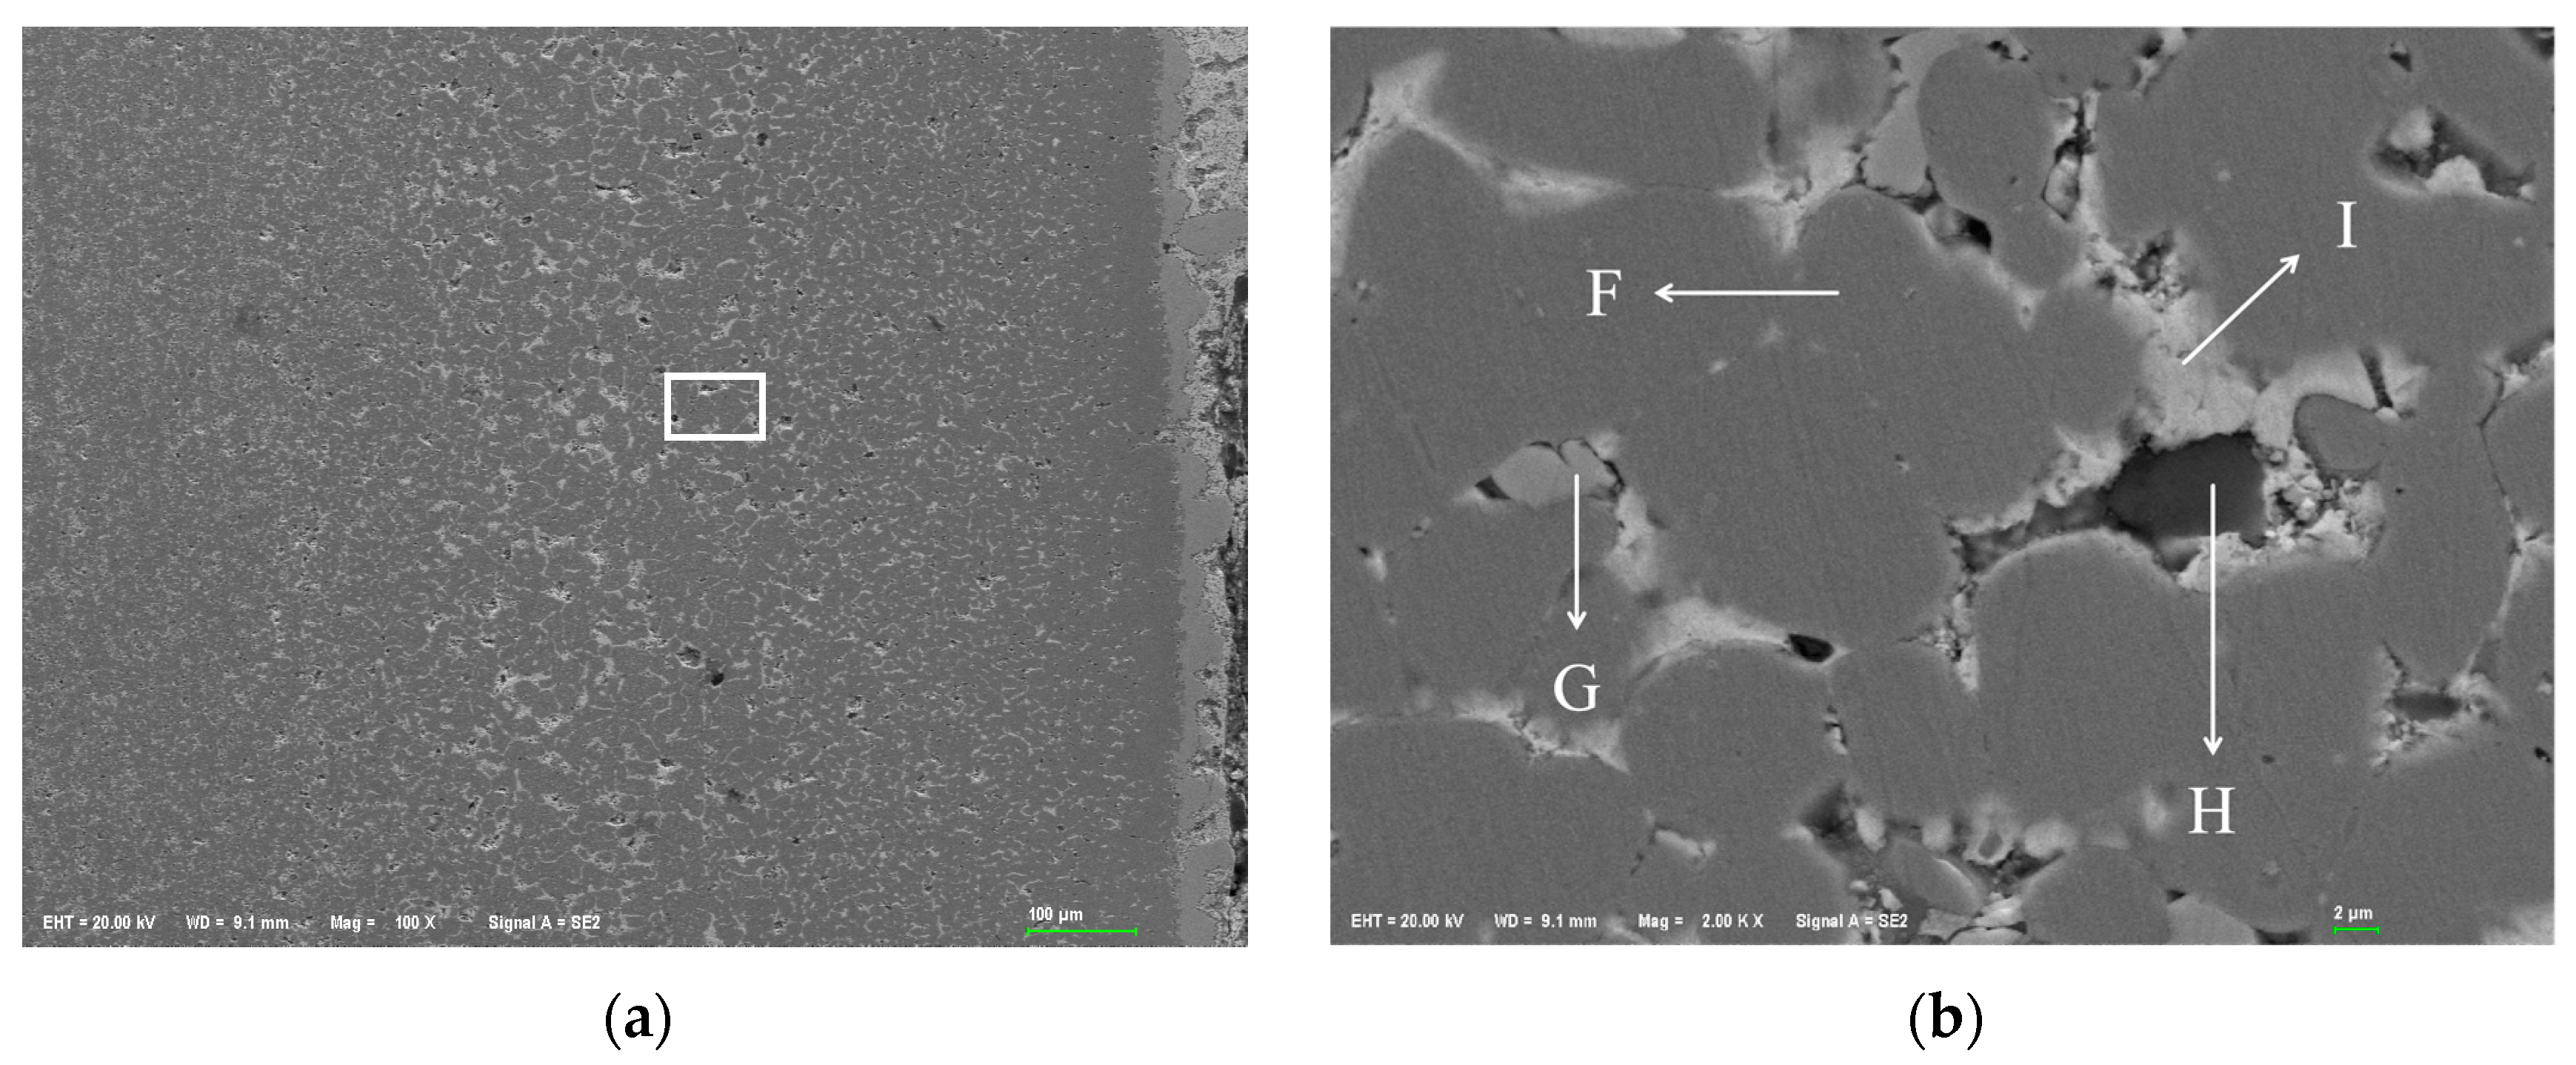
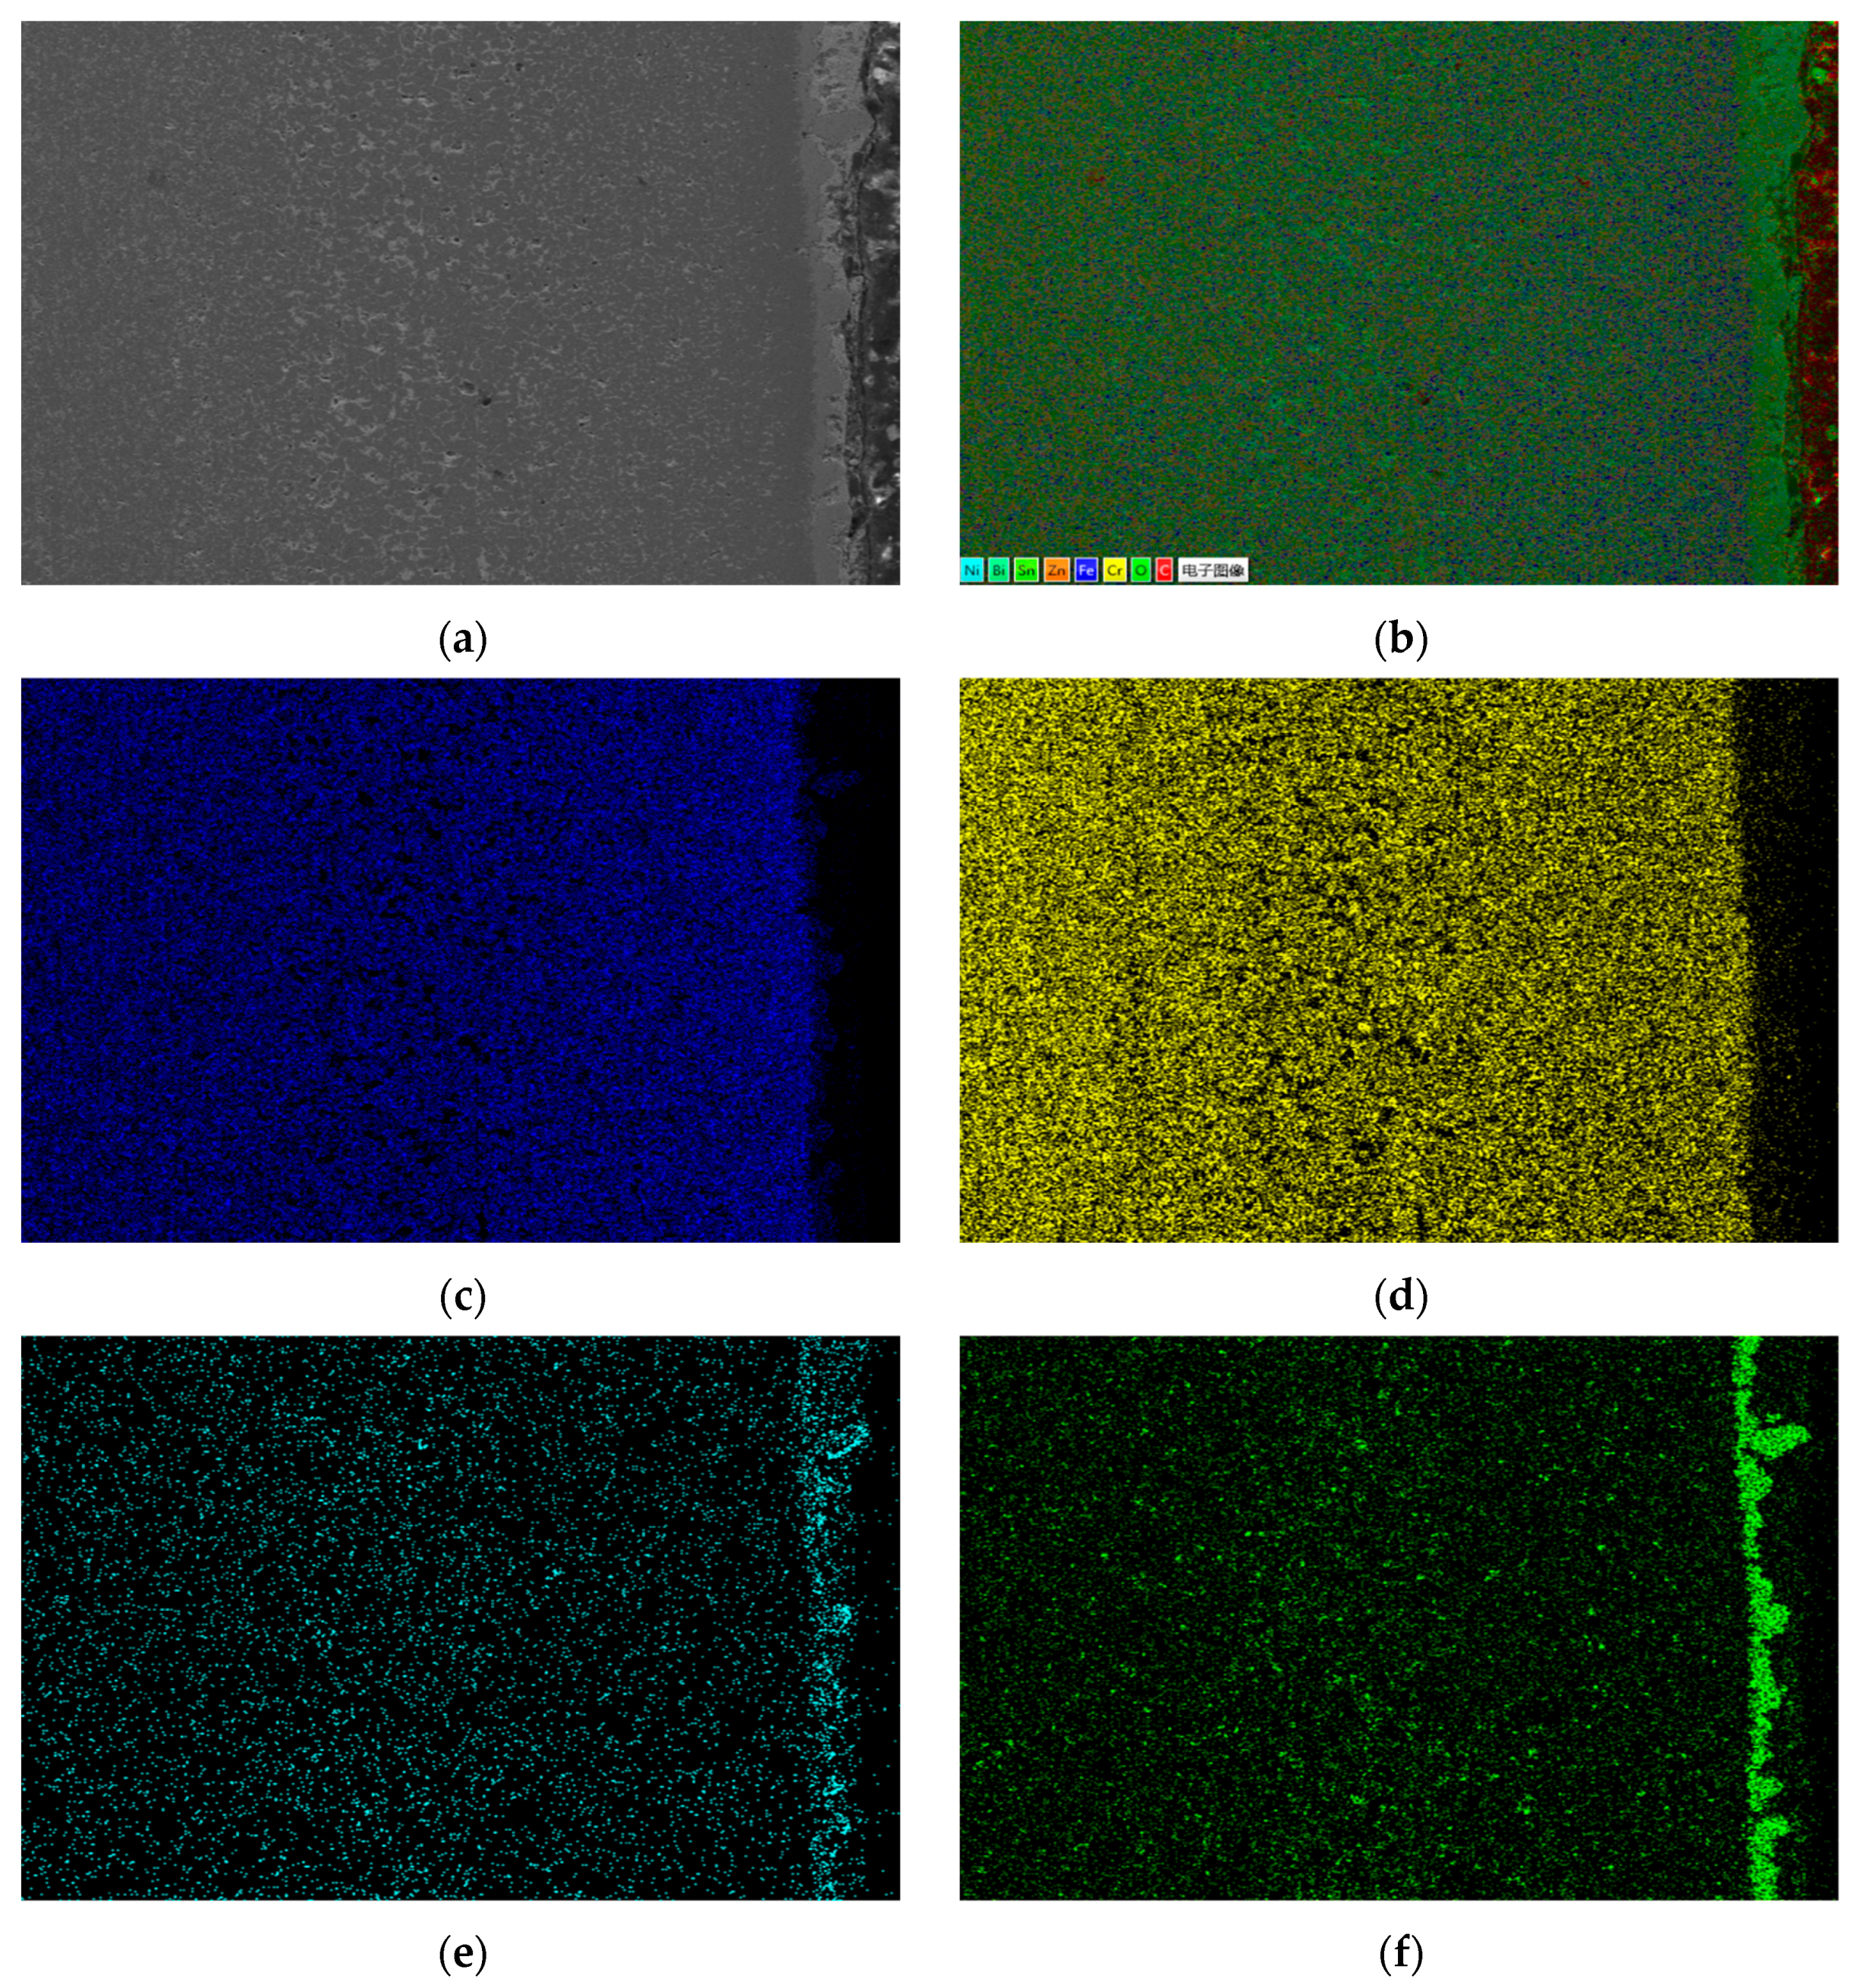
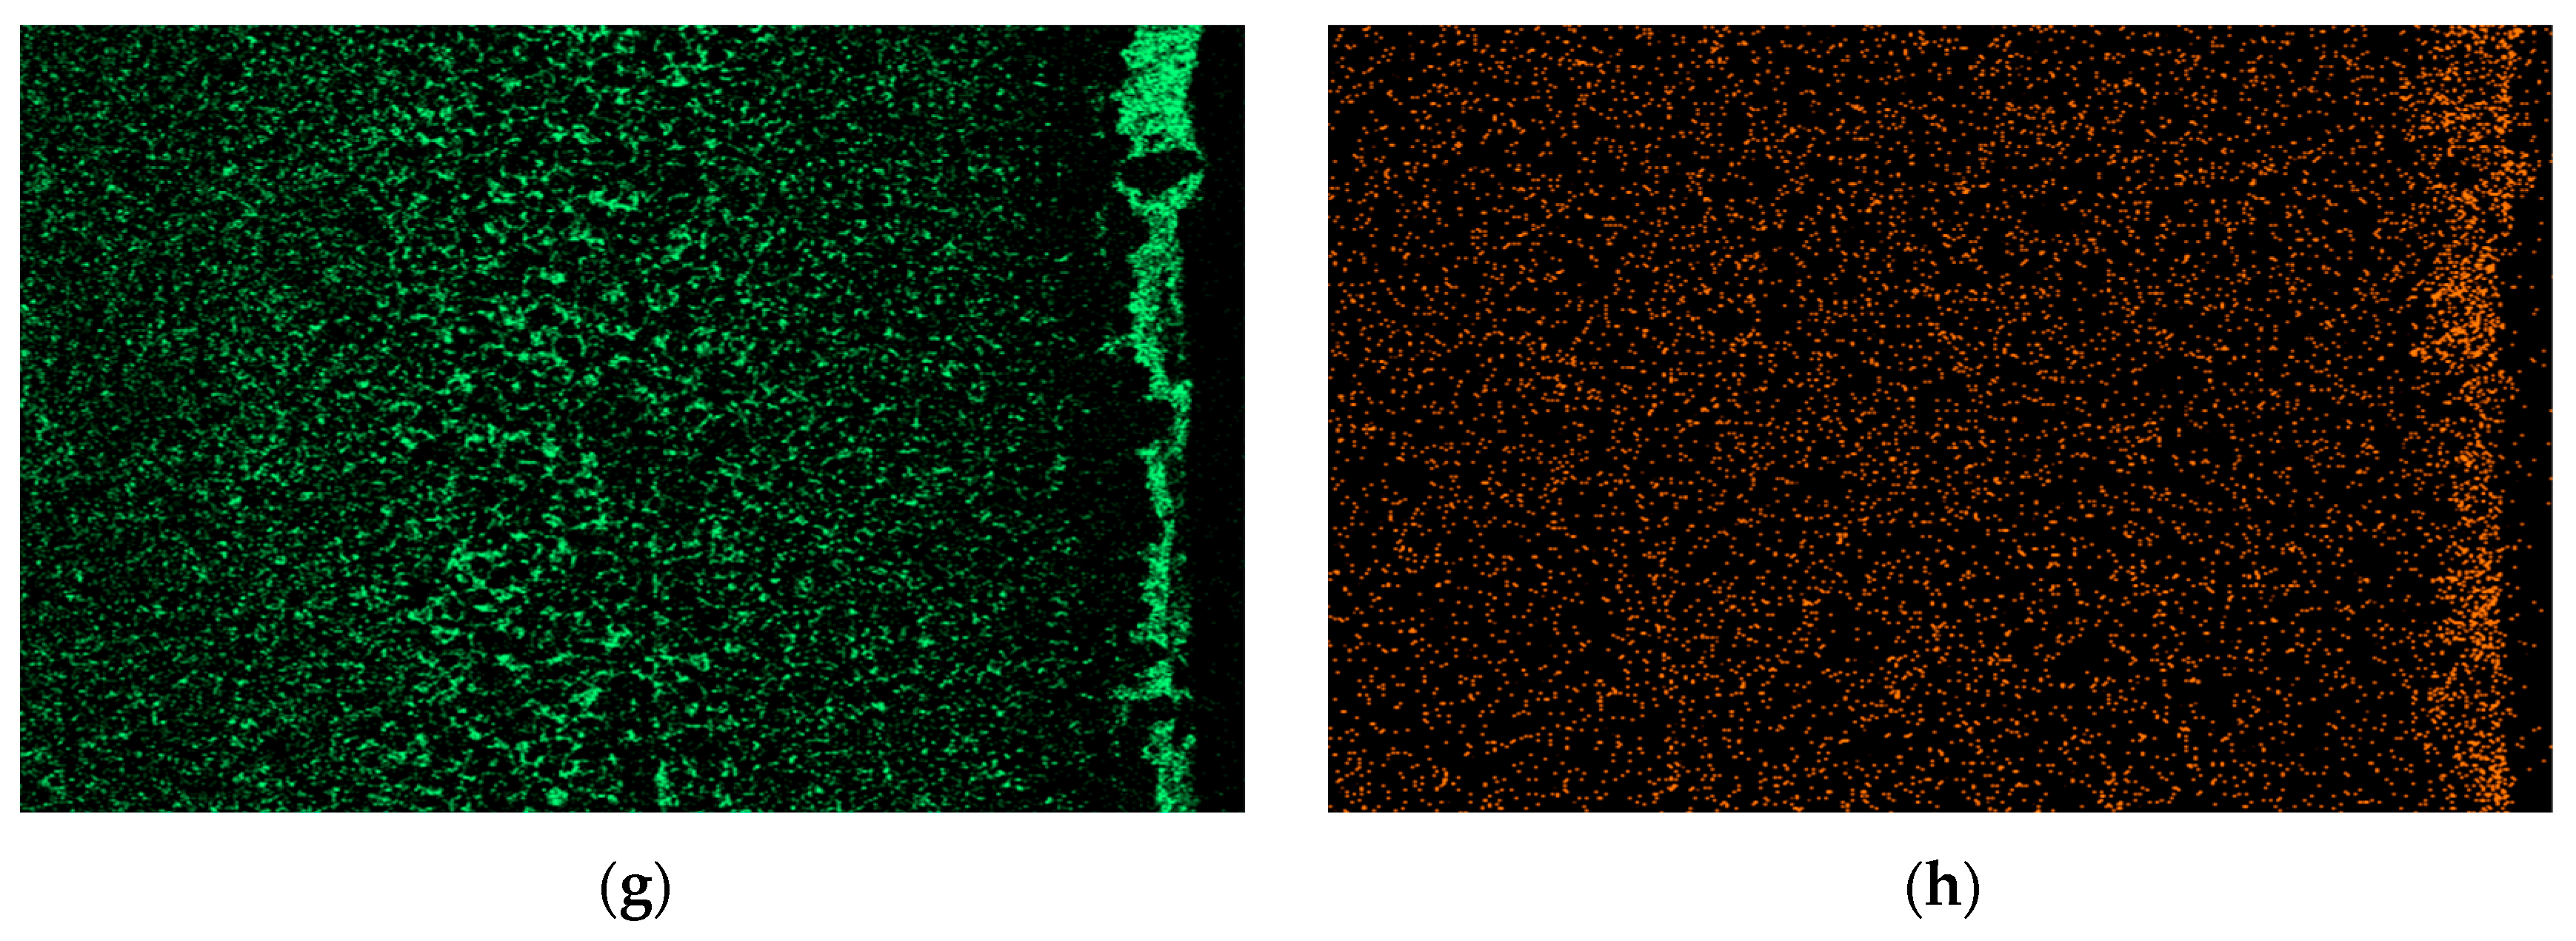
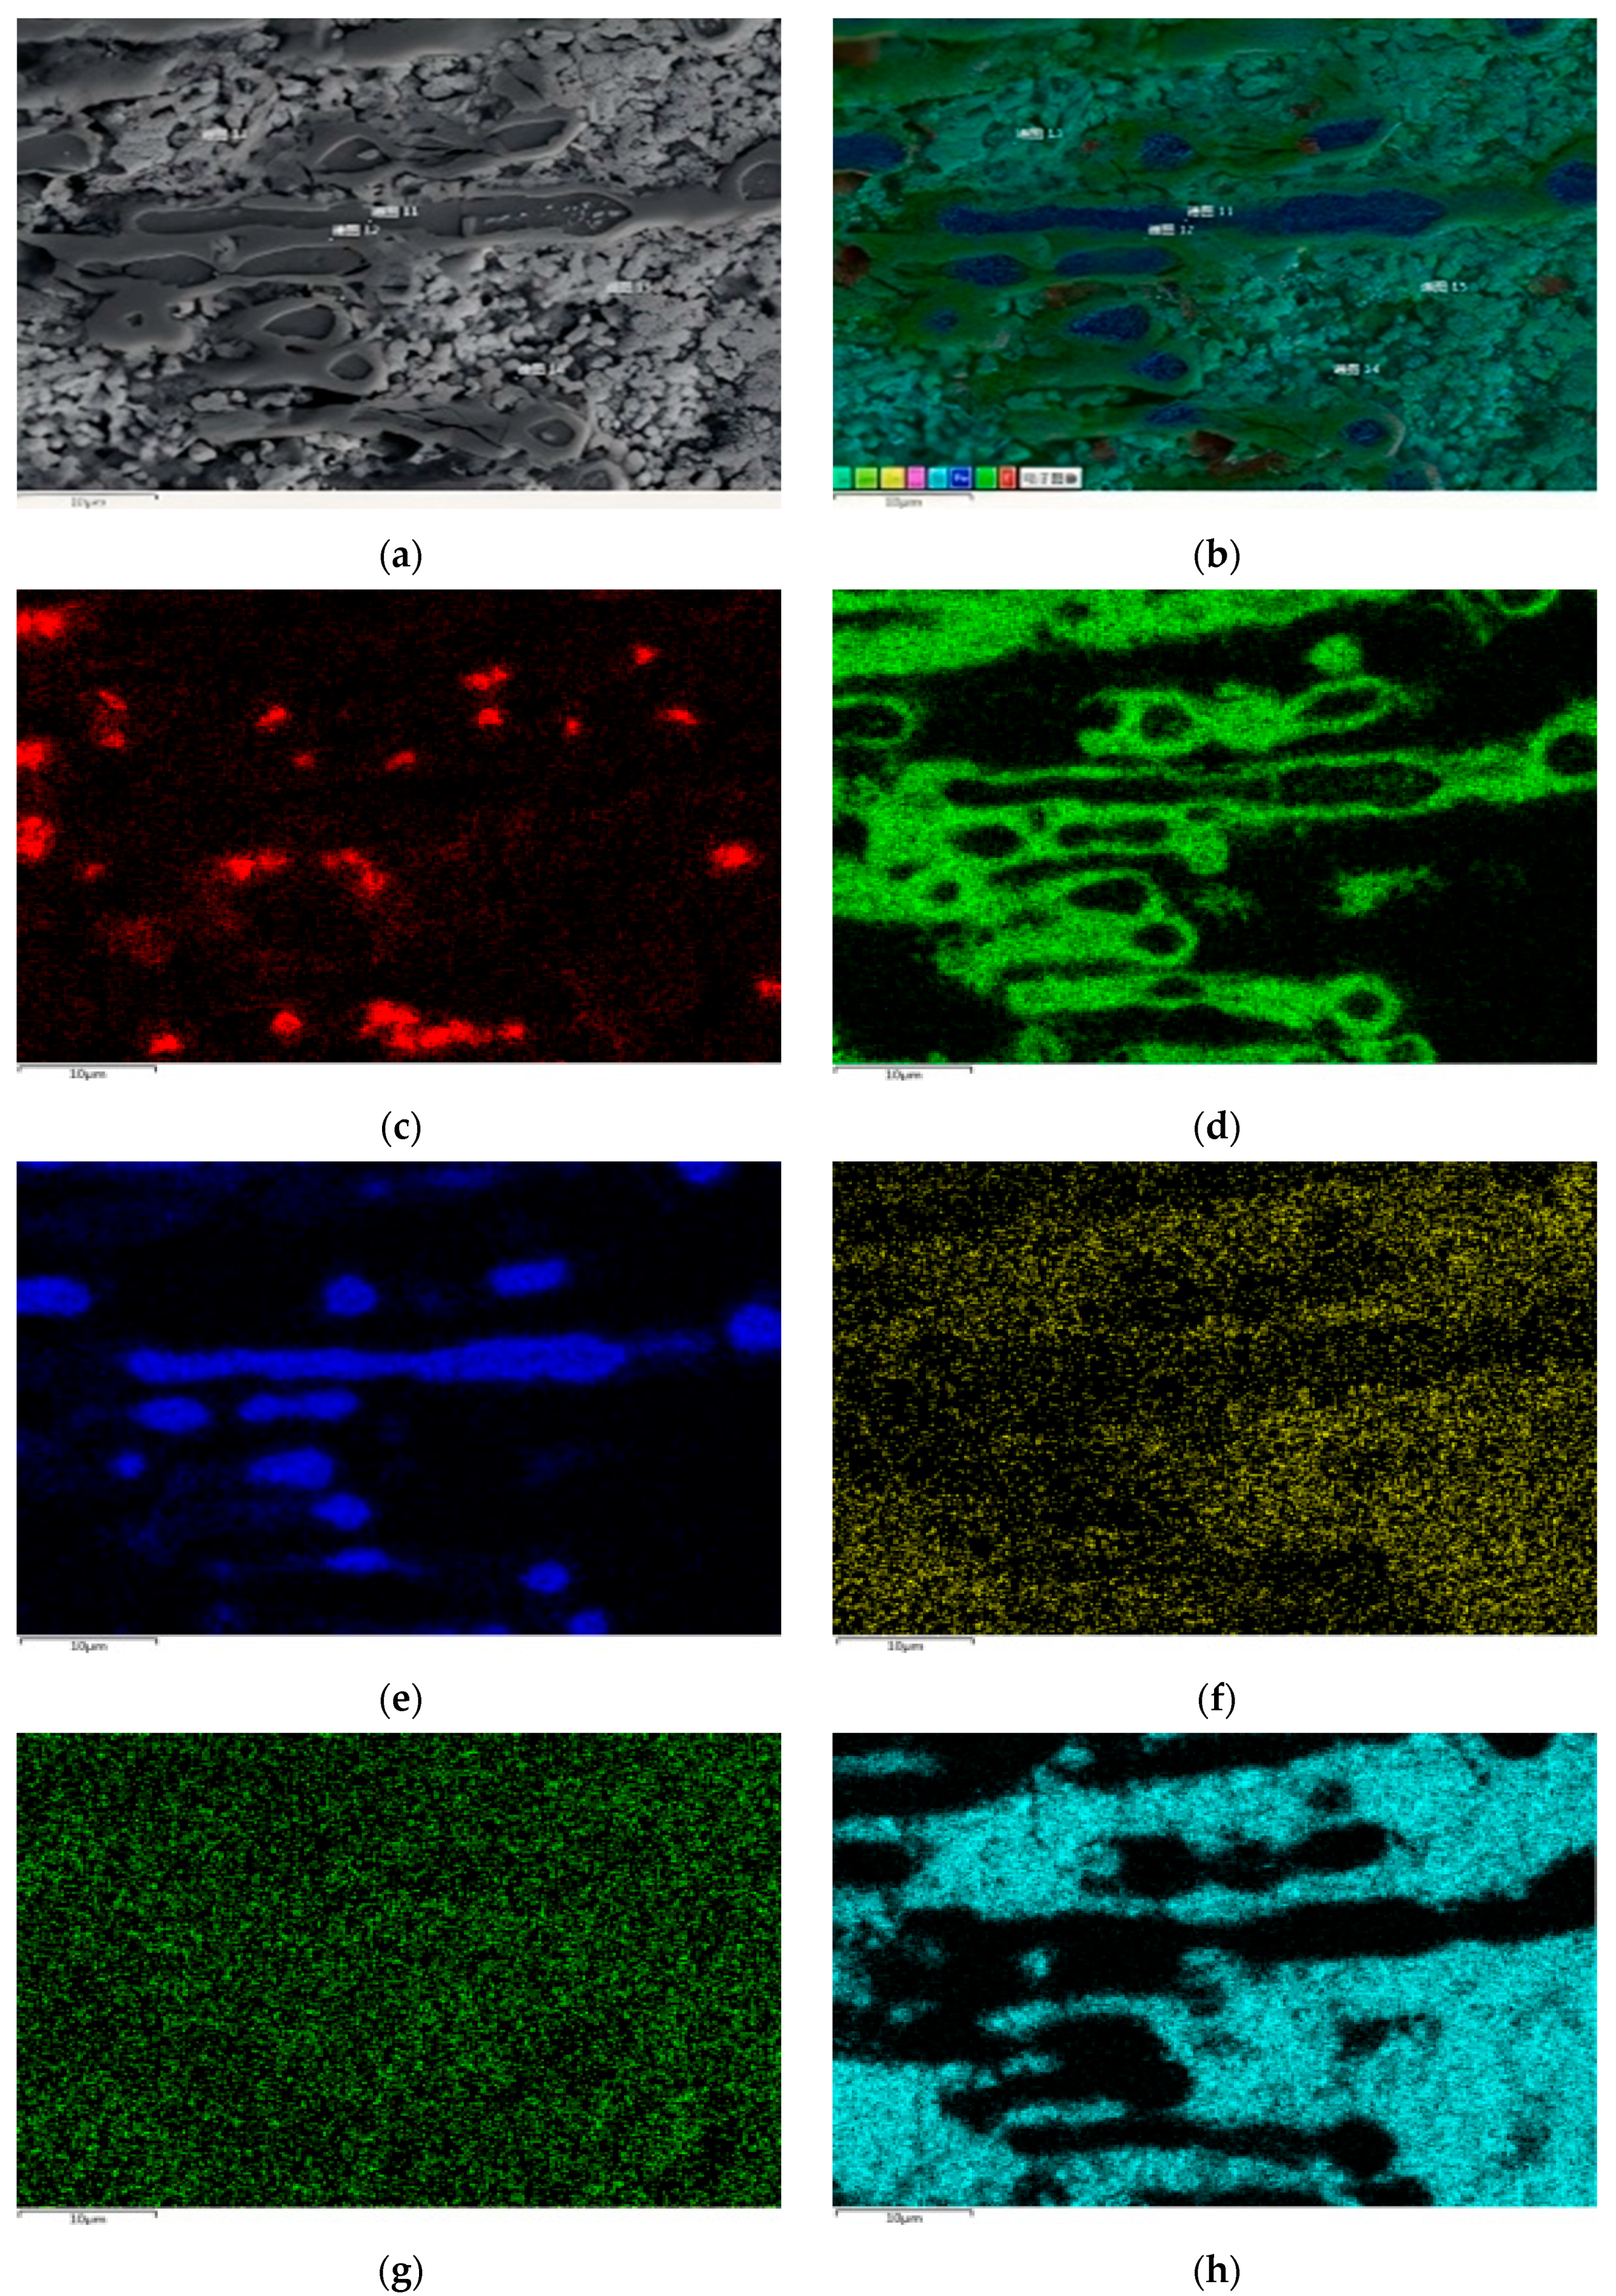
Figure 2 shows the metallographic structure of 310S heat-resistant steel section before and after corrosion. The results showed that the corrosion of 310S heat-resistant steel was much more severe than that of 304 stainless steel. After 180 h of experiment, almost all of the steel plates used in the experiment were corroded, and the pores were distributed in various areas of the corrosion layer. There was no obvious interface distinction in the corrosion layer, but as the corrosion depth increased, the grain size became coarser, and the pores caused by corrosion became larger.
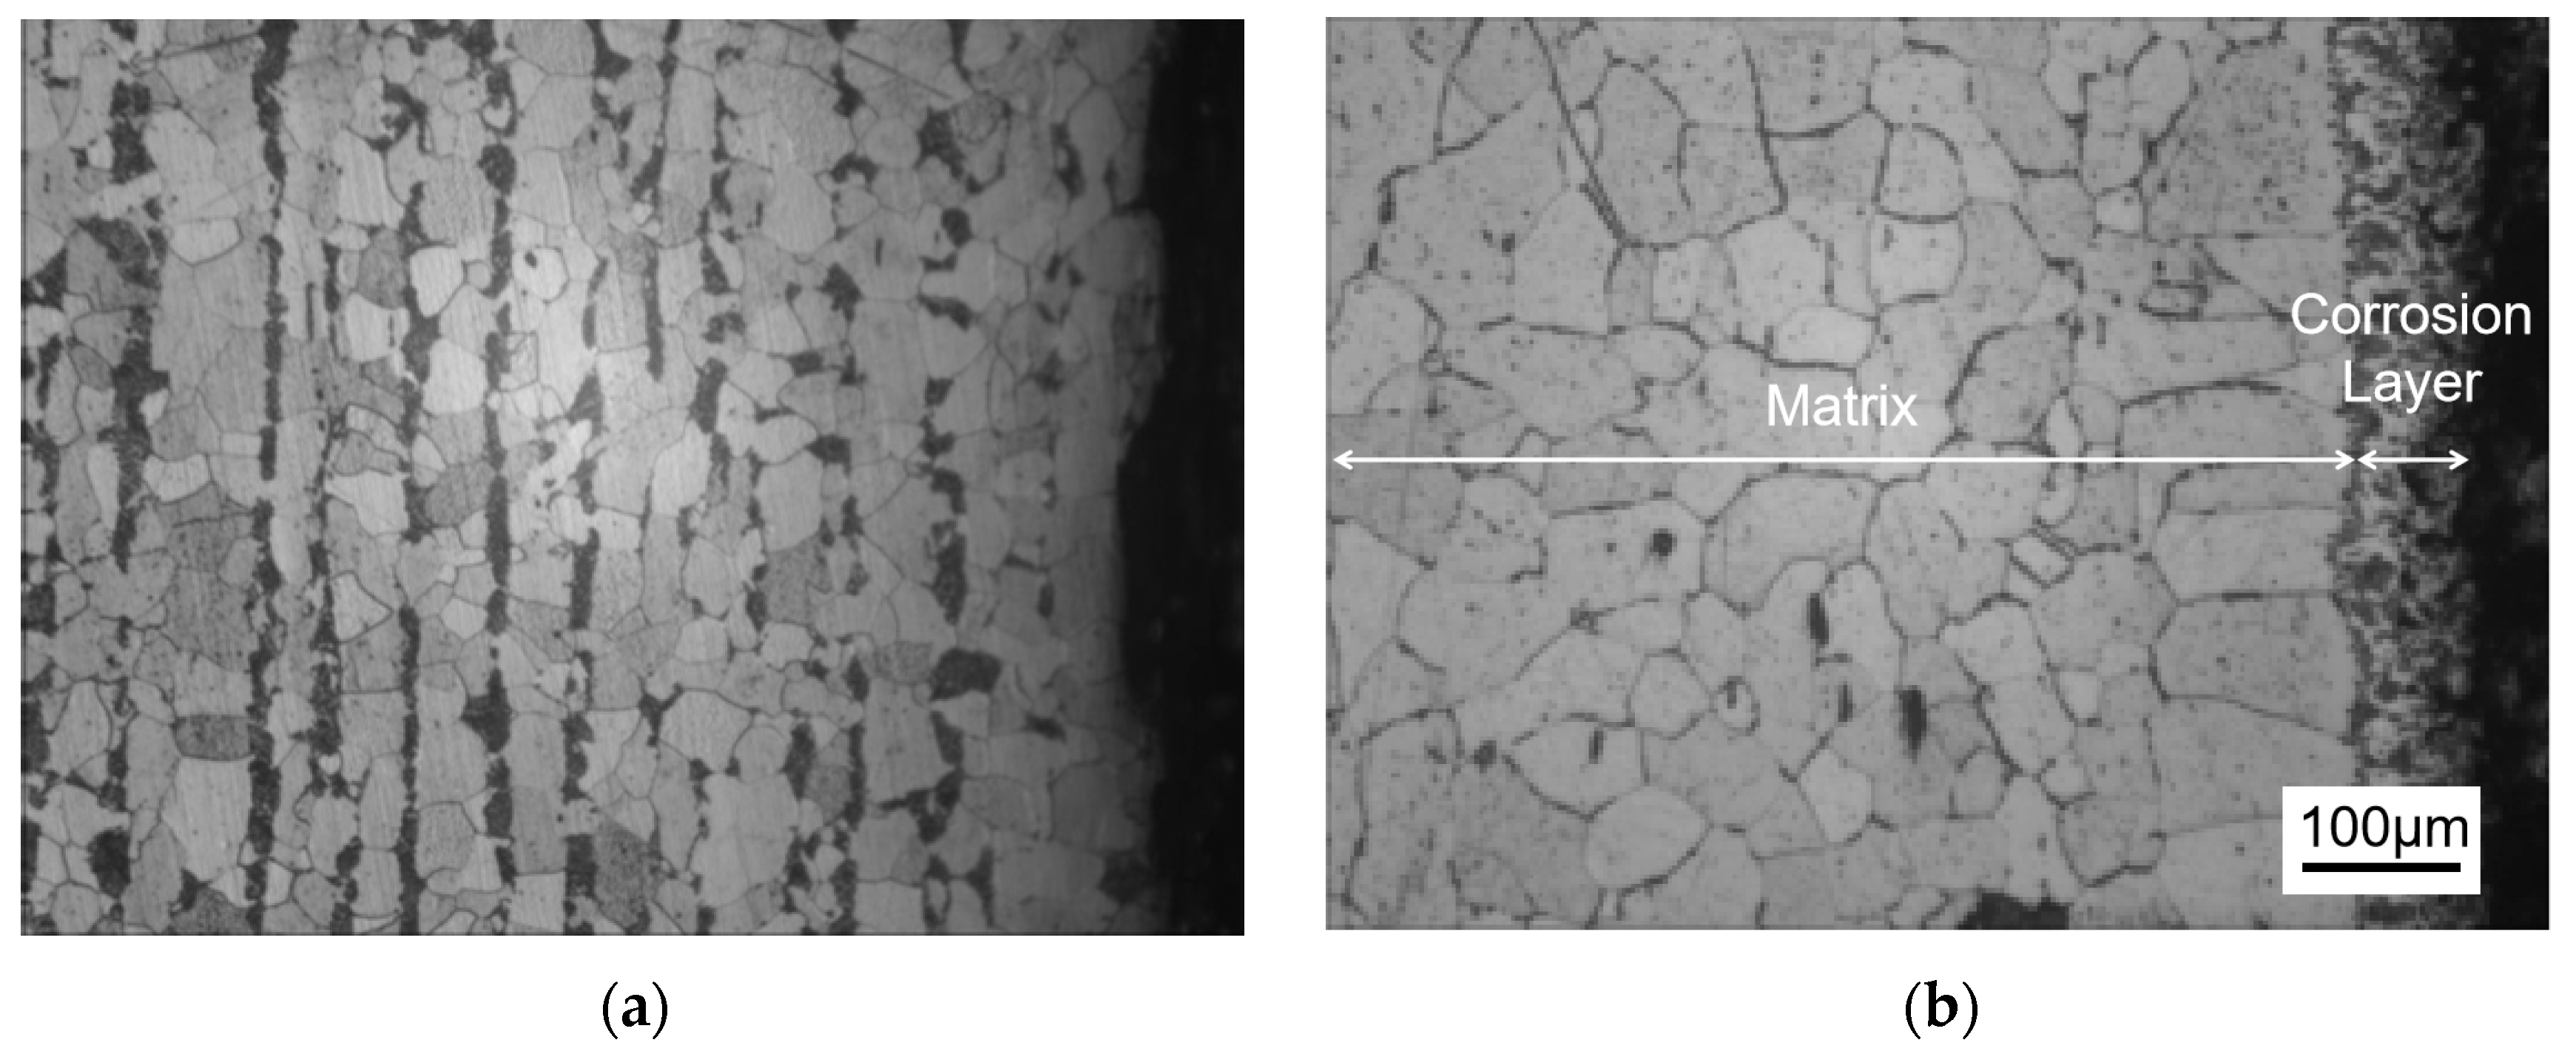
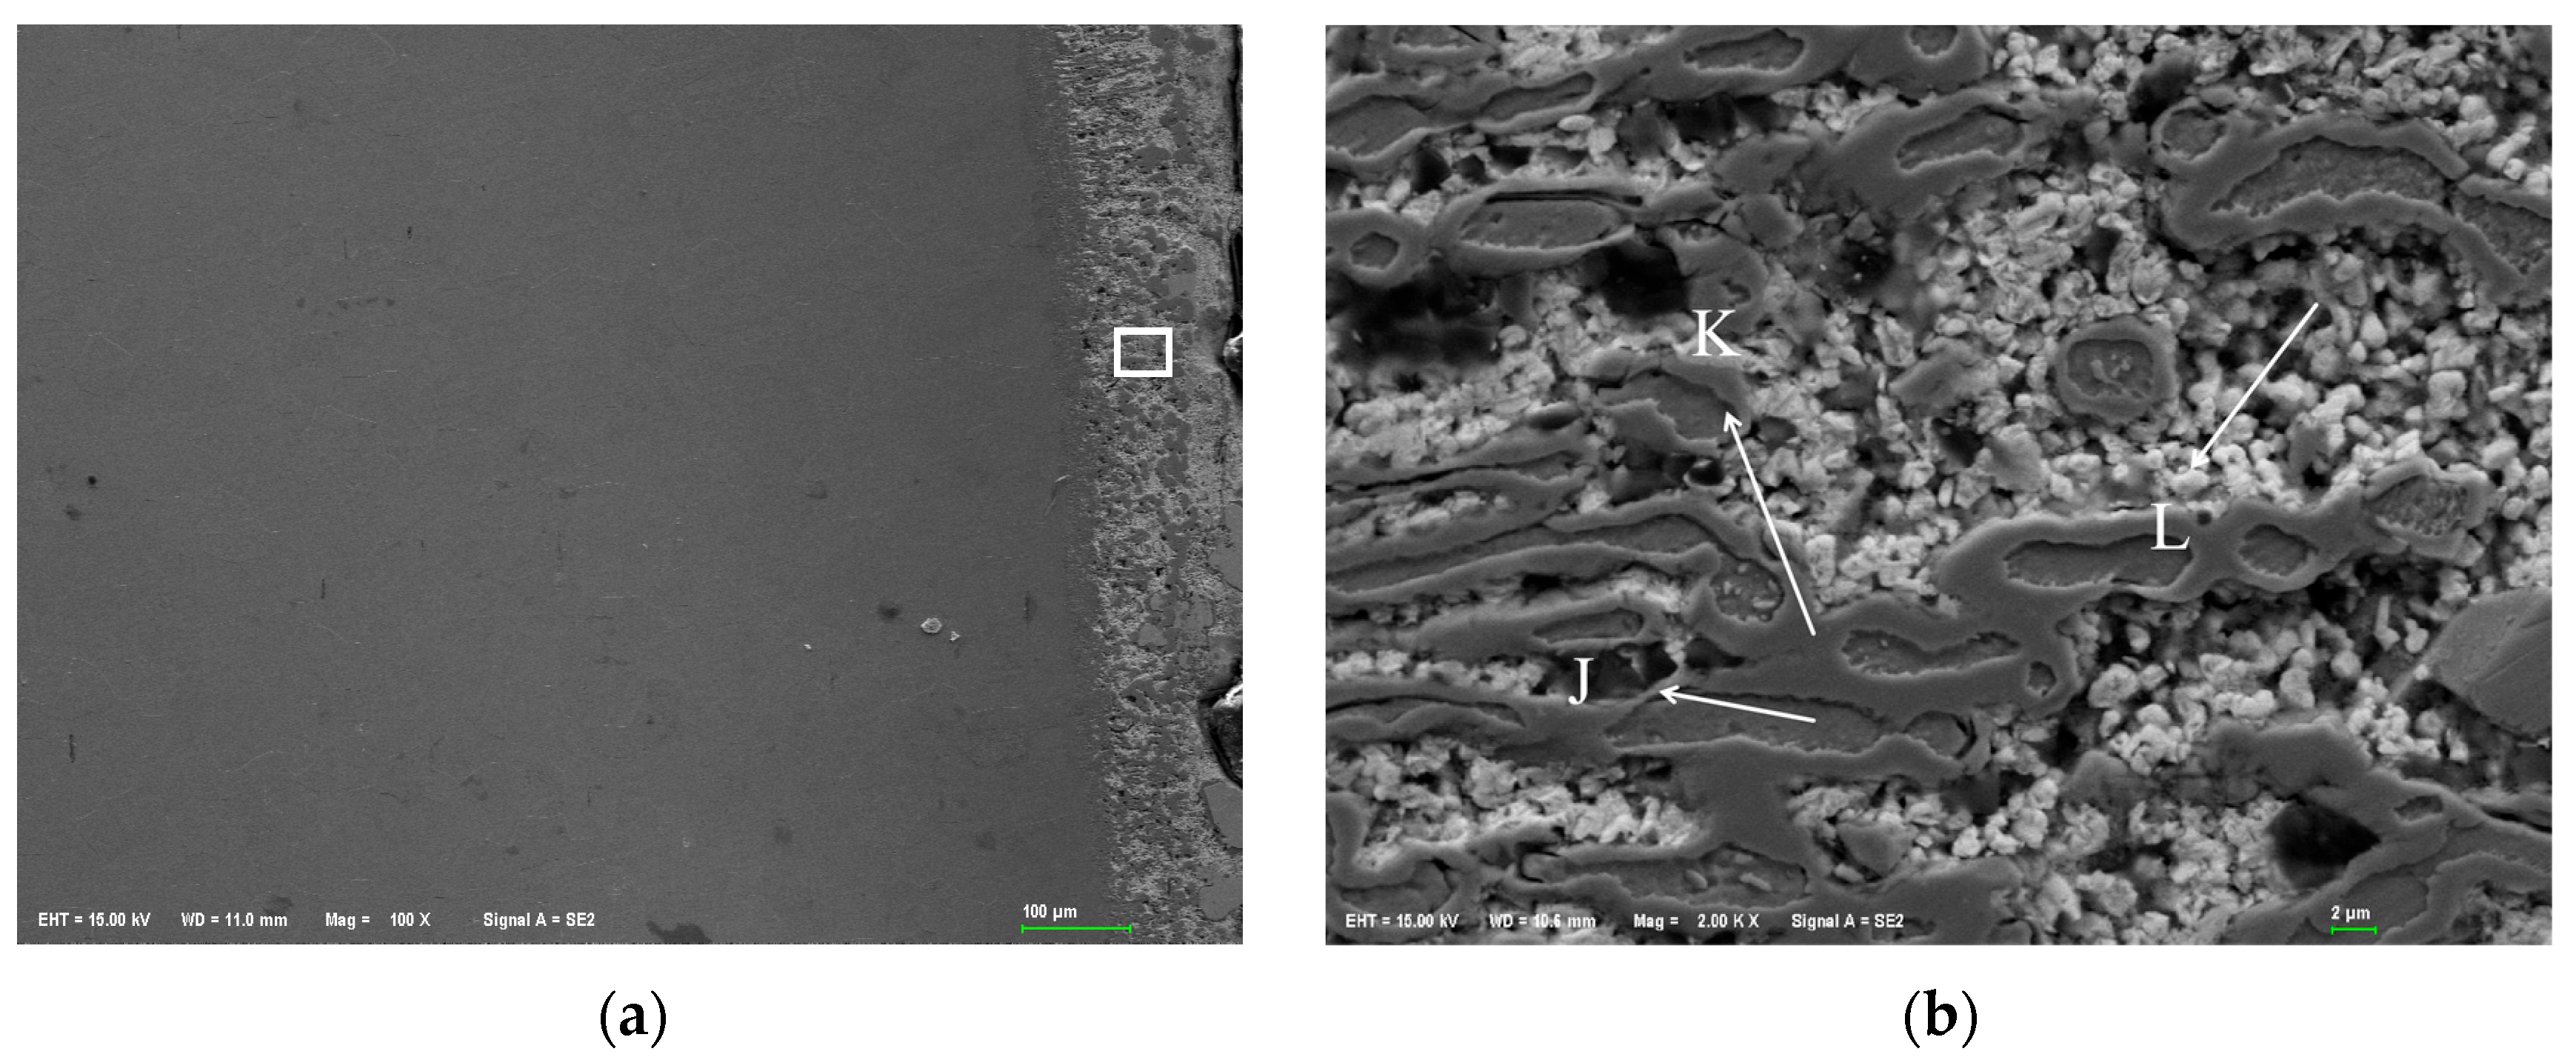
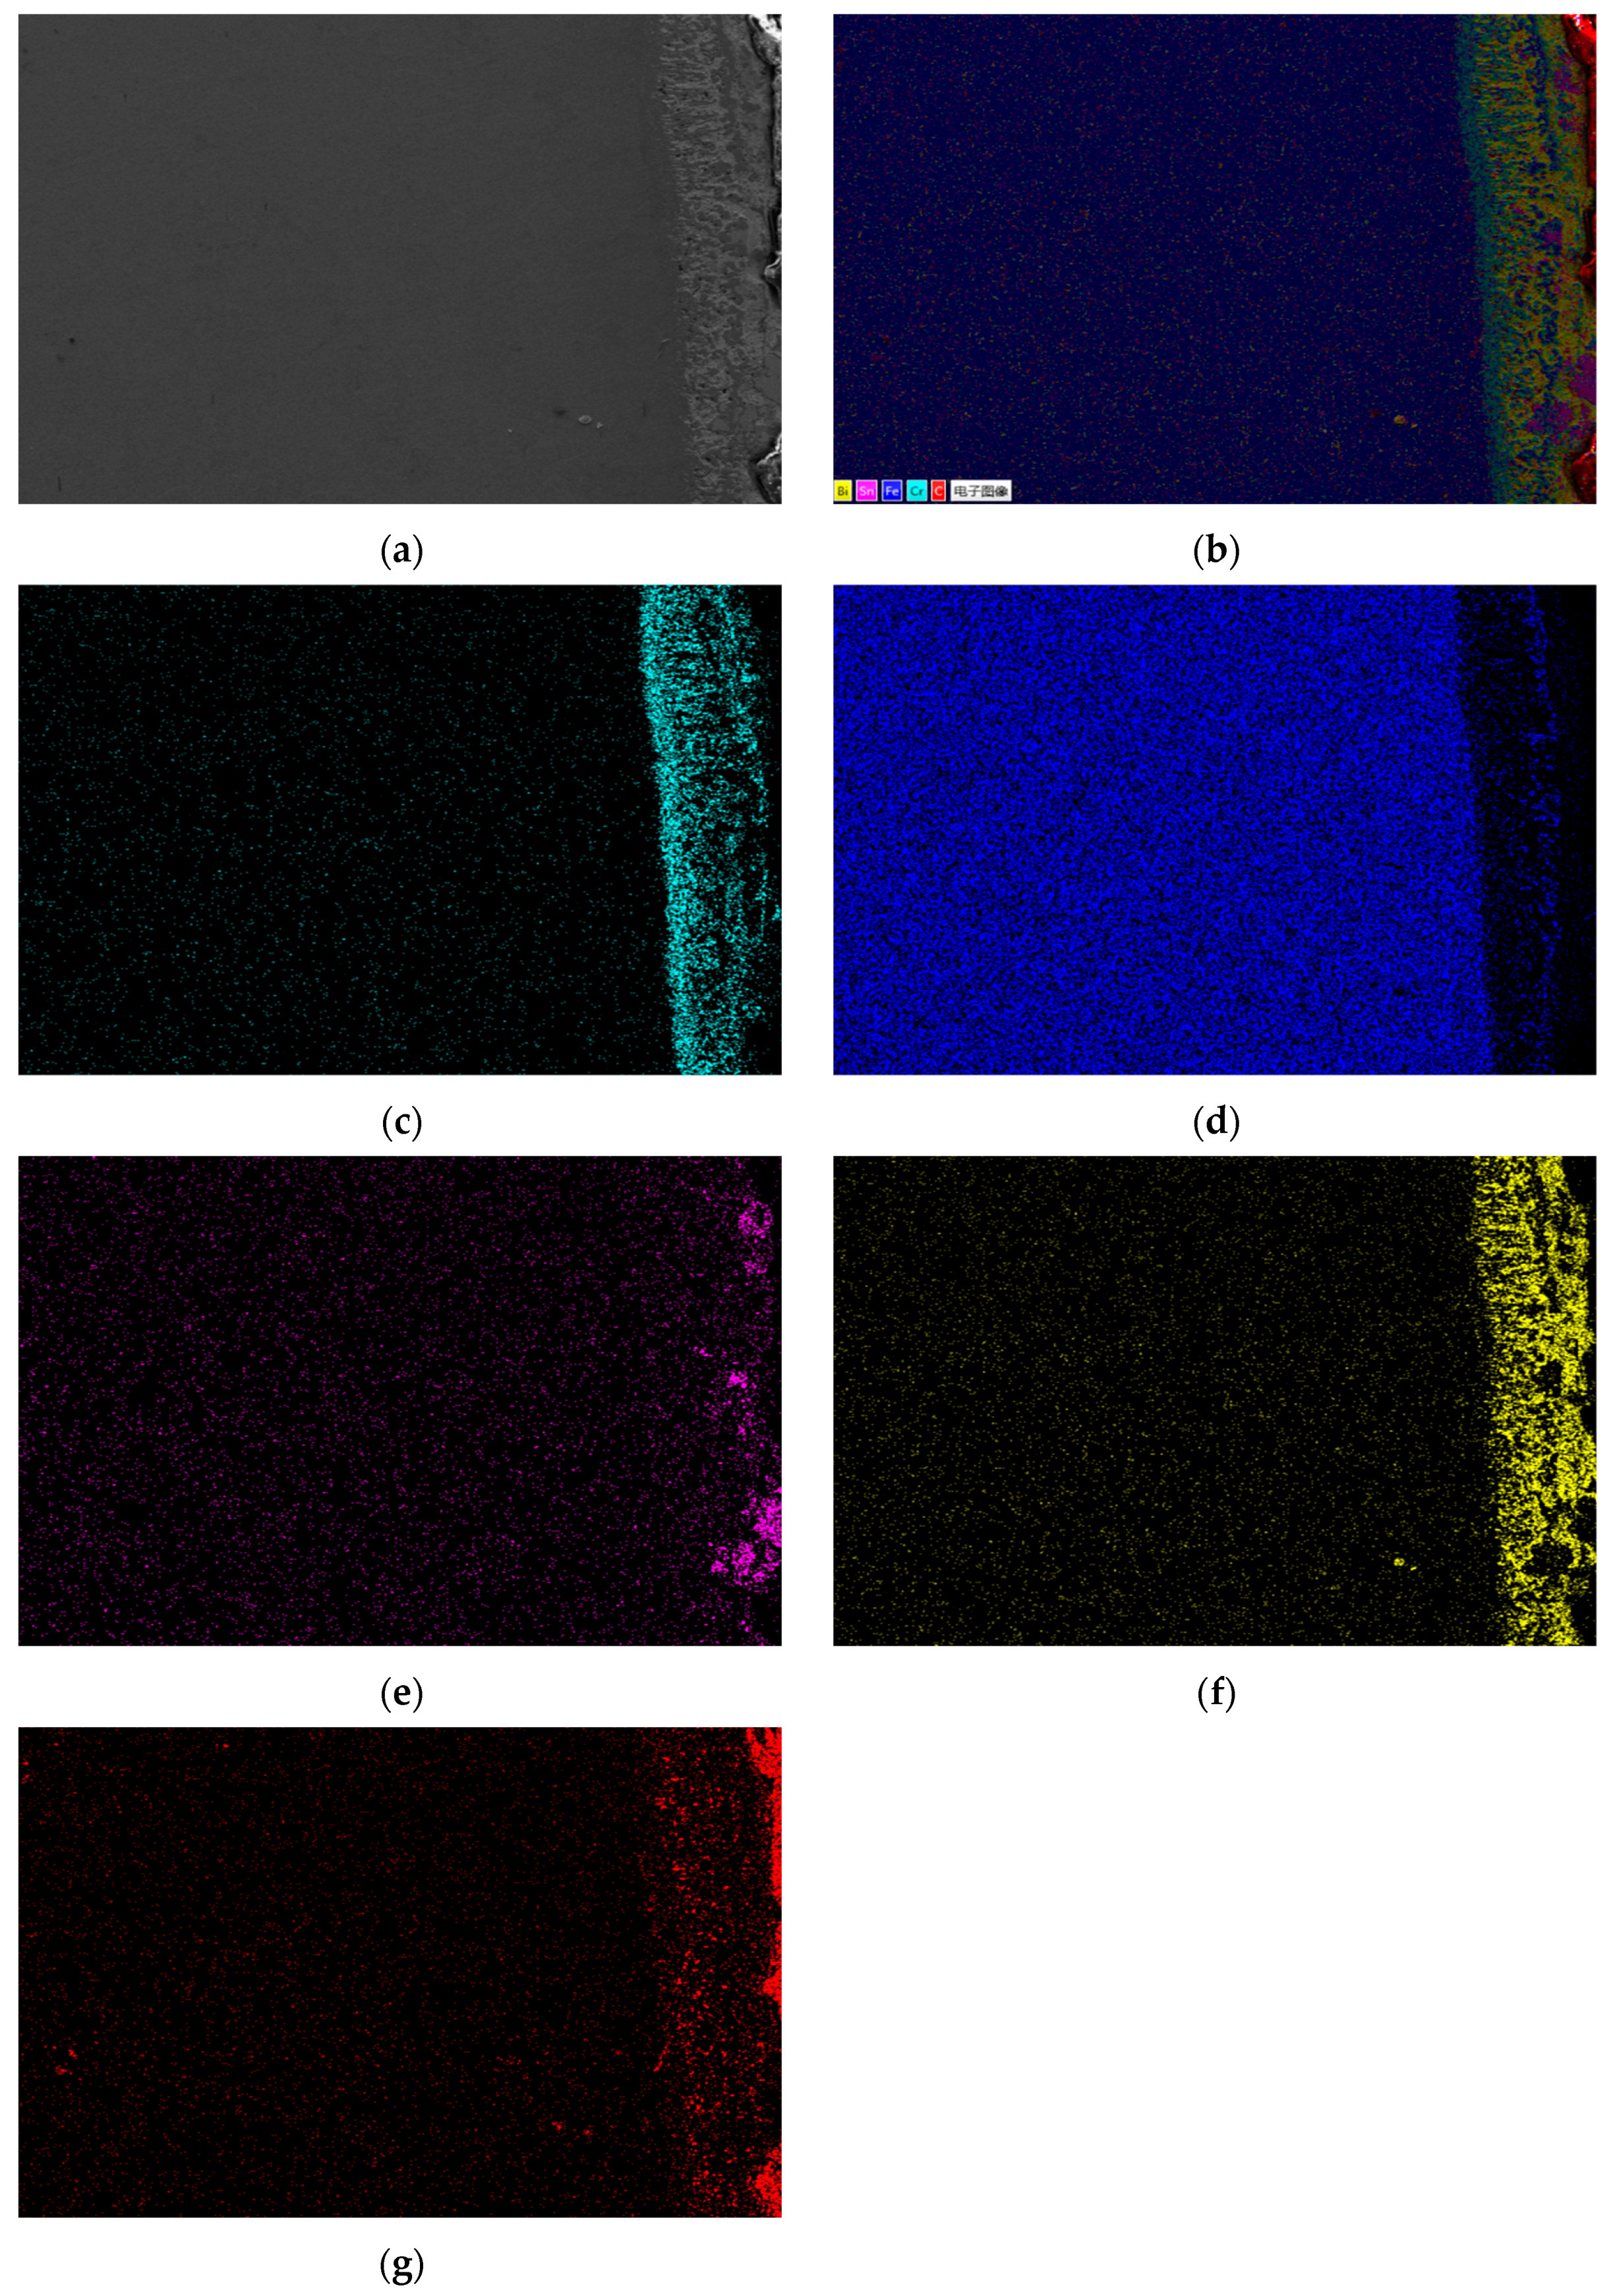
Figure 3 shows the metallographic structure of the cross-section of 20 carbon steel before and after corrosion for 180 h. The high-temperature resistant liquid Sn-Bi-Zn alloy of 20 carbon steel has good corrosion resistance, and the interface of the corrosion layer is obvious. It is composed of a very thin corrosion layer at the edge and the substrate. In the corrosion layer, Sn-Bi-Zn alloy mixes with the Fe substrate and corrodes from the outside to the inside, perpendicular to the interface. The grain size of the matrix increases compared to before corrosion, and the metallographic structure before corrosion consists of white ferrite and dark pearlite. After corrosion, the pearlite basically disappears, and black granular carbides are produced in the matrix area.
3.3. Analysis of Diffusion Kinetics of Sn-Bi-Zn Alloy Components in Different Steels
The EDS energy spectrum analysis results indicate that the thickness of the corrosion layer is consistent with the diffusion distance of Sn, Bi, and Zn elements in the steel. Therefore, the diffusion distance of alloy elements in different steels can be directly obtained by calculating the corrosion thickness of the steel. This article uses the element Sn as a standard, calculates the diffusion coefficient of Sn element in steel according to Fick’s diffusion law, and quantitatively analyzes the diffusion behavior of Sn atoms in steel. The diffusion equation of dissimilar metals in steel is:
where x is the diffusion distance, t is the diffusion time, C
0 is the initial concentration, C is the concentration at the diffusion distance of x, and D is the diffusion coefficient.
There is a linear relationship between C (x, t) and x/. The diffusion coefficient D was calculated using Fick’s second law. For a fixed concentration C at the corrosion front, the relationship x2 = K(C)·t was derived, where K(C) = 4Dβ2. Here, β is determined by the error function solution to Fick’s law for the selected C. By plotting x2 versus t, the slope K(C) was obtained, enabling the calculation of D. This method ensures K(C) remains consistent for the defined concentration threshold, validating its use as a concentration-dependent constant in our analysis.
The thickness of the corrosion layer of the steel was obtained by an optical microscope. The diffusion coefficient D was calculated using the relationship x
2 = K(C)⋅t, where x is the corrosion layer thickness and K(C) is a proportionality constant. This approach aligns with the mean square displacement framework (<x
2> = 2Dt) but incorporates additional factors specific to the steel microstructure and Sn-Bi-Zn interaction. By plotting x
2 versus t (
Figure 13 and
Figure 14), the slope K(C) was obtained. Using the error function solution to Fick’s law, K(C) was expressed as 4Dβ
2, where β is determined by the concentration threshold at the corrosion front. The derived D values reflect the combined effects of lattice and grain boundary diffusion, consistent with the observed corrosion severity across steel types. The average value of the thicknesses of the corrosion layers at ten different positions was taken, and the specific results are shown in
Table 4.
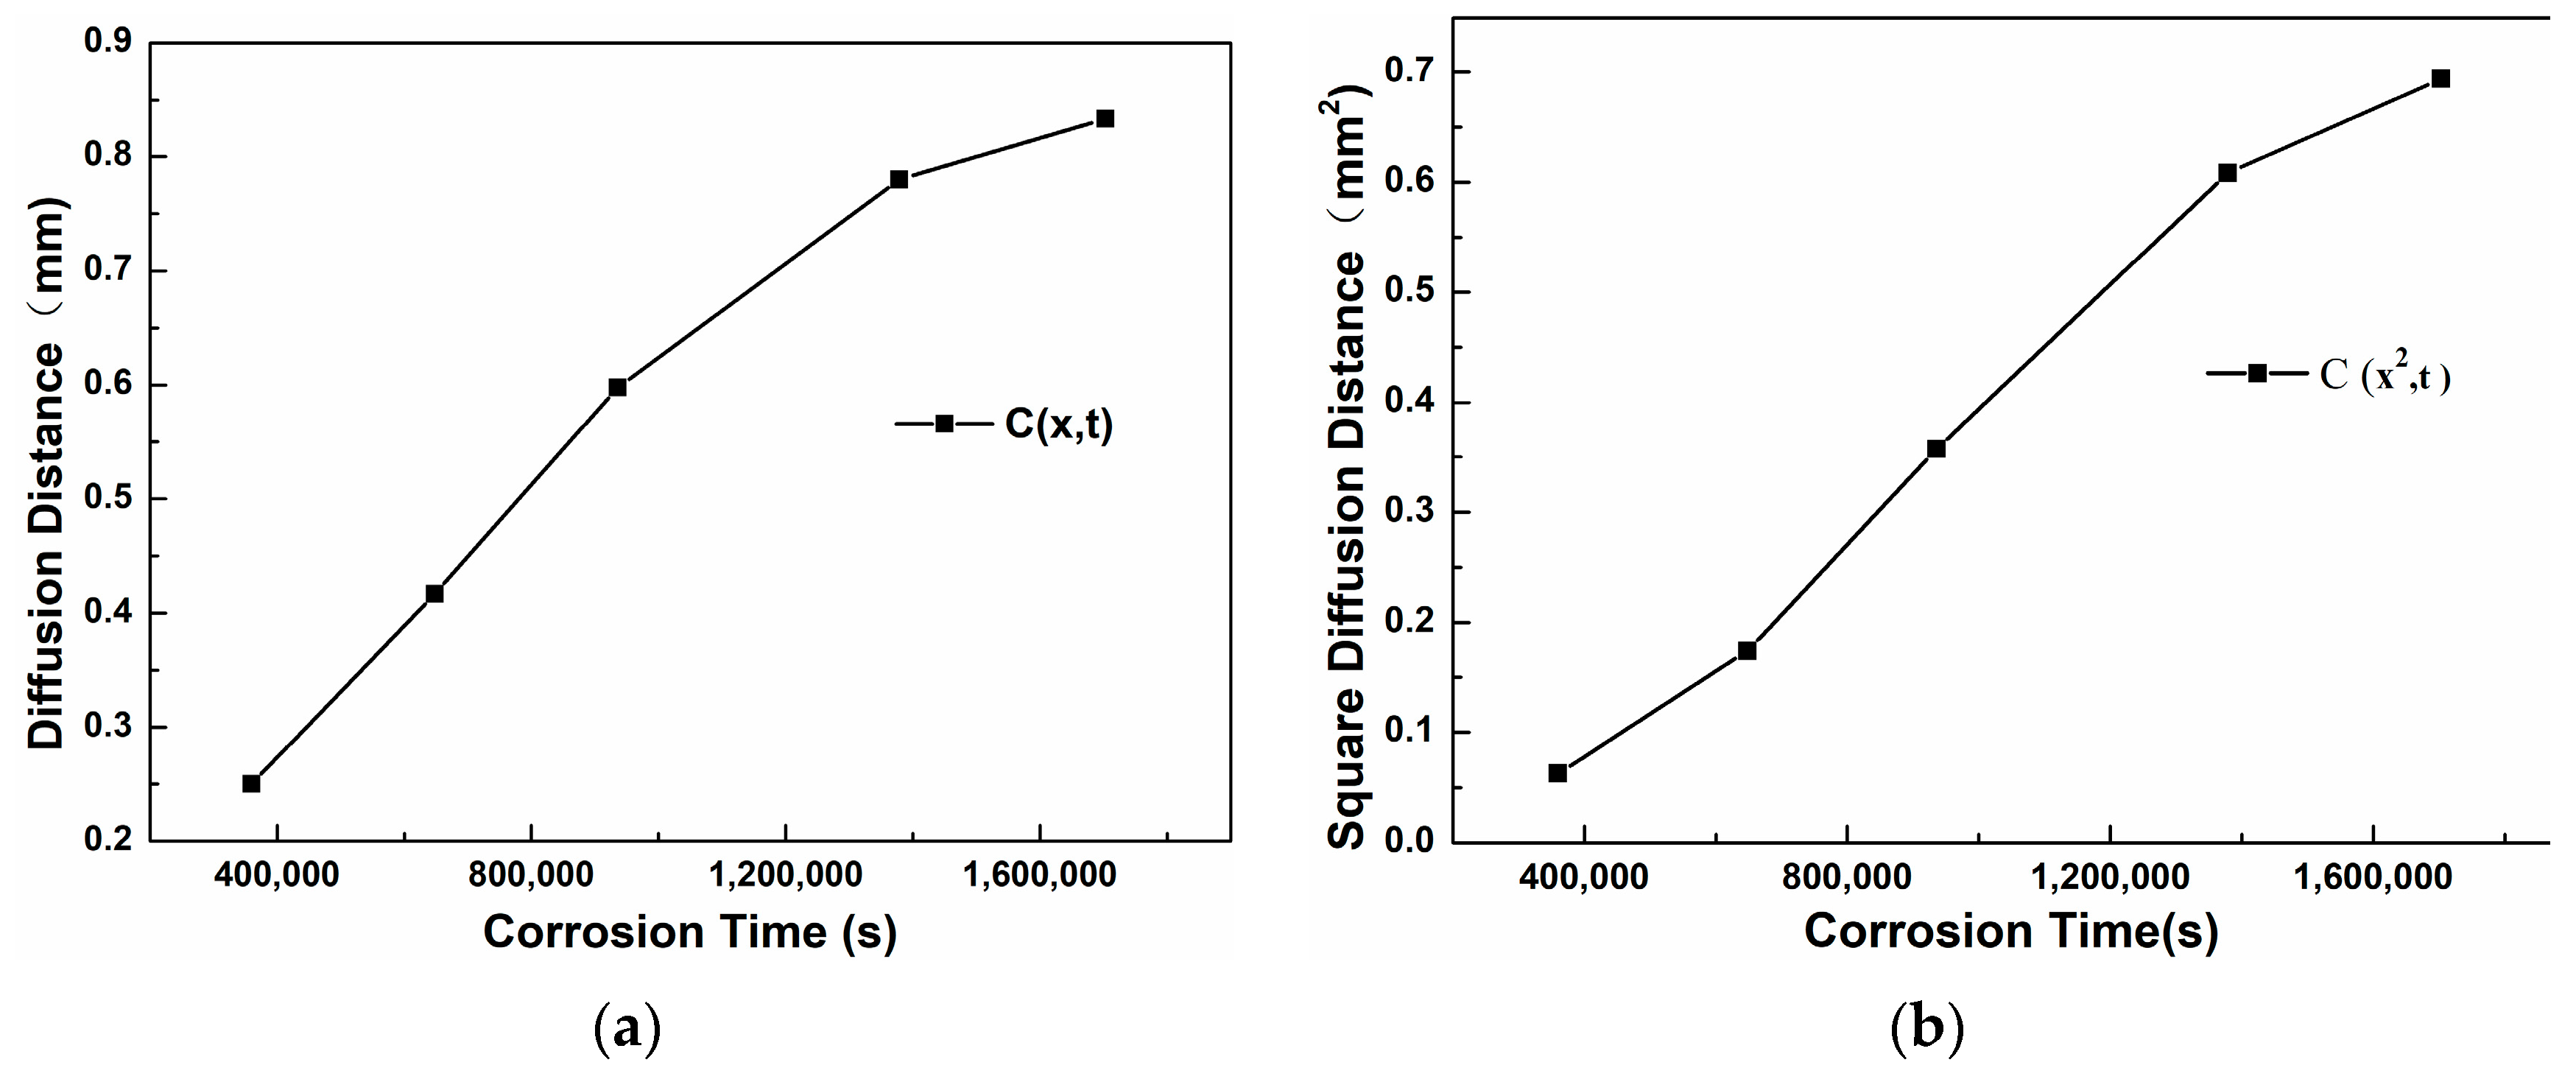
Figure 13a shows the trend curve of the thickness of the corrosion layer of 304 stainless steel changing with the corrosion time. It can be seen that as the corrosion time increases, the slope of the curve becomes smaller, indicating that the diffusion rate decreases with the increase of time.
Figure 13b is the curve of x
2 changing with t. Through linear fitting, the equation x
2 = 4.97 × 10
−7 t is obtained, that is, K(C) = 4.97 × 10
−7. The assumption erf(β) ≈ 1 was based on a threshold concentration C = 0.01C
0, corresponding to β ≈ 1.82. While erf(1.82) = 0.99, this approximation simplifies calculations without significantly affecting D, as confirmed by refined analysis. Further calculation gives the diffusion coefficient D
304 = K(C)/4β
2 = 3.7 × 10
−8 mm
2/s.
It can be seen from
Table 5 that 310S heat-resistant steel completed corrosion after 180 h, with a corrosion distance of 1.500mm, K(C) = 3.2639 × 10
−6. At 600 °C corrosion, the diffusion coefficient D310S of alloy elements inside the 310S matrix is 2.51 × 10
−7 mm
2/s, so the high-temperature corrosion resistance of 310S heat-resistant steel is extremely poor, far inferior to stainless steel.
Table 6 shows the thickness of the corrosion layer of 20 carbon steel after different corrosion times.
Figure 14a is the curve of the diffusion distance changing with the corrosion time. It can be seen that as the time increases, the slope of the curve first becomes larger from a smaller value and then decreases and tends to be stable.
Figure 14b is the curve of the square of the diffusion distance changing with time. Through linear fitting, the equation x
2 = 3.81 × 10
−9 t is obtained, that is, K(C) = 3.81 × 10
−9. Further calculation gives the diffusion coefficient D
20C= K(C)/4β
2 = 2.87 × 10
−10 mm
2/s.
Through comprehensive comparison, the calculated diffusion coefficients are D20C < D304 < D310S. The diffusion rate of Sn element is the highest in 310S heat-resistant steel and the lowest in 20 carbon steel. EDS energy spectrum analysis shows that in the corrosion areas of 310S and 304, a large amount of Ni element is lost. In stainless steel and heat-resistant steel, the Sn element infiltrates through grain boundaries, and there is a concentration gradient between the Ni element and grain boundaries, which promotes the continuous precipitation of the Ni element from between grains, migration to grain boundaries, and finally loss to the liquid metal. The results show that in stainless steel and heat-resistant steel, the Ni element exists in the form of solid solution and intermetallic compounds in Fe crystals, and Ni and Fe elements maintain equilibrium with each other. When stainless steel and heat-resistant steel are in liquid Sn alloy, the Sn element diffuses into Fe crystals due to the concentration gradient, breaking this equilibrium. This causes the continuous precipitation of Ni element solid solution in Fe crystals. Therefore, the diffusion rate of Sn element in Ni-containing stainless steel and heat-resistant steel is much higher than that in 20 carbon steel without Ni element.
3.4. Analysis of the Dissolution Process of Steel in High-Temperature Molten Metal
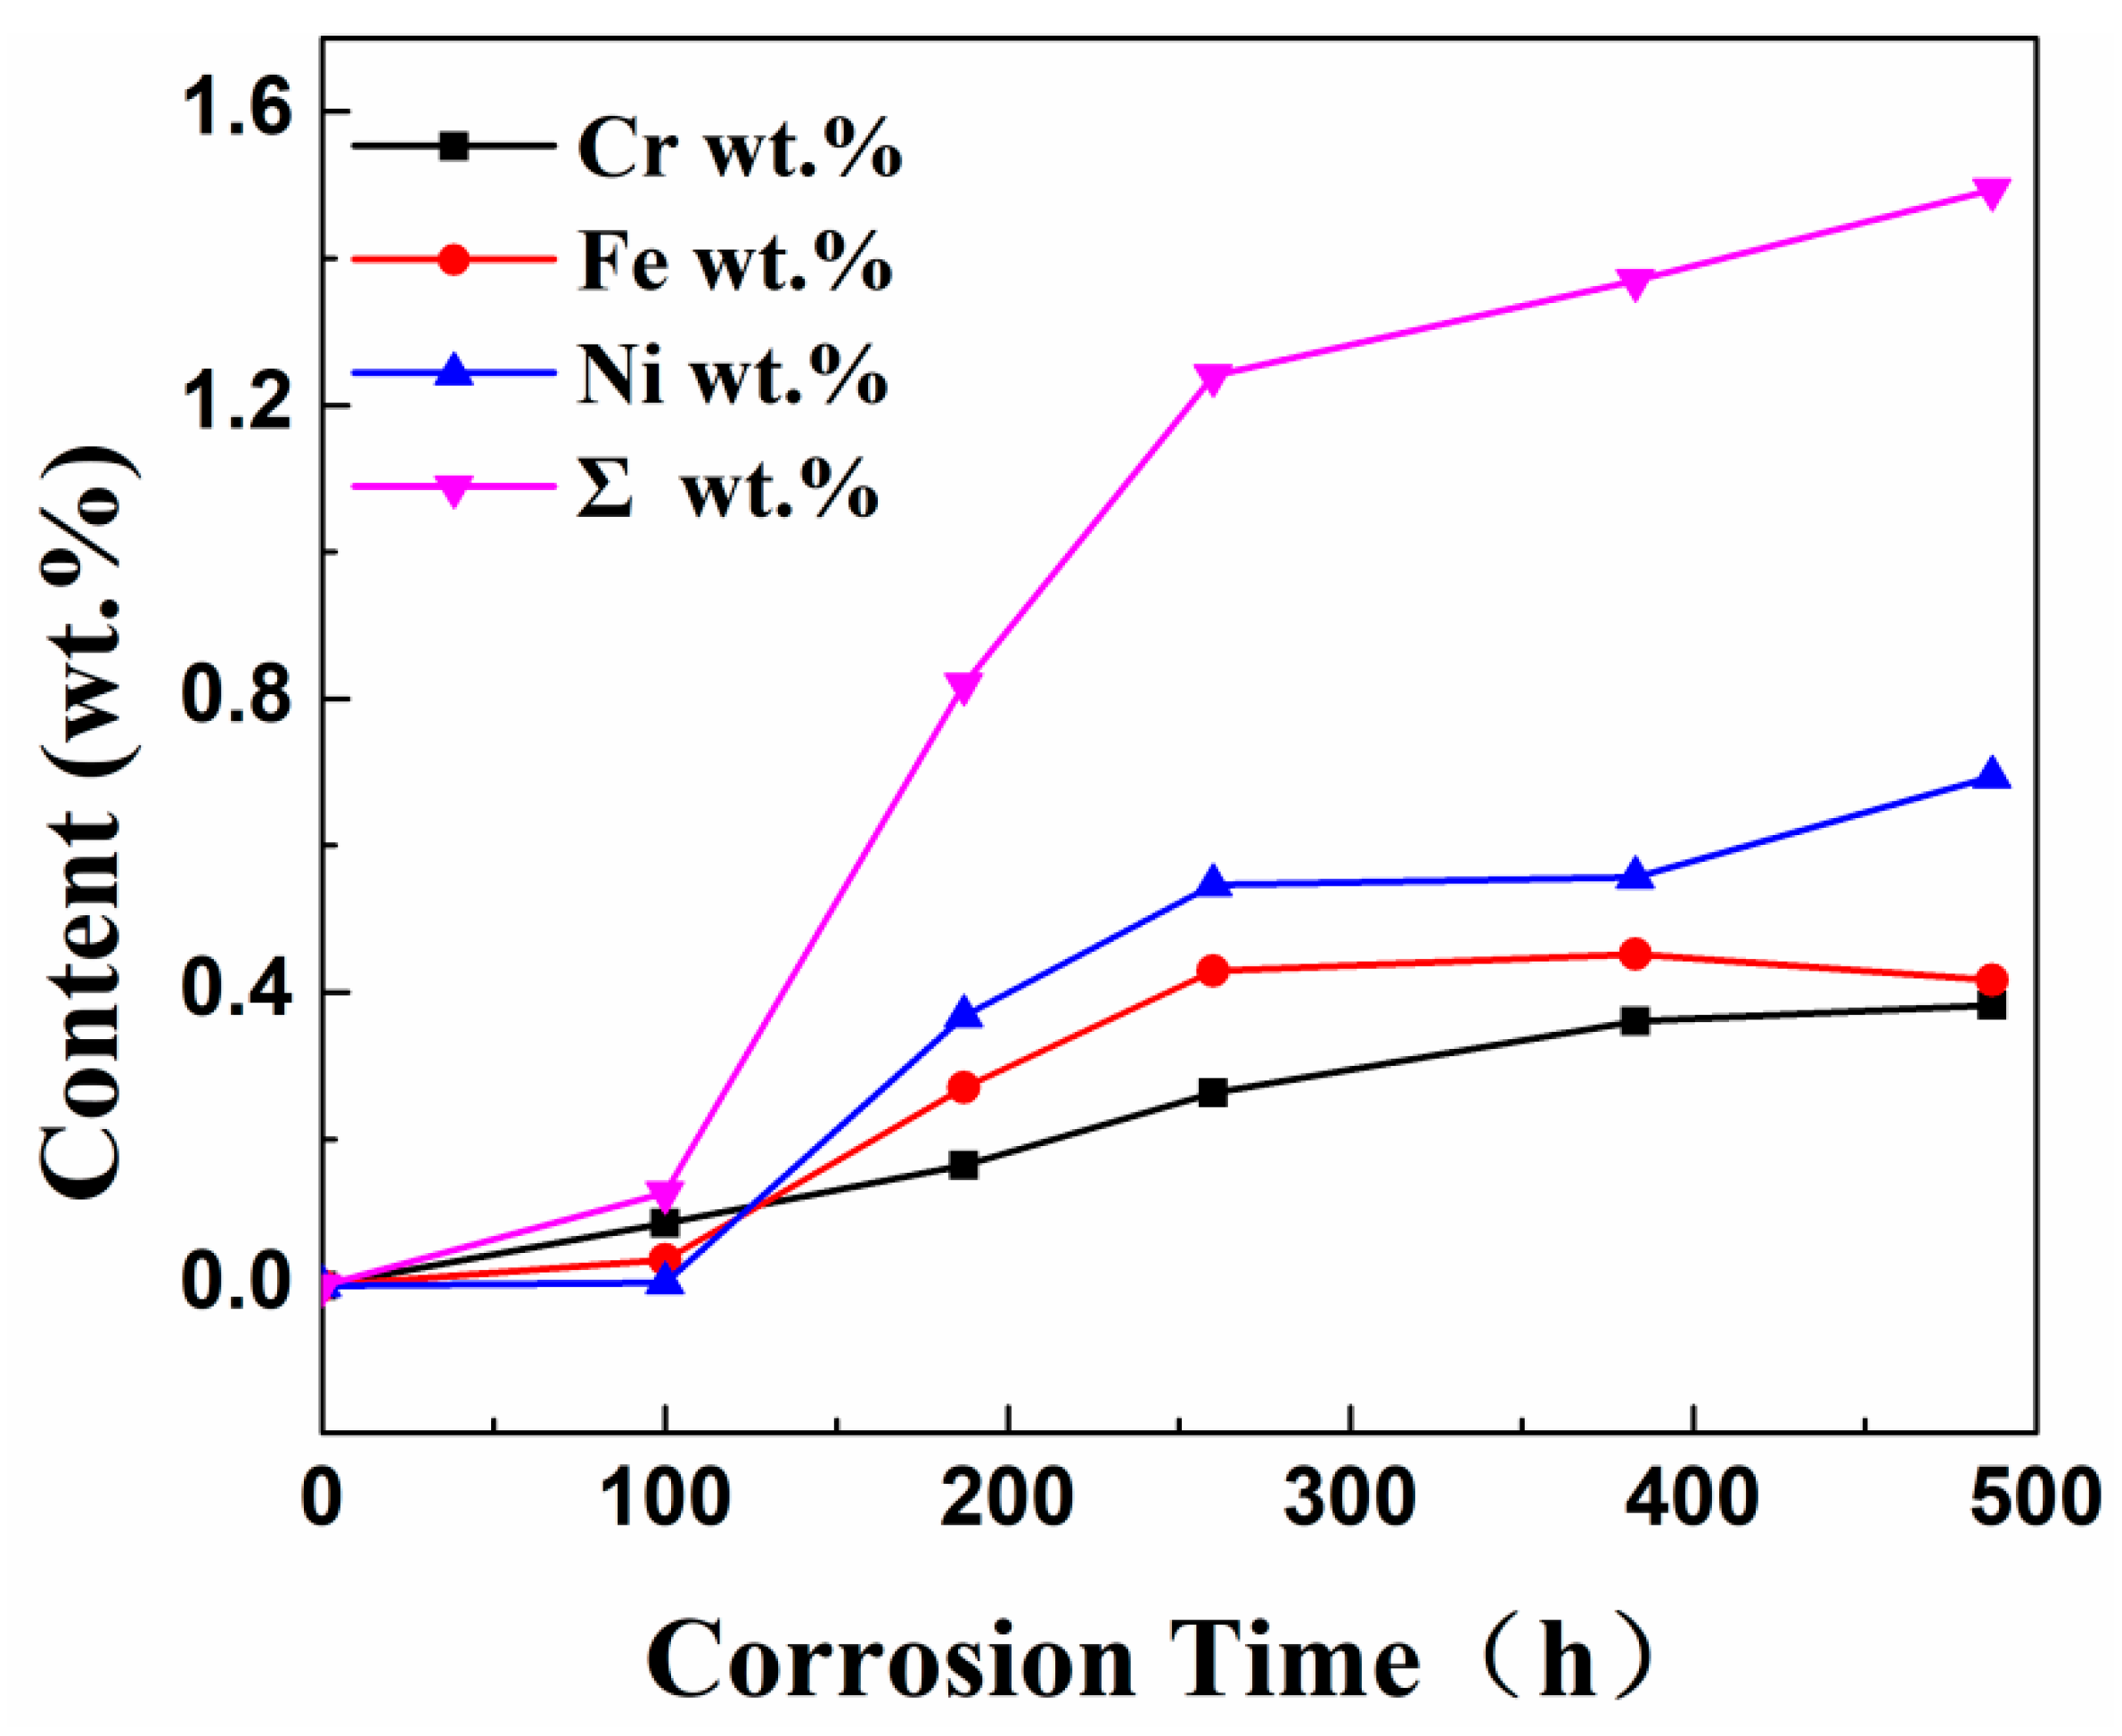
Table 7 shows the XRF fluorescence elemental analysis results of the Sn-Bi-Zn alloy after corrosion. Fe, Cr, and Ni elements are present in the corroded alloy solution.
Figure 15 shows that as the corrosion time increases, the content of Fe, Cr, and Ni elements gradually increases, indicating that the steel sheet is exposed to the liquid high-temperature Sn-Bi-Zn alloy. While Sn, Bi, and Zn diffuse into the steel interior, the steel components also dissolve into the alloy interior.
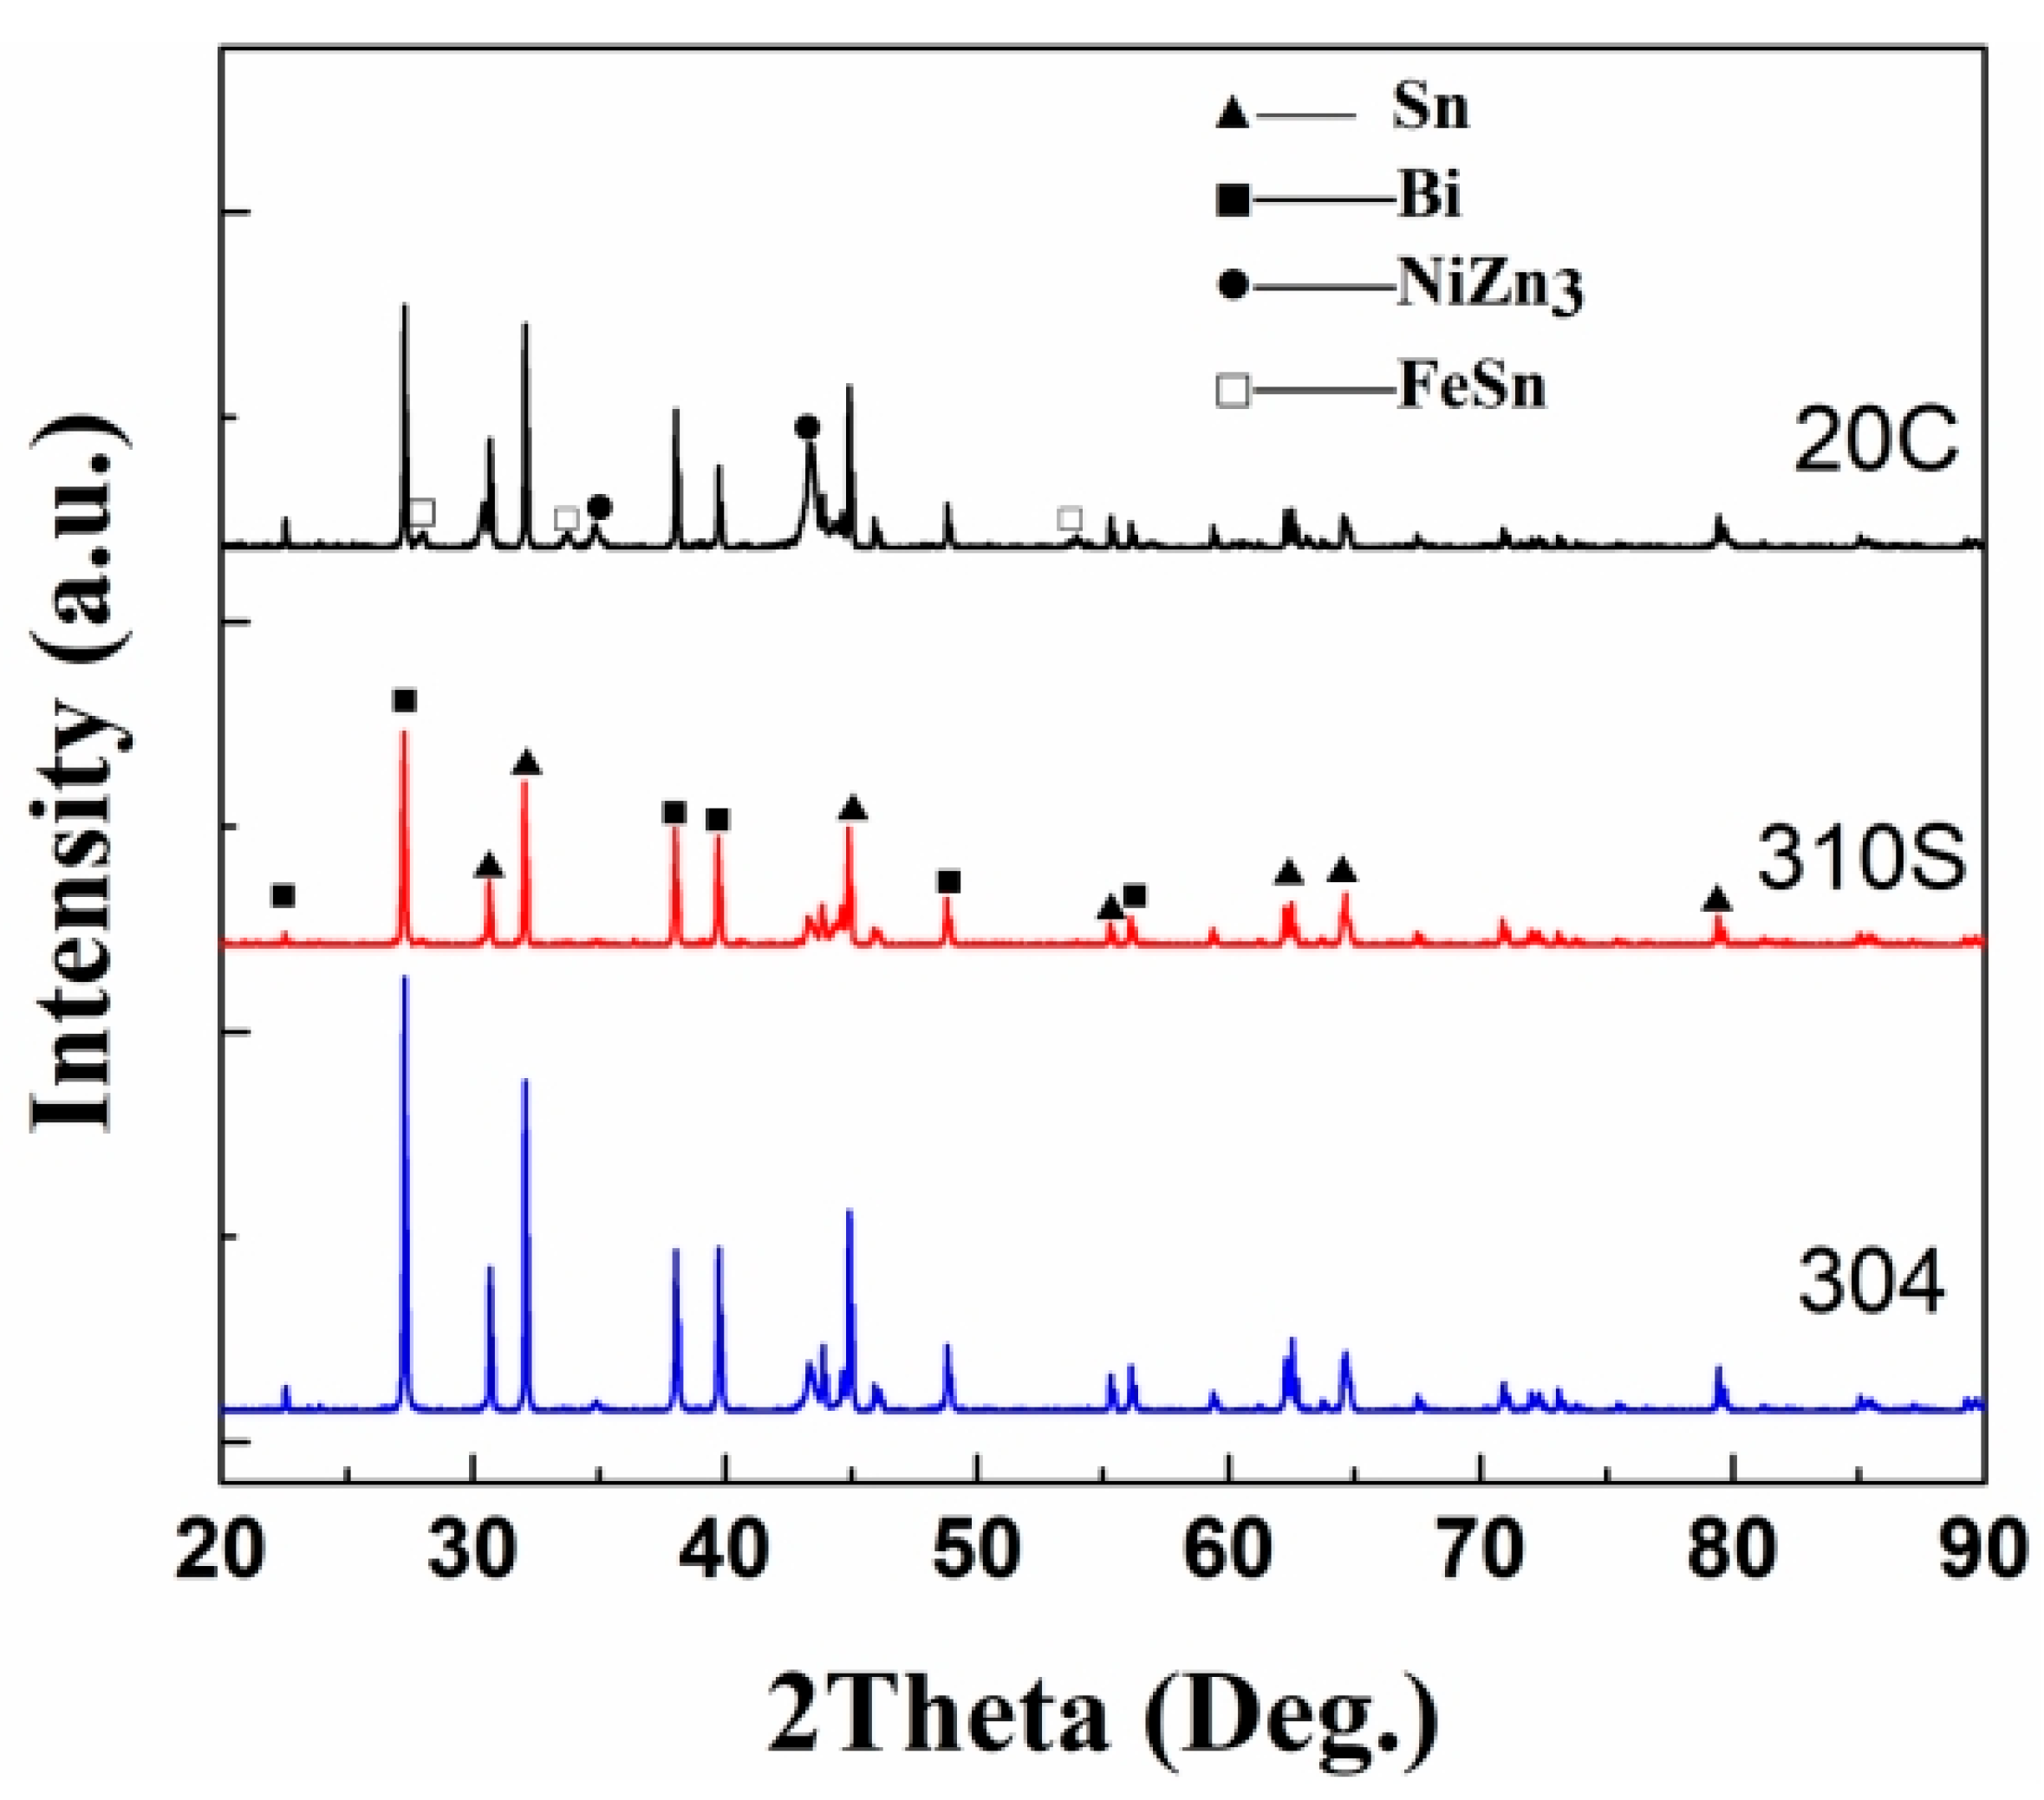
The surface phase composition of the material was analyzed using an X-ray diffractometer, and the results are shown in
Figure 16. The XRD analysis results show that in the XRD pattern of 304 stainless steel, in addition to the diffraction peaks of Sn and Bi, the diffraction peaks of the intermetallic compounds NiZn
3 and FeSn also appear. Considering the Ni-Zn alloy phase diagram [
29], the solidus temperature of NiZn
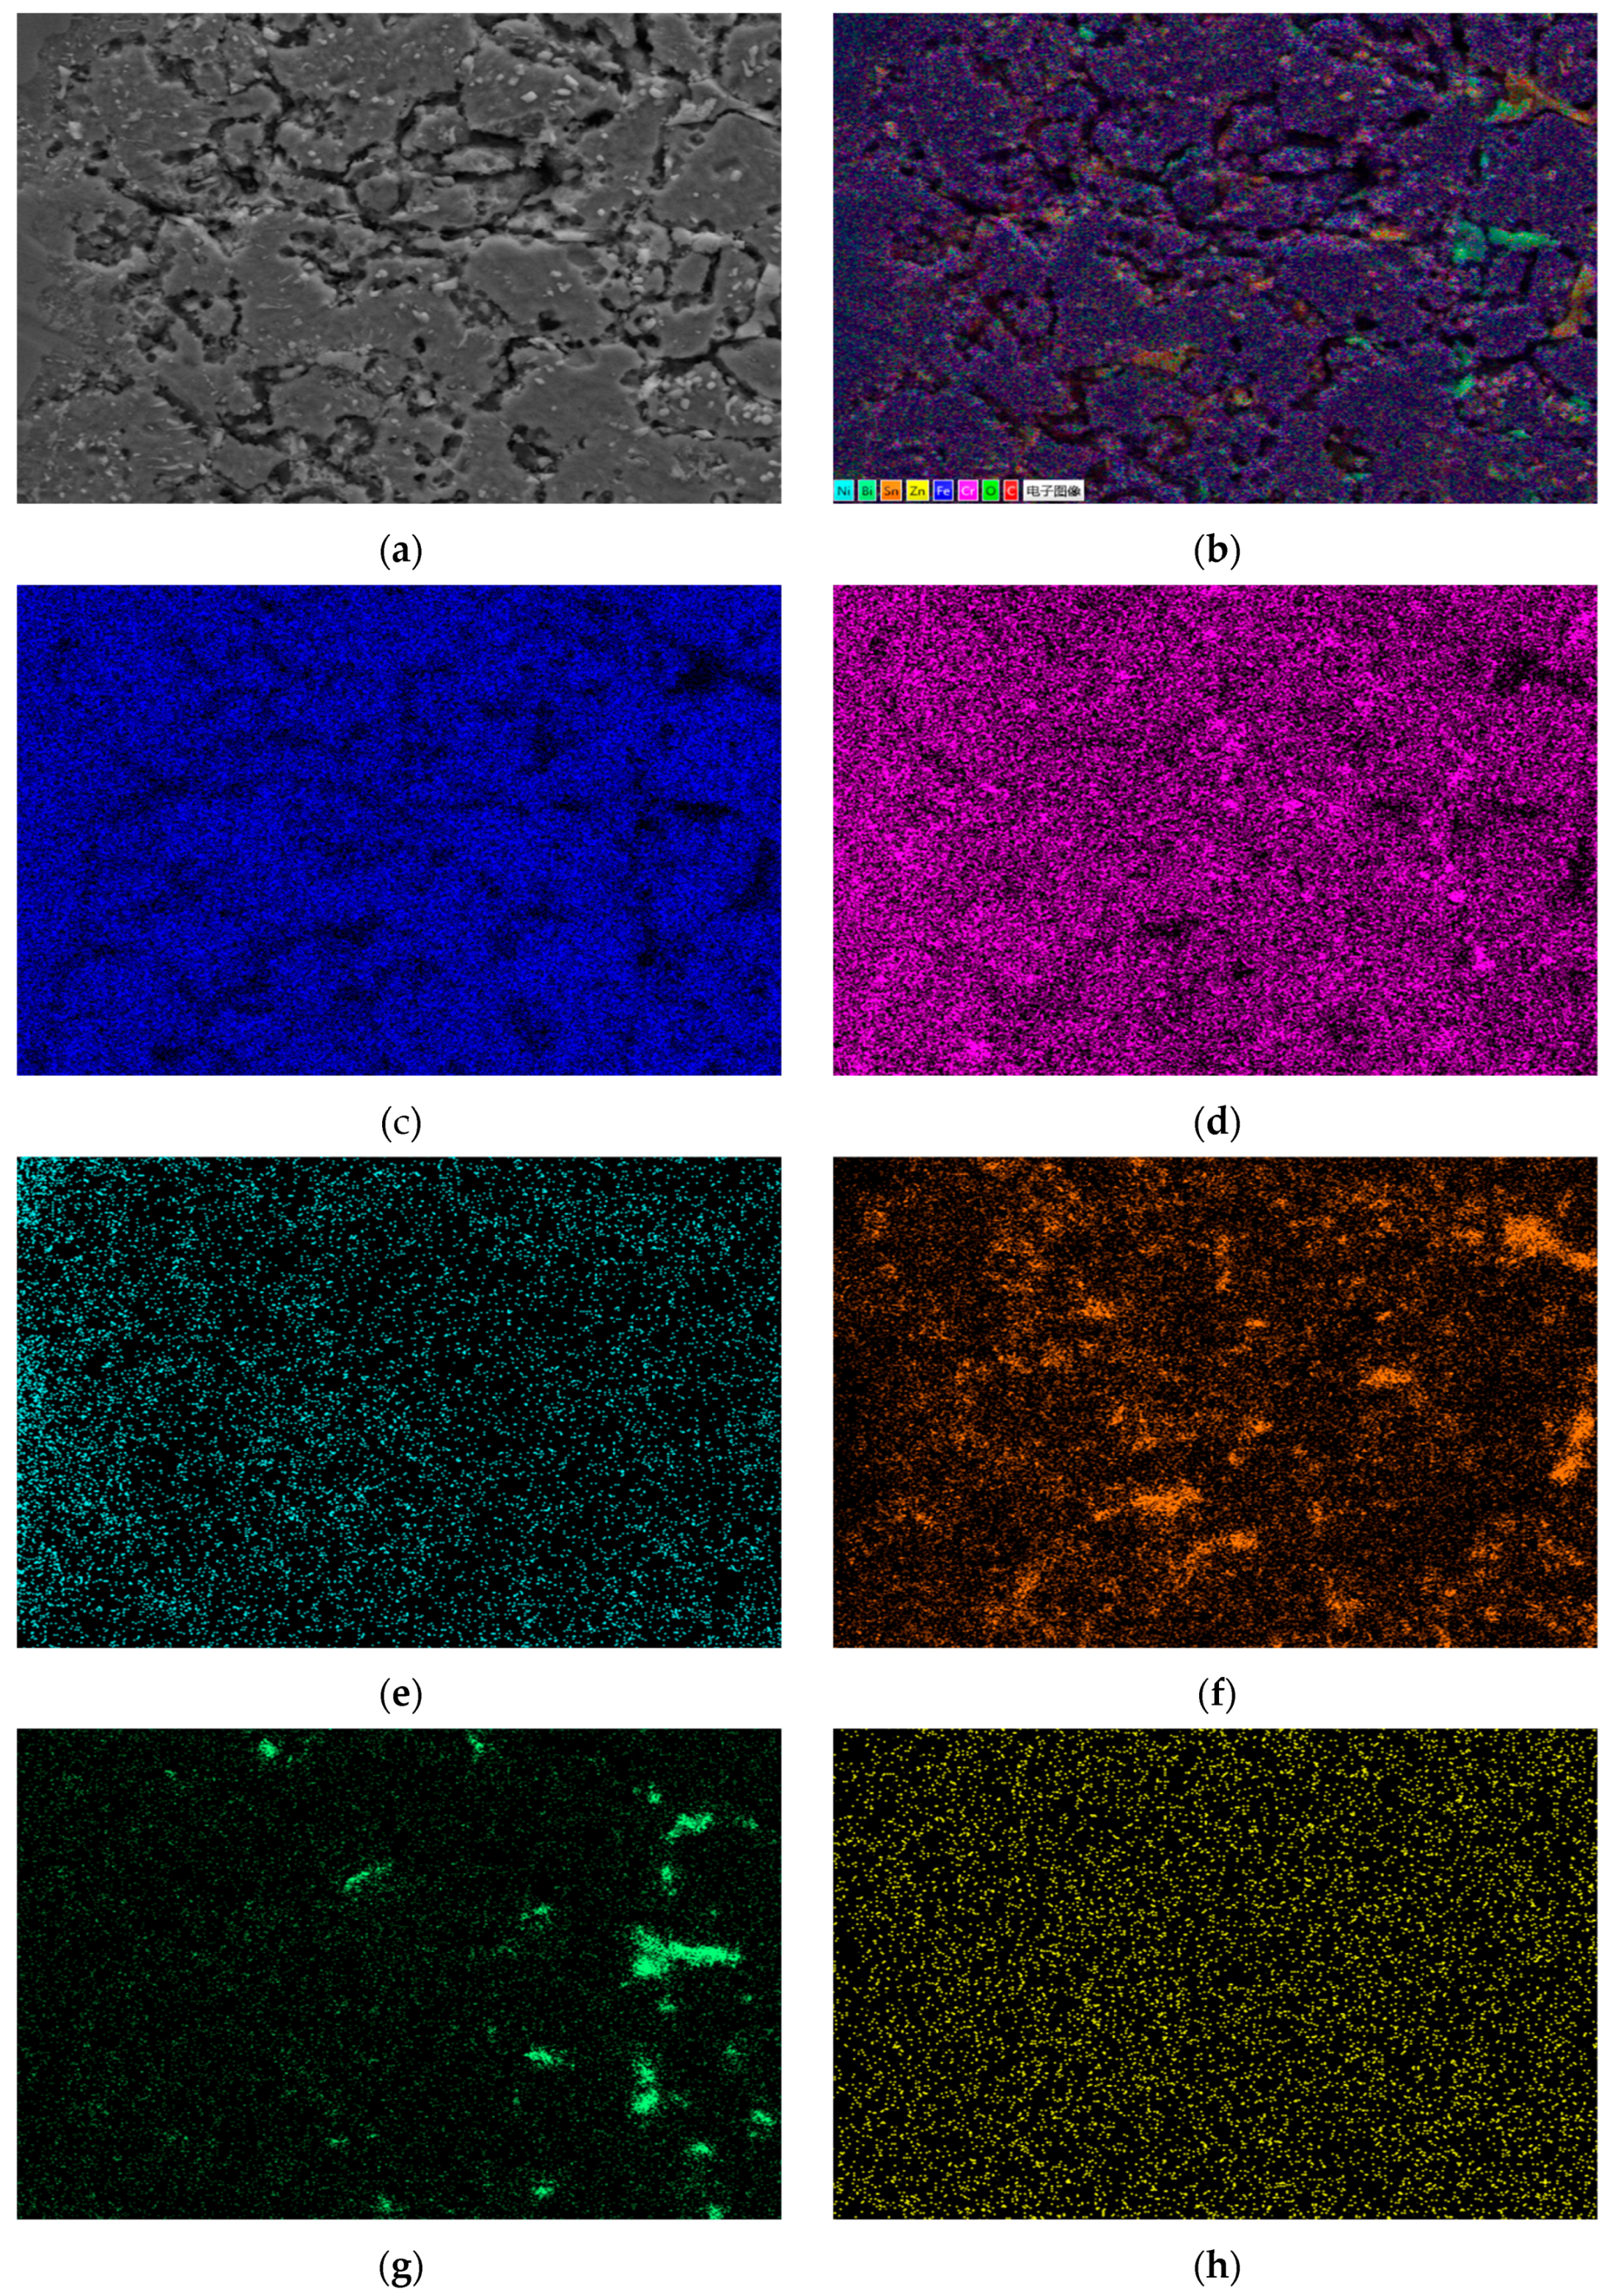
3 is 419.58 °C, and it forms in the Zn-rich region. In the energy-dispersive X-ray spectroscopy (EDS) surface scanning and point scanning element results of 304 stainless steel, almost no Ni element was detected in the corrosion layer, while the Ni element was concentrated in the surface area. It can be judged that the loss of Ni element is the result of the combined effects of Sn and Zn elements. Sn and Zn elements diffuse into the grain interior, changing the equilibrium relationship of the Fe(Ni) solid solution and simultaneously promoting the loss of Ni in the steel. Comparing the diffraction patterns of the three steels, the diffraction peak of NiZn
3 exists in all of them. However, compared with 304 stainless steel, the diffraction peaks of NiZn
3 in 310S heat-resistant steel and 20 carbon steel are very weak, indicating a relatively low content of this substance. The diffraction peak of the phase FeSn appears in 304 stainless steel, but it does not appear in 310S heat-resistant steel and 20 carbon steel. By referring to relevant literature, the Cr content in 310S reaches 18%, and the C content in 20 carbon steel is high. The affinity of Cr and C for Fe is much greater than that of Sn for Fe. At the same time, the Ni content in 304 is relatively high. The loss of Ni promotes the combination of Fe and Sn, resulting in the existence of the FeSn phase in 304, while it is absent in 310S and 20C. In the XRD pattern of the 304 stainless steel surface, the diffraction peaks of NiZn
3 and FeSn appear. Based on the analysis of the Fe-Sn and Ni-Zn phase diagrams reported in ASM Handbook Volume 3 [
29], Fe and Ni elements form intermetallic compounds (e.g., FeSn, NiZn
3) on the surface during corrosion. These phases gradually dissolve into the liquid alloy due to chemical potential gradients. However, currently only the NiZn
3 and FeSn phases are detected, indicating that although there are phase diagrams, the combination tendencies between different elements are different.
The diffusion of metal elements essentially belongs to the chemical potential gradient. In the corrosion test of this paper, the dissolution of Ni and Fe elements into the liquid metal must reduce the free energy. As shown in
Figure 16, the existence of intermetallic compounds NiZn
3 and FeSn is detected on the steel surface. Therefore, it can be determined that in addition to the concentration gradient driving force, there is also a chemical gradient driving force for the diffusion of Ni and Fe. In a closed system, the system always tends to move from a state of high free energy to a state of low free energy. Therefore, when the steel is exposed to the liquid alloy, affected by the chemical potential gradient, Ni and Sn are continuously combined with Zn and Sn to form intermetallic compounds and are continuously dissolved into the heat transfer alloy.


