
Technological Alloying Impact on Formation of Phase Composition of Al-Fe-Si-X Alloys


Abstract
1. Introduction
2. Materials and Methods
2.1. Basics for Modelling
2.2. Experimental Verification
3. Results and Discussion
3.1. Modelling
3.2. Experimental Analysis
4. Conclusions
Author Contributions
Funding
Institutional Review Board Statement
Informed Consent Statement
Data Availability Statement
Conflicts of Interest
References
- Padalko, A.G.; Pyrov, M.S.; Karelin, R.D.; Yusupov, V.S.; Talanova, G.V. Barothermal Treatment, Cold Plastic Deformation, Microstructure and Properties of Binary Silumin Al–8 at % Si. Russ. Metall. 2021, 2021, 1155–1164. [Google Scholar] [CrossRef]
- Zaguliaev, D.; Ivanov, Y.; Konovalov, S.; Abaturova, A.; Gromov, V.; Rubannikova, Y.; Semin, A. Effect of Electron-Plasma Treatment on the Microstructure of Al-11wt%Si Alloy. Mater. Res. 2020, 23, 20200057. [Google Scholar] [CrossRef]
- Zaguliaev, D.; Ivanov, Y.; Gudala, S.; Tolkachev, O.; Aksenova, K.; Konovalov, S.; Shlyarov, V. Effect of Thickness of Ti Coating Deposited by Vacuum Arc Melting on Fatigue Behavior of Aluminum Alloy Al–5%Si. Coatings 2023, 13, 1764. [Google Scholar] [CrossRef]
- Sersour, Z.; Amirouche, L. Effect of Alloying Additions and High Temperature T5-Treatment on the Microstructural Behavior of Al–Si-Based Eutectic and Hypo-Eutectic Alloys. Int. J. Met. 2022, 16, 1276–1291. [Google Scholar] [CrossRef]
- Sjölander, E.; Seifeddine, S. The Heat Treatment of Al–Si–Cu–Mg Casting Alloys. J. Mater. Process. Technol. 2010, 210, 1249–1259. [Google Scholar] [CrossRef]
- Mirzaev, I.; Sagdiev, K.; Yuvmitov, A.; Turdiev, M.; Egamberdiev, B. Experimental Determination of Dynamic Coefficient of Amonton-Coulomb Dry Friction. Facta Univ. Ser. Mech. Eng. 2024, 22, 503. [Google Scholar] [CrossRef]
- Nikolaevich Grigoriev, S.; Vasilievna Tarasova, T.; Olegovna Gvozdeva, G.; Nowotny, S. Structure Formation of Hypereutectic Al-Si-Alloys Produced by Laser Surface Treatment. Strojniški Vestn. J. Mech. Eng. 2014, 60, 389–394. [Google Scholar] [CrossRef]
- Li, W.; Li, S.; Liu, J.; Zhang, A.; Zhou, Y.; Wei, Q.; Yan, C.; Shi, Y. Effect of Heat Treatment on AlSi10Mg Alloy Fabricated by Selective Laser Melting: Microstructure Evolution, Mechanical Properties and Fracture Mechanism. Mater. Sci. Eng. A 2016, 663, 116–125. [Google Scholar] [CrossRef]
- Wu, J.; Wang, X.Q.; Wang, W.; Attallah, M.M.; Loretto, M.H. Microstructure and Strength of Selectively Laser Melted AlSi10Mg. Acta Mater. 2016, 117, 311–320. [Google Scholar] [CrossRef]
- Kunčická, L.; Kocich, R.; Németh, G.; Dvořák, K.; Pagáč, M. Effect of Post Process Shear Straining on Structure and Mechanical Properties of 316 L Stainless Steel Manufactured via Powder Bed Fusion. Addit. Manuf. 2022, 59, 103128. [Google Scholar] [CrossRef]
- Hemachandra, M.; Mamedipaka, R.; Kumar, A.; Thapliyal, S. Investigating the Microstructure and Mechanical Behavior of Optimized Eutectic Al Si Alloy Developed by Direct Energy Deposition. J. Manuf. Process. 2024, 110, 398–411. [Google Scholar] [CrossRef]
- Fang, X.; Li, K.; Ma, M.; Shang, J.; Feng, X.; Hou, Y.; Zhu, Y.; Huang, K. Microstructure and Properties of a Novel High-Performance Al-Si-Mg Alloy Fabricated by Wire-Arc Directed Energy Deposition. Mater. Lett. 2024, 360, 136010. [Google Scholar] [CrossRef]
- Wang, C.; Yu, F.; Zhao, D.; Zhao, X.; Zuo, L. Microstructure Evolution of Al-15% Si Alloy during Hot Rolling. Philos. Mag. Lett. 2018, 98, 456–463. [Google Scholar] [CrossRef]
- Cheng, W.; Liu, C.Y.; Ge, Z.J. Optimizing the Mechanical Properties of Al–Si Alloys through Friction Stir Processing and Rolling. Mater. Sci. Eng. A 2021, 804, 140786. [Google Scholar] [CrossRef]
- Kunčická, L.; Kocich, R. Effect of Activated Slip Systems on Dynamic Recrystallization during Rotary Swaging of Electro-Conductive Al-Cu Composites. Mater. Lett. 2022, 321, 10–13. [Google Scholar] [CrossRef]
- Kocich, R.; Kunčická, L. Optimizing Structure and Properties of Al/Cu Laminated Conductors via Severe Shear Strain. J. Alloys Compd. 2023, 953, 170124. [Google Scholar] [CrossRef]
- Strunz, P.; Kocich, R.; Canelo-Yubero, D.; Macháčková, A.; Beran, P.; Krátká, L. Texture and Differential Stress Development in W/Ni-Co Composite after Rotary Swaging. Materials 2020, 13, 2869. [Google Scholar] [CrossRef]
- Canelo-Yubero, D.; Kocich, R.; Šaroun, J.; Strunz, P. Residual Stress Distribution in a Copper-Aluminum Multifilament Composite Fabricated by Rotary Swaging. Materials 2023, 16, 2102. [Google Scholar] [CrossRef]
- Alemdag, Y.; Karabiyik, S.; Mikhaylovskaya, A.V.; Kishchik, M.S.; Purcek, G. Effect of Multi-Directional Hot Forging Process on the Microstructure and Mechanical Properties of Al–Si Based Alloy Containing High Amount of Zn and Cu. Mater. Sci. Eng. A 2021, 803, 140709. [Google Scholar] [CrossRef]
- Xia, X.; Chen, M.; Lu, Y.-J.; Fan, F.; Zhu, C.; Huang, J.; Deng, T.; Zhu, S. Microstructure and Mechanical Properties of Isothermal Multi-Axial Forging Formed AZ61 Mg Alloy. Trans. Nonferrous Met. Soc. China 2013, 23, 3186–3192. [Google Scholar] [CrossRef]
- Kocich, R.; Greger, M.; Kursa, M.; Szurman, I.; Macháčková, A. Twist Channel Angular Pressing (TCAP) as a Method for Increasing the Efficiency of SPD. Mater. Sci. Eng. A 2010, 527, 6386–6392. [Google Scholar] [CrossRef]
- Kocich, R. Effects of Twist Channel Angular Pressing on Structure and Properties of Bimetallic Al/Cu Clad Composites. Mater. Des. 2020, 196, 109255. [Google Scholar] [CrossRef]
- Lukáč, P.; Kocich, R.; Greger, M.; Padalka, O.; Szaraz, Z. Microstructure of AZ31 and AZ61 Mg Alloys Prepared by Rolling and ECAP. Kov. Mater. Mater. 2007, 45, 115–120. [Google Scholar]
- Kocich, R.; Greger, M.; Macháčková, A. Finite Element Investigation of Influence of Selected Factors on ECAP Process. In Proceedings of the METAL 2010: 19th International Metallurgical and Materials Conference, Roznov pod Radhostem, Czech Republic, 18–20 May 2010; Tanger Ltd.: Greensboro, NC, USA, 2010; pp. 166–171. [Google Scholar]
- Andreyachshenko, V.A. Evolution of the AA2030 Alloy Microstructure in the ECAP Process. Kov. Mater. Mater. 2022, 60, 79–87. [Google Scholar] [CrossRef]
- Naizabekov, A.B.; Andreyachshenko, V.A.; Kocich, R. Study of Deformation Behavior, Structure and Mechanical Properties of the AlSiMnFe Alloy during ECAP-PBP. Micron 2013, 44, 210–217. [Google Scholar] [CrossRef]
- Kocich, R.; Macháčková, A.; Andreyachshenko, V.A. A Study of Plastic Deformation Behaviour of Ti Alloy during Equal Channel Angular Pressing with Partial Back Pressure. Comput. Mater. Sci. 2015, 101, 233–241. [Google Scholar] [CrossRef]
- Zhilyaev, A.P.; García-Infanta, J.M.; Carreño, F.; Langdon, T.G.; Ruano, O.A. Particle and Grain Growth in an Al–Si Alloy during High-Pressure Torsion. Scr. Mater. 2007, 57, 763–765. [Google Scholar] [CrossRef]
- Cepeda-Jiménez, C.M.; Orozco-Caballero, A.; García-Infanta, J.M.; Zhilyaev, A.P.; Ruano, O.A.; Carreño, F. Assessment of Homogeneity of the Shear-Strain Pattern in Al–7wt%Si Casting Alloy Processed by High-Pressure Torsion. Mater. Sci. Eng. A 2014, 597, 102–110. [Google Scholar] [CrossRef]
- Cepeda-Jiménez, C.M.; García-Infanta, J.M.; Zhilyaev, A.P.; Ruano, O.A.; Carreño, F. Influence of the Supersaturated Silicon Solid Solution Concentration on the Effectiveness of Severe Plastic Deformation Processing in Al–7wt.% Si Casting Alloy. Mater. Sci. Eng. A 2011, 528, 7938–7947. [Google Scholar] [CrossRef]
- Mikolajczak, P. Distribution and Morphology of α-Al, Si and Fe-Rich Phases in Al–Si–Fe Alloys under an Electromagnetic Field. Materials 2023, 16, 3304. [Google Scholar] [CrossRef]
- Andreyachshenko, V. Evolution of Al-Si-Mn-Fe Aluminum Alloy Microstructure in the Equal-Channel Angular Pressing with Back Pressure. Mater. Lett. 2019, 254, 433–435. [Google Scholar] [CrossRef]
- Asadikiya, M.; Yang, S.; Zhang, Y.; Lemay, C.; Apelian, D.; Zhong, Y. A Review of the Design of High-Entropy Aluminum Alloys: A Pathway for Novel Al Alloys. J. Mater. Sci. 2021, 56, 12093–12110. [Google Scholar] [CrossRef]
- Canté, M.V.; Lima, T.S.; Brito, C.; Garcia, A.; Cheung, N.; Spinelli, J.E. An Alternative to the Recycling of Fe-Contaminated Al. J. Sustain. Metall. 2018, 4, 412–426. [Google Scholar] [CrossRef]
- Lan, X.; Li, K.; Wang, J.; Yang, M.; Lu, Q.; Du, Y. Developing Al–Fe–Si Alloys with High Thermal Stability through Tuning Fe, Si Contents and Cooling Rates. Intermetallics 2022, 144, 107505. [Google Scholar] [CrossRef]
- Andreyachshenko, V.; Naizabekov, A. The Technology of Equal Channel Angle Backpressure Extrusion for Deformation Iron and Aluminium Alloys. In Proceedings of the NANOCON 2011, Brno, Czech Republic, 21–23 September 2011; Tanger Ltd.: Brno, Czech Republic, 2011; pp. 246–252. [Google Scholar]
- Naizabekov, A.B.; Andreyashchenko, V.A. Evaluation of Possible Mechanical Property Improvement for Alloy of the Al–Fe–Si–Mn System by Equal-Channel Angular Pressing. Metallurgist 2013, 57, 159–163. [Google Scholar] [CrossRef]
- Naizabekov, A.B.; Andreyachshenko, V.; Kliber, J. Forming of Microstructure of the Al-Si-Fe-Mn System Alloy by Equal Channel Angular Pressing with Backpressure. In Proceedings of the 21st International Conference on Metallurgy and Materials (METAL 2012), Brno, Czech Republic, 23–25 May 2012; Tanger Ltd.: Brno, Czech Republic, 2012; pp. 391–395. [Google Scholar]
- Du, Y.; Chang, Y.A.; Liu, S.; Huang, B.; Xie, F.-Y.; Yang, Y.; Chen, S.-L. Thermodynamic Description of the Al–Fe–Mg–Mn–Si System and Investigation of Microstructure and Microsegregation during Directional Solidification of an Al–Fe–Mg–Mn–Si Alloy. Z. Für Met. 2005, 96, 1351–1362. [Google Scholar] [CrossRef]
- Ren, J.; Fang, X.; Chen, D.; Cao, C.; He, Y.; Liu, J. The Effect of Heat Treatments on the Microstructural Evolution of Twin-Roll-Cast Al-Fe-Si Alloys. J. Mater. Eng. Perform. 2021, 30, 4401–4410. [Google Scholar] [CrossRef]
- Luo, L.; Tang, Y.; Liang, X.; Su, Y.; Zhang, Y.; Xie, H. Optimizing the Morphology and Solidification Behavior of Fe-Rich Phases in Eutectic Al-Si-Based Alloys with Different Fe Contents by Adding Mn Elements. Materials 2024, 17, 4104. [Google Scholar] [CrossRef]
- Timpel, M.; Wanderka, N.; Grothausmann, R.; Banhart, J. Distribution of Fe-Rich Phases in Eutectic Grains of Sr-Modified Al–10wt.% Si–0.1wt.% Fe Casting Alloy. J. Alloys Compd. 2013, 558, 18–25. [Google Scholar] [CrossRef]
- Gan, Z.; Hu, Z.; Su, Y.; Liu, Y.; Ni, Q.; Li, Y.; Wu, C.; Liu, J. Influence of Super-Gravity Coefficient on Spatial Distribution of Solidification Structure in Al-14.5Si Alloys. J. Mater. Res. Technol. 2021, 15, 4955–4969. [Google Scholar] [CrossRef]
- Lan, X.; Xiao, Y.; Hu, B.; Yang, M.; Wang, Q.; Lu, Q.; Yang, T.; Li, K.; Wang, J.; Wang, Z.; et al. Systematic Study of Growth Behavior of β-Al9Fe2Si2 in Al Alloys with High Iron and Silicon Contents. J. Mater. Res. Technol. 2023, 26, 260–266. [Google Scholar] [CrossRef]
- Wang, M.; Guo, Y.; Wang, H.; Zhao, S. Characterization of Refining the Morphology of Al–Fe–Si in A380 Aluminum Alloy Due to Ca Addition. Processes 2022, 10, 672. [Google Scholar] [CrossRef]
- Aranda, V.A.; Figueroa, I.A.; González, G.; García-Hinojosa, J.A.; Alfonso, I. Study of the Microstructure and Mechanical Properties of Al-Si-Fe with Additions of Chromium by Suction Casting. J. Alloys Compd. 2021, 853, 157155. [Google Scholar] [CrossRef]
- Andreyachshenko, V.; Isheva, Y.; Mazhit, A.; Imangazinova, D. ECAP-Treated Aluminium Alloy AA2030: Microstructure and Mechanical Properties. Mater. Tehnol. 2019, 53, 805–810. [Google Scholar] [CrossRef]
- Pang, N.; Shi, Z.; Wang, C.; Li, N.; Lin, Y. Influence of Cr, Mn, Co and Ni Addition on Crystallization Behavior of Al13Fe4 Phase in Al-5Fe Alloys Based on ThermoDynamic Calculations. Materials 2021, 14, 768. [Google Scholar] [CrossRef]
- Ning, W.; Zhang, W.; Zhao, Y. Phase-Field Simulation for Evolution of Iron-Rich Phase during Solidification of Al–Si–Fe Alloys. J. Mater. Res. Technol. 2024, 29, 5495–5506. [Google Scholar] [CrossRef]
- Andreyachshenko, V.; Bartenev, I.; Malashkevichute-Brillant, Y. Synthesizing of an Aluminum Alloy Rich in Iron and Silicon by Surfacing with a Consumable Electrode. Acta Metall. Slovaca 2024, 30, 133–136. [Google Scholar] [CrossRef]
- Song, D.; Ponte Castañeda, P. Fully Optimized Second-Order Homogenization Estimates for the Macroscopic Response and Texture Evolution of Low-Symmetry Viscoplastic Polycrystals. Int. J. Plast. 2018, 110, 272–293. [Google Scholar] [CrossRef]
- Gao, Y.; Ding, J.; Du, C.; Li, D.; Liang, Q.; Zheng, Y.; Wang, D.; Fraser, H.L.; Wang, H.-Y.; Wang, Y. Unique Twinning Mode and Extended Twin Boundary Core Structure Associated with Symmetry Breaking in a Multifunctional Ti-Nb-Based Alloy. Acta Mater. 2025, 286, 120769. [Google Scholar] [CrossRef]
- Kunčická, L.; Kocich, R. Comprehensive Characterisation of a Newly Developed Mg-Dy-Al-Zn-Zr Alloy Structure. Metals 2018, 8, 73. [Google Scholar] [CrossRef]
- Kocich, R.; Macháčková, A.; Fojtík, F. Comparison of Strain and Stress Conditions in Conventional and ARB Rolling Processes. Int. J. Mech. Sci. 2012, 64, 54–61. [Google Scholar] [CrossRef]
- Thomasová, M.; Seiner, H.; Sedlák, P.; Frost, M.; Ševčík, M.; Szurman, I.; Kocich, R.; Drahokoupil, J.; Šittner, P.; Landa, M. Evolution of Macroscopic Elastic Moduli of Martensitic Polycrystalline NiTi and NiTiCu Shape Memory Alloys with Pseudoplastic Straining. Acta Mater. 2017, 123, 146–156. [Google Scholar] [CrossRef]
- Kocich, R.; Kursa, M.; Macháčková, A. FEA of Plastic Flow in AZ63 Alloy during ECAP Process. Acta Phys. Pol. A 2012, 122, 581–587. [Google Scholar] [CrossRef]
- Kocich, R.; Fiala, J.; Szurman, I.; Macháčková, A.; Mihola, M. Twist-Channel Angular Pressing: Effect of the Strain Path on Grain Refinement and Mechanical Properties of Copper. J. Mater. Sci. 2011, 46, 7865–7876. [Google Scholar] [CrossRef]
- Kocich, R.; Szurman, I.; Kursa, M.; Fiala, J. Investigation of Influence of Preparation and Heat Treatment on Deformation Behaviour of the Alloy NiTi after ECAE. Mater. Sci. Eng. A 2009, 512, 100–104. [Google Scholar] [CrossRef]
- Hlaváč, L.M.; Kocich, R.; Gembalová, L.; Jonšta, P.; Hlaváčová, I.M. AWJ Cutting of Copper Processed by ECAP. Int. J. Adv. Manuf. Technol. 2016, 86, 885–894. [Google Scholar] [CrossRef]
- Kocich, R.; Kursa, M.; Szurman, I.; Dlouhý, A. The Influence of Imposed Strain on the Development of Microstructure and Transformation Characteristics of Ni–Ti Shape Memory Alloys. J. Alloys Compd. 2011, 509, 2716–2722. [Google Scholar] [CrossRef]
- Andreyachshenko, V.A.; Ibatov, M.K. Optimization of the Three-Component Al-Fe-Si System Composition. Metall. Res. Technol. 2024, 121, 315. [Google Scholar] [CrossRef]
- Que, Z.; Fang, C.; Mendis, C.L.; Wang, Y.; Fan, Z. Effects of Si Solution in θ-Al13Fe4 on Phase Transformation between Fe-Containing Intermetallic Compounds in Al Alloys. J. Alloys Compd. 2023, 932, 167587. [Google Scholar] [CrossRef]
- Laplanche, G.; Bonneville, J.; Joulain, A.; Gauthier-Brunet, V.; Dubois, S. Plasticity of the ω-Al7Cu2Fe Phase. J. Alloys Compd. 2016, 665, 144–151. [Google Scholar] [CrossRef]
- Chen, F.; He, J.; Li, Y.; Deng, B.; Zhu, J.; Yang, H.; Li, M. Effect of Different Homogenization Times on the Mechanical Properties of 7075 Aluminum Alloy. J. Mater. Res. Technol. 2024, 31, 2582–2592. [Google Scholar] [CrossRef]
- Jin, D.; Li, H.; Yang, C.; Han, Y.; Zhu, Z.; Miao, Y.; Xu, C.; Chen, B. The Effects of Mg and Si Contents on the Microstructure and Solidification Behavior of Dilute Al-Mg-Si-Fe Alloys. JOM 2023, 75, 4845–4857. [Google Scholar] [CrossRef]
- Song, D.; Jia, Y.; Li, Q.; Zhao, Y.; Zhang, W. Effect of Initial Fe Content on Microstructure and Mechanical Properties of Recycled Al-7.0Si-Fe-Mn Alloys with Constant Mn/Fe Ratio. Materials 2022, 15, 1618. [Google Scholar] [CrossRef]
- de Rosso, E.; dos Santos, C.A.; Garcia, A. Microstructure, Hardness, Tensile Strength, and Sliding Wear of Hypoeutectic Al–Si Cast Alloys with Small Cr Additions and Fe-Impurity Content. Adv. Eng. Mater. 2022, 24, 2001552. [Google Scholar] [CrossRef]
- Elsharkawi, E.A.; MacNeil, D.; Chouraqui, B.; Chen, X.-G. Exploring the Effect of Ni as an Impurity on Fe-Rich Phases in Simulated Direct Chill Casting Al–Fe-Si Alloys. Metallogr. Microstruct. Anal. 2022, 11, 724–735. [Google Scholar] [CrossRef]
- Belov, N.A.; Alabin, A.N.; Matveeva, I.A.; Eskin, D. Effect of Zr Additions and Annealing Temperature on Electrical Conductivity and Hardness of Hot Rolled Al Sheets. Trans. Nonferrous Met. Soc. China 2015, 25, 2817–2826. [Google Scholar] [CrossRef]
- Kotiadis, S.; Zimmer, A.; Elsayed, A.; Vandersluis, E.; Ravindran, C. High Electrical and Thermal Conductivity Cast Al-Fe-Mg-Si Alloys with Ni Additions. Metall. Mater. Trans. A 2020, 51, 4195–4214. [Google Scholar] [CrossRef]
- Walek, J.; Odehnalová, A.; Kocich, R. Analysis of Thermophysical Properties of Electro Slag Remelting and Evaluation of Metallographic Cleanliness of Steel. Materials 2024, 17, 4613. [Google Scholar] [CrossRef]


| System | Si | Fe | Cu | Mn | Mg | Cr | Zn | Ni | Ti | V | Zr | Be | Al |
|---|---|---|---|---|---|---|---|---|---|---|---|---|---|
| Aluminum | 0.3 | 0.4 | 0.2 | 0.1 | 0.05 | 0.01 | 0.1 | - | 0.15 | 0.05 | - | 0.05 | bal. |
| Al-Cu-Mg | 3 | 1.5 | 7 | 1 | 2.7 | 0.1 | 1 | 1.4 | 0.2 | 0.15 | 0.25 | - | bal. |
| Al-Cu-Mn | 3 | 1.5 | 7 | 1 | 2.7 | 0.1 | 1 | 1.4 | 0.2 | 0.15 | 0.25 | - | bal. |
| Al-Mn | 0.6 | 0.8 | 0.3 | 1.5 | 1.3 | 0.2 | 0.4 | - | 0.05 | 0.05 | 0.05 | 0.0003 | bal. |
| Al-Si | 13 | 0.8 | 3 | 0.6 | 2 | 0.2 | 0.5 | 1.3 | 0.2 | - | - | - | bal. |
| Al-Mg | 0.5 | 0.7 | 0.2 | 1.2 | 7 | 0.35 | 1 | 0.05 | 0.2 | 0.02 | 0.2 | 0.005 | bal. |
| Al-Mg-Si | 1.3 | 0.8 | 1.4 | 1 | 1.4 | 0.35 | 0.8 | 0.2 | 0.2 | - | 0.12 | 0.005 | bal. |
| Al-Zn-Mg | 1.5 | 1 | 5.9 | 1 | 3 | 0.25 | 9 | 0.2 | 0.1 | - | 0.22 | 0.005 | bal. |
| Al-Fe | 1.5 | 2 | 0.3 | 1 | 0.1 | 0.05 | 0.1 | - | 0.1 | - | 0.45 | - | bal. |
| Al-Li | 0.3 | 0.3 | 5.8 | 0.8 | 0.05 | Li 1.4 | 0.1 | - | 0.15 | - | - | - | bal. |
| Alloy | Si | Fe | Cu | Mg | Mn | Cr | Ni | Zn | Ti | V | Zr | Be | Al |
|---|---|---|---|---|---|---|---|---|---|---|---|---|---|
| Alloy 0 | 7 | 33 | Bal. | ||||||||||
| Alloy 1 | 7 | 33 | 4.2 | - | - | - | - | - | - | - | - | - | Bal. |
| Alloy 2 | 7 | 33 | - | 0.84 | - | - | - | - | - | - | - | - | Bal. |
| Alloy 3 | 7 | 33 | - | - | 0.9 | - | - | - | - | - | - | - | Bal. |
| Alloy 4 | 7 | 33 | - | - | - | 0.21 | - | - | - | - | - | - | Bal. |
| Alloy 5 | 0.84 | - | |||||||||||
| Alloy 6 | 7 | 33 | - | - | - | - | - | 5.4 | - | - | - | - | Bal. |
| Alloy 7 | 7 | 33 | - | - | - | - | - | - | 0.12 | - | - | - | Bal. |
| Alloy 8 | 7 | 33 | - | - | - | - | - | - | - | 0.09 | - | - | Bal. |
| Alloy 9 | 7 | 33 | - | - | - | - | - | - | - | - | 0.27 | - | Bal. |
| Alloy 10 | 7 | 33 | - | - | - | - | - | - | - | - | - | 0.003 | Bal. |
| Alloy 11 | 7 | 33 | 4.2 | 0.84 | 0.9 | 0.21 | 0.84 | 5.4 | 0.12 | 0.09 | 0.27 | 0.003 | Bal. |
| Alloy 12 | 5.18 | 33.6 | 1.57 | 0.19 | Bal. | ||||||||
| Alloy 13 | 3.72 | 29.5 | 0.02 | 0.18 | 0.02 | Bal. |
| Alloy | Liquidus Temp. | Solidus Temp. | Upper Boundary of the αh Phase | Lower Boundary of the αh Phase | The αh Phase Content (Temp.) | Alloying Element, Amount |
|---|---|---|---|---|---|---|
| Alloy 0 | 1077 | 629 | 769 | 446 | 88.6(625) 93.1(465) | Fe33Si7 |
| Alloy 1 | 1075 | 665 | 665 | 447 | 26(650) 21(465) | Cu, 4.2 |
| Alloy 2 | 1060 | 600 | 720 | 446 | 86(594) 85(446) | Mg, 0.84 |
| Alloy 3 | 1070 | 680 | 762 | 450 | 63(643) 63(450) | Mn, 0.9 |
| Alloy 4 | 1070 | 629 | 769 | 446 | 80(625) 74(447) | Cr, 0.21 |
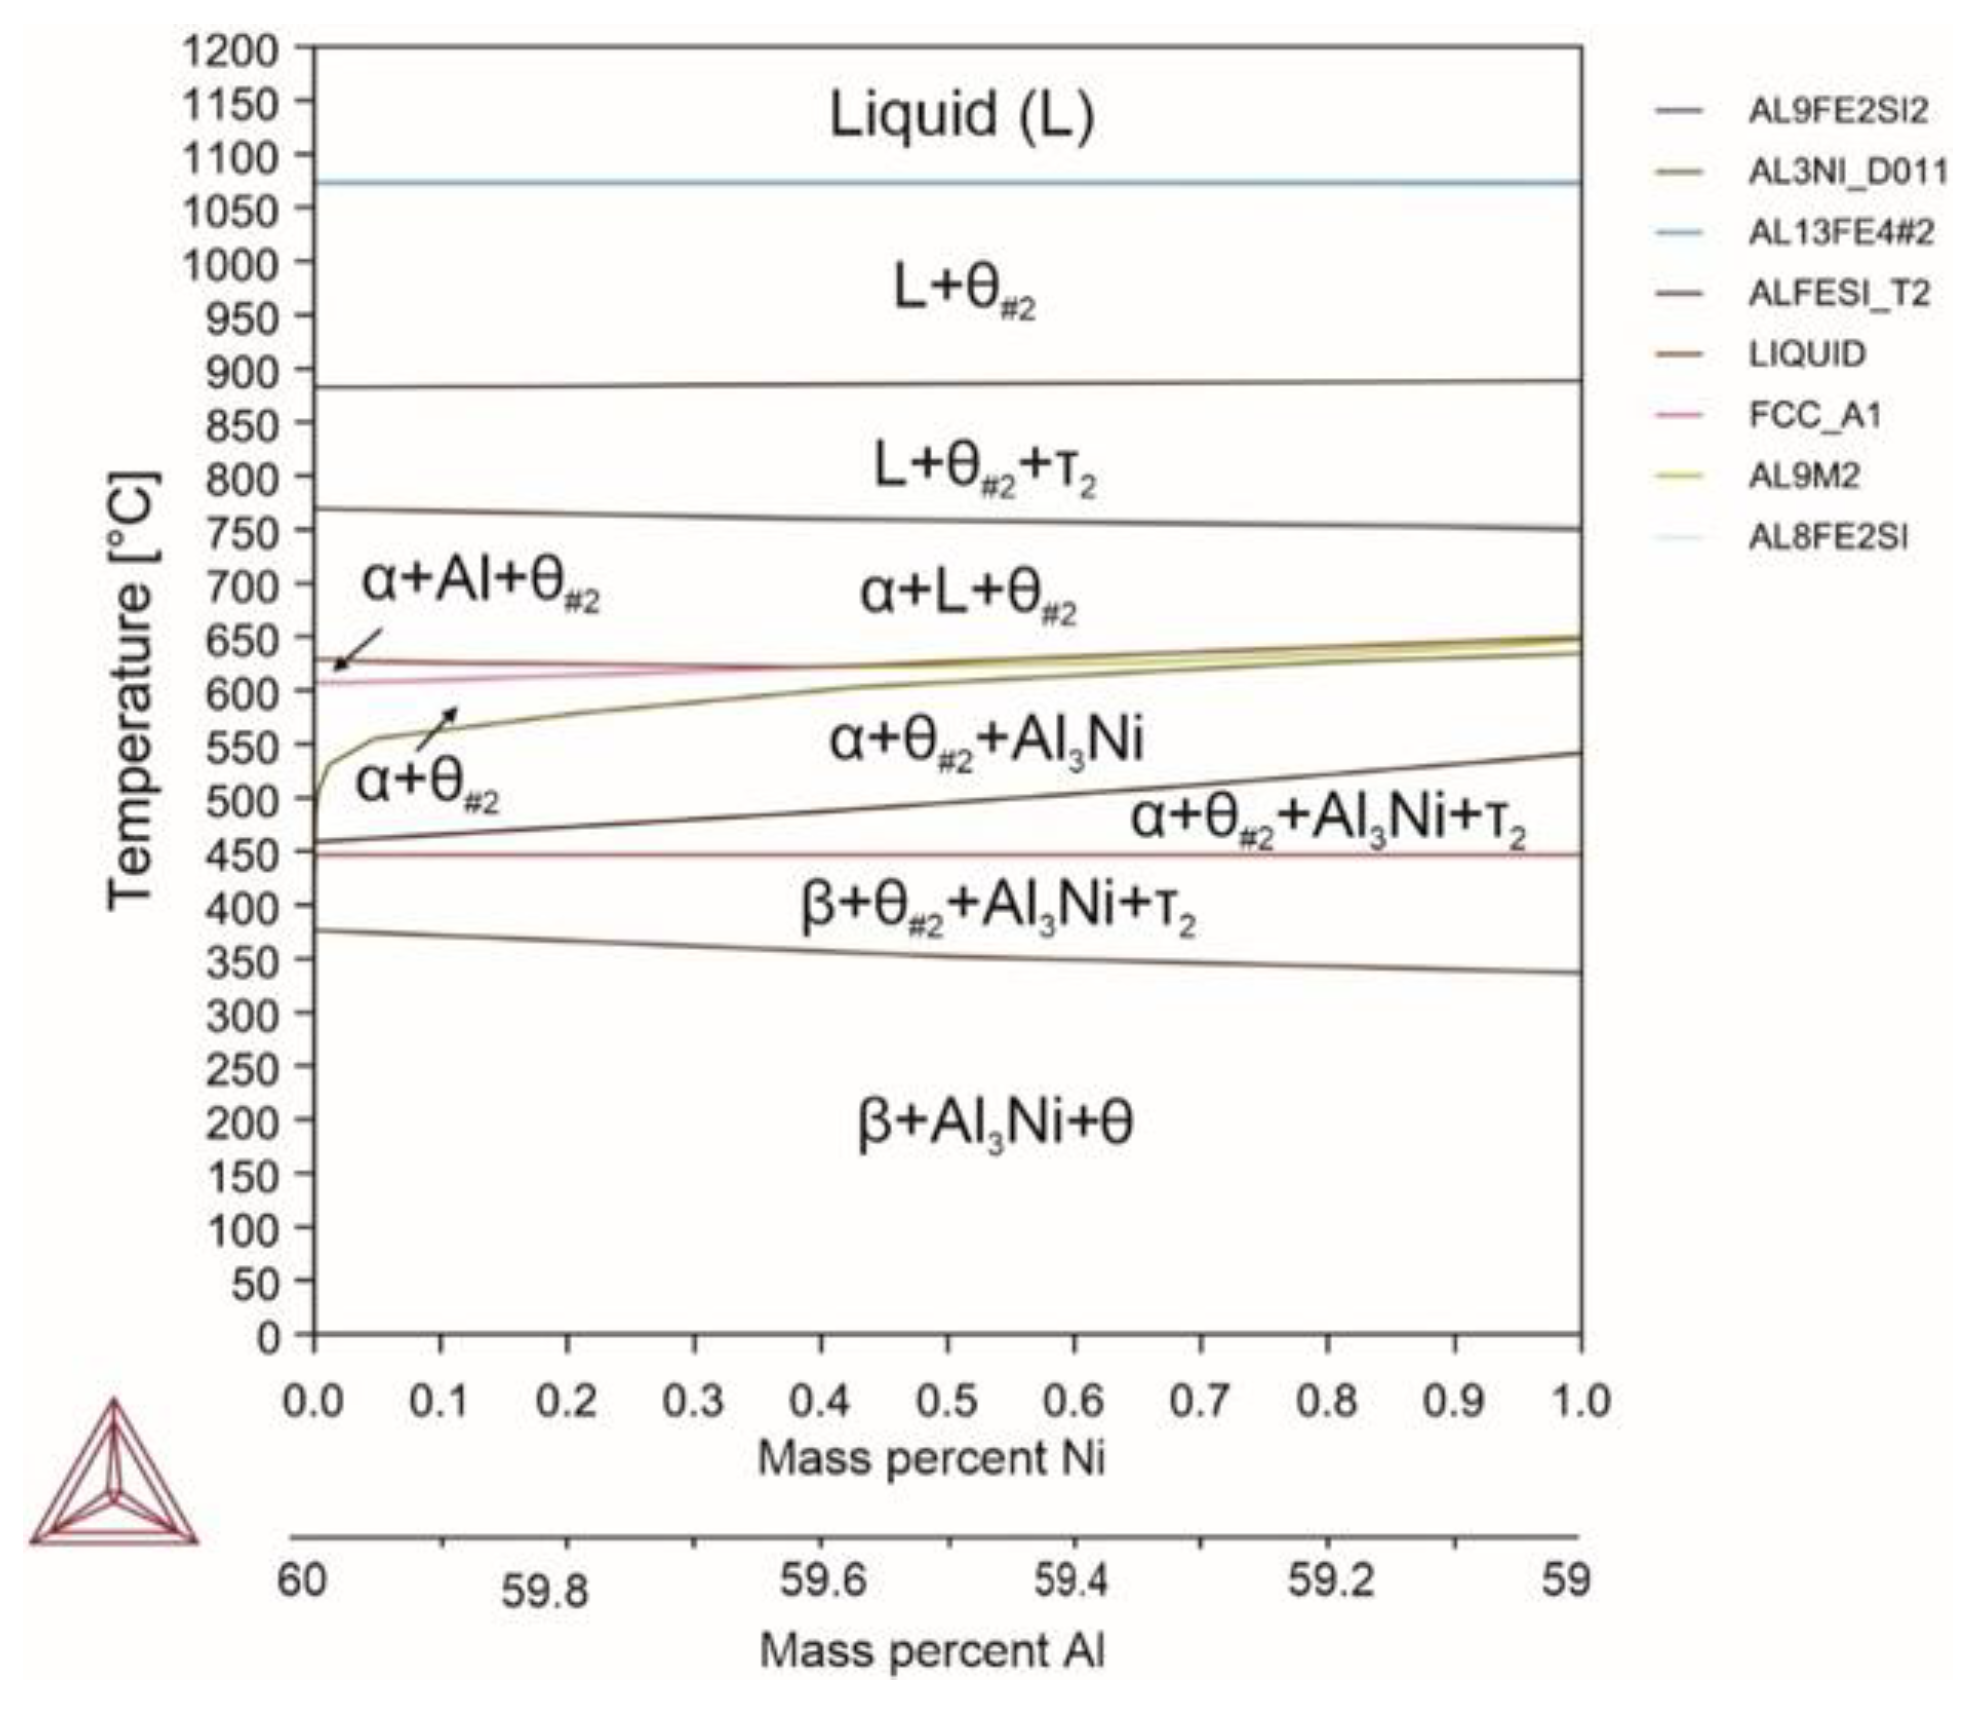
| Alloy 5 | 1070 | 641 | 753 | 446 | 81(642) 75(446) | Ni, 0.84 |
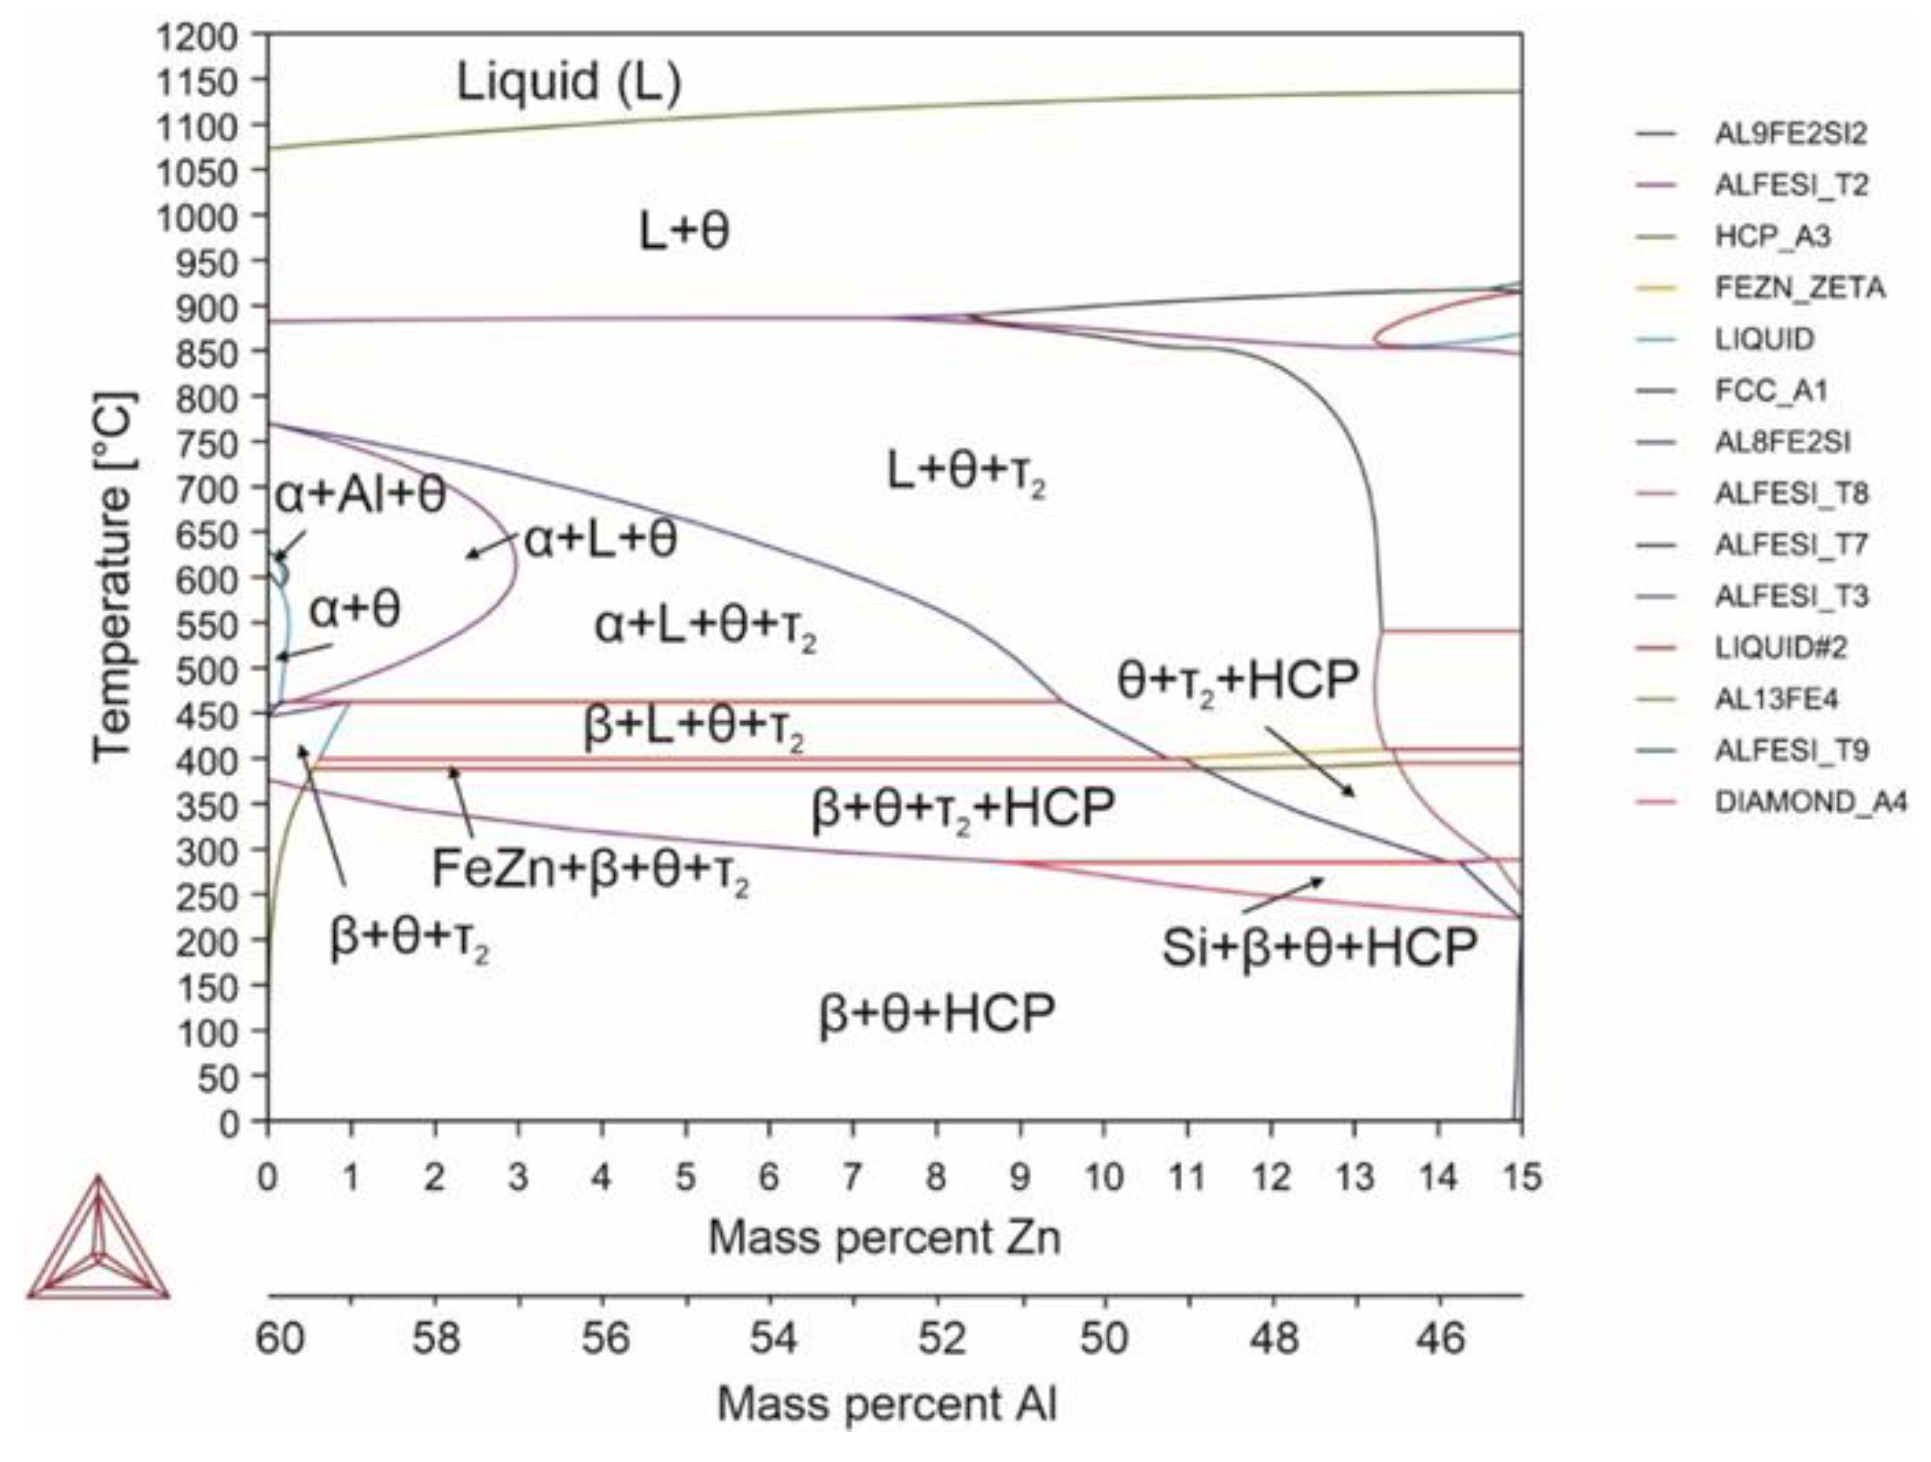
| Alloy 6 | 1110 | 399 | 650 | 462 | 41(462) | Zn, 5.4 |
| Alloy 7 | 1070 | 630 | 767 | 446 | 88(624) 92(450) | Ti, 0.12 |
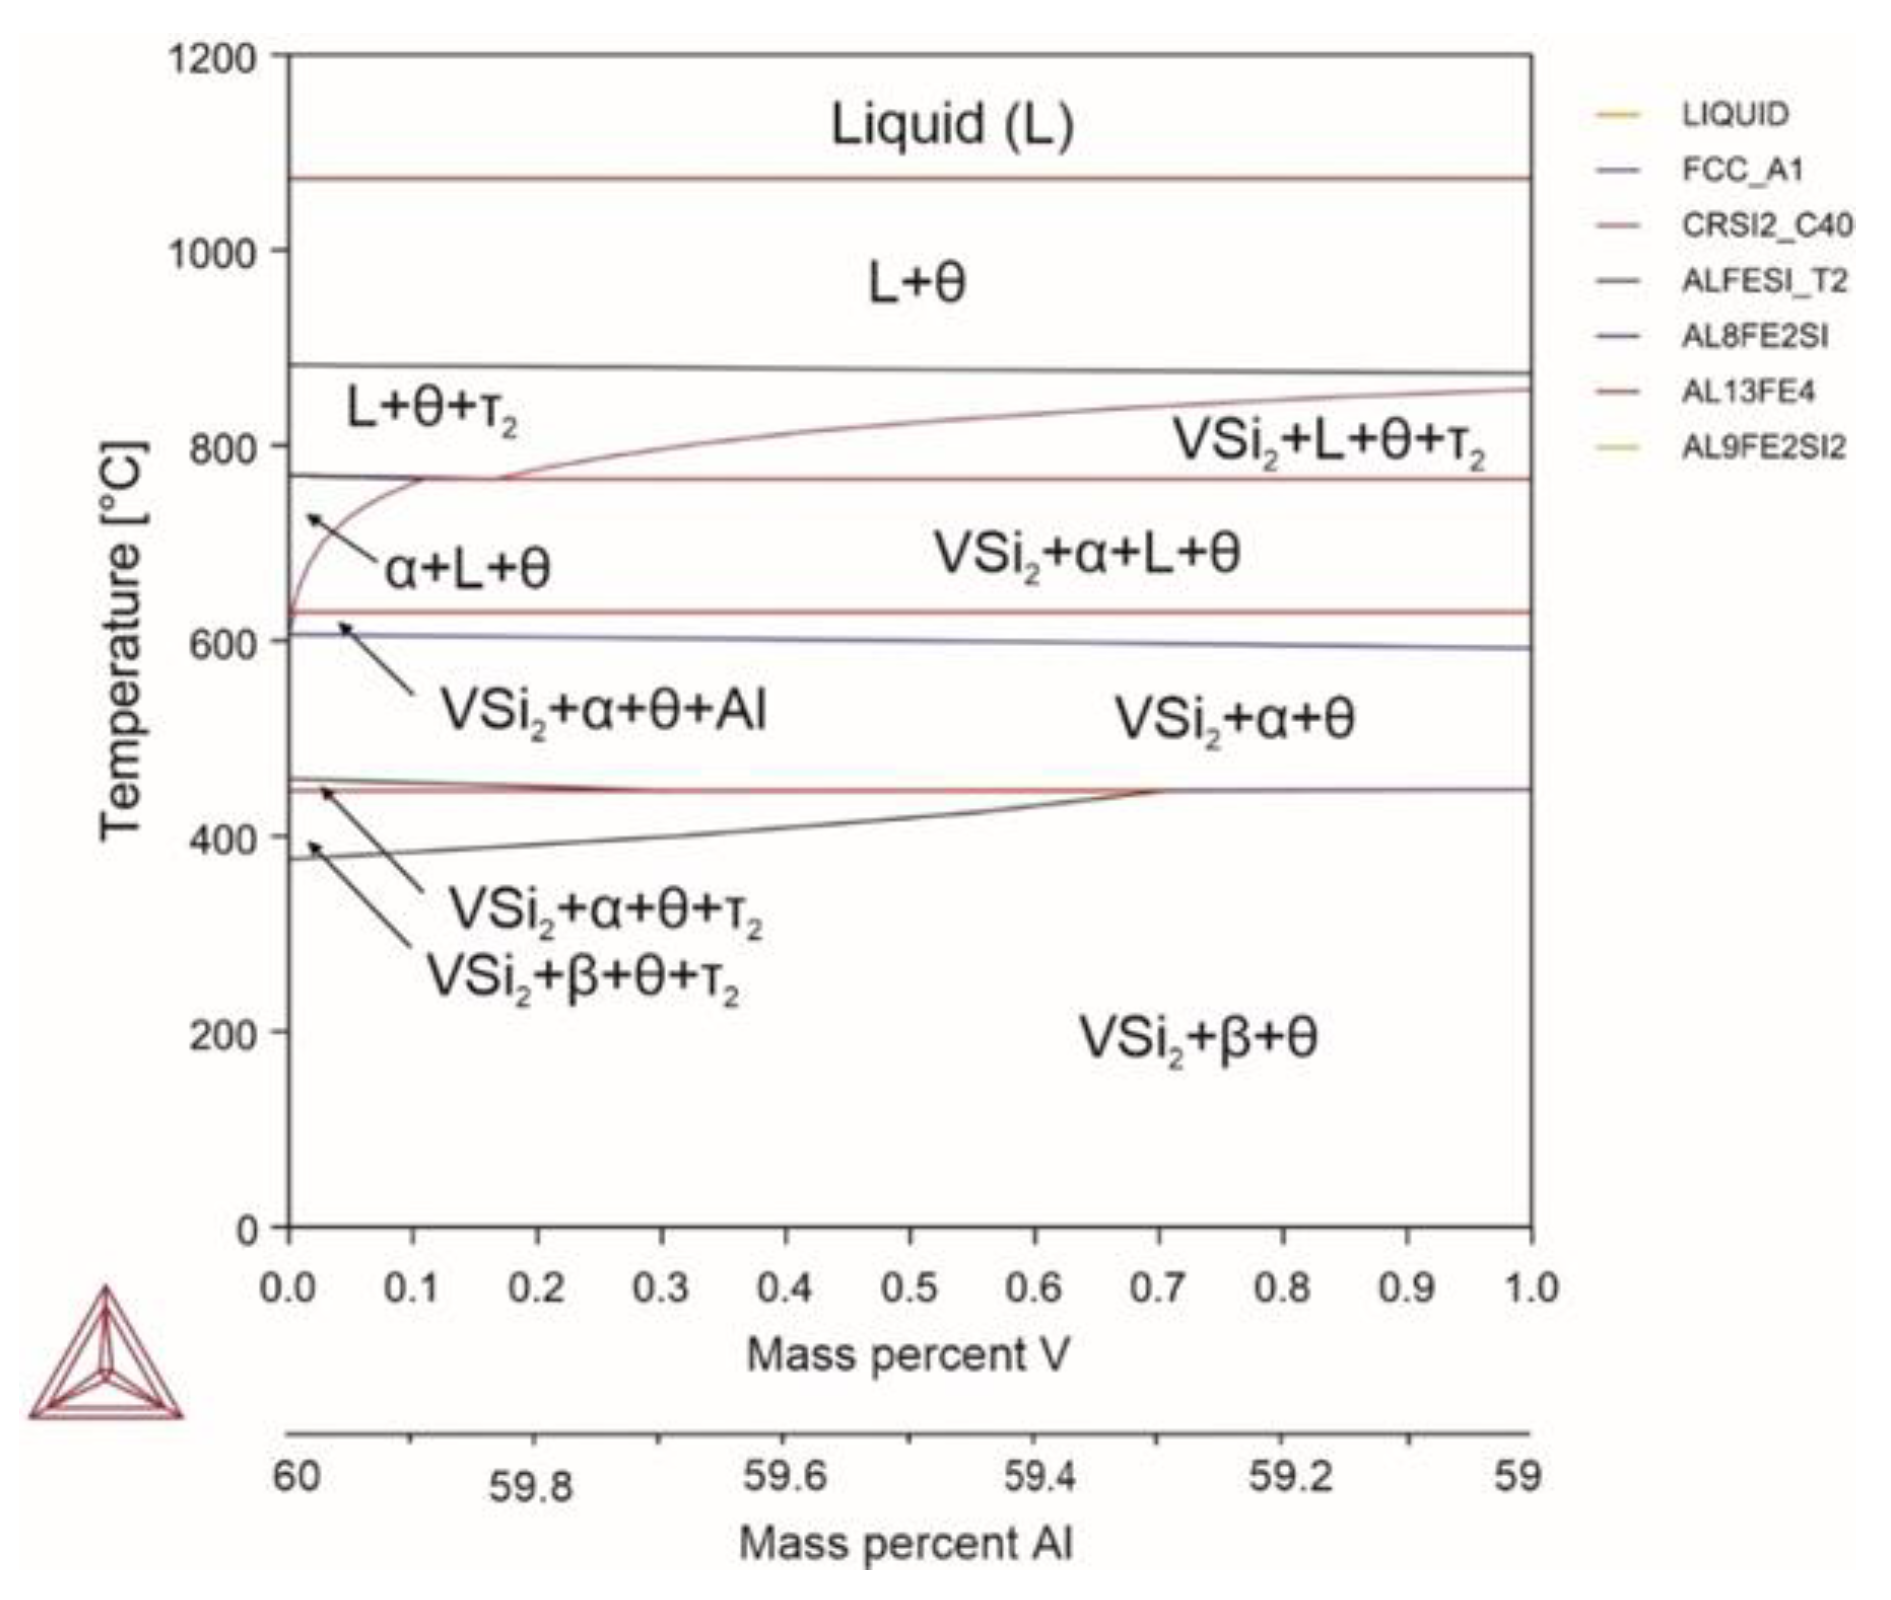
| Alloy 8 | 1070 | 629 | 767 | 446 | 92(590) 92.7(458) | V, 0.09 |
| Alloy 9 | 1070 | 629 | 769 | 446 | 89(620) 90.6(450) | Zr, 0.27 |
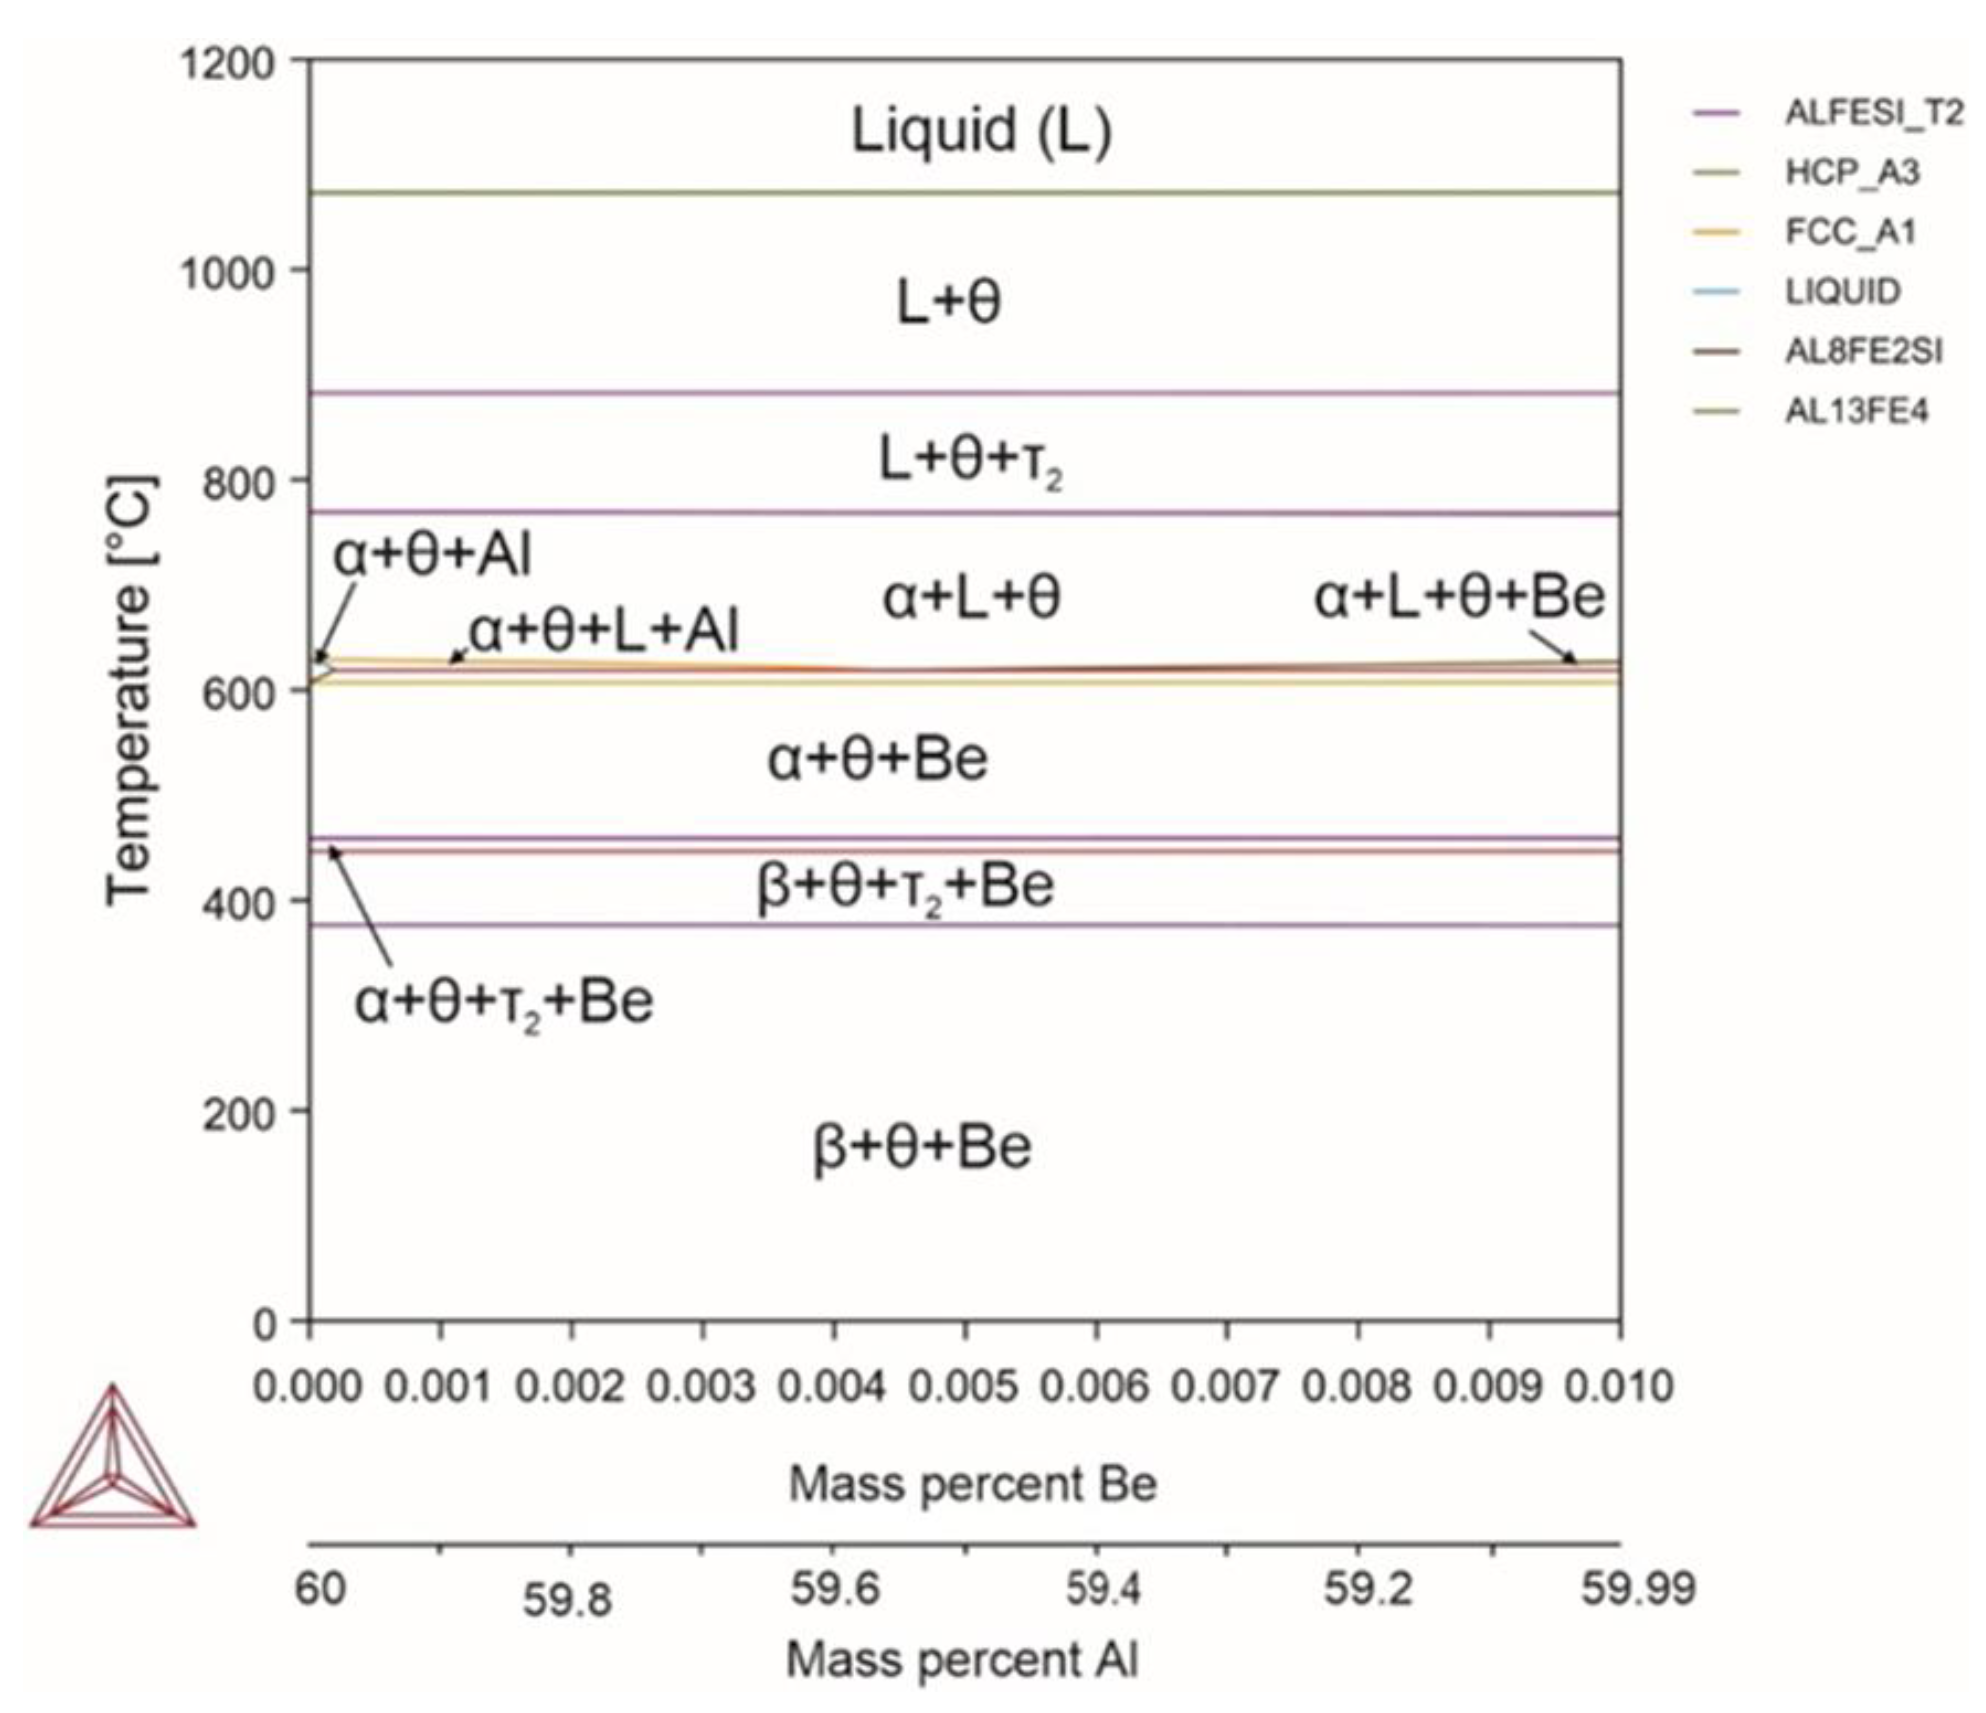
| Alloy 10 | 1070 | 620 | 768 | 446 | 90.7(620) 92.6 (450) | Be, 0.003 |
| Alloy 11 | 1110 | 533 | - | - | - | All the elements considered |
| Alloy 12 experimental | 1110 | 690 | 757 | 450 | 23(750) 58 (500) | Fe33.59, Si5.18, Mn1.574, Ni0.19 |
| Alloy 13 experimental | 1080 | 628 | 740 | 420 | 10(700) 73.3(470) | Fe29.5, Si3.72, Mn0.18, Ni0.02, Cu0.02 |
| Alloy | Microhardness (HV) | Compressive Strength (MPa) | Elongation at Max. Strength (%) |
|---|---|---|---|
| Alloy 12 | 128 ± 6 (FCC Al) 756 ± 12 (intermetallics) | 52 ± 2 | 10 |
| Alloy 13 | 133 ± 6 (FCC Al) 450 ± 11 (intermetallics) | 49 ± 2 | 11 |
Disclaimer/Publisher’s Note: The statements, opinions and data contained in all publications are solely those of the individual author(s) and contributor(s) and not of MDPI and/or the editor(s). MDPI and/or the editor(s) disclaim responsibility for any injury to people or property resulting from any ideas, methods, instructions or products referred to in the content. |
© 2025 by the authors. Licensee MDPI, Basel, Switzerland. This article is an open access article distributed under the terms and conditions of the Creative Commons Attribution (CC BY) license (https://creativecommons.org/licenses/by/4.0/).
Share and Cite
Andreyachshenko, V.; Kunčická, L. Technological Alloying Impact on Formation of Phase Composition of Al-Fe-Si-X Alloys. Materials 2025, 18, 2096. https://doi.org/10.3390/ma18092096
Andreyachshenko V, Kunčická L. Technological Alloying Impact on Formation of Phase Composition of Al-Fe-Si-X Alloys. Materials. 2025; 18(9):2096. https://doi.org/10.3390/ma18092096
Chicago/Turabian StyleAndreyachshenko, Violetta, and Lenka Kunčická. 2025. "Technological Alloying Impact on Formation of Phase Composition of Al-Fe-Si-X Alloys" Materials 18, no. 9: 2096. https://doi.org/10.3390/ma18092096
APA StyleAndreyachshenko, V., & Kunčická, L. (2025). Technological Alloying Impact on Formation of Phase Composition of Al-Fe-Si-X Alloys. Materials, 18(9), 2096. https://doi.org/10.3390/ma18092096