
Experimental Investigation on the Improvement of Dredged Sludge Using Air–Booster Vacuum Preloading with Polyacrylamide Addition


Abstract
1. Introduction
2. Materials and Methods
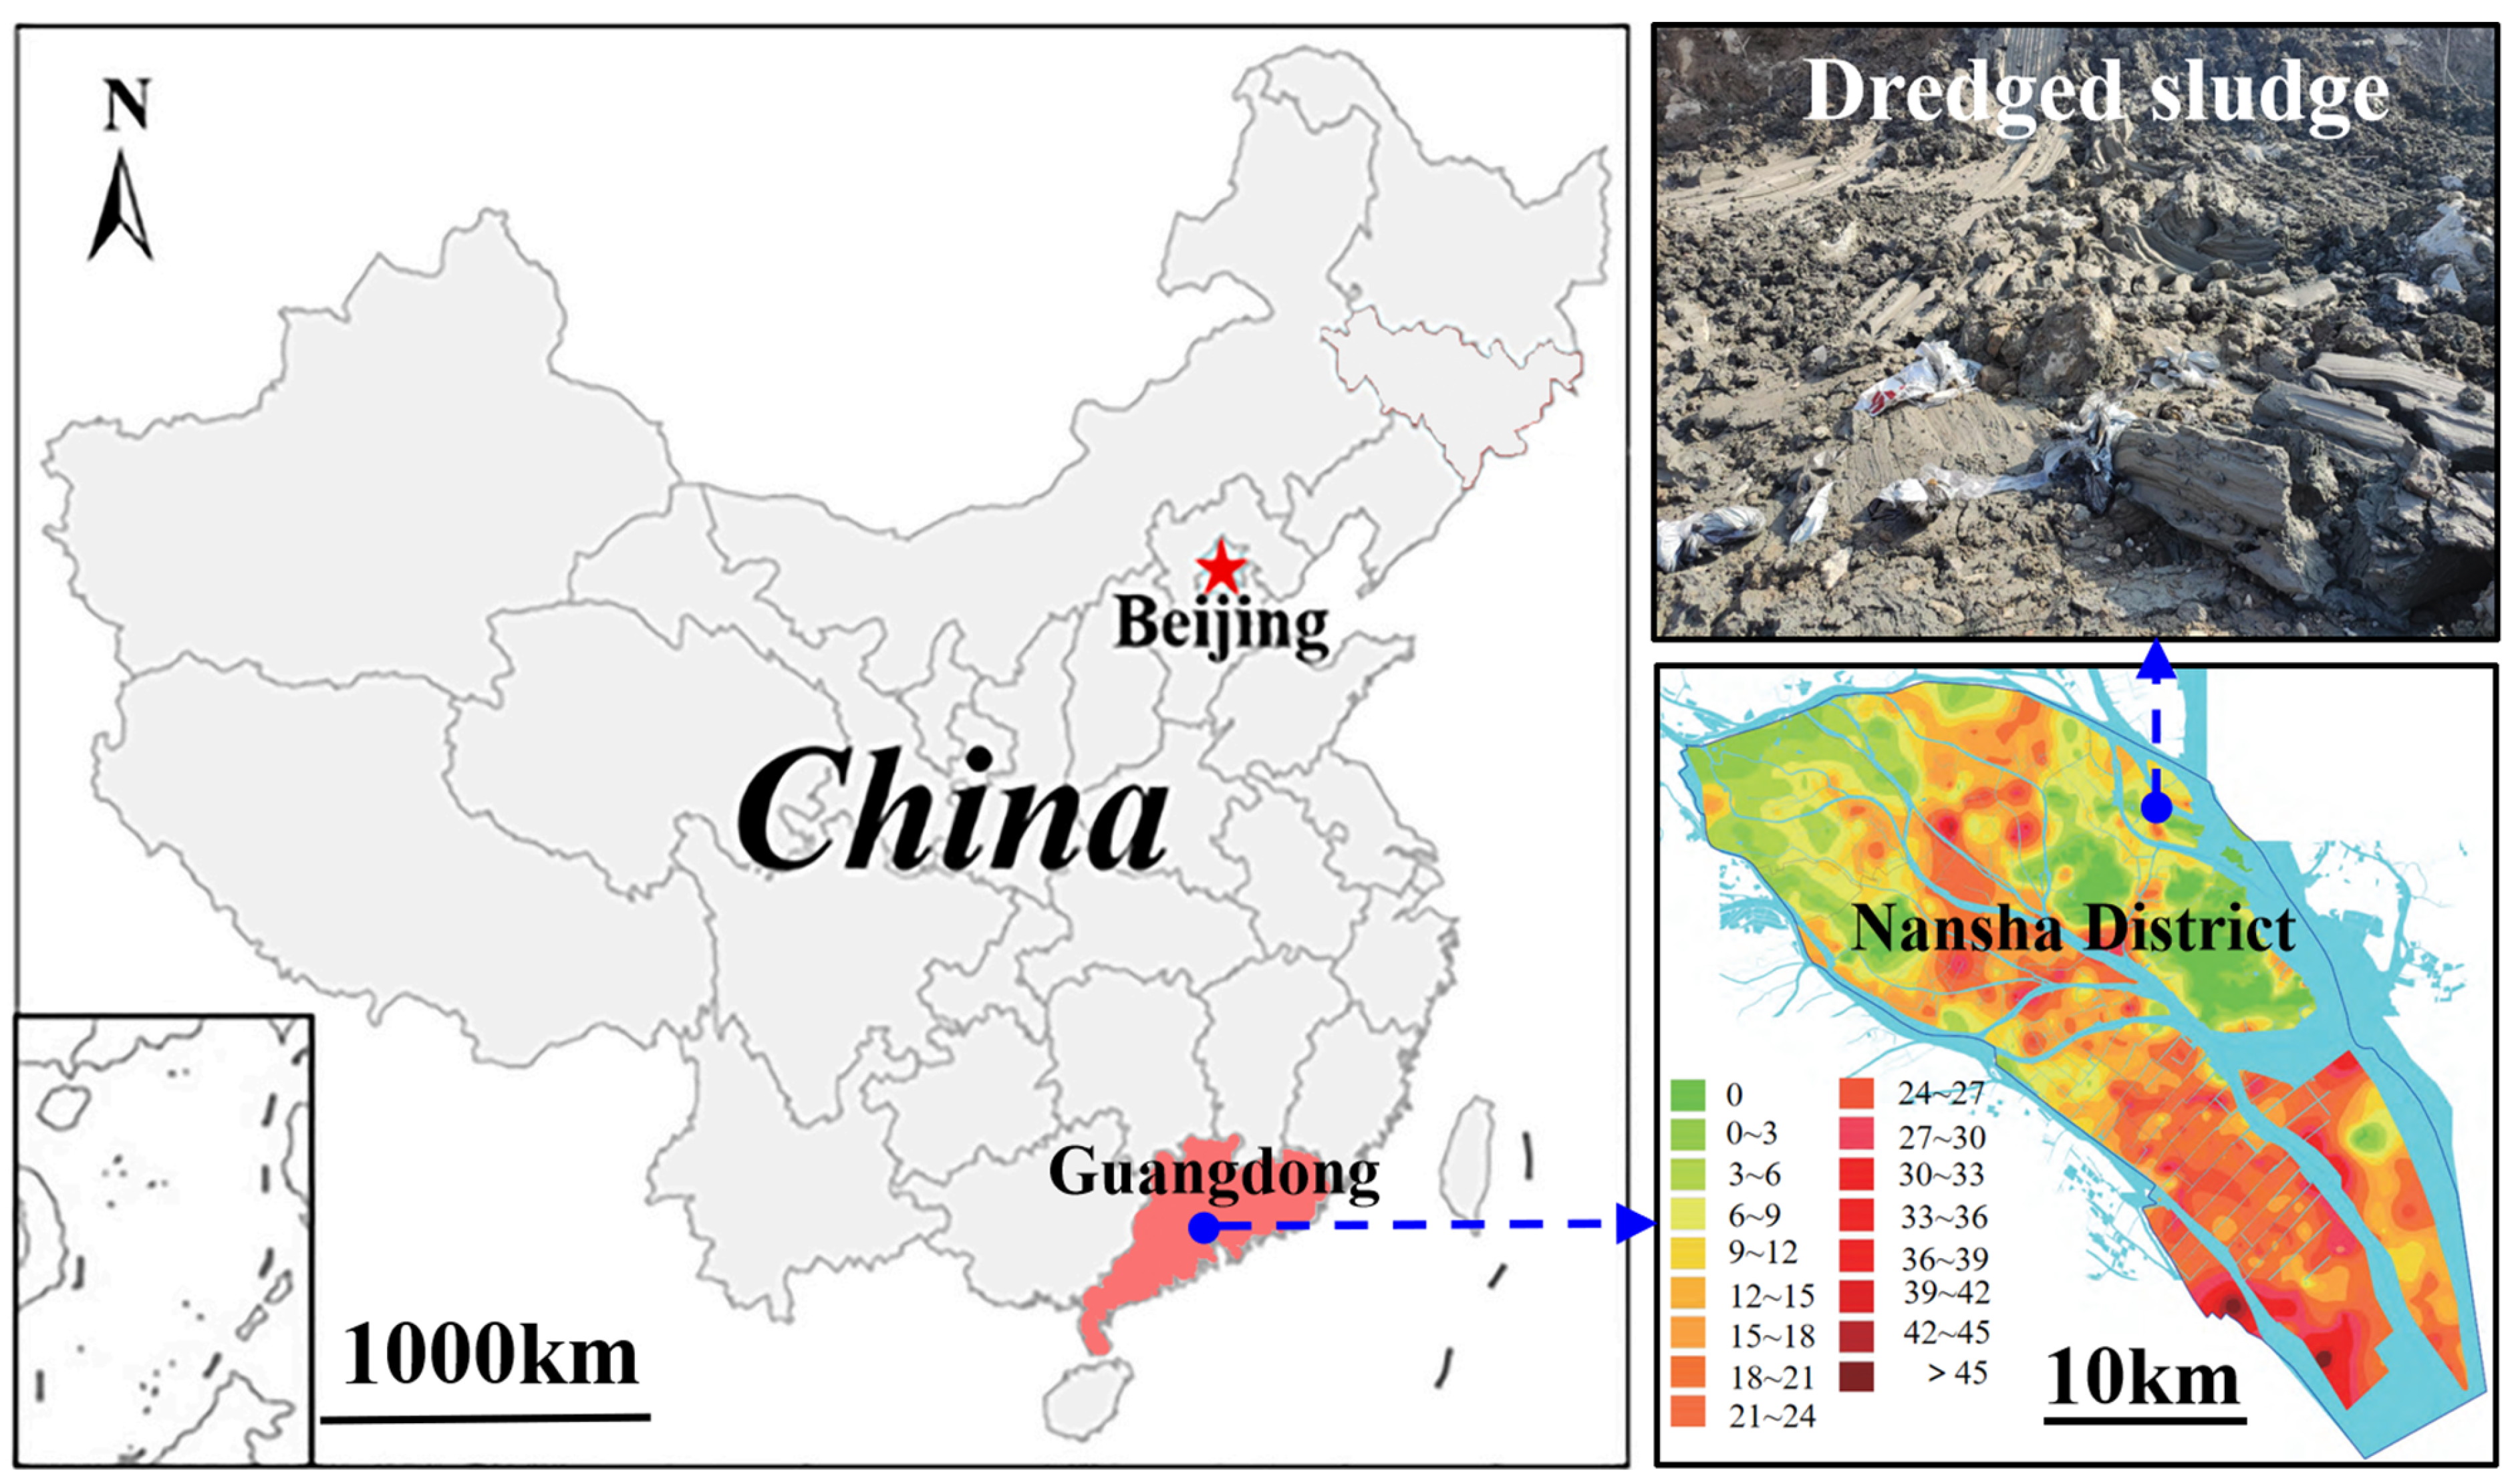
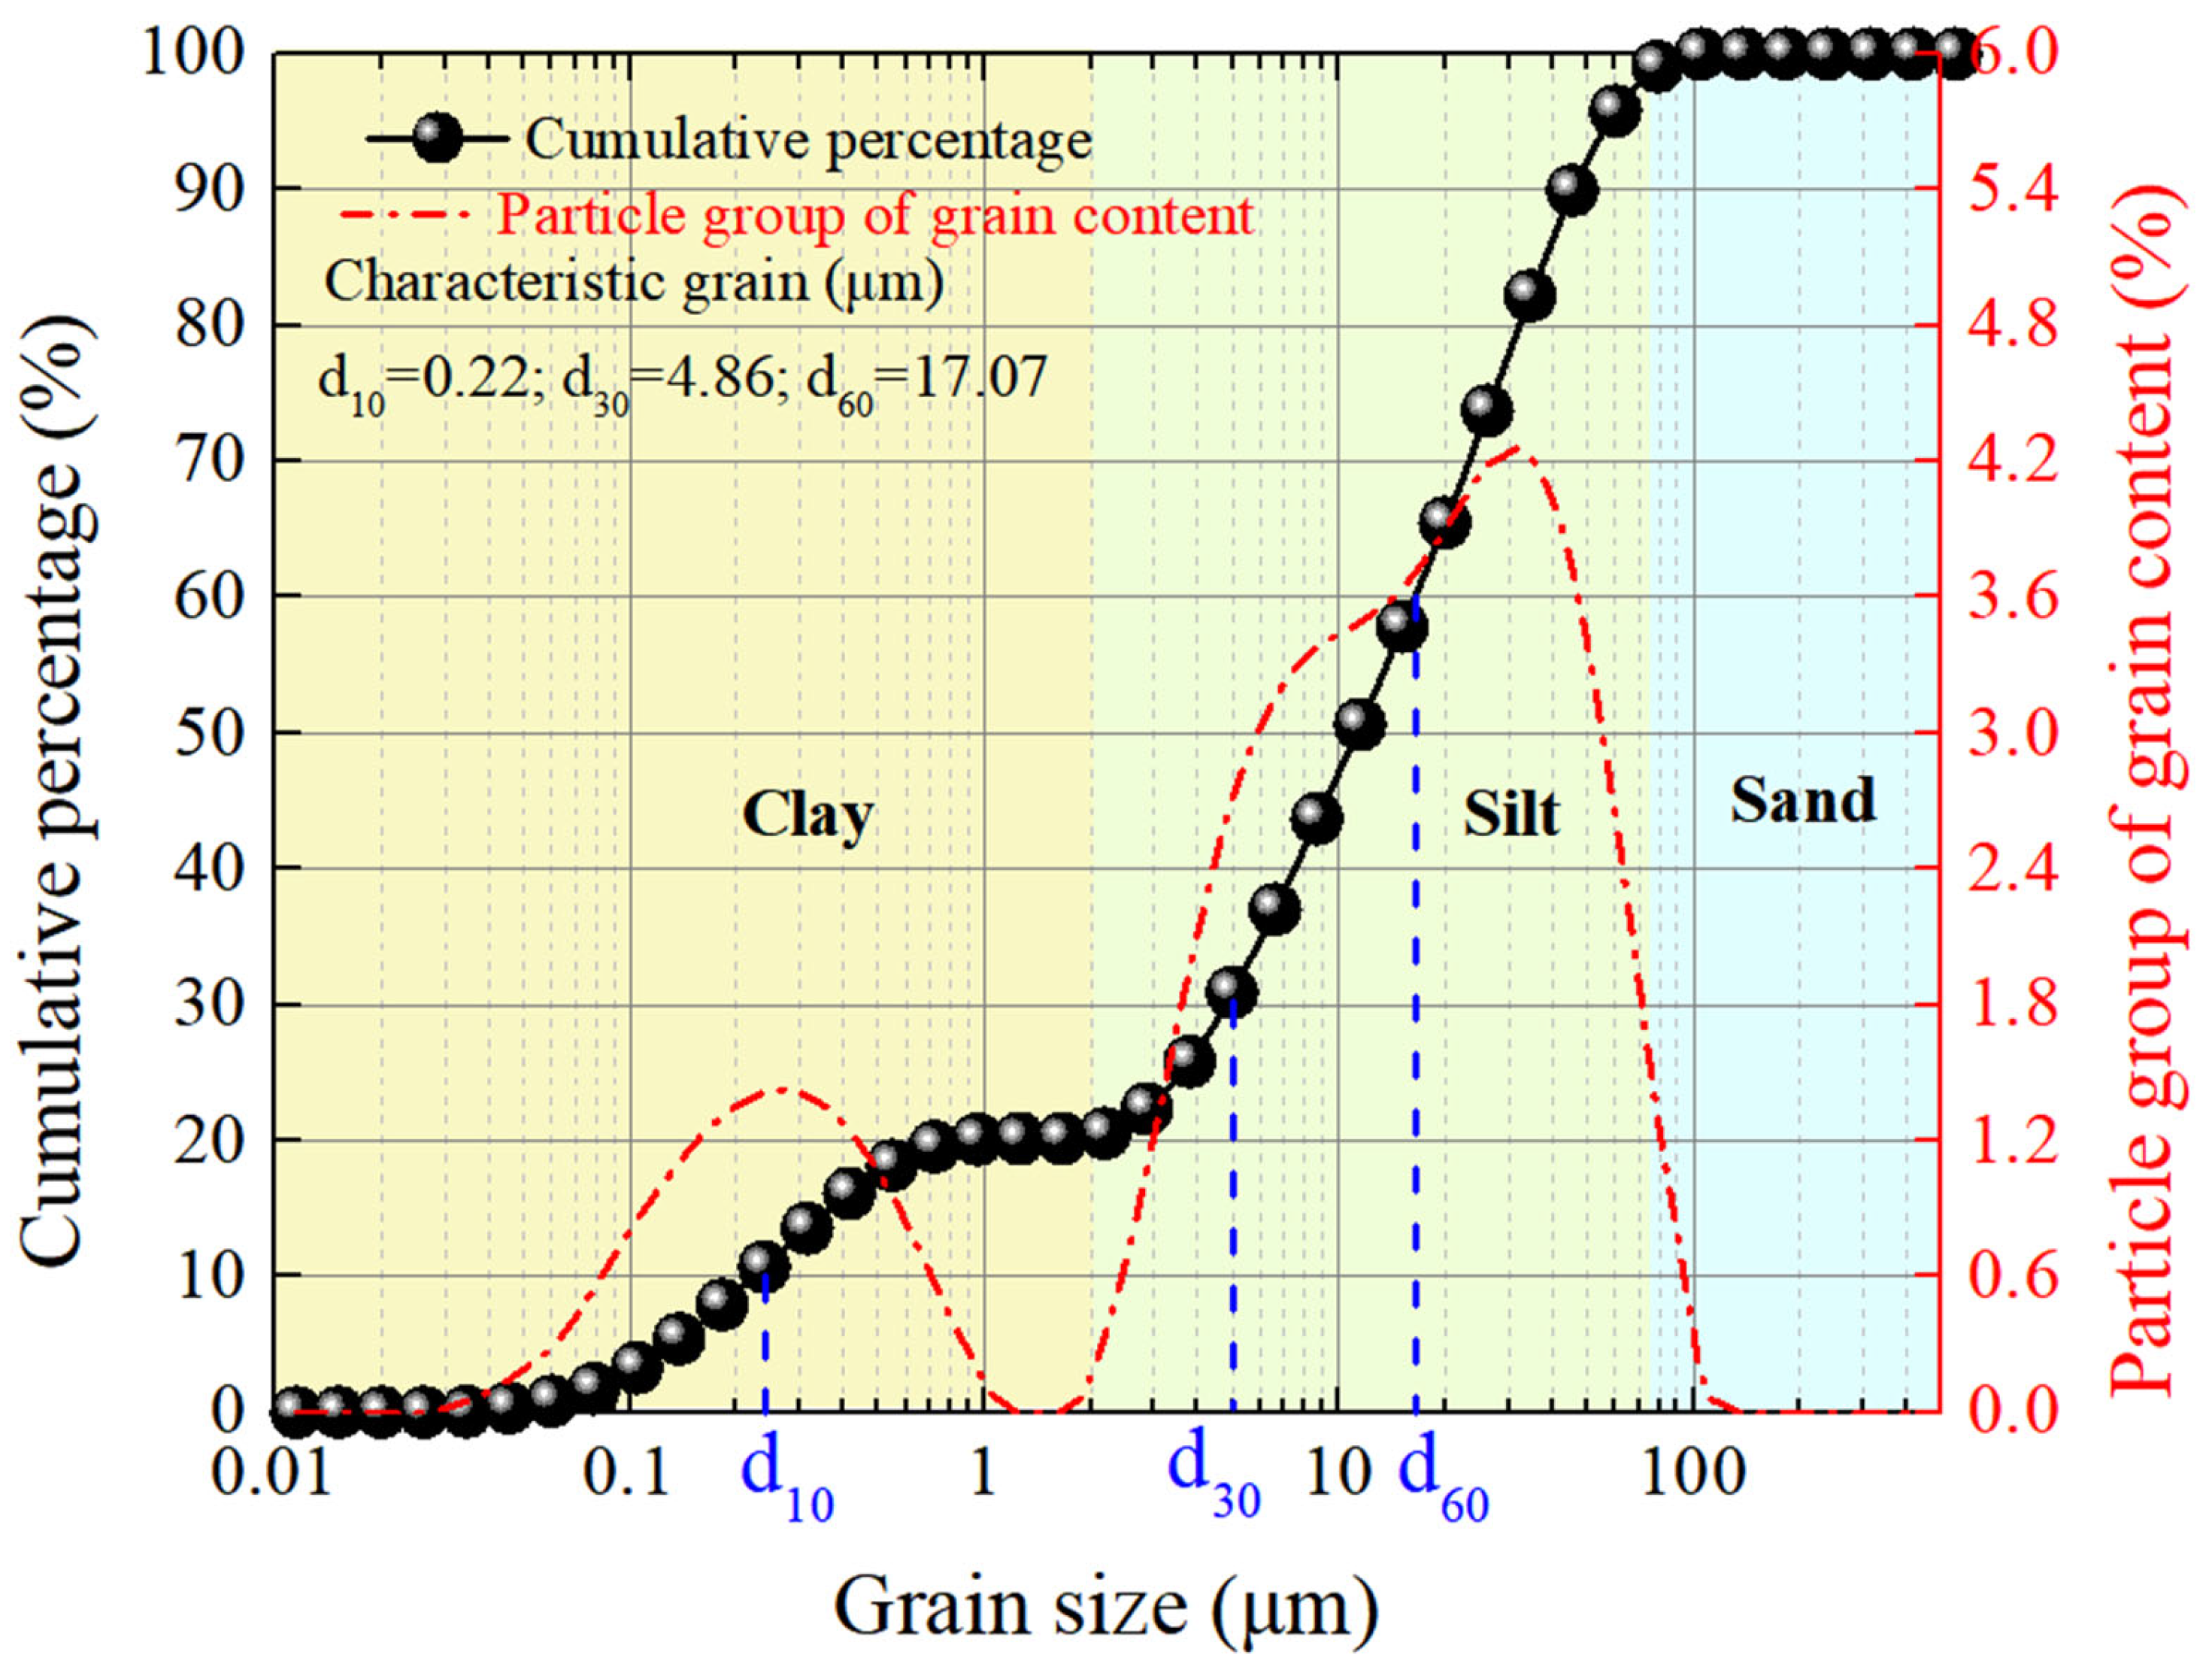
2.1. Materials
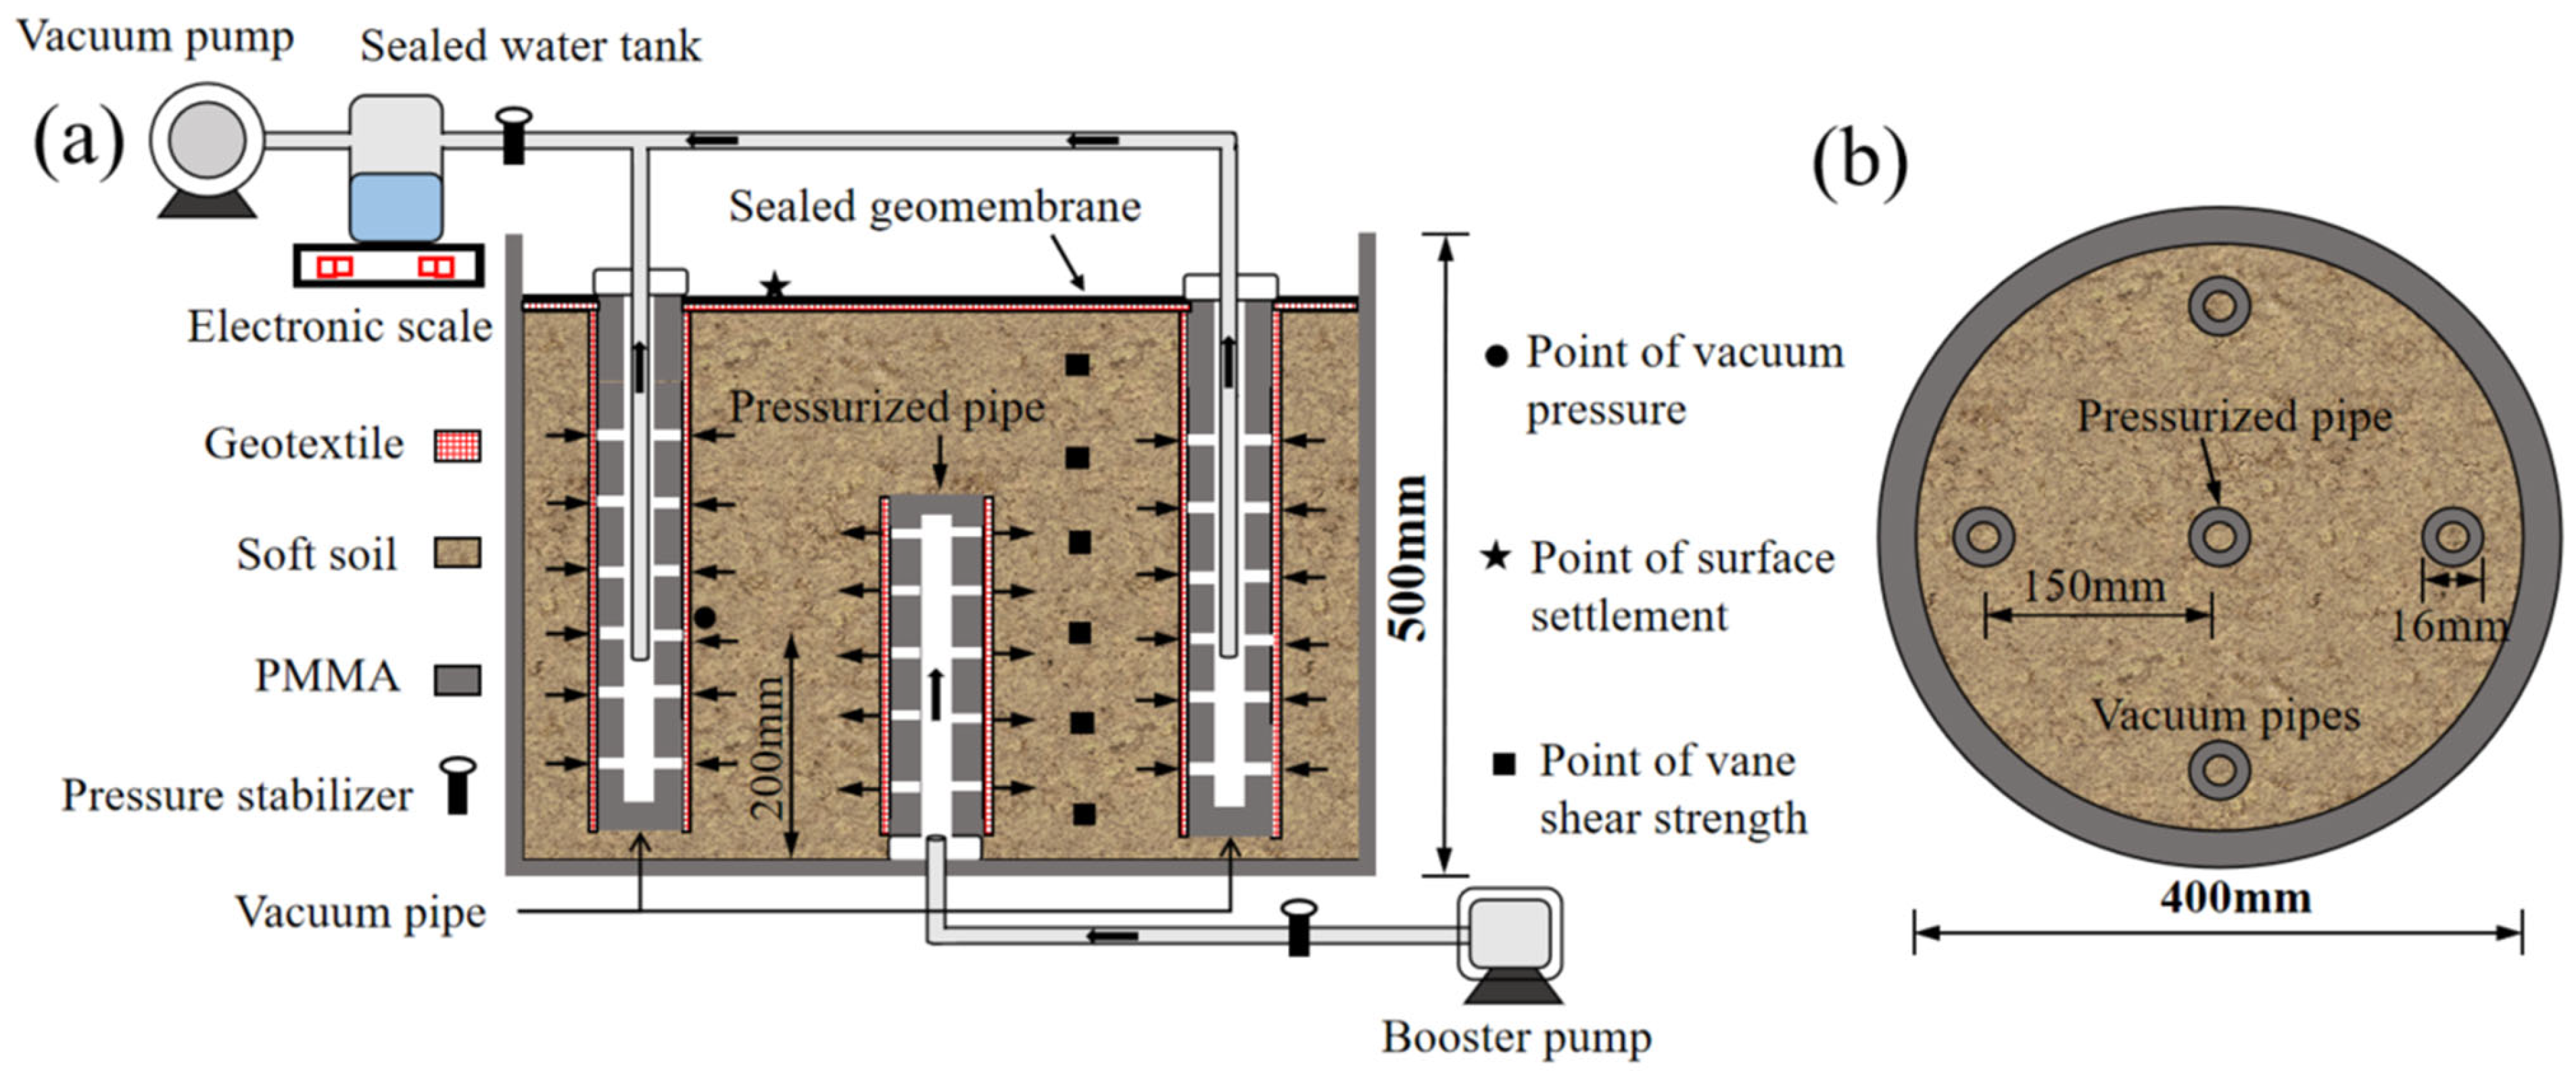
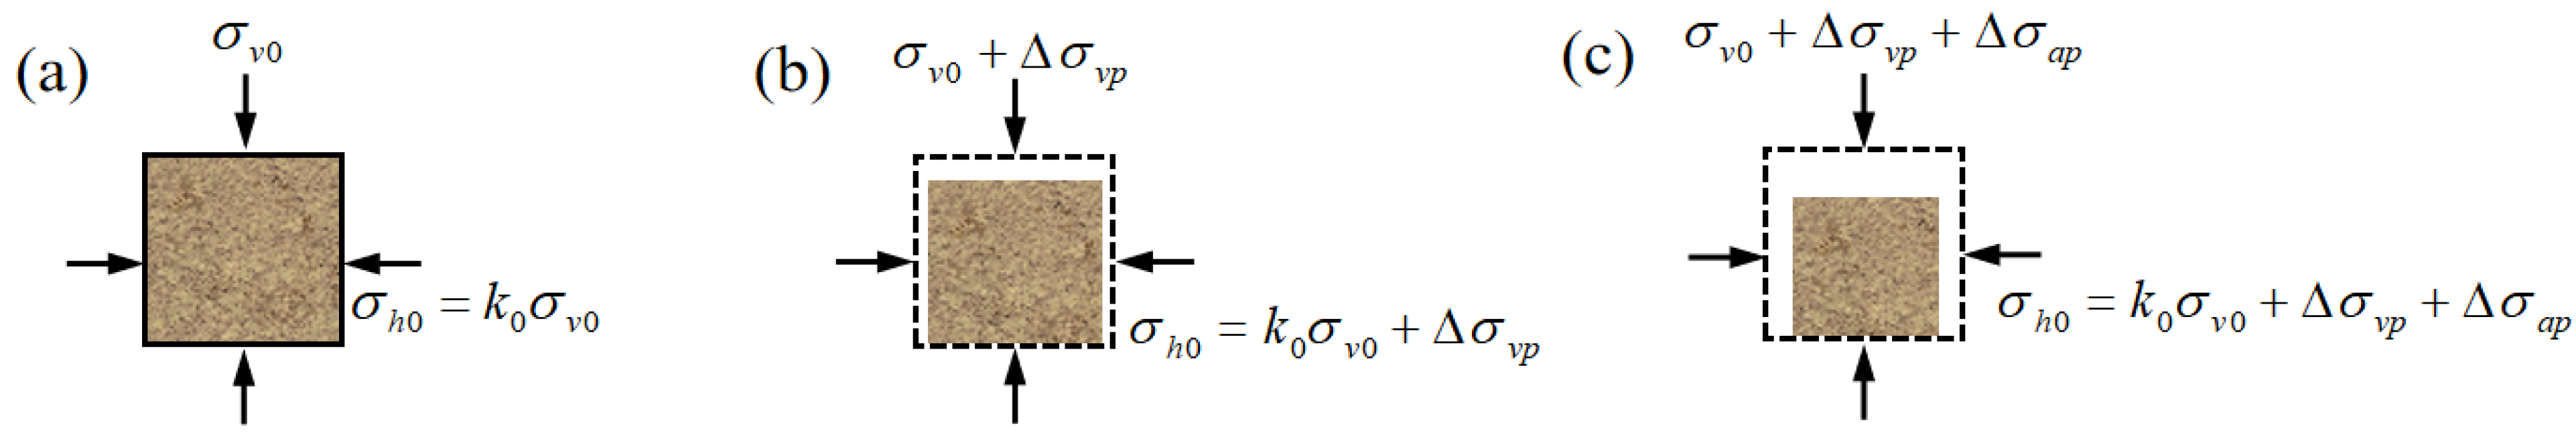
2.2. Air–Booster Vacuum Preloading System
2.3. Test Procedures
3. Results and Discussion
3.1. Discharged Water in Drainage Test
3.2. Discharged Water in Model Test
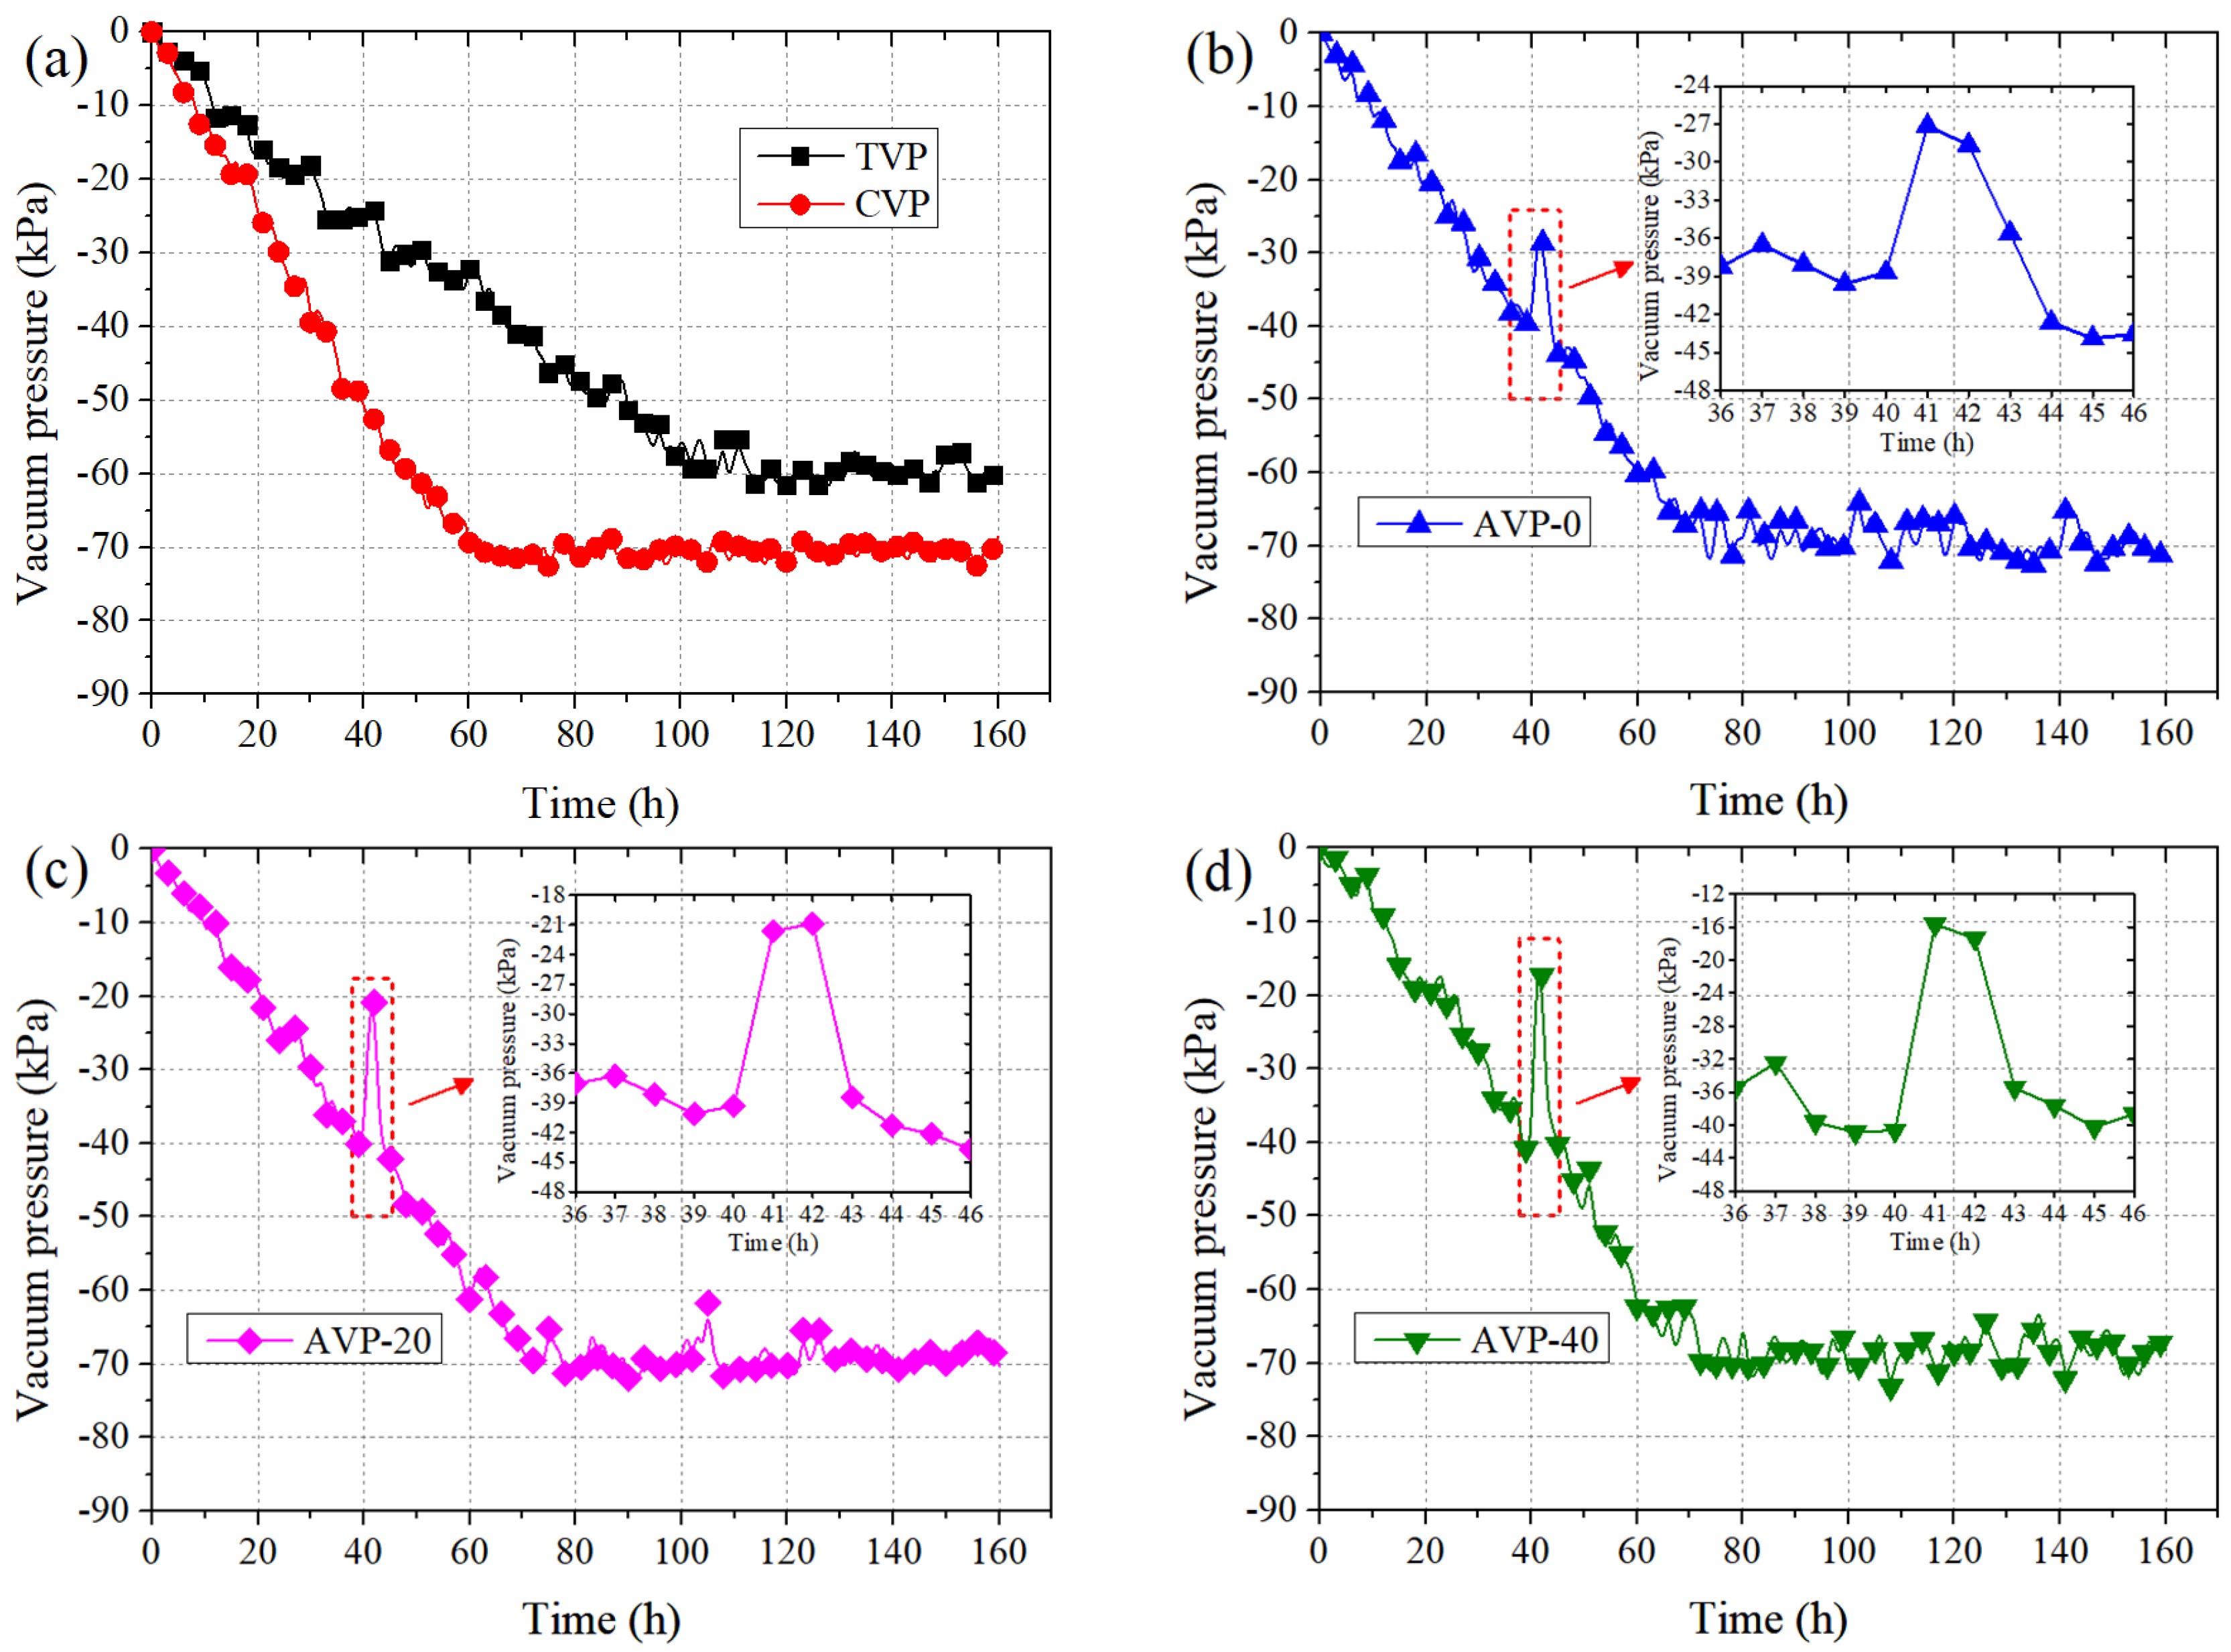
3.3. Vacuum Pressure
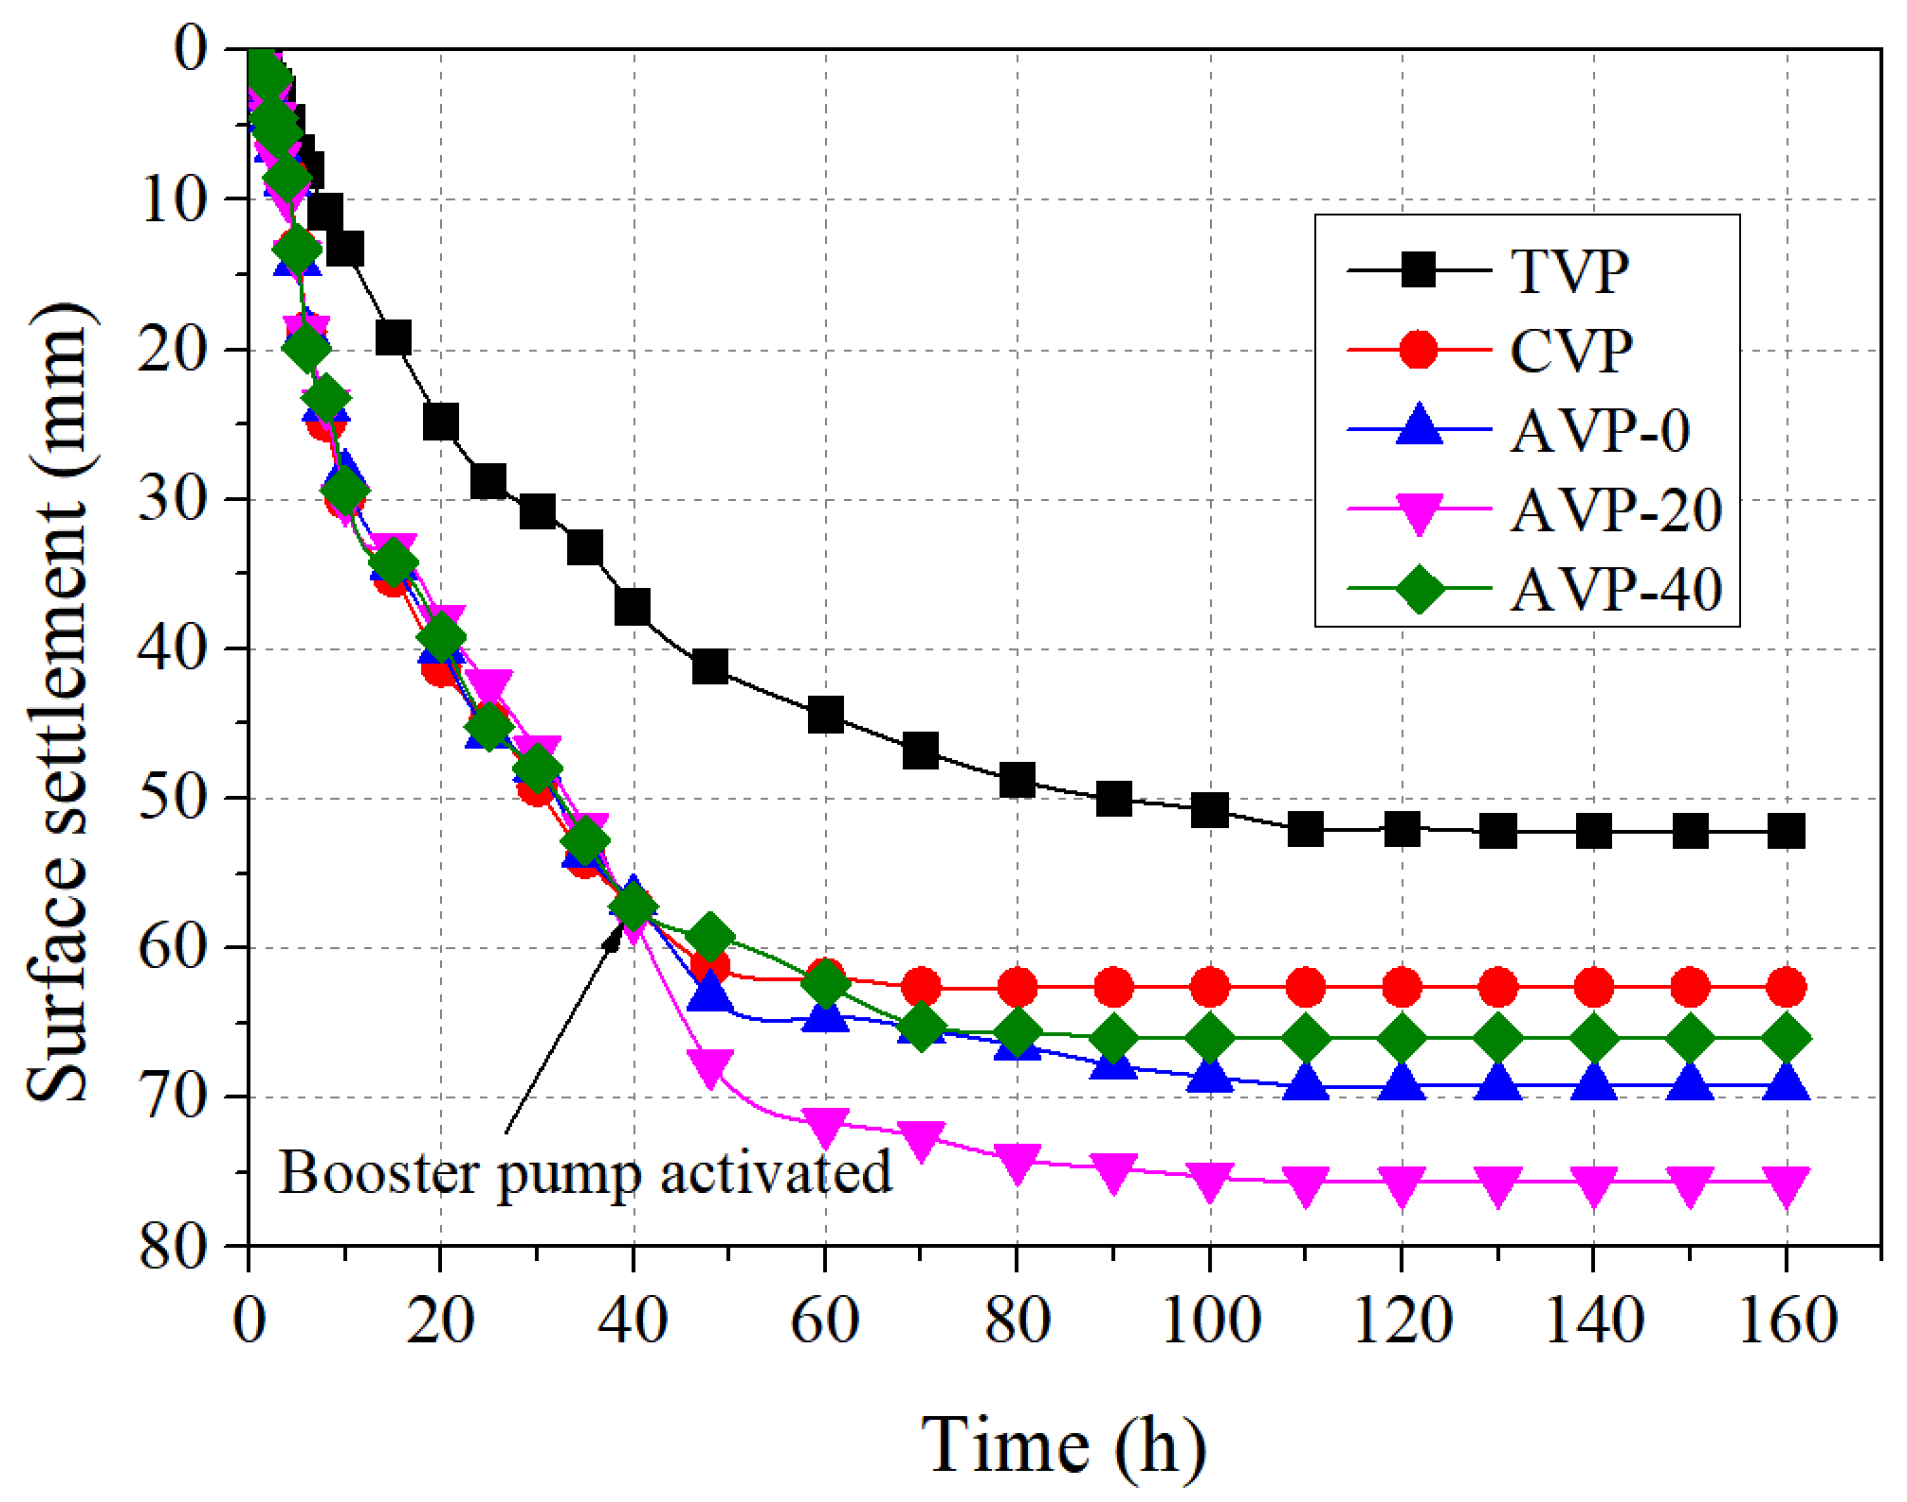
3.4. Surface Settlement
3.5. Water Content
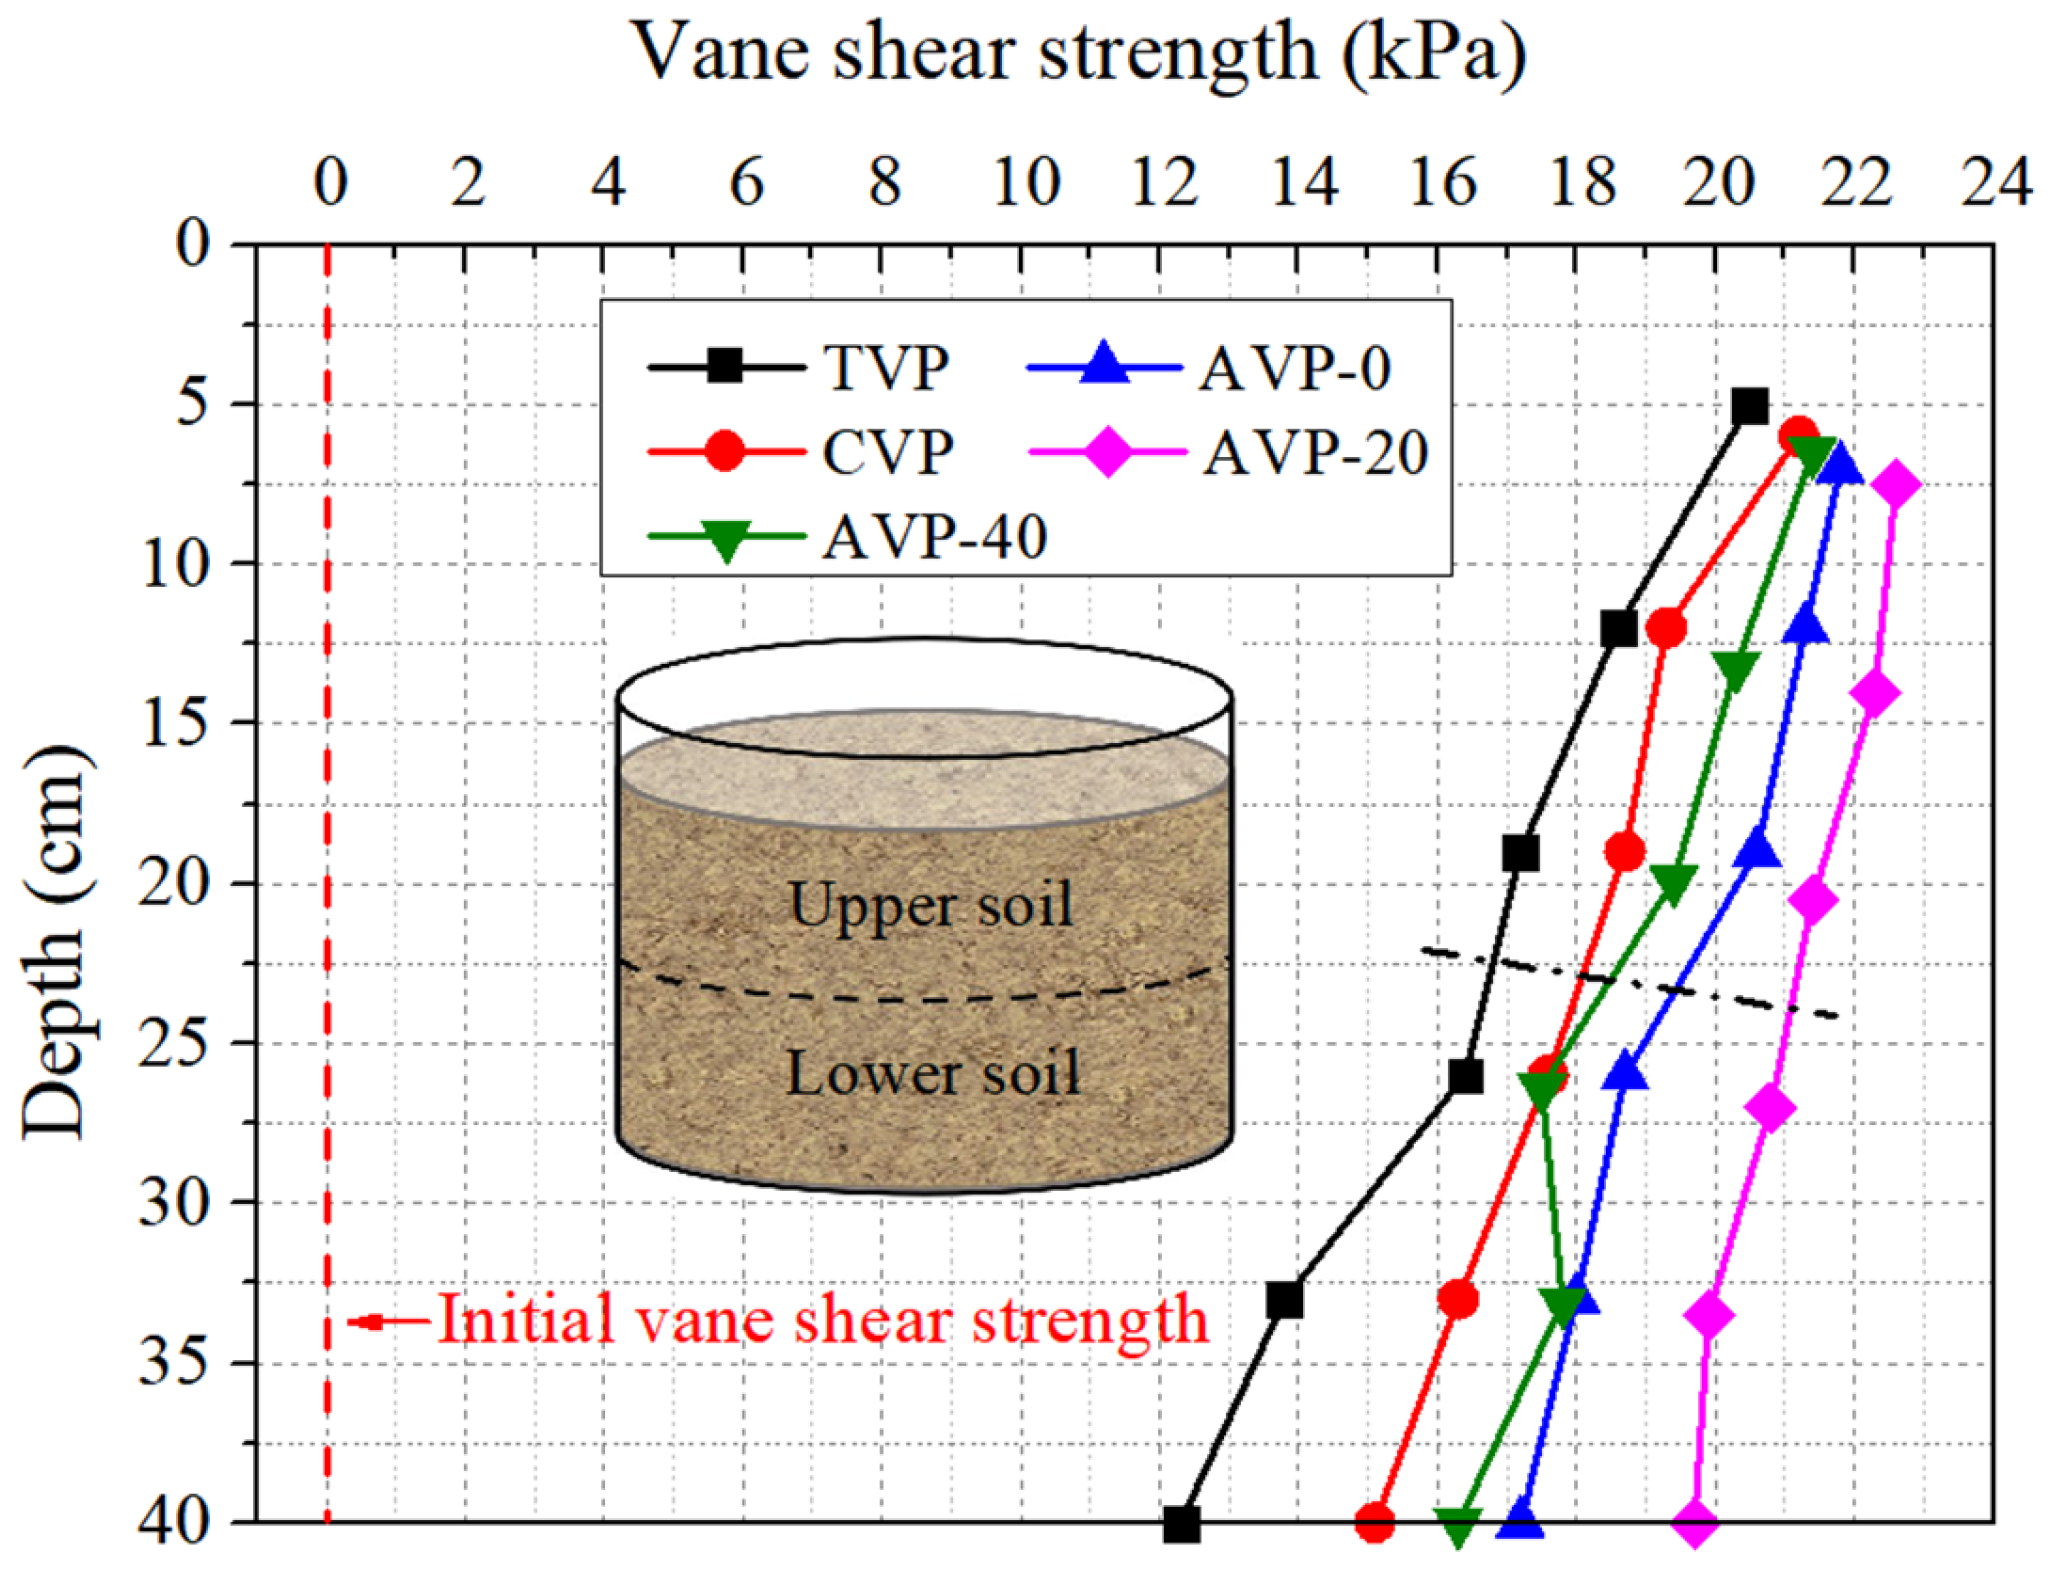
3.6. Shear Strength
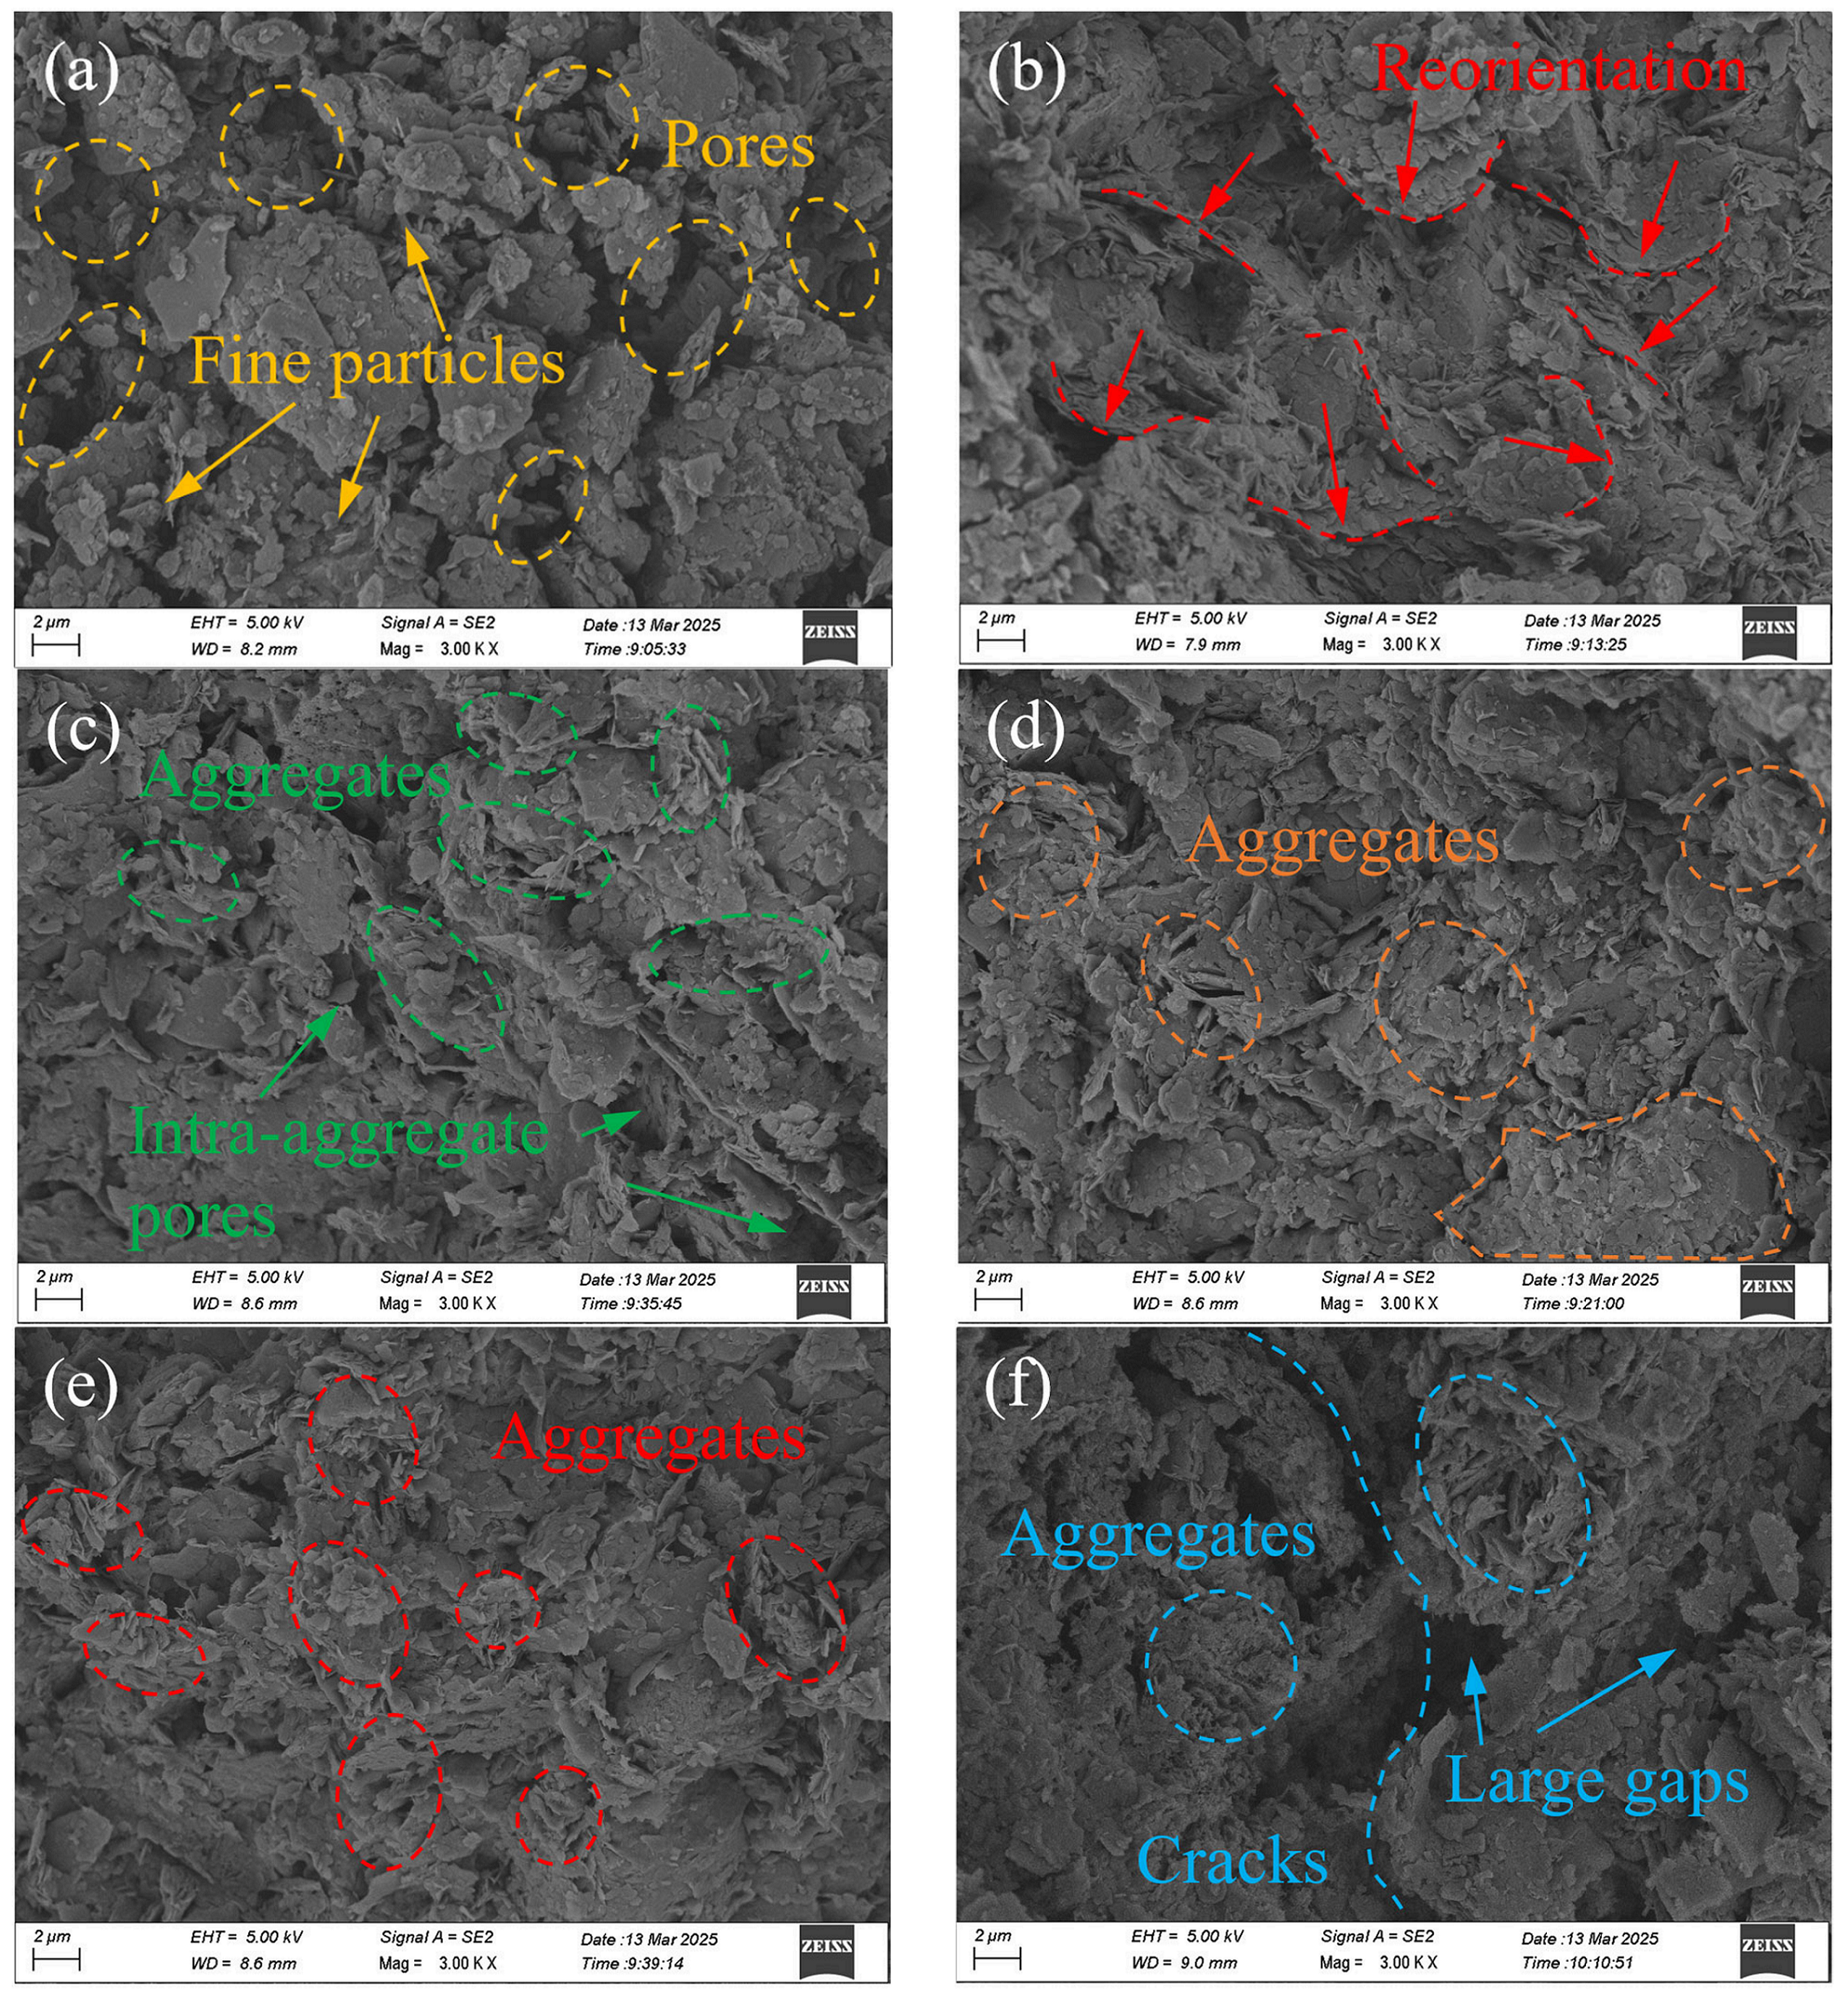
3.7. Soil Particle
4. Conclusions
- (1)
- Cationic polyacrylamide (CPAM) was confirmed as the appropriate additive for consolidating dredged sludge, as it not only accelerated the water discharge process but also promoted the aggregation of fine soil particles through neutralization and adsorption. In comparison with APAM or NPAM, the addition of 0.075% CPAM increased water discharge efficiency by nearly 36.4%, leading to the faster consolidation of dredged sludge in the drainage test.
- (2)
- Air–booster vacuum preloading (AVP) consolidated dredged sludge more efficiently, as it provided an additional hydraulic gradient that accelerated water discharge. However, this positive effect was highly dependent on the pressurized air pressure. Excessive pressure caused soil fracturing and the formation of airflow channels, significantly reducing the effectiveness of air–booster vacuum preloading. Conversely, insufficient pressure failed to disrupt soil particle reorientation under vacuum pressure, limiting improvements in soil permeability.
- (3)
- The combination of AVP and the CPAM addition demonstrated superior effectiveness in improving the physical and mechanical properties of dredged sludge. The pressurized groups obtained much higher efficiency in water discharge and vacuum pressure transmission than the comparison groups during testing. Compared with soil treated with traditional vacuum preloading, the soil shear strength of the pressurized groups increased by 19.2% to 60.2%, the ultimate water content decreased by 3.6% to 13.3%, and the soil’s microscopic morphology became more compact and uniform. Notably, the synergistic application of 20 kPa pressurized air and 0.075% CPAM was recommended based on the aforementioned test results.
Author Contributions
Funding
Institutional Review Board Statement
Informed Consent Statement
Data Availability Statement
Acknowledgments
Conflicts of Interest
References
- Xu, B.H.; He, N.; Jiang, Y.B.; Zhou, Y.Z.; Zhan, X.J. Experimental study on the clogging effect of dredged fill surrounding the PVD under vacuum preloading. Geotext. Geomembr. 2020, 48, 614–624. [Google Scholar] [CrossRef]
- Cai, Y.Q.; Qiao, H.H.; Wang, J.; Geng, X.Y.; Wang, P.; Cai, Y. Experimental tests on effect of deformed prefabricated vertical drains in dredged soil on consolidation via vacuum preloading. Eng. Geol. 2017, 222, 10–19. [Google Scholar] [CrossRef]
- Deng, Y.F.; Liu, L.; Cui, Y.J.; Chen, X.L.; He, N. Colloid effect on clogging mechanism of hydraulic reclamation mud improved by vacuum preloading. Can. Geotech. J. 2019, 56, 611–620. [Google Scholar] [CrossRef]
- Ni, P.P.; Xu, K.; Mei, G.X.; Zhao, Y.L. Effect of vacuum removal on consolidation settlement under a combined vacuum and surcharge preloading. Geotext. Geomembr. 2019, 47, 12–22. [Google Scholar] [CrossRef]
- Wang, J.; Huang, G.; Fu, H.T.; Cai, Y.Q.; Hu, X.Q.; Lou, X.M.; Jin, Y.W.; Hai, J.; Ni, J.F.; Zou, J. Vacuum preloading combined with multiple-flocculant treatment for dredged fill improvement. Eng. Geol. 2019, 259, 105194. [Google Scholar] [CrossRef]
- Arulrajah, A.; Chu, J.; Bo, M.W. Soil improvement works for an offshore land reclamation. Geotech. Eng. 2009, 162, 21–32. [Google Scholar] [CrossRef]
- Bo, M.W.; Arulrajah, A.; Nikraz, H. Preloading and prefabricated vertical drains design for foreshore land reclamation projects: A case study. Proc. Inst. Civ. Eng. Ground Improv. 2007, 11, 67–76. [Google Scholar] [CrossRef]
- Zhang, X.D.; Huang, T.W.; Wu, Y.J. Soil drainage clogging mechanism under vacuum preloading: A review. Transp. Geotech. 2024, 45, 101178. [Google Scholar] [CrossRef]
- Chen, P.S.; Dong, Z.L.; Zhang, G.X. Mechanism and numerical simulation of the “soil piles” in the fresh hydraulic mud fill treated by surface-layer improvement technique. Port Waterw. Eng. 2015, 2, 88–94. (In Chinese) [Google Scholar]
- Yuan, X.Q.; Wang, Q.; Lu, W.X.; Zhang, W.; Chen, H.E.; Zhang, Y. Indoor simulation test of step vacuum preloading for high-clay content dredger fill. Mar. Georesour. Geotechnol. 2018, 36, 83–90. [Google Scholar] [CrossRef]
- Cai, Y.Q.; Xie, Z.W.; Wang, J.; Wang, P.; Geng, X.Y. New approach of vacuum preloading with booster prefabricated vertical drains (PVDs) to improve deep marine clay strata. Can. Geotech. J. 2018, 55, 1359–1371. [Google Scholar] [CrossRef]
- Lei, H.Y.; Xu, Y.G.; Li, X.; Jiang, M.J.; Liu, L.Z. Effect of Polyacrylamide on Improvement of Dredger Fill with Vacuum Preloading Method. J. Mater. Civ. Eng. 2019, 31, 04019193. [Google Scholar] [CrossRef]
- Anda, R.; Fu, H.T.; Wang, J.; Lei, H.Y.; Hu, X.Q.; Ye, Q.; Cai, Y.Q.; Xie, Z.W. Effects of pressurizing timing on air booster vacuum consolidation of dredged slurry. Geotext. Geomembr. 2020, 48, 491–503. [Google Scholar] [CrossRef]
- Zhang, H.; Zhou, G.; Wu, J.L.; Zhong, J.; Wu, J.L.; Shi, X.M. Mechanism for Soil Reinforcement by Electroosmosis in the Presence of Calcium Chloride. Chem. Eng. Commun. 2016, 204, 424–433. [Google Scholar] [CrossRef]
- Shen, Y.P.; Feng, R.L.; Zhong, S.Y.; Li, Z. Study on optimized design of vacuum preloading with air pressure boosted for treatment of railway station & yard foundations. J. China Railw. Soc. 2012, 34, 88–93. (In Chinese) [Google Scholar]
- Phummiphan, I.; Horpibulsuk, S.; Sukmak, P.; Chinkulkijniwat, A.; Arulrajah, A.; Shen, S.L. Stabilisation of marginal lateritic soil using high calcium fly ash based geopolymer. Road Mater. Pavement Des. 2017, 17, 877–891. [Google Scholar] [CrossRef]
- Latifi, N.; Marto, A.; Eisazadeh, A. Physicochemical behavior of tropical laterite soil stabilized with nontraditional additive. Acta Geotech. 2016, 11, 433–443. [Google Scholar] [CrossRef]
- Huang, J.X.; Kogbara, R.B.; Hariharan, N.; Masad, E.A.; Little, D.N. A state-of-the-art review of polymers used in soil stabilization. Constr. Build. Mater. 2021, 305, 124685. [Google Scholar] [CrossRef]
- Xu, G.Z.; Qiu, C.C.; Song, M.M.; Cao, Y.P.; Yin, J. Flocculant effects on fluidity and strength behavior of cemented dredged clay with high water content. Mar. Georesour. Geotec. 2021, 39, 951–961. [Google Scholar] [CrossRef]
- Liu, F.Y.; Wu, W.Q.; Fu, H.T.; Wang, J.; Hai, J.; Cai, Y.Q.; Hu, X.Q.; Yuan, W.X.; Lou, X.M. Application of flocculation combined with vacuum preloading to reduce river-dredged sludge. Mar. Georesour. Geotec. 2020, 38, 164–173. [Google Scholar] [CrossRef]
- Latifi, N.; Meehan, C.L.; Majid, M.Z.A.; Horpibulsuk, S. Strengthening montmorillonitic and kaolinitic clays using a calcium-based non-traditional additive: A micro-level study. Appl. Clay Sci. 2016, 132–133, 182–193. [Google Scholar] [CrossRef]
- D4318-10; Standard Test Methods for Liquid Limit, Plastic Limit, and Plasticity Index of Soils. ASTM International: West Conshohocken, PA, USA, 2010. [CrossRef]
- D2487-10; Standard Practice for Classification of Soils for Engineering Purposes (Unified Soil Classification System). ASTM International: West Conshohocken, PA, USA, 2010. [CrossRef]
- Zhang, G.P. Soil Nanoparticles and Their Influence on Engineering Properties of Soils. Adv. Meas. Model. Soil Behav. 2007, 173, 1–13. [Google Scholar] [CrossRef]
- Tang, K.W.; Zhang, F.; Feng, D.C.; Lu, X.F. Moisture migration and electric distribution of unsaturated clay under electro-osmosis with carbon fiber tape as electrode. Eng. Geol. 2021, 294, 106404. [Google Scholar] [CrossRef]
- Soltani, J.H.; Bagheri, M.; Amani, A.R. Use of hydrophilic polymeric stabilizer to improve strength and durability of fine-grained soils. Cold. Reg. Sci. Technol. 2019, 157, 187–195. [Google Scholar] [CrossRef]
- Ghernaout, D.; Ghernaout, B. Sweep flocculation as a second form of charge neutralization—A review. Desalin. Water Treat. 2012, 44, 15–28. [Google Scholar] [CrossRef]
- Wang, J.; Zhao, R.; Cai, Y.Q.; Fu, H.T.; Li, X.B.; Hu, X.Q. Vacuum preloading and electro-osmosis consolidation of dredged slurry pre-treated with flocculants. Eng. Geol. 2018, 246, 123–130. [Google Scholar] [CrossRef]
- Zheng, H.L.; Sun, Y.J.; Guo, J.S.; Li, F.T.; Fan, W.; Liao, Y.; Guan, Q.Q. Characterization and Evaluation of Dewatering Properties of PADB, a Highly Efficient Cationic Flocculant. Ind. Eng. Chem. Res. 2014, 53, 2572–2582. [Google Scholar] [CrossRef]
- Saveyn, H.; Pauwels, G.; Timmerman, R.; Meeren, P.V.D. Effect of polyelectrolyte conditioning on the enhanced dewatering of activated sludge by application of an electric field during the expression phase. Water Res. 2005, 39, 3012–3020. [Google Scholar] [CrossRef]
- He, B.; Qin, X.H.; Zhou, Z.Q.; Xu, B.; Yu, S.L.; Qin, G.L.; Liu, K.; Peng, X.C.; Nie, X.Q.; Ma, F.L.; et al. Experimental study on composite flocculant-electroosmosis combined with segmented solidification treatment of high-water-content slurry. Constr. Build. Mater. 2023, 400, 132729. [Google Scholar] [CrossRef]


| Initial Water Content | Density | Specific Gravity | Saturation | Void Ratio | Liquid Limit | Plastic Limit |
|---|---|---|---|---|---|---|
| w0/% | ρ/g·cm−3 | Gs | Sr/% | e0 | wL/% | wP/% |
| 70.8 | 1.62 | 2.71 | 100 | 1.92 | 42.6 | 20.2 |
| Group ID | Consolidation Method | CPAM Dosage (by Dry Soil Mass) | Booster Pressure (kPa) | Pressurizing Time (h) |
|---|---|---|---|---|
| TVP | Vacuum preloading | / | / | / |
| CVP | Vacuum preloading | 0.075% | / | / |
| AVP-0 | Air–booster vacuum preloading | 0.075% | 0 | 2 |
| AVP-20 | Air–booster vacuum preloading | 0.075% | 20 | 2 |
| AVP-40 | Air–booster vacuum preloading | 0.075% | 40 | 2 |
Disclaimer/Publisher’s Note: The statements, opinions and data contained in all publications are solely those of the individual author(s) and contributor(s) and not of MDPI and/or the editor(s). MDPI and/or the editor(s) disclaim responsibility for any injury to people or property resulting from any ideas, methods, instructions or products referred to in the content. |
© 2025 by the authors. Licensee MDPI, Basel, Switzerland. This article is an open access article distributed under the terms and conditions of the Creative Commons Attribution (CC BY) license (https://creativecommons.org/licenses/by/4.0/).
Share and Cite
Zhang, H.; Guo, L.; Tu, C. Experimental Investigation on the Improvement of Dredged Sludge Using Air–Booster Vacuum Preloading with Polyacrylamide Addition. Materials 2025, 18, 2065. https://doi.org/10.3390/ma18092065
Zhang H, Guo L, Tu C. Experimental Investigation on the Improvement of Dredged Sludge Using Air–Booster Vacuum Preloading with Polyacrylamide Addition. Materials. 2025; 18(9):2065. https://doi.org/10.3390/ma18092065
Chicago/Turabian StyleZhang, Heng, Lingfeng Guo, and Chongzhi Tu. 2025. "Experimental Investigation on the Improvement of Dredged Sludge Using Air–Booster Vacuum Preloading with Polyacrylamide Addition" Materials 18, no. 9: 2065. https://doi.org/10.3390/ma18092065
APA StyleZhang, H., Guo, L., & Tu, C. (2025). Experimental Investigation on the Improvement of Dredged Sludge Using Air–Booster Vacuum Preloading with Polyacrylamide Addition. Materials, 18(9), 2065. https://doi.org/10.3390/ma18092065