Effect of Sn Content on Wettability and Interfacial Structure of Cu–Sn–Cr/Graphite Systems: Experimental and First-Principles Investigations


Abstract
1. Introduction
2. Experimental and Calculation
2.1. Experimental Materials and Methods
2.2. Calculation Methods
3. Results
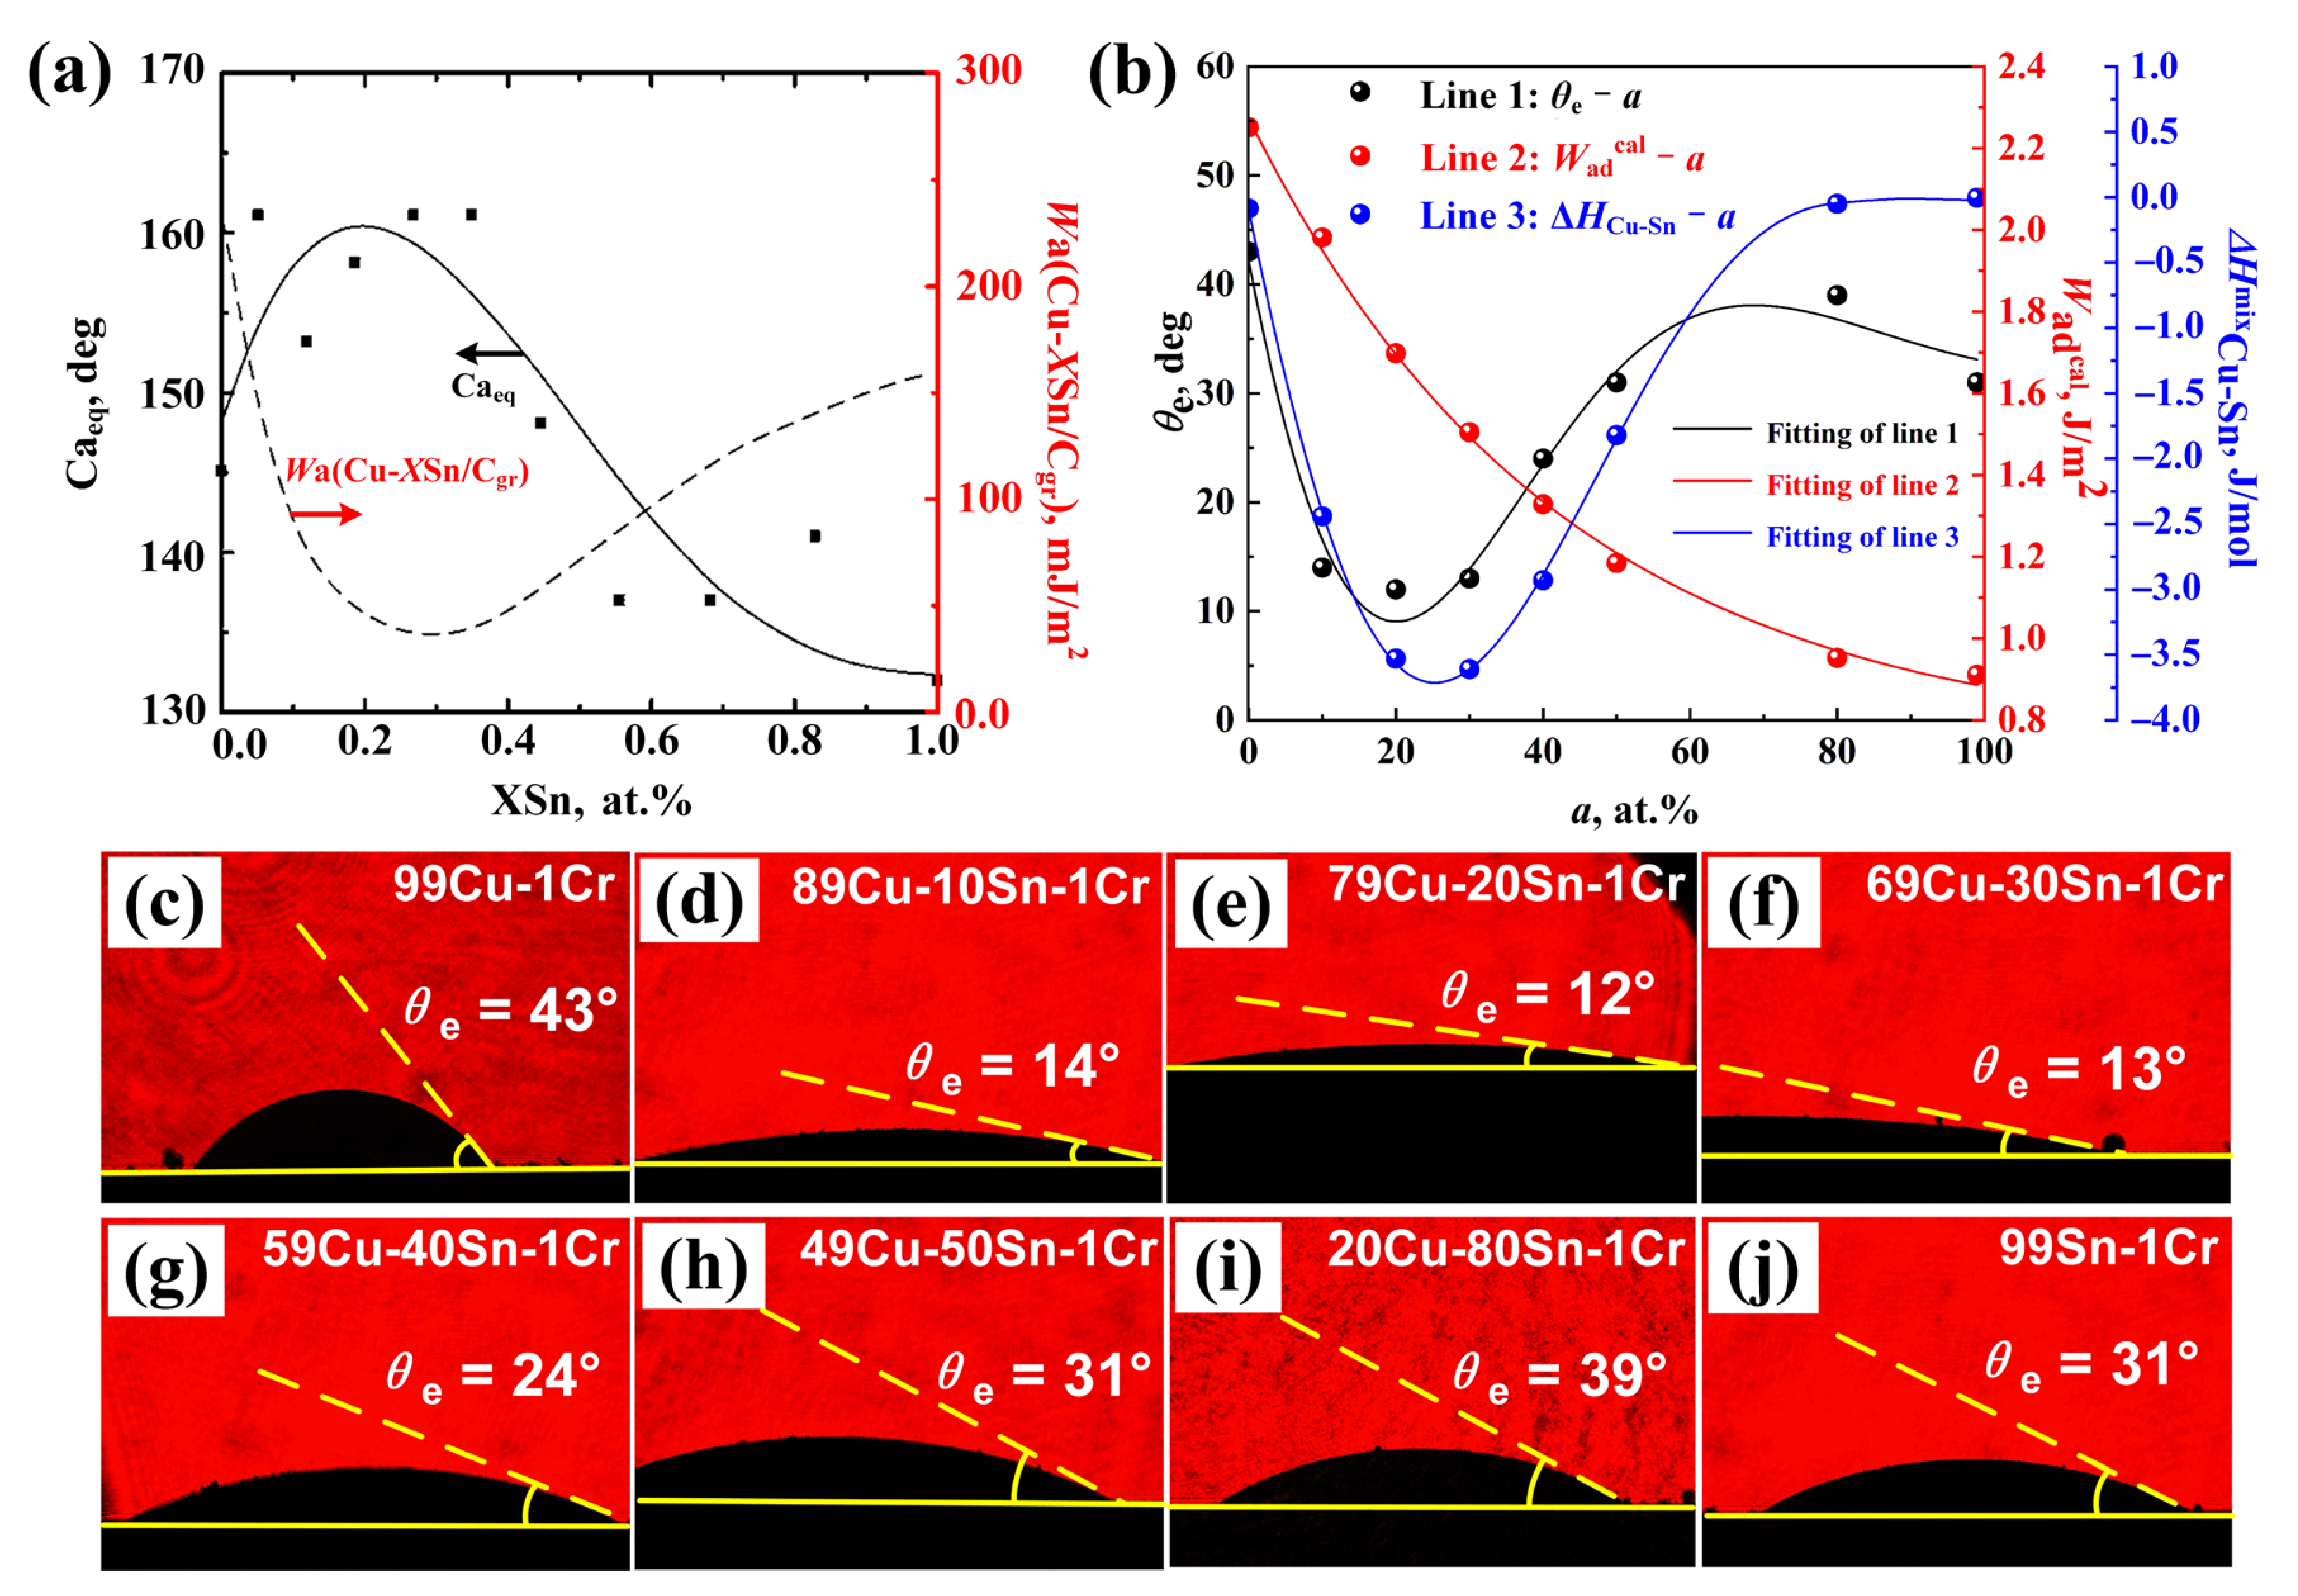
3.1. Wetting Experiment
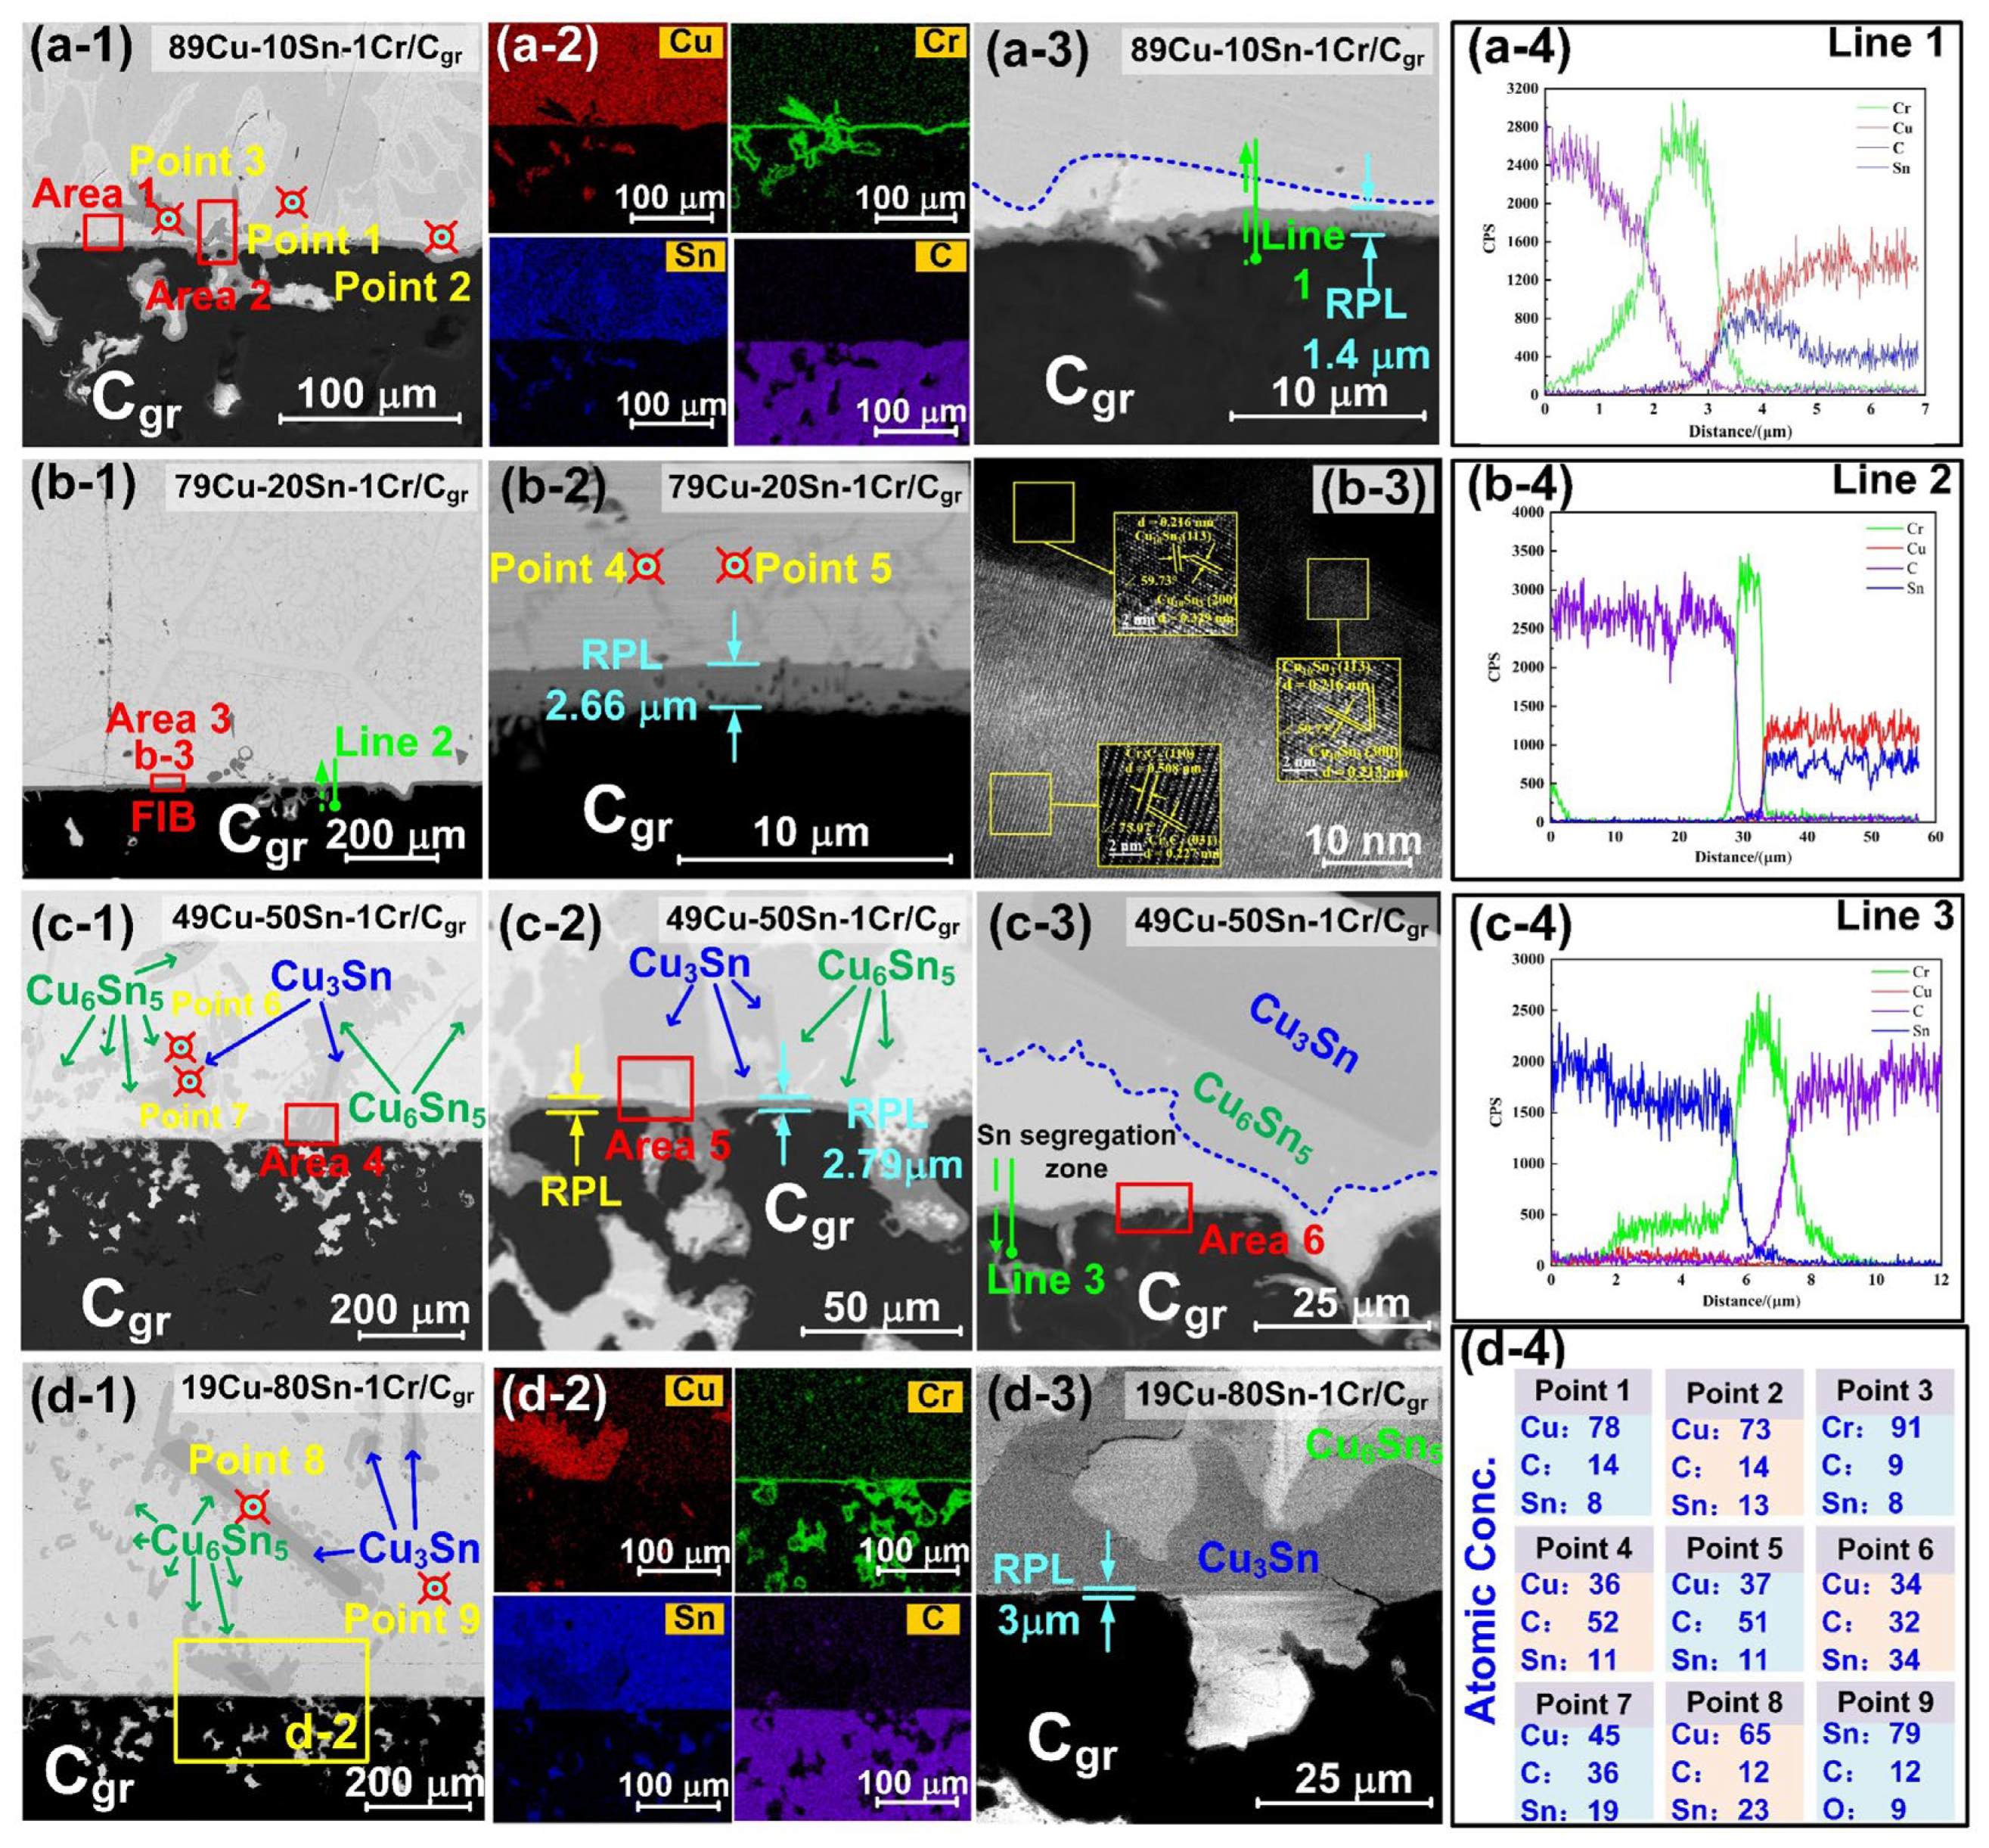
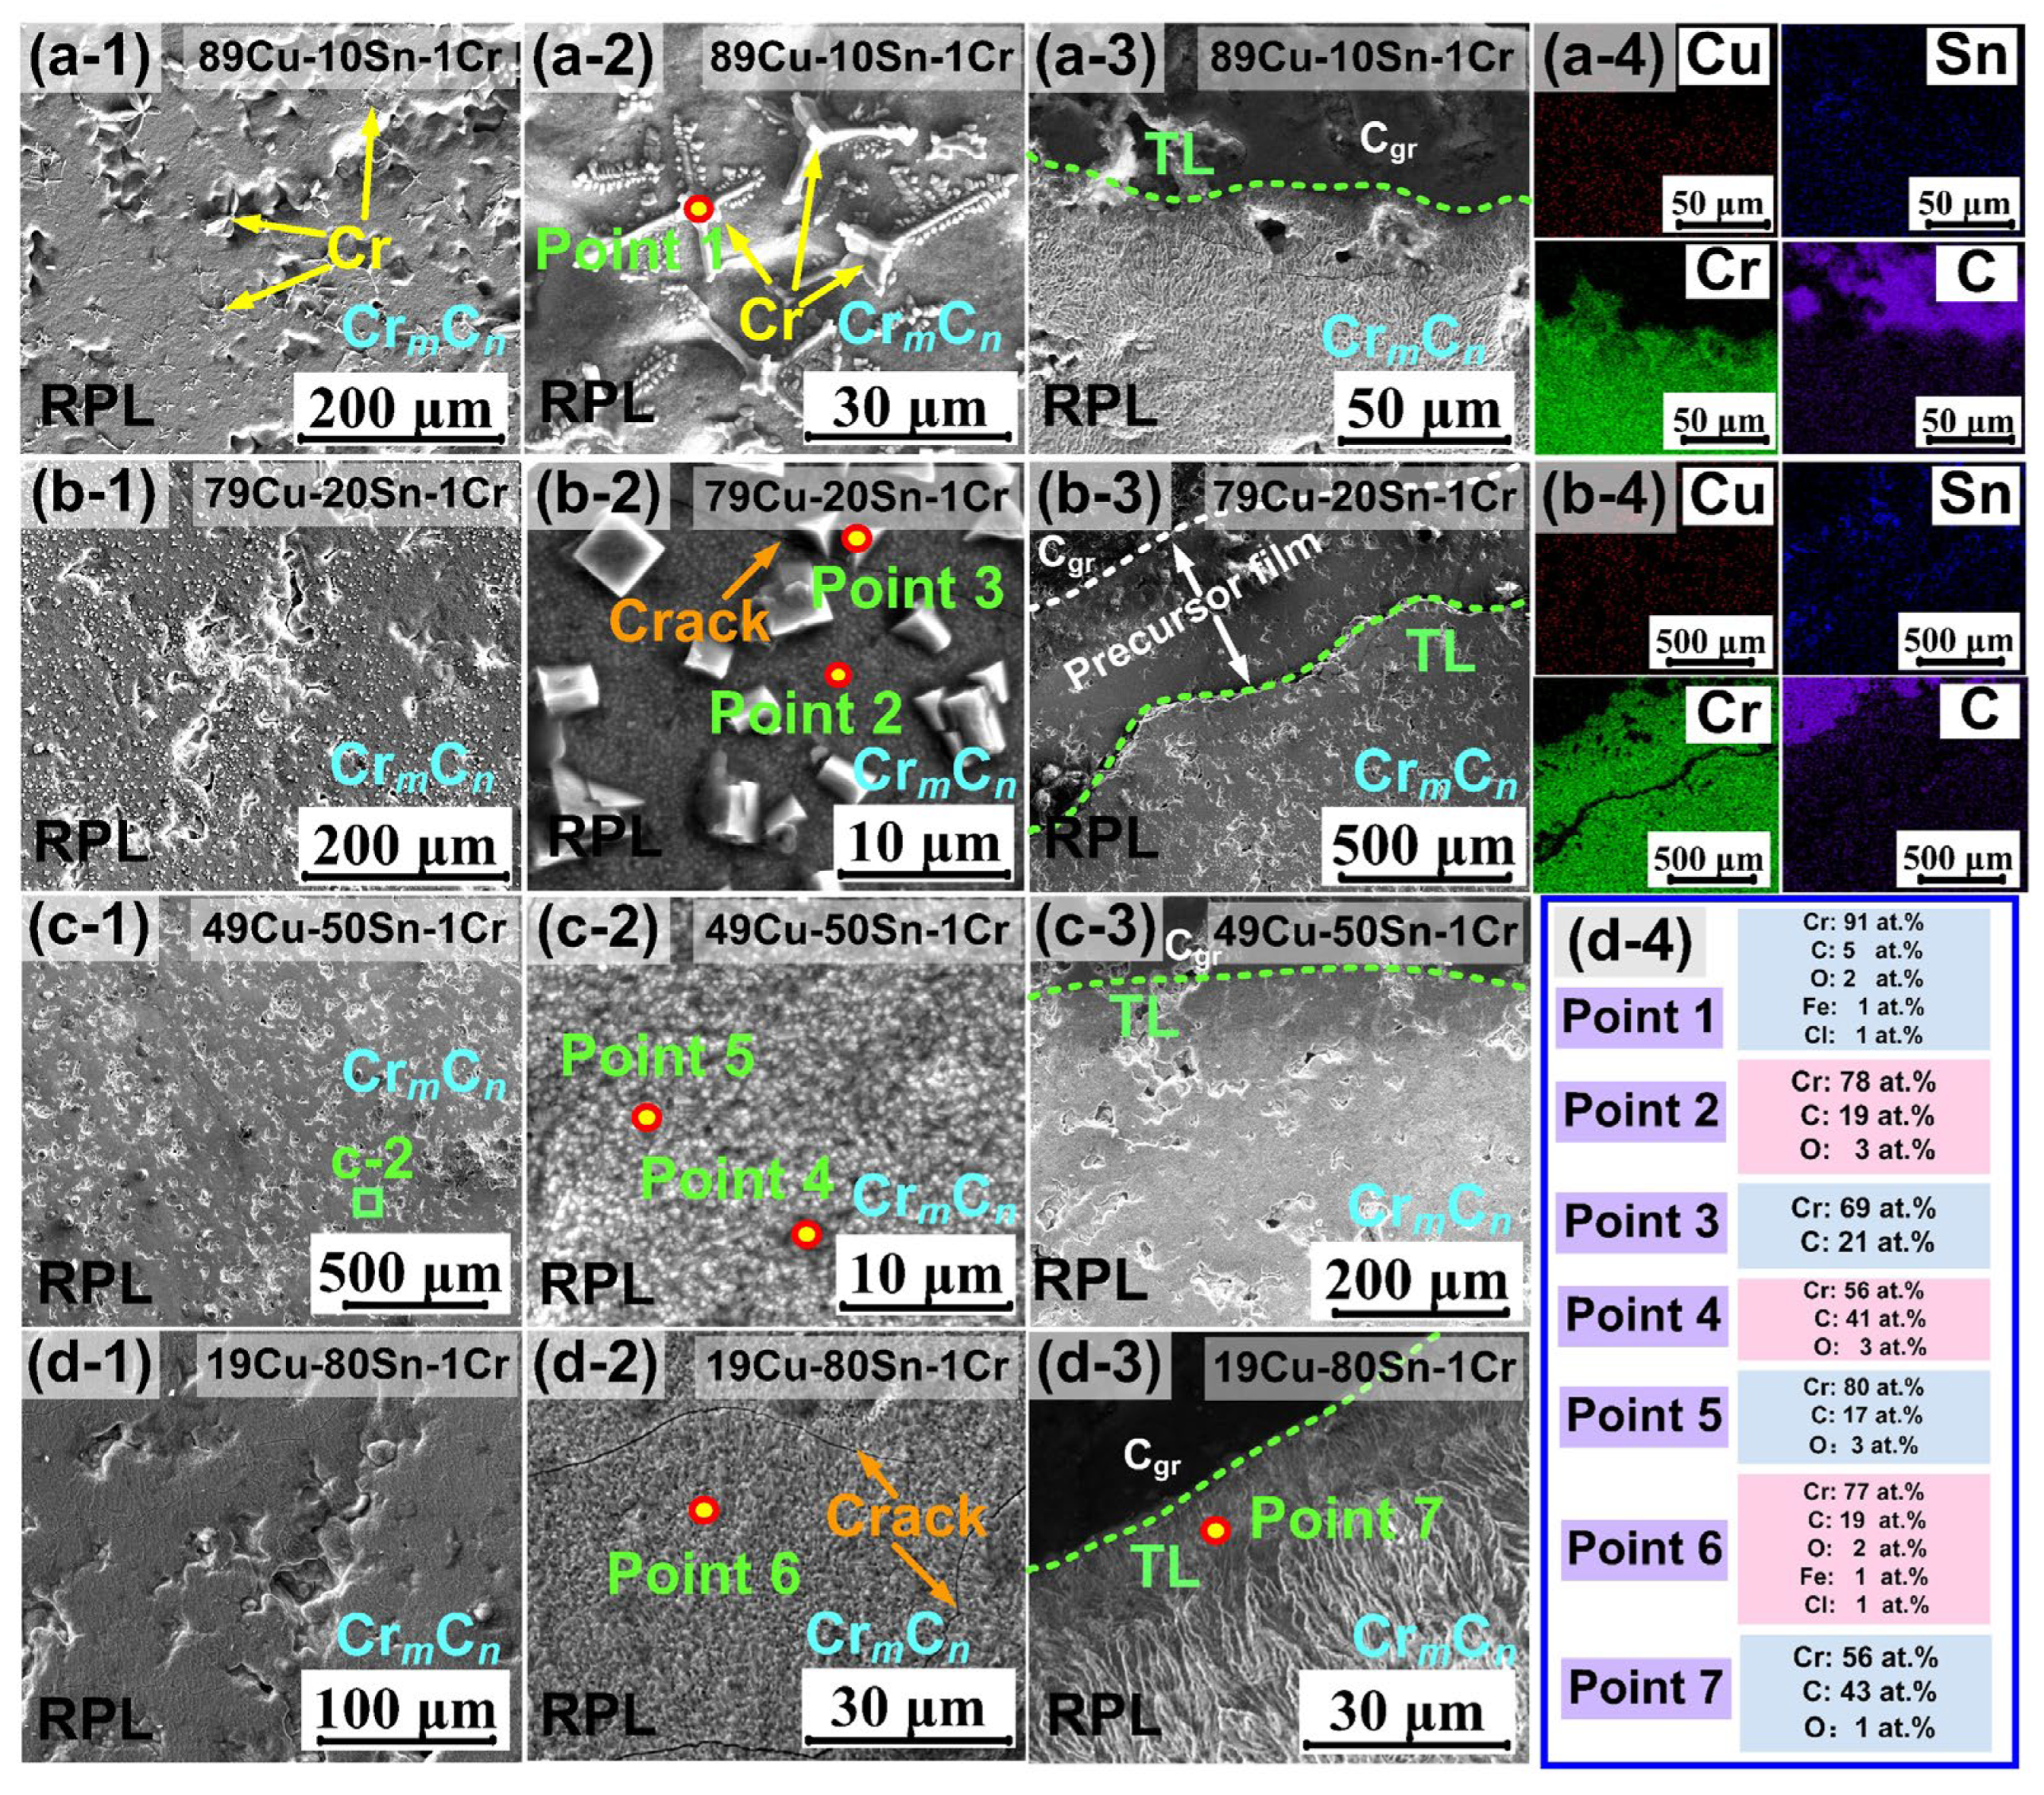
3.2. Interfacial Structure
4. Discussion
4.1. DFT Calculations
4.1.1. Surface Properties
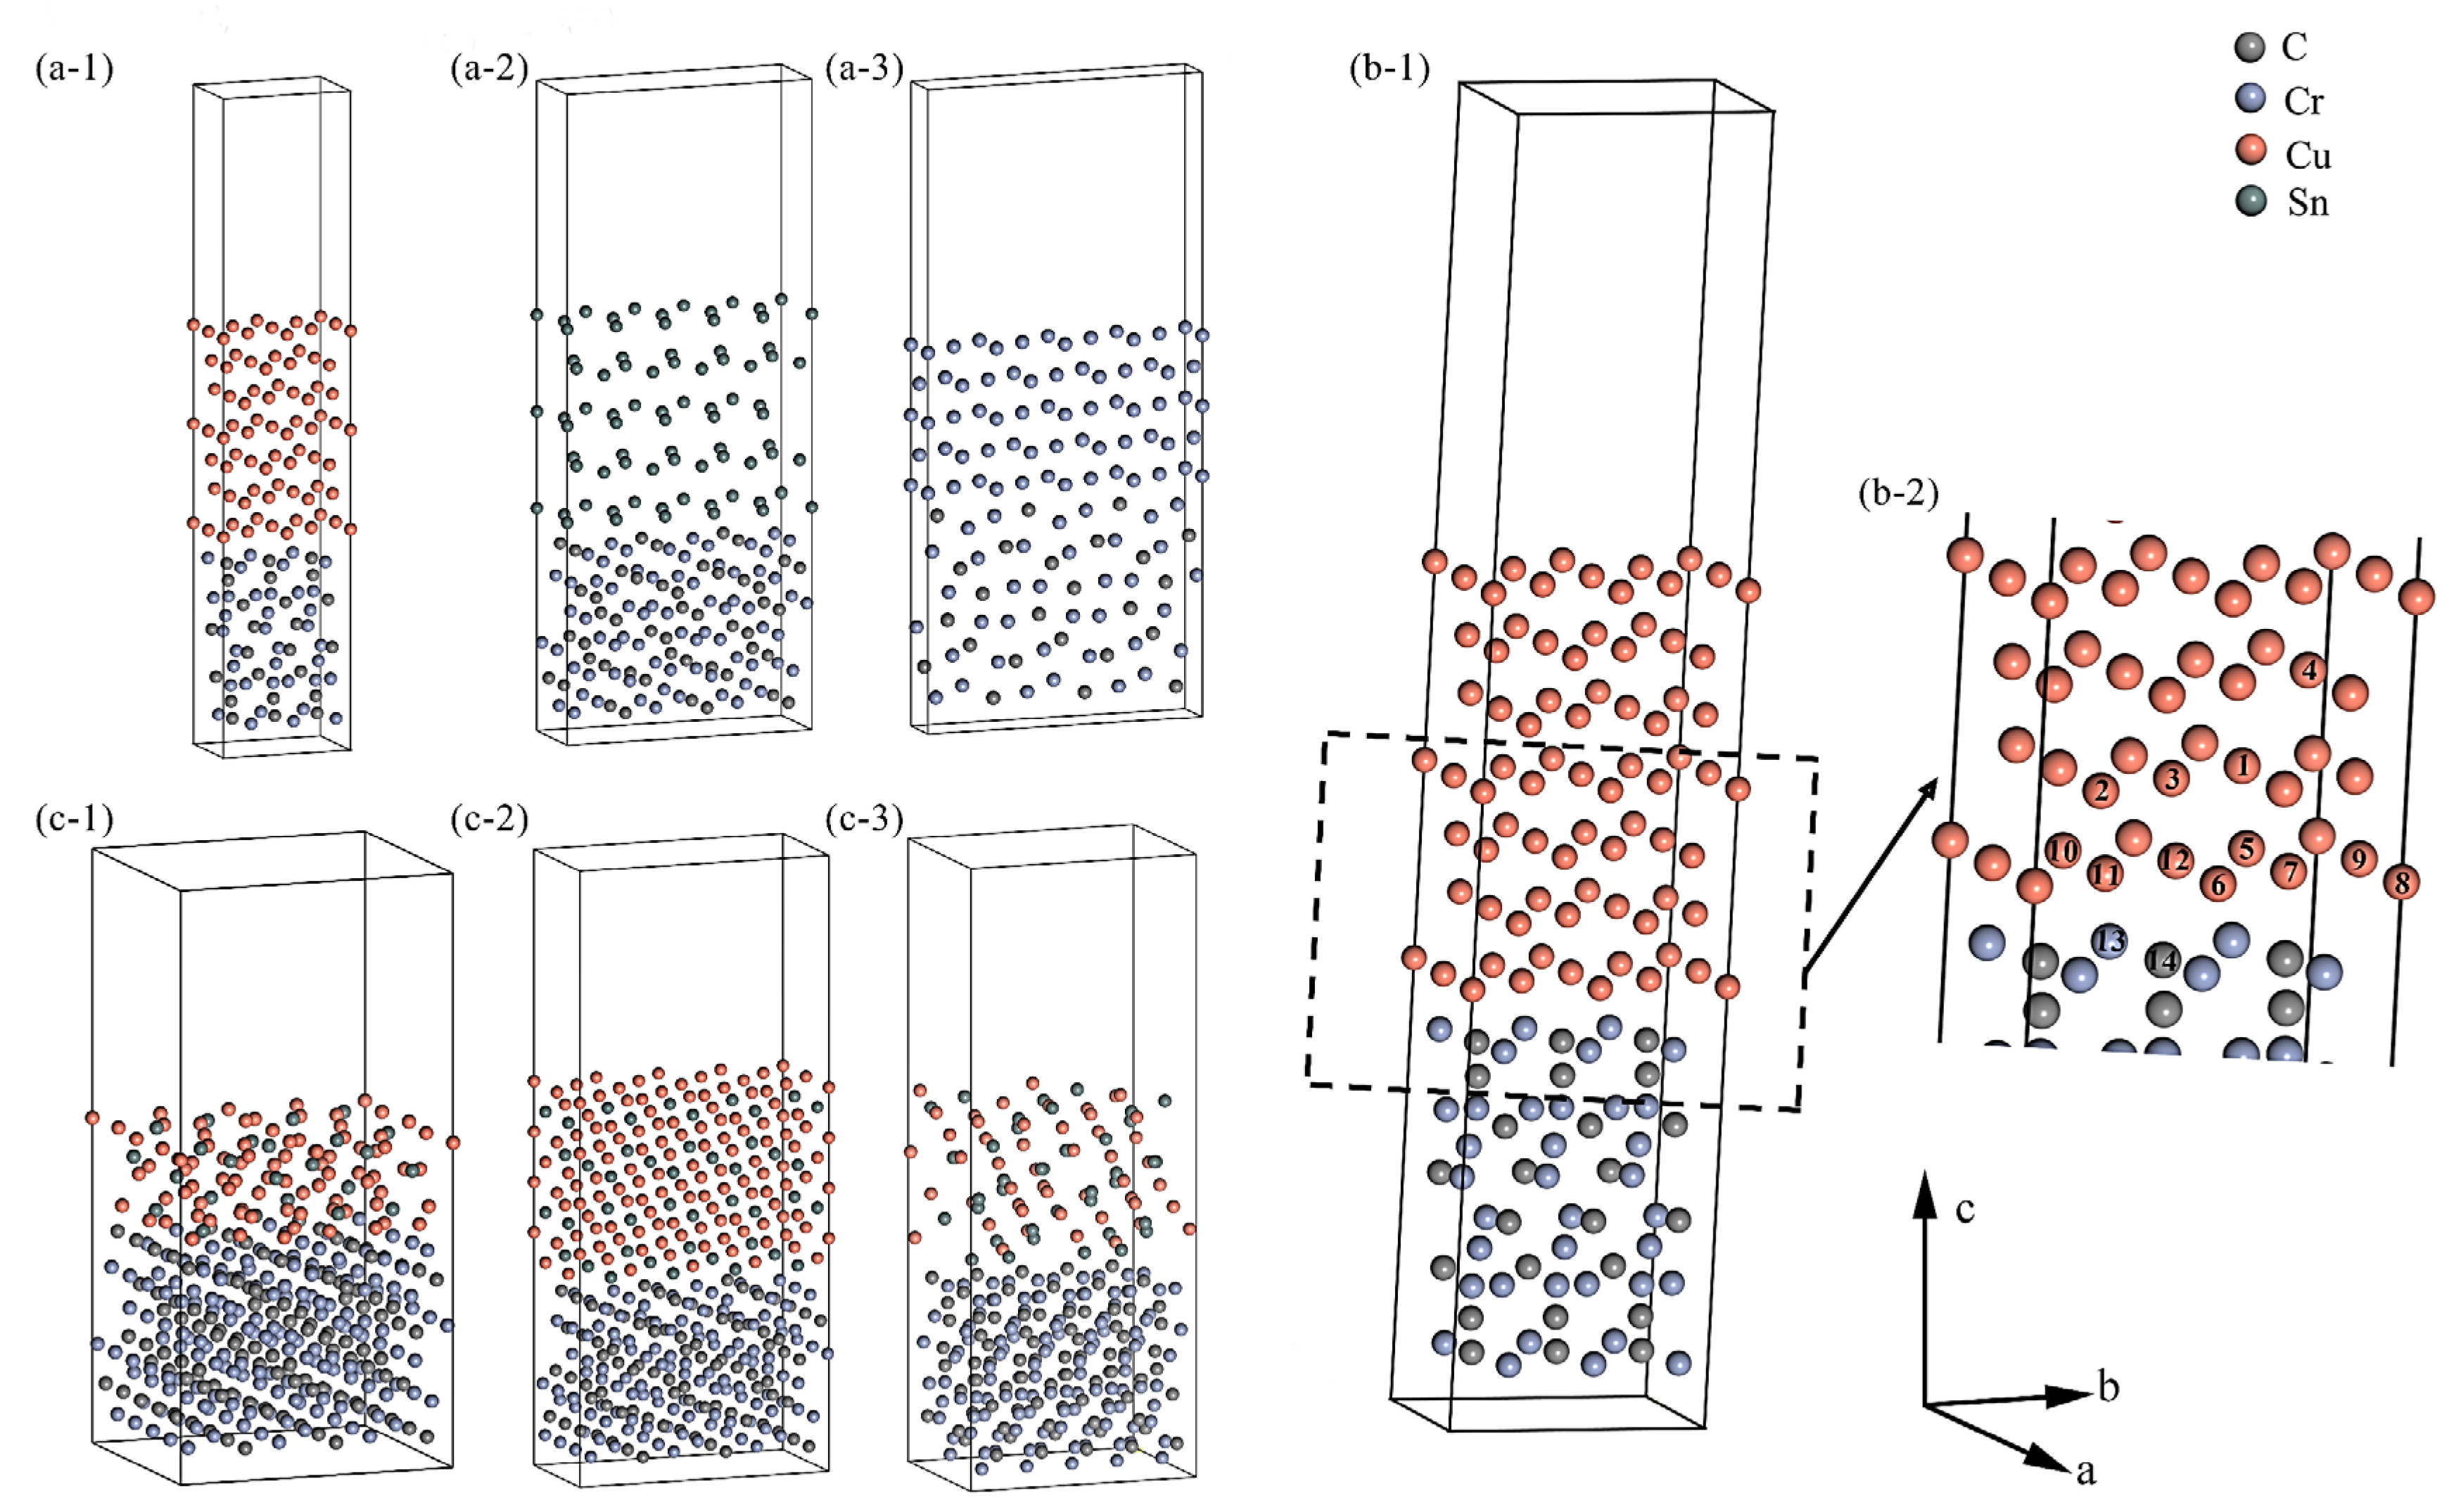
4.1.2. Interfacial Details
4.1.3. Interface Properties
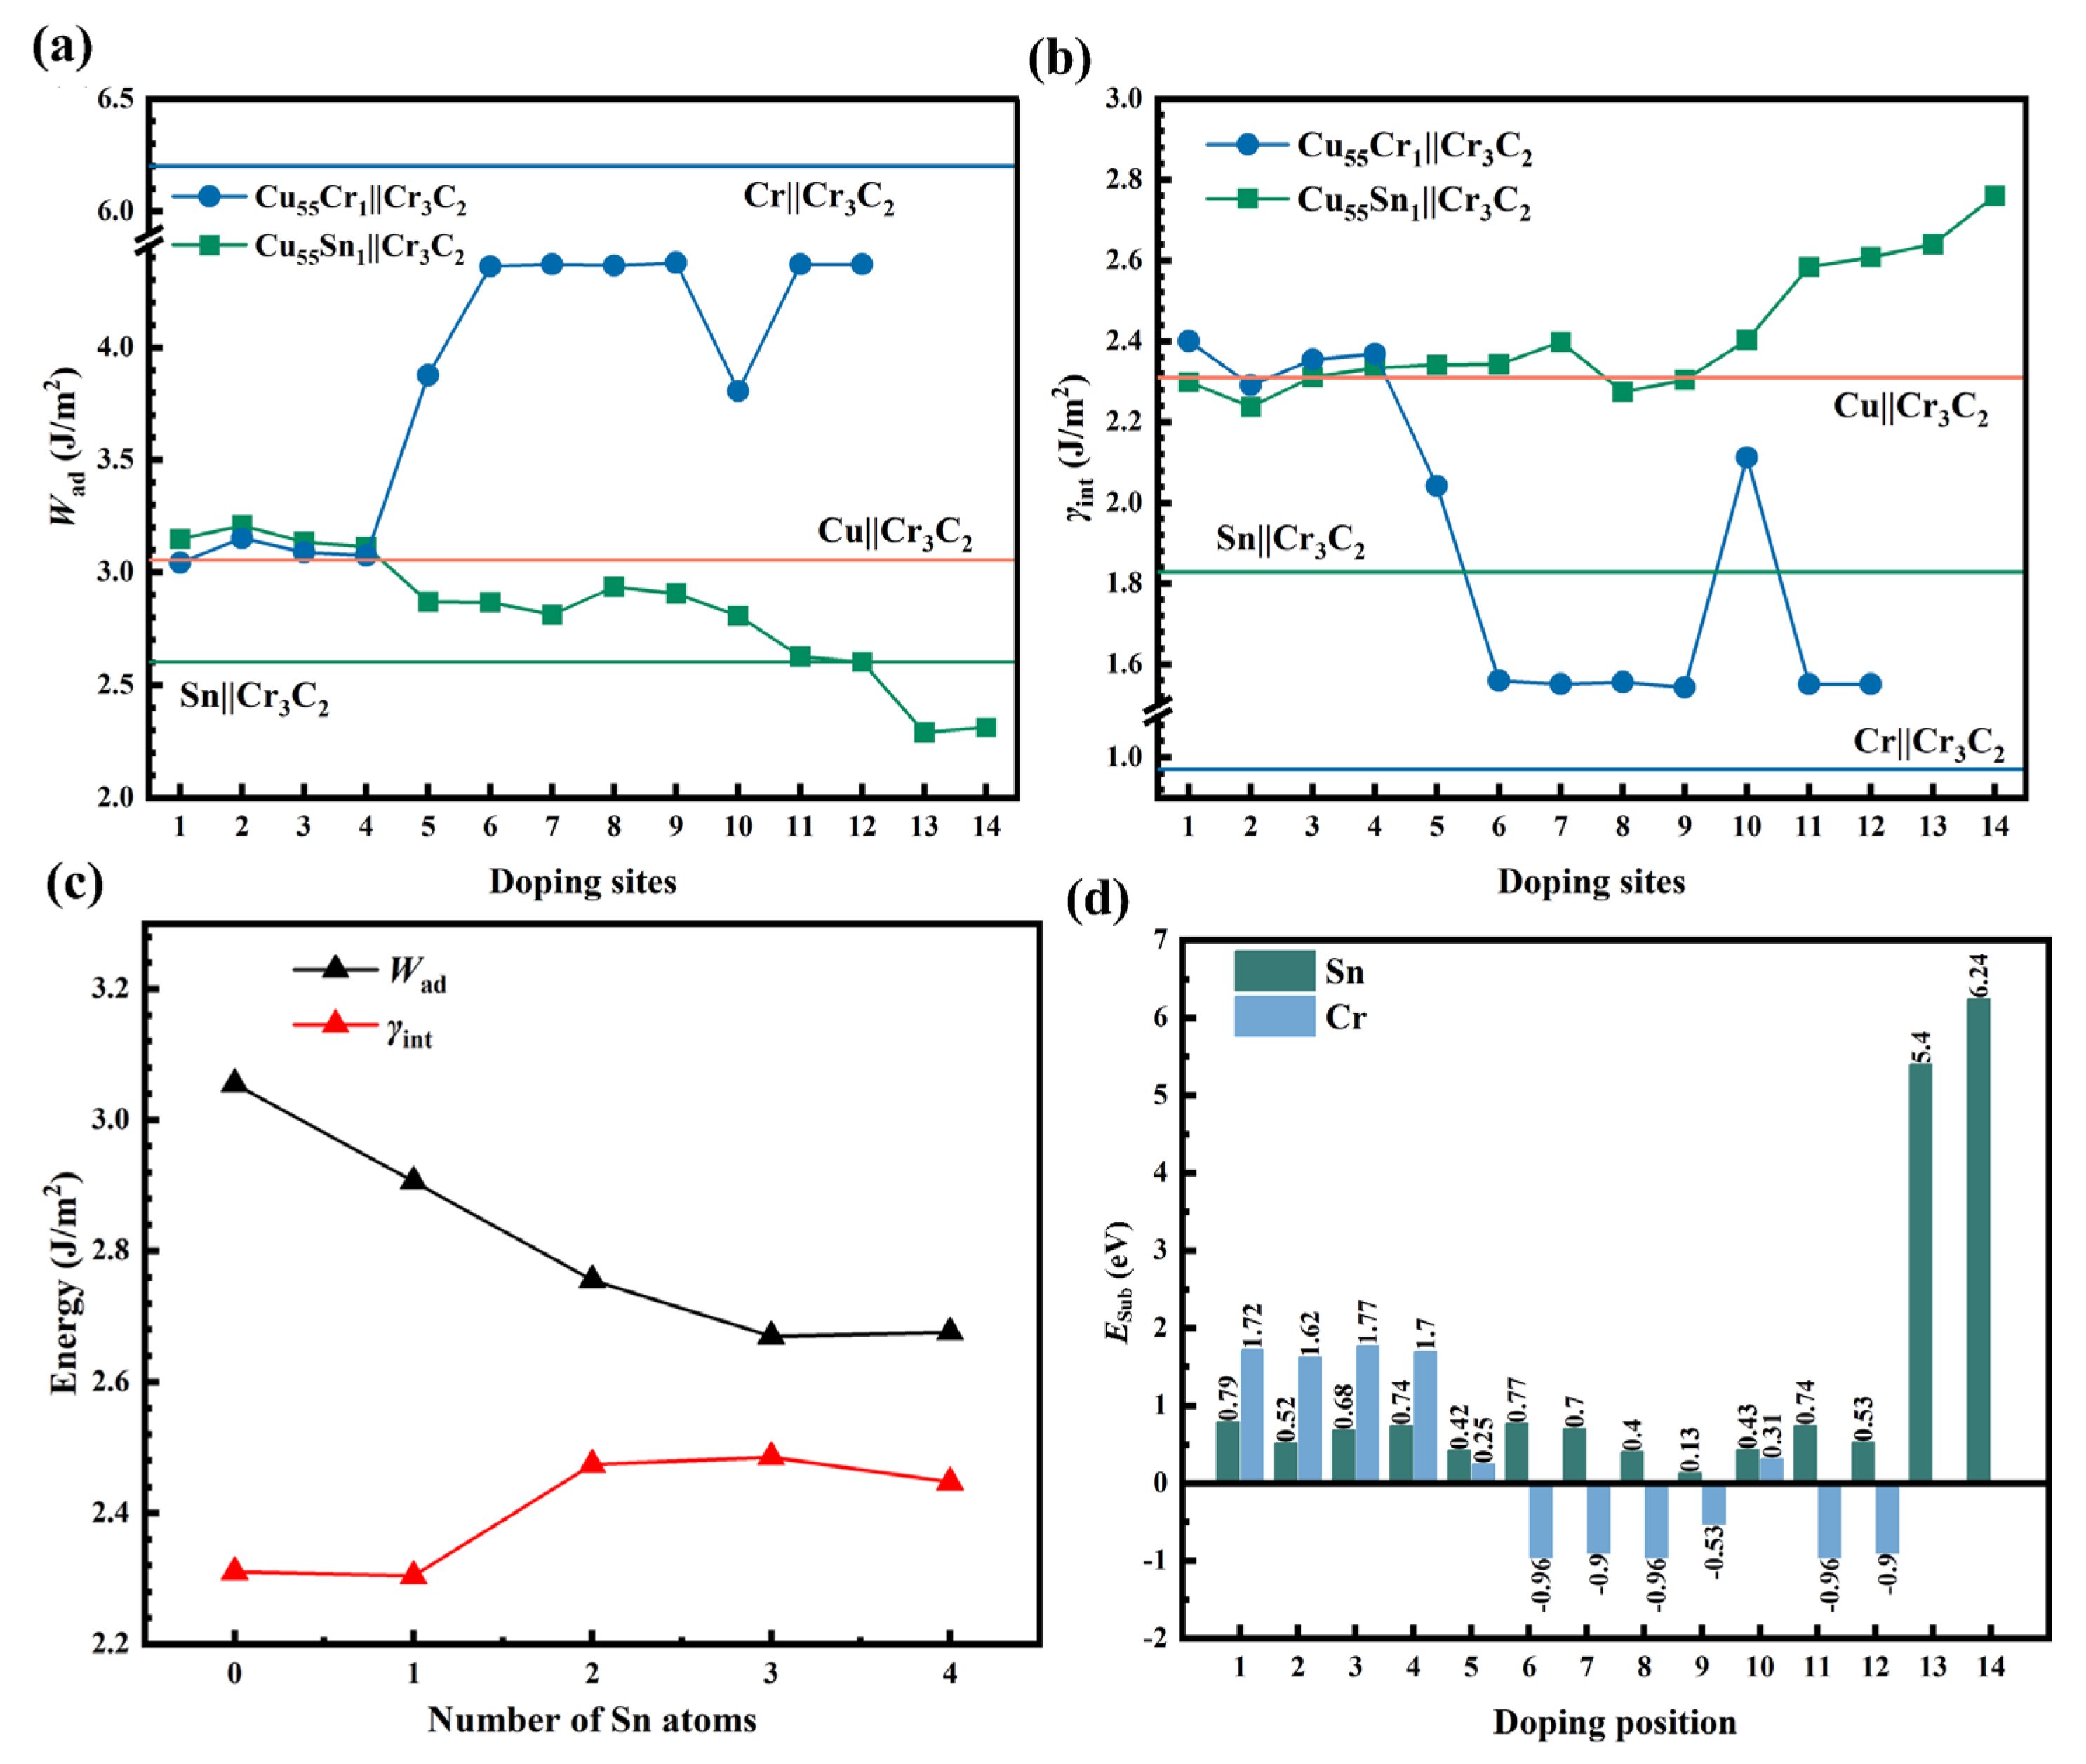
- (1)
- Single Sn/Cr atom and multiple Sn atoms doped Cu||Cr3C2 interface
- (2)
- CuxSny||Cr3C2 interface
- (3)
- Comparison of theoretical and calculated values
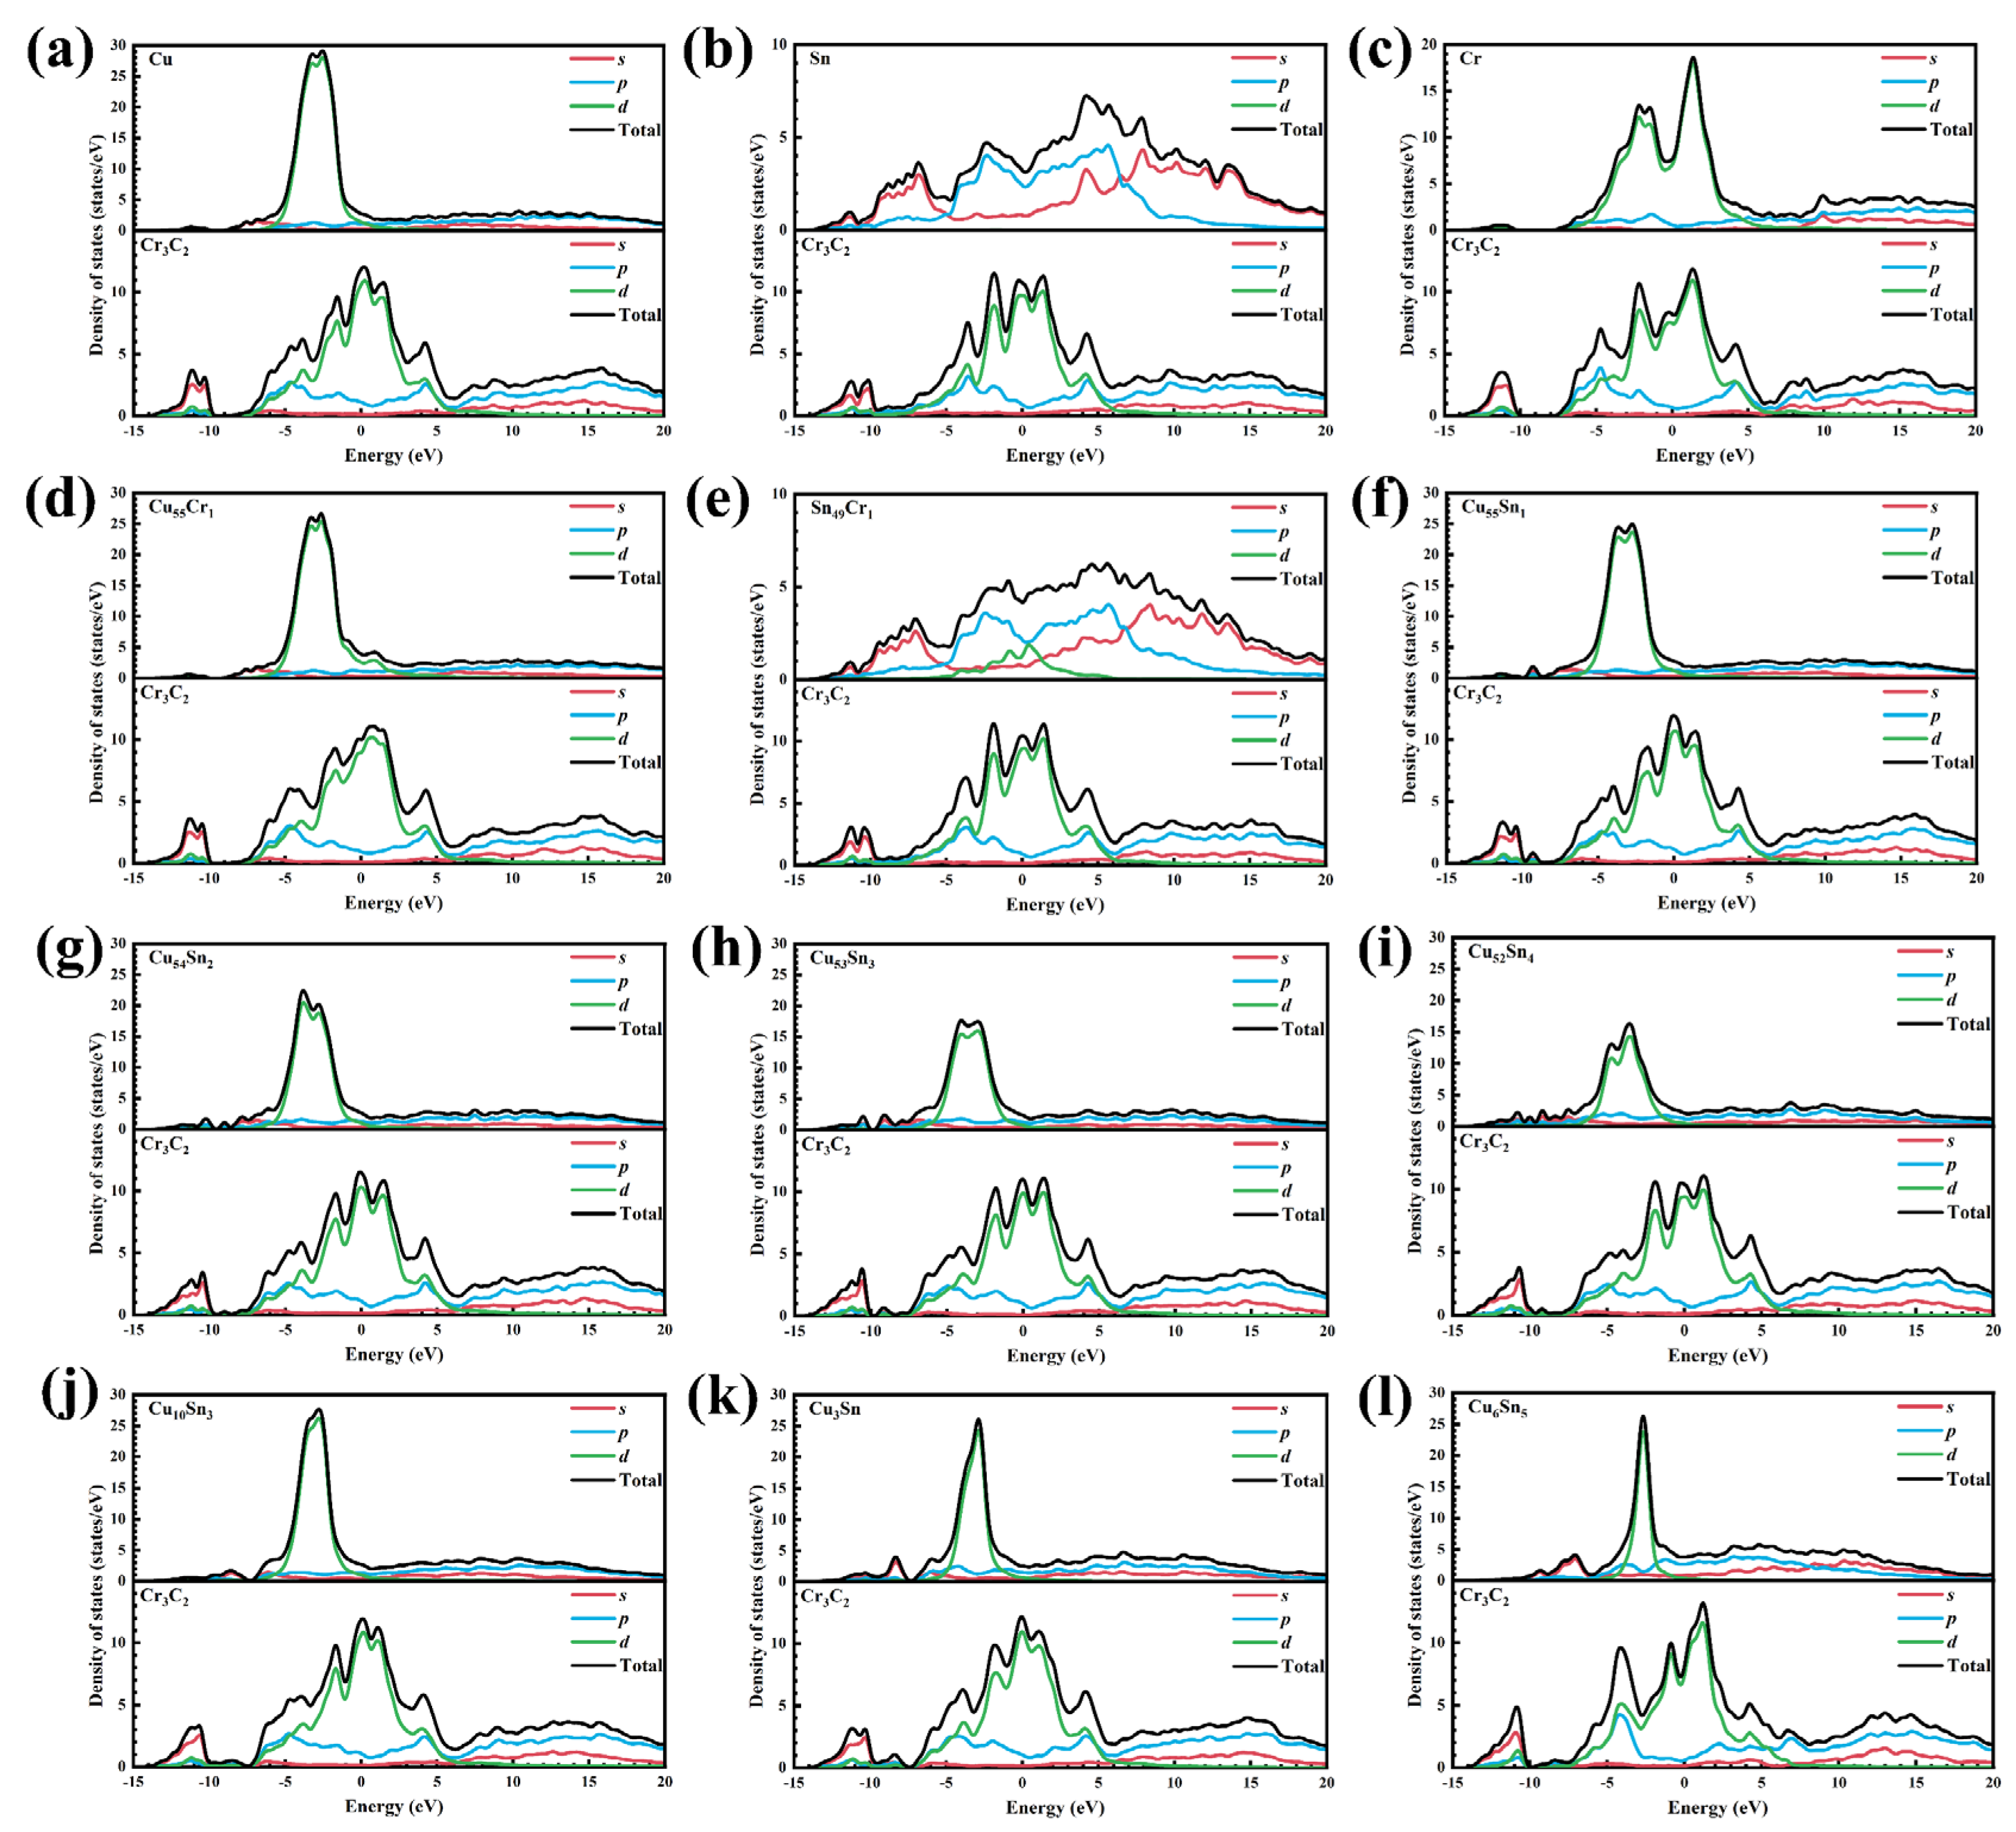
4.1.4. Interfacial Electronic Structure
- (1)
- Partial density of states
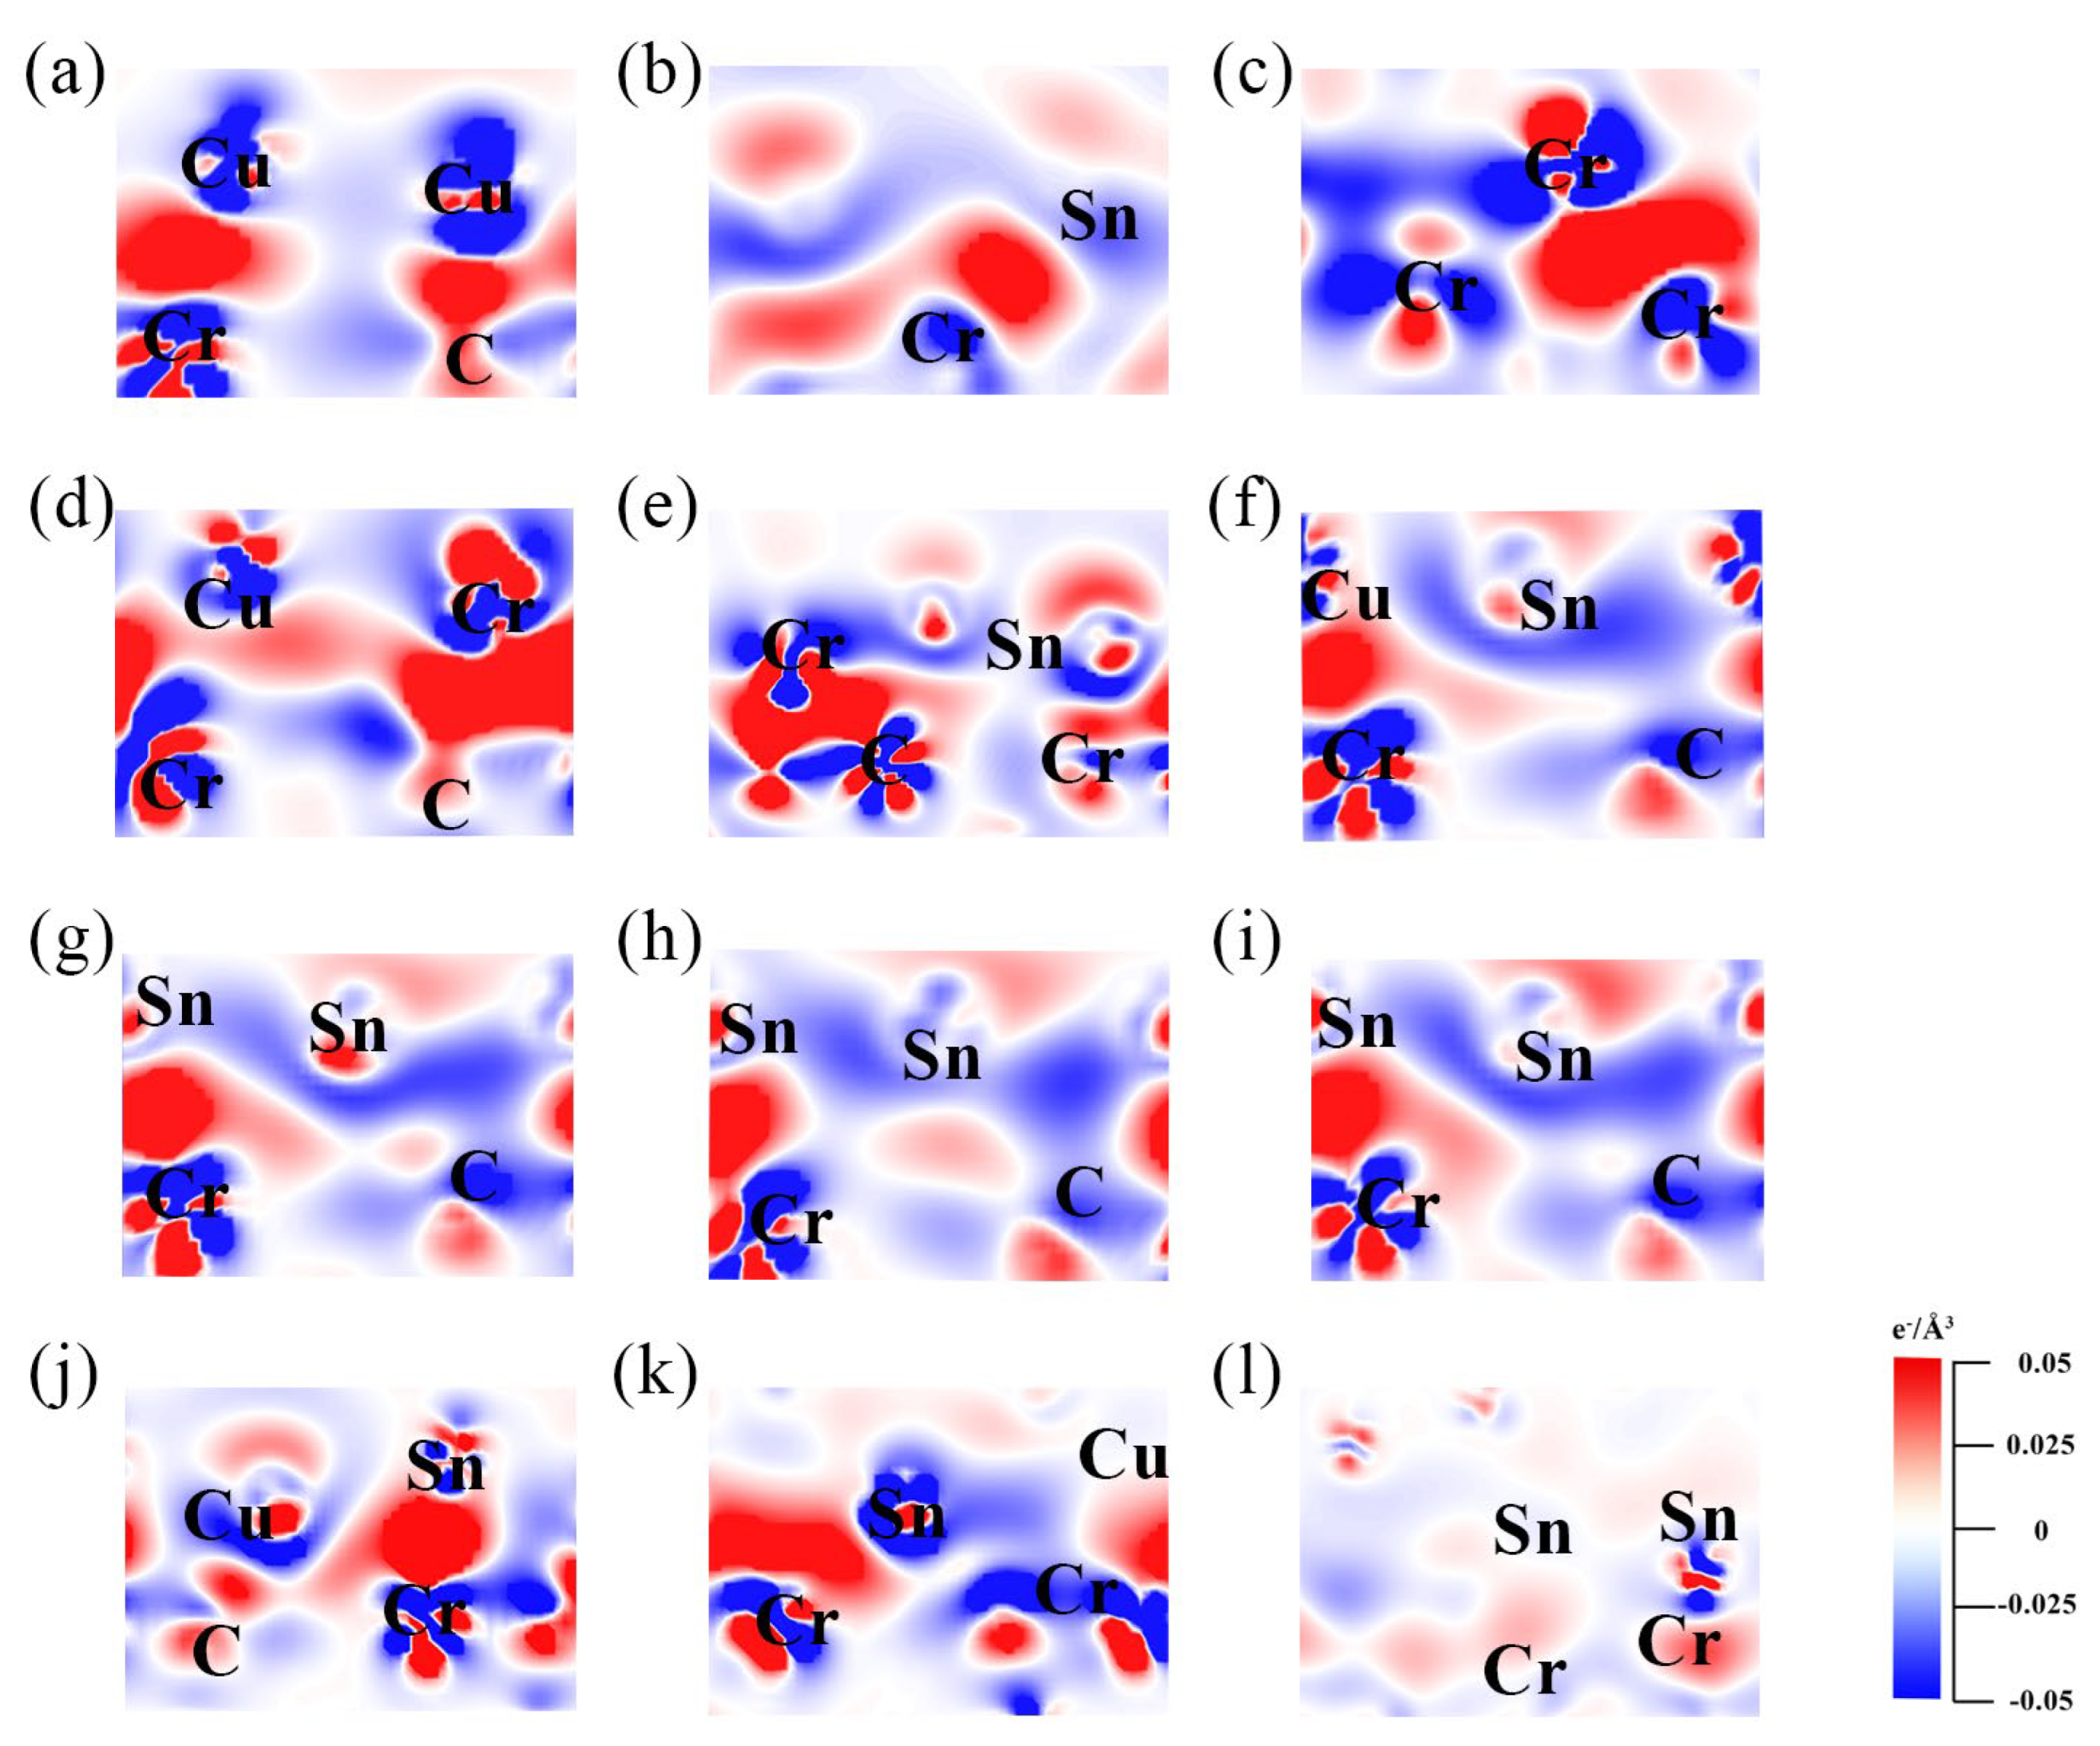
- (2)
- Charge density difference analysis
5. Conclusions
- (1)
- With the increase in Sn content, the σlv and of the alloy show a decreasing trend, and the RPL thickness increases. The overall interface presents a “sandwich” structure, consisting of the metal||CrmCn (Cr3C2 and Cr7C3) and CrmCn||Cgr interfaces. The influence of varying Sn content is primarily reflected in the metal||CrmCn interface. The phase composition and morphology of CrmCn change with the Sn content.
- (2)
- The various forms (Cu–Sn solid solutions, CuxSny compounds, and Sn/Cr element segregation) exist on the alloy side in contact with the CrmCn surface. The doping and segregation of Cr can significantly increase the Wad and stability of the metal||Cr3C2 interface. The effect of Sn is opposite to that of Cr and becomes more significant with the increase in Sn content. This is primarily because the metallic bond formed by Sn–p and Cr–d is weaker than the d–d metallic bonds (Cu–d and Cr–d, Cr–d and Cr–d). Sn increases the dissipation (or accumulation) of the interface’s CDD. The increase in Sn content reduces the number of d orbital electrons in the metal portion, leading to a decrease in the PDOS of electronics below the EF.
- (3)
- The σmetal of the Cu–Sn alloy obtained from theoretical calculations is in good agreement with the σlv reported in the literature. The trend in the theoretical calculation of Wad agrees with that of calculated in the experiment.
- (4)
- The systematic experiments and simplified interfacial models based on the first-principles DFT calculations help elucidate the interaction among alloying elements and the effects of Sn content changes; reveal how typical interfacial configurations affect wettability, adhesion, and stability; and reduce the need for extensive experimental screening to avoid the influence of complex experimental conditions. This combined approach provides useful insights for designing interfaces in metal/carbon composites. In future work, advanced characterization techniques coupled with multiscale and dynamic interface simulations can be employed to refine the understanding of atomic-scale wetting behavior.
Supplementary Materials
Author Contributions
Funding
Institutional Review Board Statement
Informed Consent Statement
Data Availability Statement
Conflicts of Interest
References
- Inagaki, M.; Kang, F. Carbon Materials Science and Engineering; Tsinghua University Press: Beijing, China, 2006. [Google Scholar]
- Hong, Q.; Li, M.; Wei, J.; Song, H.; Xue, F.; Sun, M. New carbon–copper composite material applied in rail-type launching system. IEEE Trans. Magn. 2007, 43, 137–140. [Google Scholar] [CrossRef]
- Sohn, Y.; Han, T.; Han, J.H. Effects of shape and alignment of reinforcing graphite phases on the thermal conductivity and the coefficient of thermal expansion of graphite/copper composites. Carbon 2019, 149, 152–164. [Google Scholar] [CrossRef]
- Silvain, J.F.; Heintz, J.M.; Veillere, A.; Constantin, L.; Lu, Y.F. A review of processing of Cu/C base plate composites for interfacial control and improved properties. Int. J. Extrem. Manuf. 2020, 2, 012002. [Google Scholar] [CrossRef]
- Karthik, J.M.; Abhinav, K.V. Shankar, Morphological and mechanical behavior of Cu–Sn alloys—A review. Met. Mater. Int. 2021, 27, 1915–1946. [Google Scholar] [CrossRef]
- Li, H.; Li, K.; Fan, Y.; Liu, C.; Wang, C. Influence of brazing temperature on interfacial reaction layer characteristics of Cu–Sn–Ti/diamond composites. Diam. Relat. Mater. 2022, 128, 109276. [Google Scholar] [CrossRef]
- Dong, R.; Cui, Z.; Zhu, S.; Xu, X.; Yang, X. Preparation, characterization and mechanical properties of Cu–Sn alloy/graphite composites. Metall. Mater. Trans. A 2014, 45, 5194–5200. [Google Scholar] [CrossRef]
- Naidich, Y.; Zhuravlev, V.; Gab, I.; Kostyuk, B.; Krasovskyy, V.; Adamovskyy, A.; Taranets, N. Liquid metal wettability, and advanced ceramic brazing. J. Eur. Ceram. Soc. 2008, 28, 717–728. [Google Scholar] [CrossRef]
- Asnavandi, M.; Ghorbani, M.; Kahram, M. Production of Cu–Sn–graphite–SiC composite coatings by electrodeposition. Surf. Coat. Technol. 2013, 216, 207–214. [Google Scholar] [CrossRef]
- Yu, J.; Huang, L.; Wang, J.; Hu, Z.; Hai, Y. Effects of Cu, Cu3Sn, Cu6Sn5 on interfacial properties between Cu–Sn alloys and diamond. Phys. Status Solidi (RRL) Rapid Res. Lett. 2022, 16, 2200013. [Google Scholar] [CrossRef]
- Naidich, J.V. The wettability of solids by liquid metals. Prog. Surf. Membr. Sci. 1981, 14, 353–484. [Google Scholar] [CrossRef]
- Deng, S. Interfacial Phenomena in Carbon-Copper Alloy System and Preparation of Carbon Fiber Fabric Reinforced Cu Matrix Composites. Ph.D. Thesis, Taiyuan University of Technology, Taiyuan, China, 2016. (In Chinese) [Google Scholar] [CrossRef]
- Sobczak, N.; Sobczak, J.; Rohatgi, P.; Ksiazek, M.; Radziwill, W.; Morgiel, J. Interaction between Ti or Cr containing copper alloys and porous graphite substrate. In Proceedings of the 2nd International Conference High Temperature Capillarity, Cracow, Poland, 29 June–2 July 1997; pp. 145–152. [Google Scholar]
- Lin, Q.; Yang, F.; Yang, H.; Sui, R.; Shi, Y.; Wang, J. Wetting of graphite by molten Cu–xSn–yCr ternary alloys at 1373 K. Carbon 2020, 159, 561–569. [Google Scholar] [CrossRef]
- Hsieh, Y.-C.; Lin, S.-T. Microstructural development of Cu–Sn–Ti alloys on graphite. J. Alloys Compd. 2008, 466, 126–132. [Google Scholar] [CrossRef]
- Dong, E. A-First-Principles Study of Matal-Ceramic Interfacial Bonding. Master’s Thesis, Jilin University, Changchun, China, 2013. (In Chinese). [Google Scholar]
- David, S.; Sholl, A.; Steckel, S. Density Functional Theory: A Practical Introduction; John Wiley & Sons: Hoboken, NJ, USA, 2009. [Google Scholar]
- Hashibon, A.; Elsässer, C.; Mishin, Y.; Gumbsch, P. First-principles study of thermodynamical and mechanical stabilities of thin copper film on tantalum. Phys. Rev. B 2007, 76, 245434. [Google Scholar] [CrossRef]
- Wang, Z.; Liu, S.; Qiu, Z.; Sun, H.; Liu, W. First-principles calculations on the interface of the Al/TiC aluminum matrix composites. Appl. Surf. Sci. 2020, 505, 144502. [Google Scholar] [CrossRef]
- Christensen, M.; Dudiy, S.; Wahnström, G. First-principles simulations of metal-ceramic interface adhesion: Co/WC versus Co/TiC. Phys. Rev. B 2002, 65, 045408. [Google Scholar] [CrossRef]
- Dudiy, S.V.; Lundqvist, B.I. Wetting of TiC and TiN by metals. Phys. Rev. B 2004, 69, 125421. [Google Scholar] [CrossRef]
- Lin, Q.; Shen, P.; Yang, L.; Jin, S.; Jiang, Q. Wetting of TiC by molten Al at 1123–1323K. Acta. Mater. 2011, 59, 1898–1911. [Google Scholar] [CrossRef]
- Clark, S.J.; Segall, M.D.; Pickard, C.J.; Hasnip, P.J.; Probert, M.I.J.; Refson, K.; Payne, M.C. First principles methods using CASTEP. Z. Kristallogr. Cryst. Mater. 2005, 220, 567–570. [Google Scholar] [CrossRef]
- Perdew, J.P.; Burke, K.; Ernzerhof, M. Generalized gradient approximation made simple. Phys. Rev. Lett. 1996, 77, 3865–3868. [Google Scholar] [CrossRef]
- Head, J.D.; Zerner, M.C. A Broyden–Fletcher–Goldfarb–Shanno optimization procedure for molecular geometries. Chem. Phys. Lett. 1985, 122, 264–270. [Google Scholar] [CrossRef]
- Eustathopoulos, N.; Nicholas, M.G.; Drevet, B. Wettability at High Temperatures; Elsevier Science: Kidlington, UK, 1999. [Google Scholar]
- Davies, J.T.; Rideal, E.K. Interfacial Phenomena, 2nd ed.; Academic Press: New York, NY, USA, 1963. [Google Scholar]
- Schrader, M.E. Young-Dupre revisited. Langmuir 1995, 11, 3585–3589. [Google Scholar] [CrossRef]
- Zhang, C.; Fan, T.; Cao, W.; Zhang, D. A model for work of solid–liquid adhesion in multicomponent melts. Acta. Mater. 2009, 57, 3623–3632. [Google Scholar] [CrossRef]
- Gasior, W.; Moser, Z.; Adam, D.; Janusz, P. SURDAT–Database of lead-free soldering materials. J. Min. Metall. Sect. B Metall. 2007, 43, 125–130. [Google Scholar]
- Zhao, Y.; Hou, X. A direct correlation between viscosity and liquid structure in Cu–Sn alloys. Adv. Condens. Matter Phys. 2017, 1, 7536853. [Google Scholar] [CrossRef]
- Hultgren, R.R.; Desai, P.D.; Hawkins, D.T.; Gleiser, M.; Kelley, K.K. Selected Values of The Thermodynamic Properties of Binary Alloys; American Society for Metals: Detroit, MI, USA, 1973; p. 795. Available online: https://cir.nii.ac.jp/crid/1130282270182197376 (accessed on 1 January 2025).
- Li, J. Adhesion between nonreactive liquid metals and transition metal carbides. Rare Met. 1992, 11, 177–184. [Google Scholar]
- Doi, T. Studies on Cu alloys containing Cr (lst Report). On the Cu side phase diagram. J. Jpn. Inst. Met. 1957, 21, 337–340. [Google Scholar] [CrossRef]
- Venkatraman, M.; Neumann, J.P. The Cr−Sn (Chromium–Tin) system. J. Phase Equilibria 1988, 9, 159–162. [Google Scholar] [CrossRef]
- Ci, W.; Shi, Y.; Lin, Q.; Gu, Y.; Li, G. Effects of temperature on reaction path, spreading and wetting mechanism of Cu–20Sn–2Cr/graphite. Ceram. Int. 2023, 49, 36907–36919. [Google Scholar] [CrossRef]
- Gu, K.; Pang, M.; Zhan, Y. Insight into interfacial structure and bonding nature of diamond(001)/Cr3C2(001) interface. J. Alloys Compd. 2019, 770, 82–89. [Google Scholar] [CrossRef]
- Fürtauer, S.; Li, D.; Cupid, D.; Flandorfer, H. Flandorfer, The Cu–Sn phase diagram, Part I: New experimental results. Intermetallics 2013, 34, 142–147. [Google Scholar] [CrossRef]
- Li, J.; Mannan, S.; Clode, M.; Whalley, D.; Hutt, D. Interfacial reactions between molten Sn–Bi–X solders and Cu substrates for liquid solder interconnects. Acta. Mater. 2006, 54, 2907–2922. [Google Scholar] [CrossRef]
- Mookam, N.; Kanlayasiri, K. Evolution of Intermetallic compounds between Sn-0.3Ag-0.7Cu low-silver lead-free solder and Cu substrate during thermal aging. J. Mater. Sci. Technol. 2012, 28, 53–59. [Google Scholar] [CrossRef]
- Li, Y.; Gao, Y.; Xiao, B.; Min, T.; Yang, Y.; Ma, S.; Yi, D. The electronic, mechanical properties and theoretical hardness of chromium carbides by first-principles calculations. J. Alloys Compd. 2011, 509, 5242–5249. [Google Scholar] [CrossRef]
- Jiang, C. First-principles study of structural, elastic, and electronic properties of chromium carbides. Appl. Phys. Lett. 2008, 92, 041909. [Google Scholar] [CrossRef]
- Ellner, M.; Kolatschek, K.; Predel, B. On the partial atomic volume and the partial molar enthalpy of aluminum in some phases with Cu and Cu3Au structures. J. Less-Common Met. 1991, 170, 171–184. [Google Scholar] [CrossRef]
- Tu, K.N. Cu/Sn interfacial reactions: Thin-film case versus bulk case. Mater. Chem. Phys. 1996, 46, 217–223. [Google Scholar] [CrossRef]
- Bolef, D.I.; de Klerk, J. Anomalies in the elastic constants and thermal expansion of chromium single crystals. Phys. Rev. 1963, 129, 1063–1067. [Google Scholar] [CrossRef]
- Larsson, A.-K.; Stenberg, L.; Lidin, S. The superstructure of domain-twinned η’–Cu6Sn5. Acta Crystallogr. Sect. B Struct. Sci. 1994, 50, 636–643. [Google Scholar] [CrossRef]
- Lei, C.; Xue, H.; Tang, F.; Luo, X. The effect of solute segregation on stability and strength of Cu symmetrical tilt grain boundaries from the first-principles study. J. Mater. Res. Technol. 2022, 21, 3274–3284. [Google Scholar] [CrossRef]
- Sellers, M.S.; Schultz, A.J.; Basaran, C.; Kofke, D.A. Atomistic modeling of β–Sn surface energies and adatom diffusivity. Appl. Surf. Sci. 2010, 256, 4402–4407. [Google Scholar] [CrossRef]
- Xue, H.; Lei, C.; Tang, F.; Li, X.; Luo, Y.; Ren, J.; Lu, X. Structure-composition-property correlations of symmetrical tilt grain boundaries in copper-based binary alloys. J. Phys. Chem. Solids 2021, 154, 110082. [Google Scholar] [CrossRef]
- Tran, R.; Xu, Z.; Radhakrishnan, B.; Winston, D.; Sun, W.; Persson, K.A.; Ong, S.P. Surface energies of elemental crystals. Sci. Data. 2016, 3, 160080. [Google Scholar] [CrossRef] [PubMed]
- Rapcewicz, K.; Chen, B.; Yakobson, B.; Bernholc, J. Consistent methodology for calculating surface and interface energies. Phys. Rev. B 1998, 57, 7281–7291. [Google Scholar] [CrossRef]
- Wu, Z.; Pang, M.; Zhan, Y.; Shu, S.; Xiong, L.; Li, Z. The bonding characteristics of the Cu(111)/WC(0001) interface: An insight from first-principle calculations. Vacuum 2021, 191, 110218. [Google Scholar] [CrossRef]
- Ma, Z.; Li, H.; Zhang, M.; Xu, Z. The first principles calculation of the interfacial properties of β–Sn and 4H–SiC. Ordnance. Mater. Sci. Eng. 2019, 42, 17–20. [Google Scholar] [CrossRef]
- Chen, Y.; Dai, W.; Liu, Y.; Chen, C.; Tu, K.; Chen, G. Surface protrusion induced by inter-diffusion on Cu–Sn micro-pillars. Mater. Des. 2022, 224, 111318. [Google Scholar] [CrossRef]
- Hu, J.; Jian, X.; Yang, T.; Peng, X. Investigation on the interface characteristic between WC(001) and diamond(111) by first-principles calculation. Diam. Relat. Mater. 2022, 123, 108864. [Google Scholar] [CrossRef]
- Wu, Y.; Zhang, W.; Guo, J.; Hou, J.; Li, X.; Huang, R.; Ma, X.; Zhang, Q. The first-principles study on the occupation behavior and the ductility mechanism of Zr in Ni–Ni3Al system with lattice misfit. J. Mater. Sci. Technol. 2014, 30, 517–522. [Google Scholar] [CrossRef]
- Huang, J.; Li, M.; Liu, Y.; Chen, J.; Lai, Z.; Hu, J.; Zhou, F.; Zhu, J. A first-principles study on the doping stability and micromechanical properties of alloying atoms in aluminum matrix. Vacuum 2023, 207, 111596. [Google Scholar] [CrossRef]
- Eustathopoulos, N. Dynamics of wetting in reactive metal/ceramic systems. Acta. Mater. 1998, 46, 2319–2327. [Google Scholar] [CrossRef]
- Morra, M.; Occhiello, E.; Garbassi, F. Knowledge about polymer surfaces from contact angle measurements. Adv. Colloid Interface Sci. 1990, 32, 79–116. [Google Scholar] [CrossRef]
- Materials Project: An Open Database of Materials Properties. Available online: https://next-gen.materialsproject.org (accessed on 10 April 2024).
- Leineweber, A. The Cu–Sn System: A Comprehensive Review of the Crystal Structures of its Stable and Metastable Phases. J. Phase Equilibria Diffus. 2023, 44, 343–393. [Google Scholar] [CrossRef]
- Xie, H.; Zhao, N.; Shi, C.; He, C.; Liu, E. Effects of active elements on adhesion of the Al2O3/Fe interface: A first principles calculation. Comput. Mater. Sci. 2021, 188, 110226. [Google Scholar] [CrossRef]


| a (at. %) | 0 | 10 | 20 | 30 | 40 | 50 | 79 | 99 |
|---|---|---|---|---|---|---|---|---|
| θe (°) | 43 43 [33] | 14 | 12 | 13 | 24 | 31 | 39 | 31 |
| σlv (J/m2) [29] | 1.3 | 1.0 | 0.86 | 0.76 | 0.69 | 0.64 | 0.54 | 0.49 |
| σsl (J/m2) | 3.05 | 3.02 | 3.16 | 3.26 | 3.36 | 3.46 | 3.59 | 3.58 |
| (J/m2) | 2.25 2.16 [33] | 1.98 | 1.70 | 1.50 | 1.33 | 1.18 | 0.95 | 0.91 |
| a (at. %) | 0 | 1.79 | 3.57 | 5.36 | 7.14 | 23.10 | 25 | 45.45 | 100 |
|---|---|---|---|---|---|---|---|---|---|
| σmetal (J/m2) | 1.32 | 1.22 | 1.24 | 1.16 | 1.13 | 0.87 | 0.85 | 0.76 | 0.43 |
| γint (J/m2) | 2.31 | 2.30 | 2.86 | 3.06 | 3.20 | 3.58 | 3.93 | 3.79 | 1.83 |
| Wad (J/m2) | 3.05 | 2.91 | 2.76 | 2.67 | 2.68 | 1.28 | 1.09 | 0.96 | 2.6 |
Disclaimer/Publisher’s Note: The statements, opinions and data contained in all publications are solely those of the individual author(s) and contributor(s) and not of MDPI and/or the editor(s). MDPI and/or the editor(s) disclaim responsibility for any injury to people or property resulting from any ideas, methods, instructions or products referred to in the content. |
© 2025 by the authors. Licensee MDPI, Basel, Switzerland. This article is an open access article distributed under the terms and conditions of the Creative Commons Attribution (CC BY) license (https://creativecommons.org/licenses/by/4.0/).
Share and Cite
Ci, W.; Lin, Q.; Lu, X.; Shi, Y.; Yang, L.; Wang, W. Effect of Sn Content on Wettability and Interfacial Structure of Cu–Sn–Cr/Graphite Systems: Experimental and First-Principles Investigations. Materials 2025, 18, 1793. https://doi.org/10.3390/ma18081793
Ci W, Lin Q, Lu X, Shi Y, Yang L, Wang W. Effect of Sn Content on Wettability and Interfacial Structure of Cu–Sn–Cr/Graphite Systems: Experimental and First-Principles Investigations. Materials. 2025; 18(8):1793. https://doi.org/10.3390/ma18081793
Chicago/Turabian StyleCi, Wenjuan, Qiaoli Lin, Xuefeng Lu, Yu Shi, Likai Yang, and Wenkai Wang. 2025. "Effect of Sn Content on Wettability and Interfacial Structure of Cu–Sn–Cr/Graphite Systems: Experimental and First-Principles Investigations" Materials 18, no. 8: 1793. https://doi.org/10.3390/ma18081793
APA StyleCi, W., Lin, Q., Lu, X., Shi, Y., Yang, L., & Wang, W. (2025). Effect of Sn Content on Wettability and Interfacial Structure of Cu–Sn–Cr/Graphite Systems: Experimental and First-Principles Investigations. Materials, 18(8), 1793. https://doi.org/10.3390/ma18081793